Article

Preparation of EDTA-2Na-Fe3O4-Activated Carbon Composite and Its Adsorption Performance for Typical Heavy Metals

1
Yazhou Bay Innovation Institute, Hainan Tropical Ocean University, Sanya 572025, China
2
College of Ecology and Environment, Hainan Tropical Ocean University, Sanya 572022, China
3
College of Science, Hainan Tropical Ocean University, Sanya 572022, China
4
Hainan Key Laboratory for Coastal Marine Eco-Environment and Carbon Sink, Sanya 572022, China
5
Modern Marine Ranching Engineering Research Center of Hainan, Sanya 572022, China
*
Authors to whom correspondence should be addressed.
These authors contributed equally to this work.
Separations 2025, 12(8), 205; https://doi.org/10.3390/separations12080205
Submission received: 30 May 2025 / Revised: 18 July 2025 / Accepted: 1 August 2025 / Published: 6 August 2025

Abstract

This study developed a new magnetic adsorbent from waste coconut shells using high-temperature carbonization, EDTA-2Na chelation, and Fe3O4 magnetic loading. Response surface methodology optimized the preparation conditions to a mass ratio of activated carbon: EDTA-2Na:Fe3O4 = 2:0.6:0.2. Characterization (SEM, XRD, FT-IR, and EDS) showed that EDTA-2Na increased the surface carboxyl and amino group density, while Fe3O4 loading (Fe concentration 6.83%) provided superior magnetic separation performance. The optimal adsorption conditions of Cu2+ by EDTA-2Na-Fe3O4-activated carbon composite material are as follows: when pH = 5.0 and the initial concentration is 180 mg/L, the equilibrium adsorption capacity reaches 174.96 mg/g, and the removal rate reaches 97.2%. The optimal adsorption conditions for Pb2+ are as follows: when pH = 6.0 and the initial concentration is 160 mg/L, the equilibrium adsorption capacity reaches 157.60 mg/g, and the removal rate reaches 98.5%. The optimal adsorption conditions for Cd2+ are pH = 8.0 and an initial concentration of 20 mg/L. The equilibrium adsorption capacity reaches 18.76 mg/g, and the removal rate reaches 93.8%. The adsorption followed the pseudo-second-order kinetics (R2 > 0.95) and Langmuir/Freundlich isotherm models, indicating chemisorption dominance. Desorption experiments using 0.1 mol/L HCl and EDTA-2Na achieved efficient desorption (>85%), and the material retained over 80% of its adsorption capacity after five cycles. This cost-effective and sustainable adsorbent offers a promising solution for heavy metal wastewater treatment.

Graphical Abstract

1. Introduction

With the acceleration of the industrialization process, the problem of heavy metal pollution in water bodies has become increasingly severe. Among them, copper (Cu2+), lead (Pb2+), and cadmium (Cd2+) have been listed as priority pollutants for control due to their high toxicity, bio-accumulation, and difficulty in degradation. Industrial wastewater, mining, and agricultural activities lead to their large-scale release, posing a serious threat to the ecosystem and human health [1]. Traditional treatment methods such as chemical precipitation, membrane separation, and ion exchange have problems such as a high risk of secondary pollution, a high cost, and limited applicability [2]. Adsorption methods have become a current research hotspot due to their advantages such as simple operation, low cost, and wide availability of materials [3]. However, traditional activated carbon has defects such as poor adsorption selectivity and difficult recovery. Coconut shell activated carbon, as a representative of biochar, features a high specific surface area, porous structure, and chemical stability [4]. However, the chemical inertness of its original surface limits its adsorption performance. In recent years, the synergistic modification strategy of magnetic nanomaterials and chelating agents has attracted much attention: Fe3O4 endows materials with magnetic separation properties and enables rapid recovery [5]; EDTA-2NA enhances the chelating ability of heavy metals through hexagonal coordination. However, the combination of EDTA-2Na and Fe3O4 on biomass-derived activated carbon remains rarely explored. Through the collaborative design of high-temperature carbonization, EDTA-2Na chelating modification, and Fe3O4 magnetic loading, a new type of EDTA-2Na-Fe3O4-activated carbon composite material was prepared, aiming to break through the performance bottleneck of traditional activated carbon, clarify the synergistic adsorption mechanism of chemical coordination and physical diffusion, and develop functionalized materials with efficient adsorption, magnetic separation, and cycling stability. This work establishes a scalable, eco-adaptive paradigm for heavy metal removal—transforming agricultural residues into high-value functional materials aligned with zero-waste water treatment goals.

2. Materials and Methods

2.1. Materials

Coconut shell activated carbon is made from discarded coconut shells and purchased from local suppliers in Hainan. The reagents used in the experiment, including raw materials, modifiers, standard solutions for analysis, etc., were all purchased from professional chemical suppliers.
Standard solutions of copper (Cu(NO3)2), lead (Pb(NO3)2), and cadmium (Cd(NO3)2) elements, used for quantitative analysis and research on the adsorption performance of carbon materials, were purchased from the General Research Institute for Nonferrous Metals in Beijing. Sodium hydroxide (NaOH) and hydrochloric acid (HCl) were used for pH adjustment in the experiments. Methanol (CH3OH), used as a desorption agent for desorption experiments, was purchased from Sinopharm Chemical Reagent Co., Ltd., Shanghai, China, Ethylenediamine tetraacetic acid disodium salt (C10H14N2Na2O8) and ferrous sulfate (FeSO4·7H2O), purchased from Sinopharm Chemical Reagent Co., Ltd., were used to modify carbon materials. Citric acid (C6H8O7) was purchased from Tianjin Comio Chemical Reagent Co., Ltd., Tianjin, China, Dopamine hydrochloride (C8H11NO2·HCl), tartaric acid (C4H6O6), and triethanolamine (C6H15NO3) were purchased from Shanghai Aladdin Biochemical Technology Co., Ltd., Shanghai, China.

2.2. Preparation of Activated Carbon Composite Materials

The preparation process of the activated carbon composite material involves four main steps: raw material pretreatment and carbonization, the preparation of chelating agent-modified activated carbon composites, the selection of chelating agents, and synthesis of C-Fe3O4-activated carbon composites.
Coconut shells were selected as raw materials. Surface impurities were removed via deionized water-assisted ultrasonic cleaning (frequency: 40 kHz; power: 100 W; duration: 30 min, three cycles). After drying, the shells were crushed and sieved to obtain particles with a size of 60–100 mesh. An amount of 20.0 g of pretreated raw material was placed in a crucible and carbonized in a muffle furnace by heating to 800 °C at a rate of 5 °C/min, and this temperature was maintained for 60 min. The resulting carbonized product was cooled, washed to neutrality (pH ≈ 7), and dried at 105 °C for 2 h to yield black carbonized material.
The activated carbon was mixed with chelating agent solutions at mass ratios of 1:1, 1:2, 1:3, 1:4, and 1:5. The mixtures were subjected to constant-temperature magnetic stirring for 4–6 h, washed to neutrality, and dried to obtain C-activated carbon composites (C denotes the chelating agent).
Five chelating agents—ethylenediamine tetraacetic acid disodium salt (EDTA-2Na), citric acid (CA), dopamine hydrochloride (DA), tartaric acid (TA), and triethanolamine (TEA)—were loaded onto the activated carbon surface via an impregnation method. After pH adjustment, the mixtures were oscillated, washed, and dried for subsequent use.
A total of 10.0 g of X-activated carbon composite (X denotes the selected chelating agent) was ultrasonically dispersed in 200 mL of ultrapure water. Subsequently, 27.81 mL of 0.1 mol/L FeSO4 solution was added dropwise, followed by 0.1 mol/L NaOH to adjust the pH to ≈ 10. The reaction proceeded for 1 h to generate Fe3O4 nanoparticles, which were loaded onto the activated carbon surface. The product was magnetically separated, washed to neutrality, and dried at 105 °C for 2 h to obtain the final C-Fe3O4-activated carbon composite.

2.3. Optimization of Experimental Design by Response Surface Method

The Design-Expert response surface experimental design software was adopted to conduct response surface analysis experiments at three factors and three levels [6]. Taking activated carbon (A), chelating agent (B), and iron (III) oxide (C) as variables, the removal effect on copper, a heavy metal, was optimized.
The adsorption performance of the modified materials for Cu2+, Pb2+, and Cd2+ was evaluated through adsorption experiments. The equilibrium adsorption capacity (Qe) was calculated using Equation (1) to identify the optimal chelating agent [7]:
Q e = C 0 C e V m
Qe represents the equilibrium adsorption capacity (mg/g); C0 and Ce represent the residual and initial concentrations of heavy metal ions in the solution (mg/L), respectively; V represents the initial solution volume (L); and m represents the mass of activated carbon adsorbent (g).
The pre-experiment concluded that the optimal value range of A was 1–3 (g), that of B was 0.4–0.8 (g), and that of C was 0.1–0.3 (g). According to the experimental design plan generated by the software, the corresponding masses of chelating agent and ferric oxide were accurately weighed, and they were mixed with activated carbon. The uniform dispersion of each component was ensured through ultrasonic treatment, and then the mixture was used for the adsorption experiment of the copper solution. The experimental design aims to optimize the variable ratio through the system and determine the optimal combination conditions to achieve the goal of efficient copper removal. The experimental design factors and levels are shown in Table 1.

2.4. Characterization of Activated Carbon Composites

We used field emission scanning electron microscopy (SEM; JSM-7610F PLUS, JEOL, Tokyo, Japan) operating at an accelerating voltage of 10 kV to obtain high-resolution images. Before analysis, gold plating treatment should be carried out to reduce the influence of charge accumulation on the analysis results and improve surface conductivity [8]. The gold plating thickness was 5–10 nm, the magnification was ×3000, the working distance was 8–10 mm, and the scanning speed was medium. We used energy dispersive X-ray spectroscopy (EDS; N/A, Oxford Instruments, Abingdon, UK) integrated with SEM and operated at an acceleration voltage of 10 kV–20 kV to ensure the excitation of characteristic X-rays while increasing the beam current to enhance the signal strength and controlling the acquisition time to balance data accuracy and analysis efficiency. Fourier Transform Infrared Spectroscopy (FT-IR ALPHA, Thermo Fisher Scientific, Waltham, MA, USA) was used to analyze the surface chemical functional groups of the raw carbon and the modified composite materials. The samples were dried at 105 °C for 2 h, and the chemical functional groups were analyzed and identified within the wavenumber range of 400–4000 cm−1 using the KBr pellet method. We used an X-ray diffractometer (XRD; D/max2500v/pc, Shimadzu Corporation, Kyoto, Japan) under the conditions of a tube voltage of 40 kV, a tube current of 150 mA, an angle range of 10–50°, a scanning speed of 2°/min, and a scanning step size of 0.05° to analyze the crystal structure, phase composition, and content of the raw carbon and the modified composite materials.

2.5. Single-Factor Adsorption Experiment

At 25 °C, a certain amount of standard solutions of copper, lead, and cadmium (1000 mg/L) was, respectively, placed into 100 mL volumetric flasks, and the volumes were made up with deionized water to obtain the standard solutions of copper, lead, and cadmium. Batch adsorption experiments were conducted. All samples were oscillated and reacted at a rotational speed of 200 rpm in a constant temperature shaker for 12 h to ensure that the adsorption process reached dynamic equilibrium. After the reaction was completed, the sample was centrifuged and separated at a speed of 3000 rpm for 10 min. The supernatant was taken, and the remaining concentrations of Cu2+, Pb2+, and Cd2+ were determined by atomic absorption spectrometry. By calculating the adsorption capacity and removal rate, we evaluated the influence of the dosage of adsorbent (1–5 g/L), adsorption time (0–240 min), pH value (3–9), initial concentrations of Cu2+ and Pb2+ (100–200 mg/L), and Cd2+ (5–30 mg/L) on the adsorption performance of EDTA-2Na-Fe3O4-activated carbon composites.

2.6. Regeneration Experiment

The adsorption-saturated EDTA-2Na-Fe3O4-activated carbon composite material (adsorbing Cu2+, Pb2+, and Cd2+) was mixed with different desorption reagents (0.1 mol/L HCl, 0.1 mol/L EDTA-2Na, methanol, and deionized water) at a solid–liquid ratio of 1:50. We placed it in a constant temperature shaker for oscillation. After the process was completed, the solid and liquid phases were separated. After centrifugal separation, the concentration of heavy metals in the desorption liquid was determined, the desorption efficiency was calculated, and the optimal desorption agent was screened. The material was dynamically eluted by the desorption agent. After desorption, the material was washed with an desorption agent—deionized water—selected from the above experiment until it became neutral, dried at 105 °C for 2 h, and used for the next round of the adsorption experiment. We repeated the above adsorption–desorption steps five times and recorded the adsorption capacity and desorption efficiency of each cycle.

2.7. Research on Adsorption Mechanism

2.7.1. Research on Adsorption Kinetics

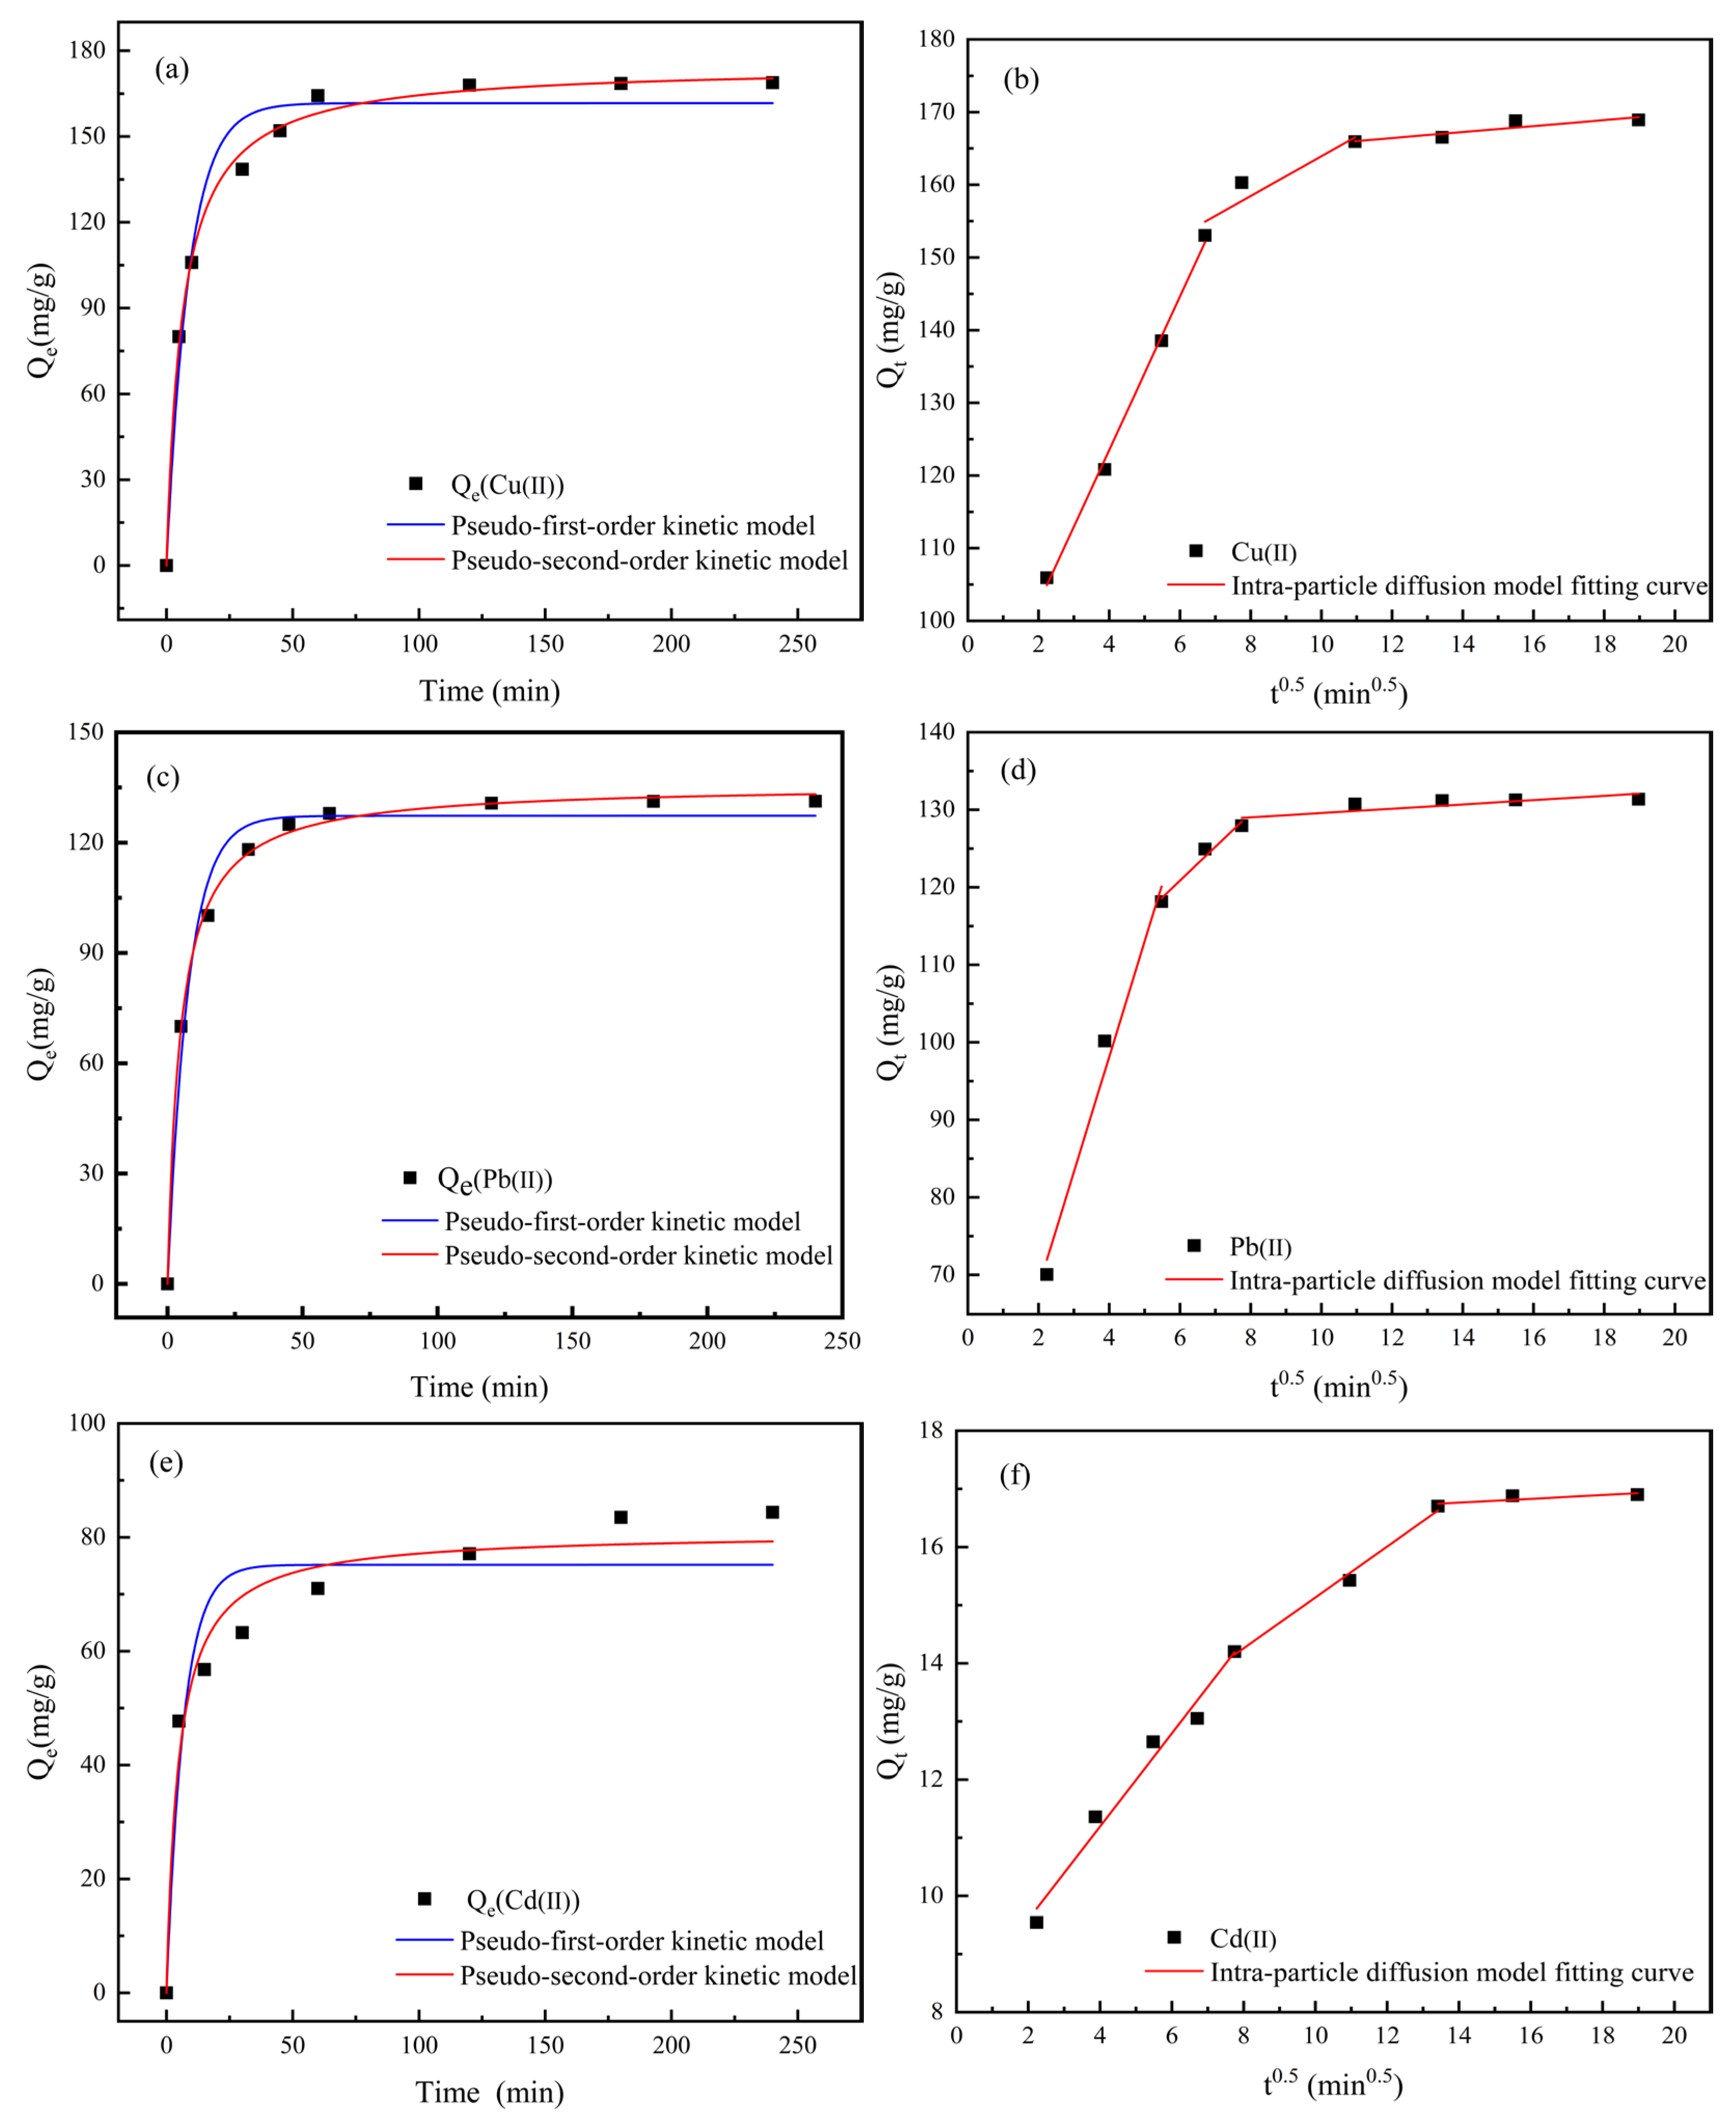
Under the constant temperature condition of 25 °C, 10 g of EDTA-2Na-Fe3O4-activated carbon composite material was added to 2 L of Cu2+, Pb2+, and Cd2+ solutions with initial concentrations of 180 mg/L, 160 mg/L, and 20 mg/L, respectively. We adjusted the initial pH value of the solution, and the oscillate reaction was carried out using a shaker at 200 rad/min. Samples were taken at reaction times of 5 min, 15 min, 30 min, 45 min, 60 min, 120 min, 180 min, and 240 min. After centrifugal separation, the concentration of heavy metal ions in the supernatant was determined, and the adsorption capacity was calculated. To clarify the kinetic mechanism of the adsorption process, the following two commonly used kinetic models were adopted to fit and analyze the experimental data:
1.
Pseudo-First-Order Model
The pseudo-first-order kinetic model assumes that the adsorption rate is determined by the number of active sites on the surface of the adsorbent, and its formula is as follows [9]:
Q t = Q e 1 e k t
Qe and Qt represent the equilibrium adsorption capacity and the adsorption capacity at time t (mg/g), respectively; k represents the pseudo-first-order kinetic rate constant (min−1); and t represents the reaction time (min).
2.
Pseudo-Second-Order Model
The pseudo-second-order kinetic model assumes that the adsorption rate is determined by the chemical interaction between the surface active sites of the adsorbent and the adsorbate, and its formula is
Q t = Q e 2 k 2 t 1 + Q e k 2 t
Qe and Qt represent the equilibrium adsorption capacity and the adsorption capacity at time t (mg/g), respectively; k2 represents the pseudo-second-order kinetic rate constant (g/(mg·min)); and t represents the reaction time (min).
3.
Intraparticle Diffusion Model
The intraparticle diffusion model is a key kinetic model that describes the diffusion of adsorbate from the solution to the internal pores of the adsorbent during the adsorption process. Its formula is as follows [10]:
Q t = k p t 0.5 + C
Qt represents the adsorption capacity (mg/g) at time t; kp represents the intraparticle diffusion coefficient mg/(g·min0.5); and t represents the reaction time (min).

2.7.2. Research on Adsorption Isotherms

Under the constant temperature condition of 25 °C, Cu2+ and Pb2+ solutions with different initial concentrations of 100, 120, 140, 160, 180, and 200 mg/L, as well as Cd2+ solutions with concentrations of 5, 10, 15, 20, 25, and 30 mg/L, were prepared. The pH was adjusted to the optimal adsorption conditions (based on single-factor optimization conditions). We added 10 g of modified carbon material to the solutions of each concentration, placed them in a constant-temperature shaker at 200 rad/min, and carried out oscillation and reaction for 240 min. After the reaction was completed, centrifugation was performed to separate the solid and liquid phases, and the supernatant was taken. The residual concentration of heavy metals in the supernatant was determined by atomic absorption spectrometry.
To explore the equilibrium adsorption capacity of EDTA-2Na-Fe3O4-activated carbon composites for other heavy metals, we clarified the single-layer or multi-layer characteristics of the adsorption process and processed the isothermal adsorption kinetics experimental data using the Langmuir and Freundlich isotherm models.
4.
Langmuir isothermal adsorption model:
Q e = K L Q m C e 1 + b C e
Qe and Qm represent the equilibrium adsorption capacity and the maximum adsorption capacity (mg/g), respectively; Ce represents the concentration at equilibrium (mg/L); and KL is the Langmuir constant.
5.
Freundlich isothermal adsorption model:
Q e = K F C e 1 n
Qe represents the equilibrium adsorption capacity (mg/g); Ce represents the concentration at equilibrium (mg/L); and KF is the Freundlich constant.

3. Results and Discussion

3.1. Selection of Chelating Agents and Fe3O4 Range

By systematically investigating the effects of different types of chelating agents and the loading of Fe3O4 on the removal performance of Cu2+, Pb2+, and Cd2+, the chelating agent and the loading of Fe3O4 with the best adsorption effect were screened out.
It can be seen from Figure 1 that in (a), EDTA-2Na and TEA with a content of 0.2 g/g have a better adsorption effect on Cu2+, and in subfigure (b), EDTA-2Na and TEA with a content of 0.2 g/g have a better adsorption effect on Pb2+. Subfigure (c) shows that EDTA-2Na and TEA with contents of 0.4 g/g and 0.8 g/g have better adsorption effects on Cd2+. EDTA-2Na’s dominance stems from its hexadentate coordination structure, enabling robust chelation with multiple metal ions through high-stability constants (logβ: Cu2+ = 18.8, Pb2+ = 18.3, and Cd2+ = 16.5). In contrast, other agents exhibit limited coordination capacity: CA (tridentate ligands with weak complexation ability), DA (catechol has dentate coordination and is prone to oxidation and inactivation), TA (α-hydroxy acid has a bidentate coordination and weak complexation ability), and TEA (single-dentate ligands with low affinity) form weaker complexes. After comparison, EDTA-2Na was finally selected to modify the carbon material.
As shown in Figure 1, in order to increase the efficiency of recycling and utilization of modified materials and enhance the adsorption capacity, Fe3O4 was selected to modify carbon materials [11]. It can be seen from subfigure (d) that the content range of Fe3O4 with a better removal effect on Cu2+ is 0.1–0.3 g/g, the content range of Fe3O4 with a better removal effect on Pb2+ is 0.1-0.3 g/g, and the content range of Fe3O4 with a better removal effect on Cd2+ is 0.2–0.5 g/g. Finally, carbon materials with an Fe3O4 content of 0.1–0.3 g/g were selected for response surface analysis, and subsequent experiments were carried out.

3.2. An Analysis of the Experimental Results of Response Surface Optimization

The experiment was designed through the response surface method (RSM), and the experimental data were fitted using the experimental design software. The quadratic regression equation obtained is
Y = 2.940.031A0.066B + 0.07C0.055AB + 0.012AC + 0.037BC0.51A20.17B20.49C2
The reliability of the regression model determines its prediction accuracy. It is verified through analysis of variance and provides a scientific basis for experimental optimization [12].
As shown in Table 2, the F-value of 233.64 implies that the model is significant. In the current model, items such as A, B, C, AB, AC, and BC have all reached the significance level, indicating that the contributions of these items to the model are statistically significant. Furthermore, the F-value of the misfitting test was 1.4917, and the corresponding p-value was 0.3447, indicating that misfitting was not significant compared to the pure error.
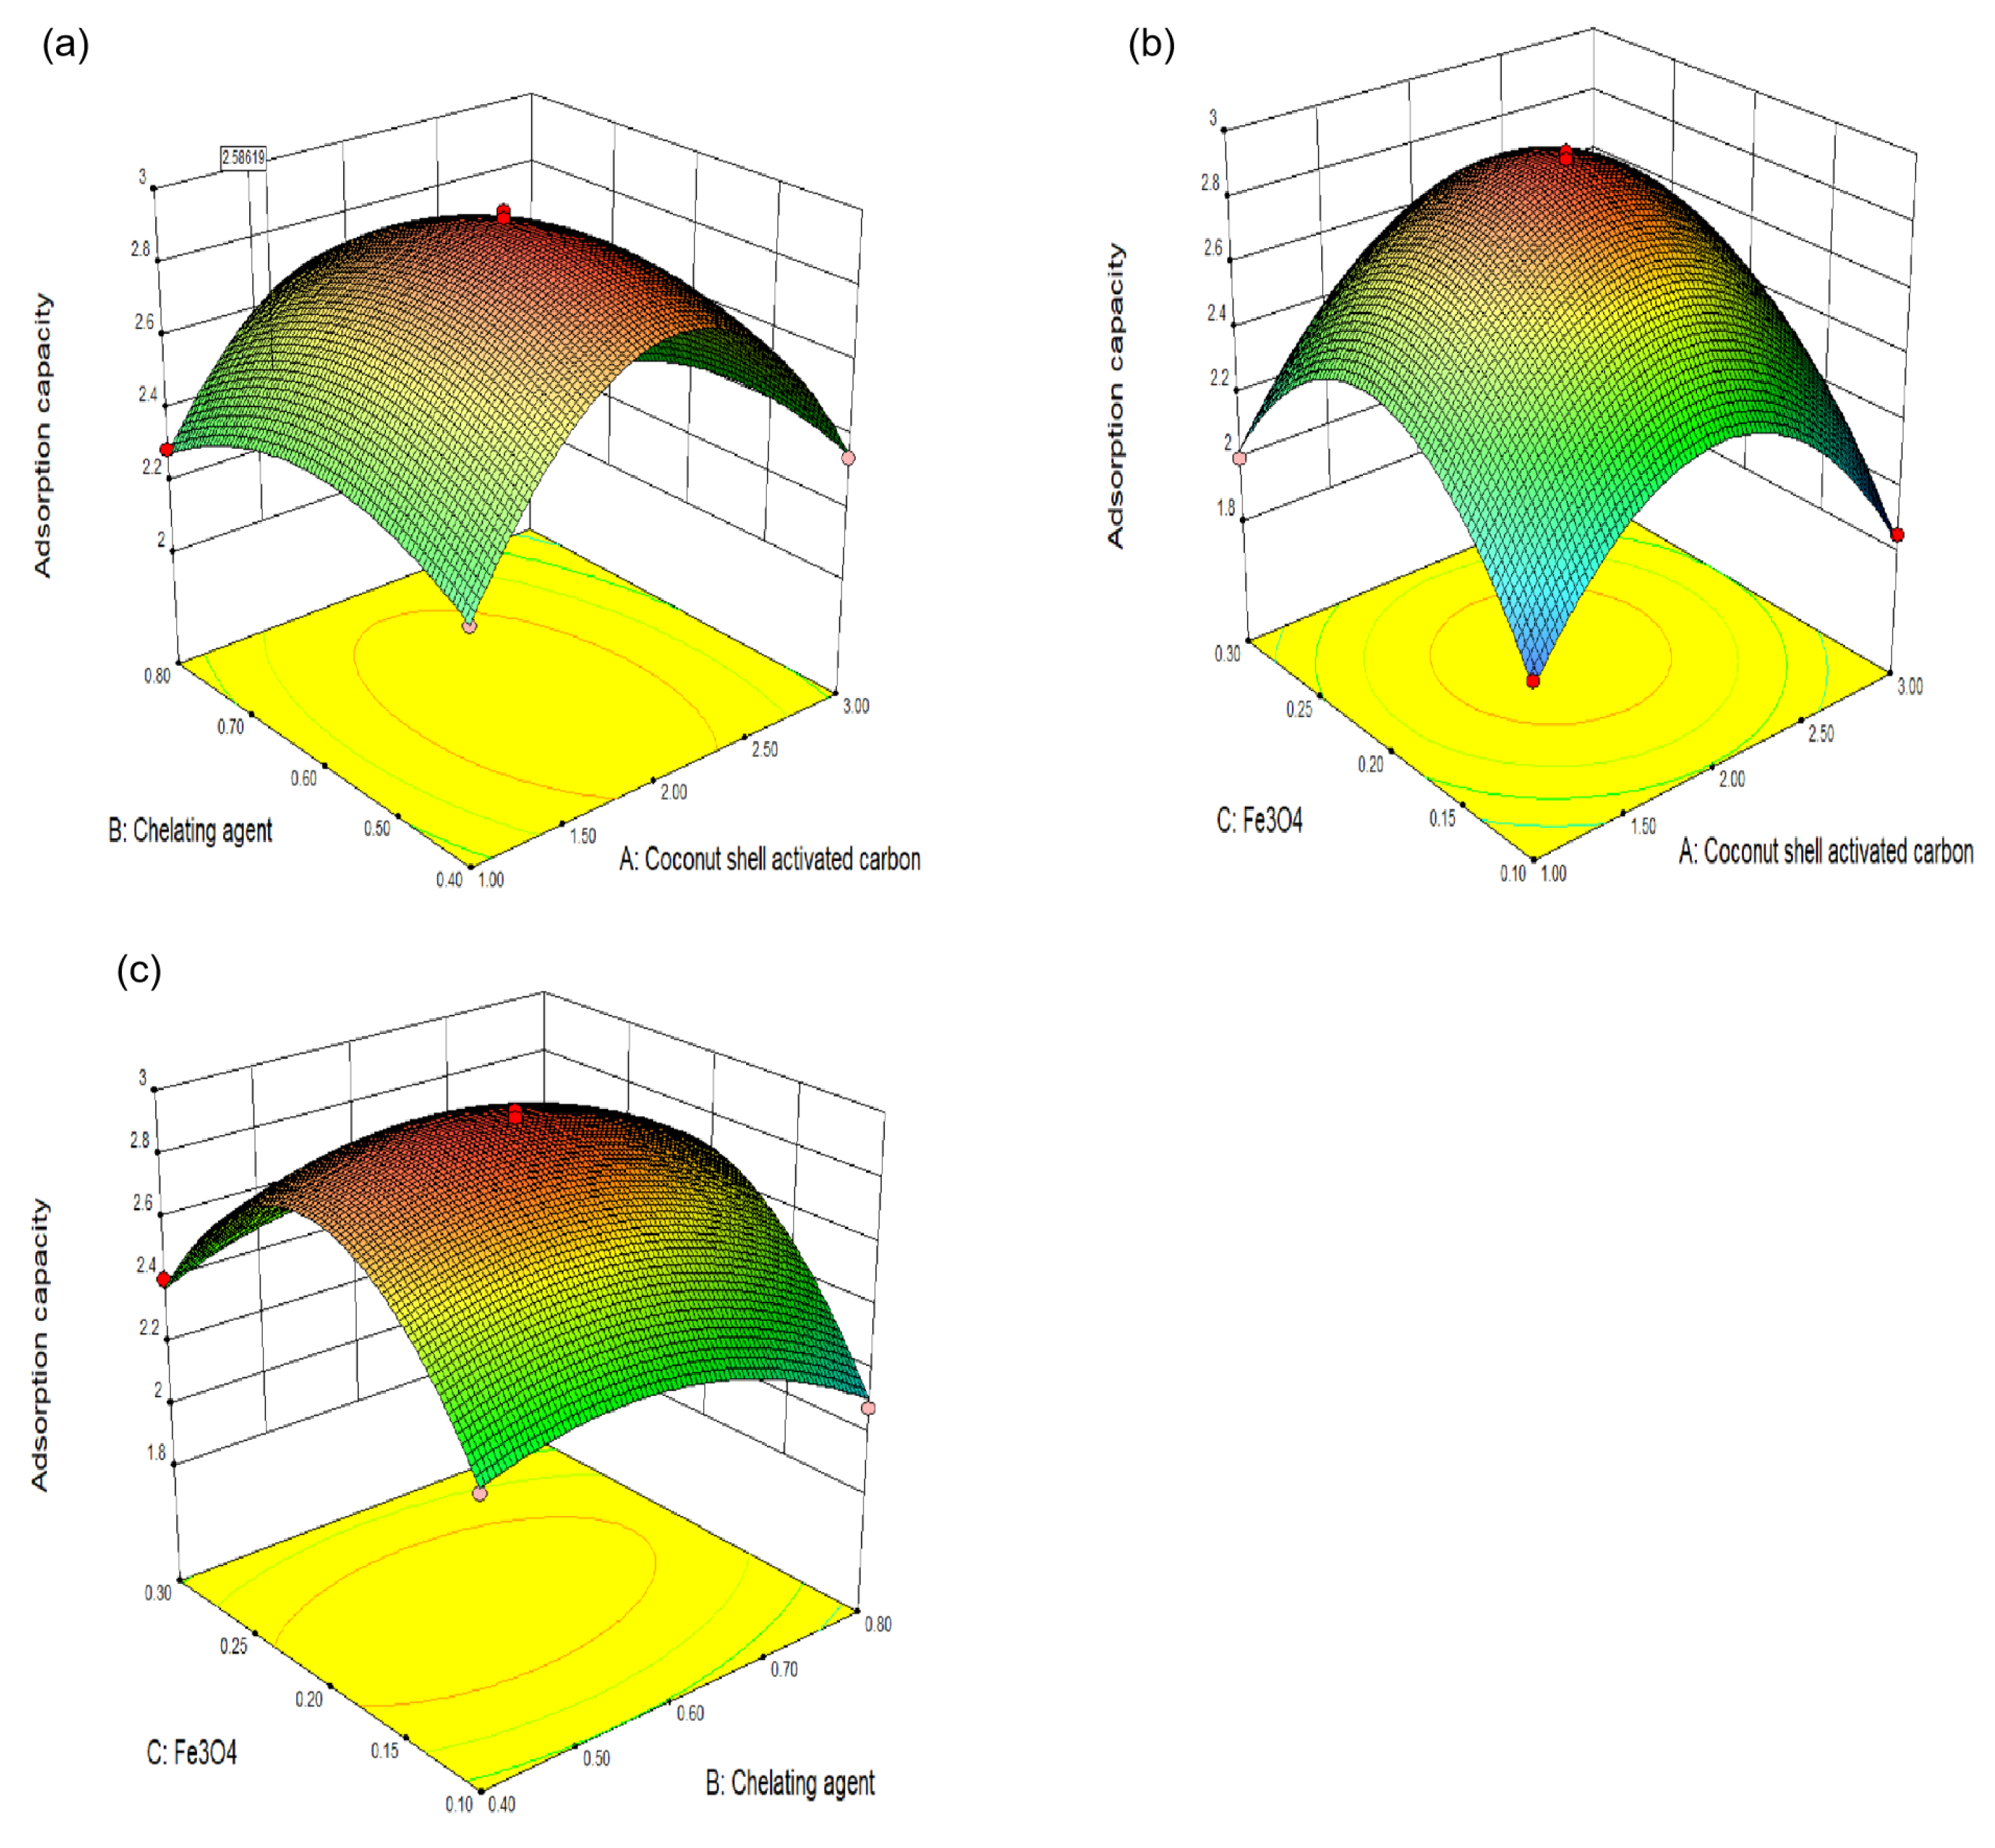
As shown in Figure 2 and Table 3, the closer the sum of squares of the residuals is to 0, the more it indicates that the model can fit the experimental data well and accurately predict the changes in the response values. In this study, the sum of squares of the predicted residuals of the model was calculated to be 0.055, indicating that the prediction error of the model is small and that it has a high prediction accuracy. The prediction coefficient R2 = 0.9783 has a high degree of consistency with the correction coefficient R2 = 0.9929. This indicates that there is a good match between the predictive ability of the model and the goodness of fit, further verifying the reliability of the model. Under normal circumstances, a signal-to-noise ratio (SNR) > 4 is considered acceptable; the current model has a signal-to-noise ratio as high as 44.978, which is much higher than this threshold. This indicates that the model can effectively distinguish signals from noise and has high prediction accuracy and stability.
The analysis was conducted using Design-Expert software. It was speculated that the optimal ratio for removing the three heavy metals was A:B:C = 1.98:0.56:0.21. To facilitate subsequent experiments, the ratio was adjusted to A:B:C = 2:0.6:0.2.

3.3. Material Characterization

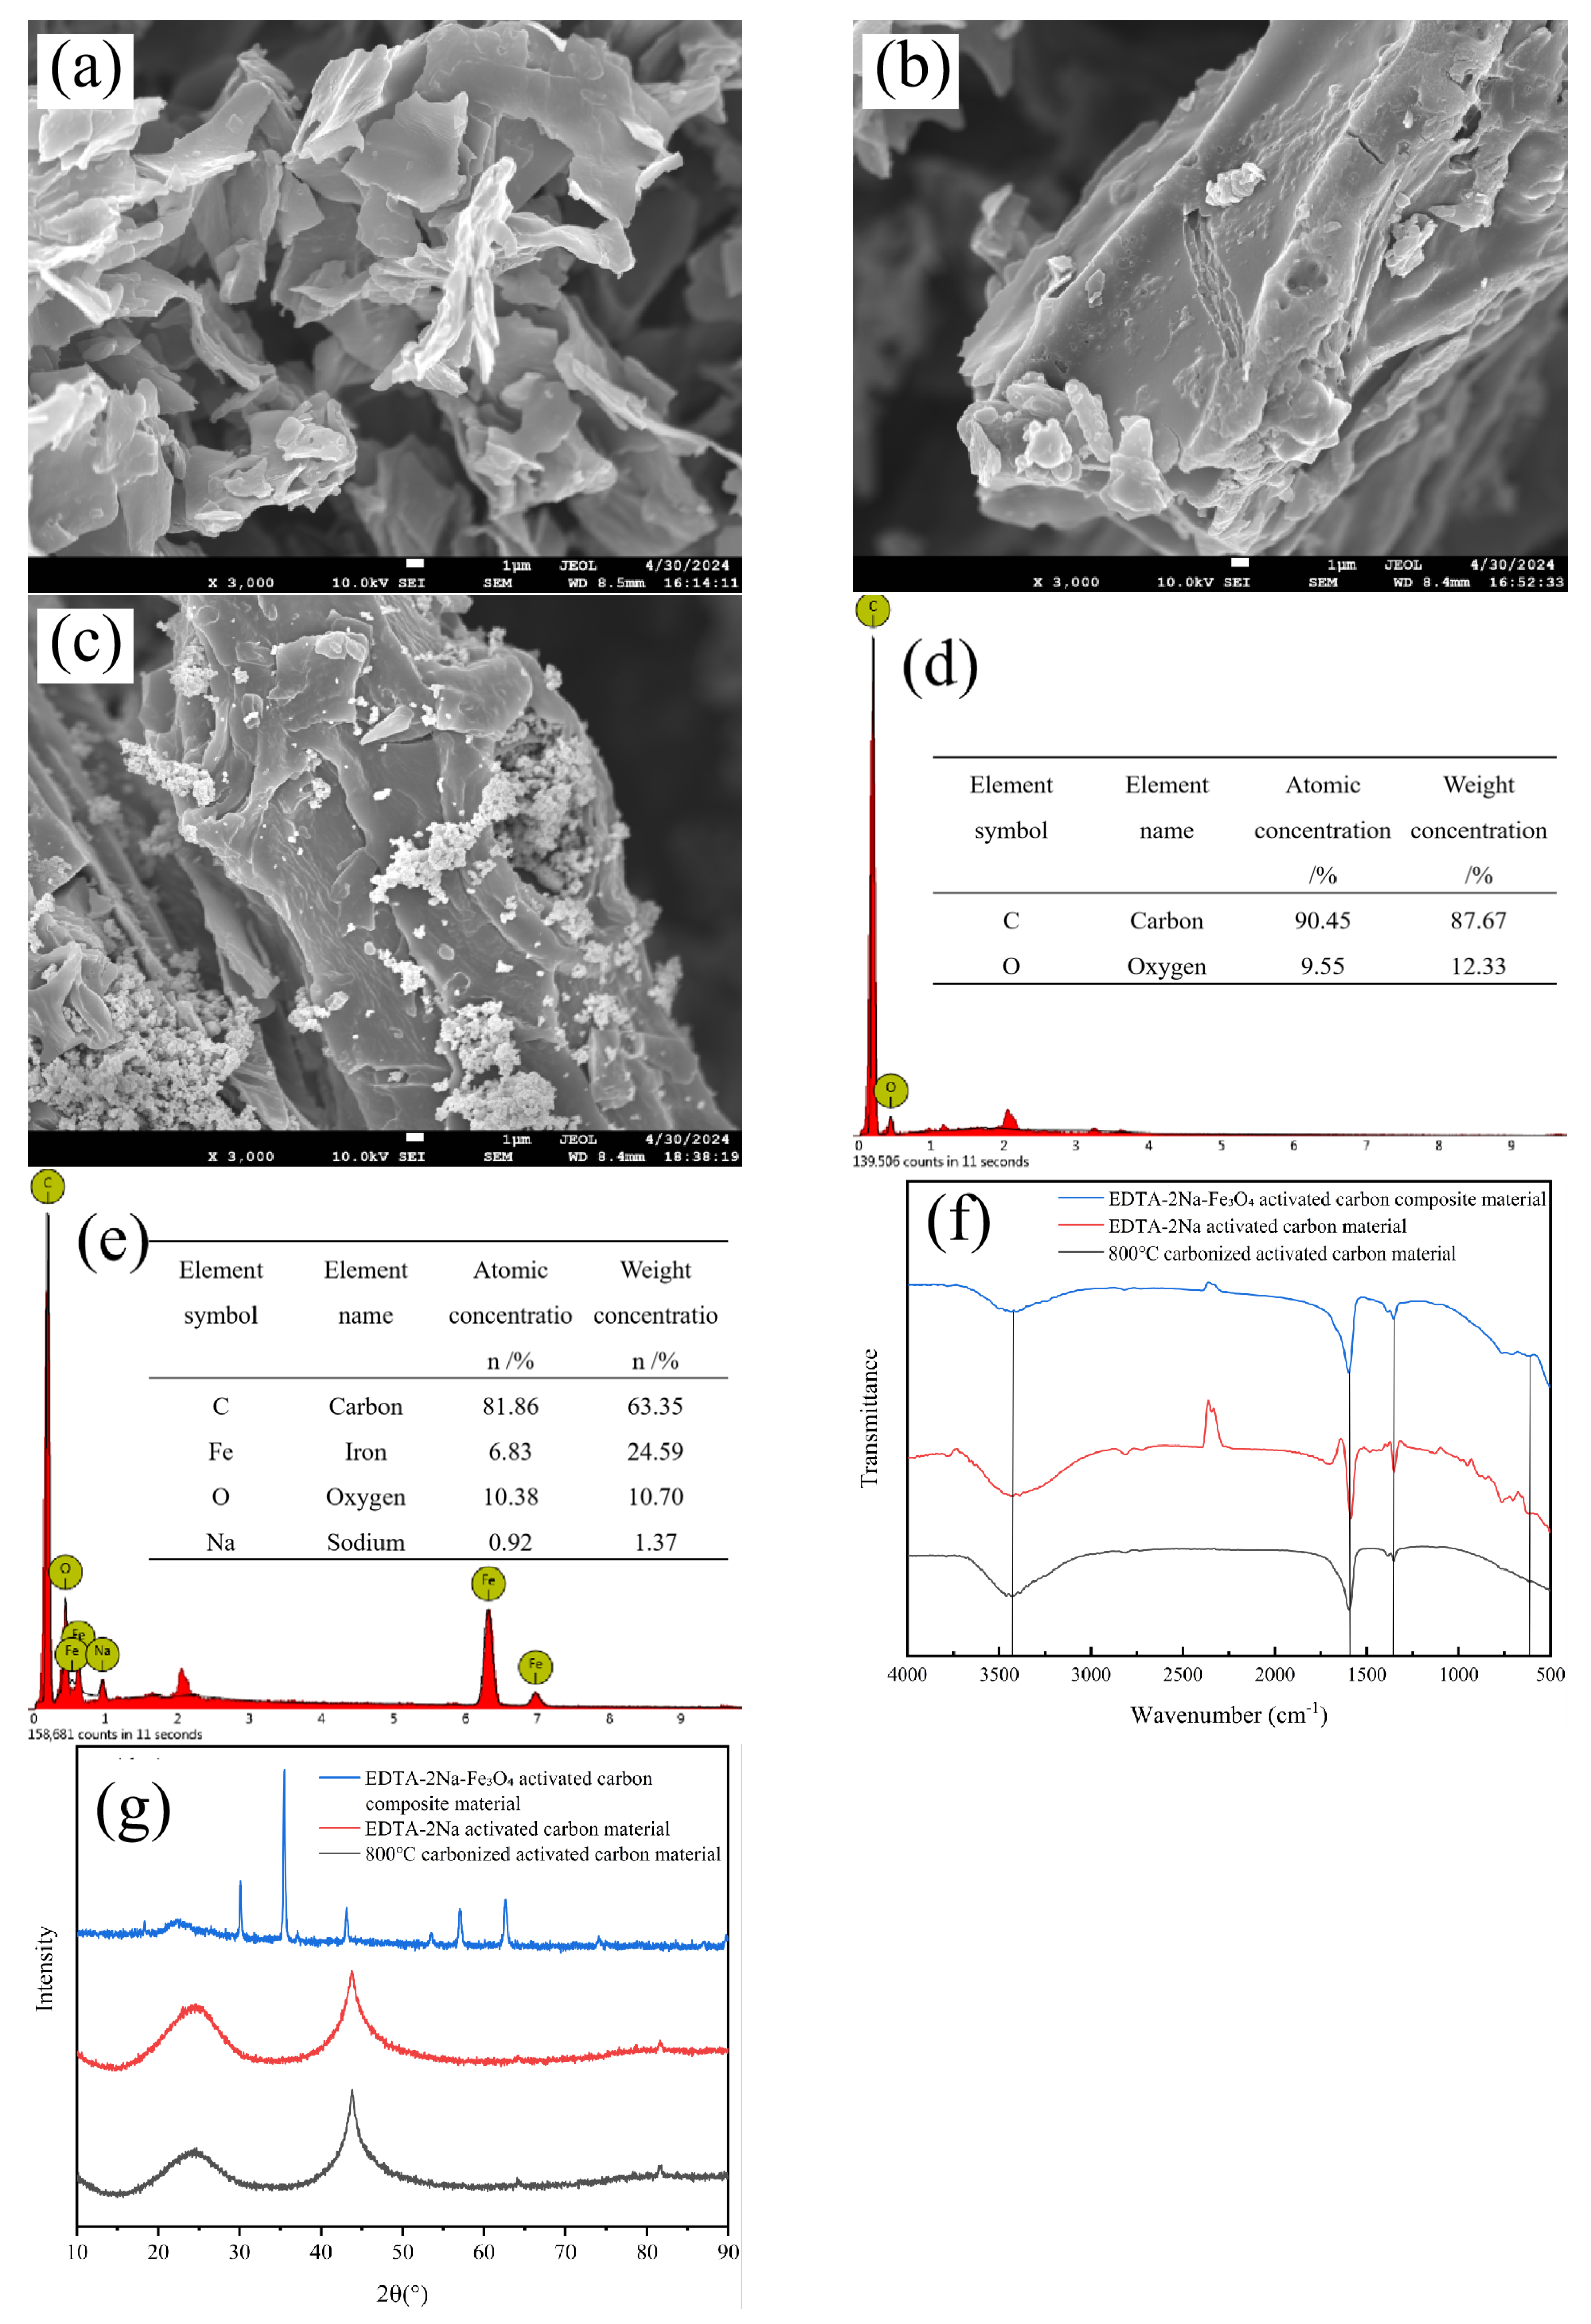
It can be observed from Figure 3a that a certain number of pores and tiny concave–convex structures are distributed on the material surface. This is because the material underwent high-temperature pyrolysis at 800 °C during the preparation process, resulting in partial surface cracking and the formation of gully structures. Compared with subfigure (a), the pores in subfigure (b) are more developed, and the surface presents more irregular gully structures. This morphology is observed due to the fact that after the material is modified by EDTA-2Na, the surface is further damaged, forming more depressions and pores [13]. Compared with subfigures (a) and (b), the pore distribution in subfigure (c) is more uniform and the pore size is smaller, indicating that the surface structure of the material was optimized after further chemical treatment or loading with ferric oxide nanomaterials. This uniform pore structure provides the material with more adsorption sites, which helps to improve its adsorption performance. Comparing subfigure (d) and subfigure (e), after the original coconut shell activated carbon was carbonized at 800 °C, carbon (C) and oxygen (O) were the main elements, with atomic concentrations of 90.45% and 9.55%, respectively, and the weight concentration proportions were 87.67% and 12.33%. After modification by EDTA-2Na and Fe3O4, the atomic concentration of C significantly decreased to 81.86%, and the weight concentration dropped to 63.35%, while the atomic concentration of Fe reached 6.83%, and the weight concentration increased to 24.59%. Meanwhile, the atomic concentration of Na element was detected to be 0.92%. This indicates that Fe3O4 nanoparticles were successfully loaded onto the surface of the activated carbon, and the introduction of EDTA-2Na caused residue of Na element. In subfigure (f), the three samples all have obvious absorption peaks at 3430 cm−1 and 1349 cm−1, which can be attributed to the stretching vibration of hydroxyl groups in carboxyl groups, phenols, and alcohols. The peak at 1696 cm−1 underwent a slight shift and an increase in intensity. This is because the amide HN-C=O that appears overlaps with the original C=O bond, indicating that the amidation reaction between the protocarbon and the carboxyl group (-COOH) of EDTA-2Na was successful and the introduction of EDTA-2Na was successful. The vibration peak of Fe-O appeared at 601 cm−1 in the EDTA-2Na-Fe3O4-modified carbon material, indicating that Fe3O4 particles were loaded onto the surface of activated carbon. In subfigure (g), the characteristic diffraction peaks of coconut shell activated carbon molecules are at positions of 24.8° and 43.8° with 2θ, while the characteristic diffraction peaks of Fe3O4 crystals are at positions of 30.2°, 35.6°, 43.2°, 53.5°, 57°, and 62.9° with 2θ. The diffraction patterns of the EDTA-2Na-Fe3O4-modified carbon material were compared with those of the carbonized activated carbon. The modified activated carbon simultaneously showed characteristic diffraction peaks of Fe3O4 and the carbonized activated carbon, indicating that Fe3O4 was successfully loaded onto the surface of the activated carbon.

3.4. Single-Factor Adsorption Experimental Analysis

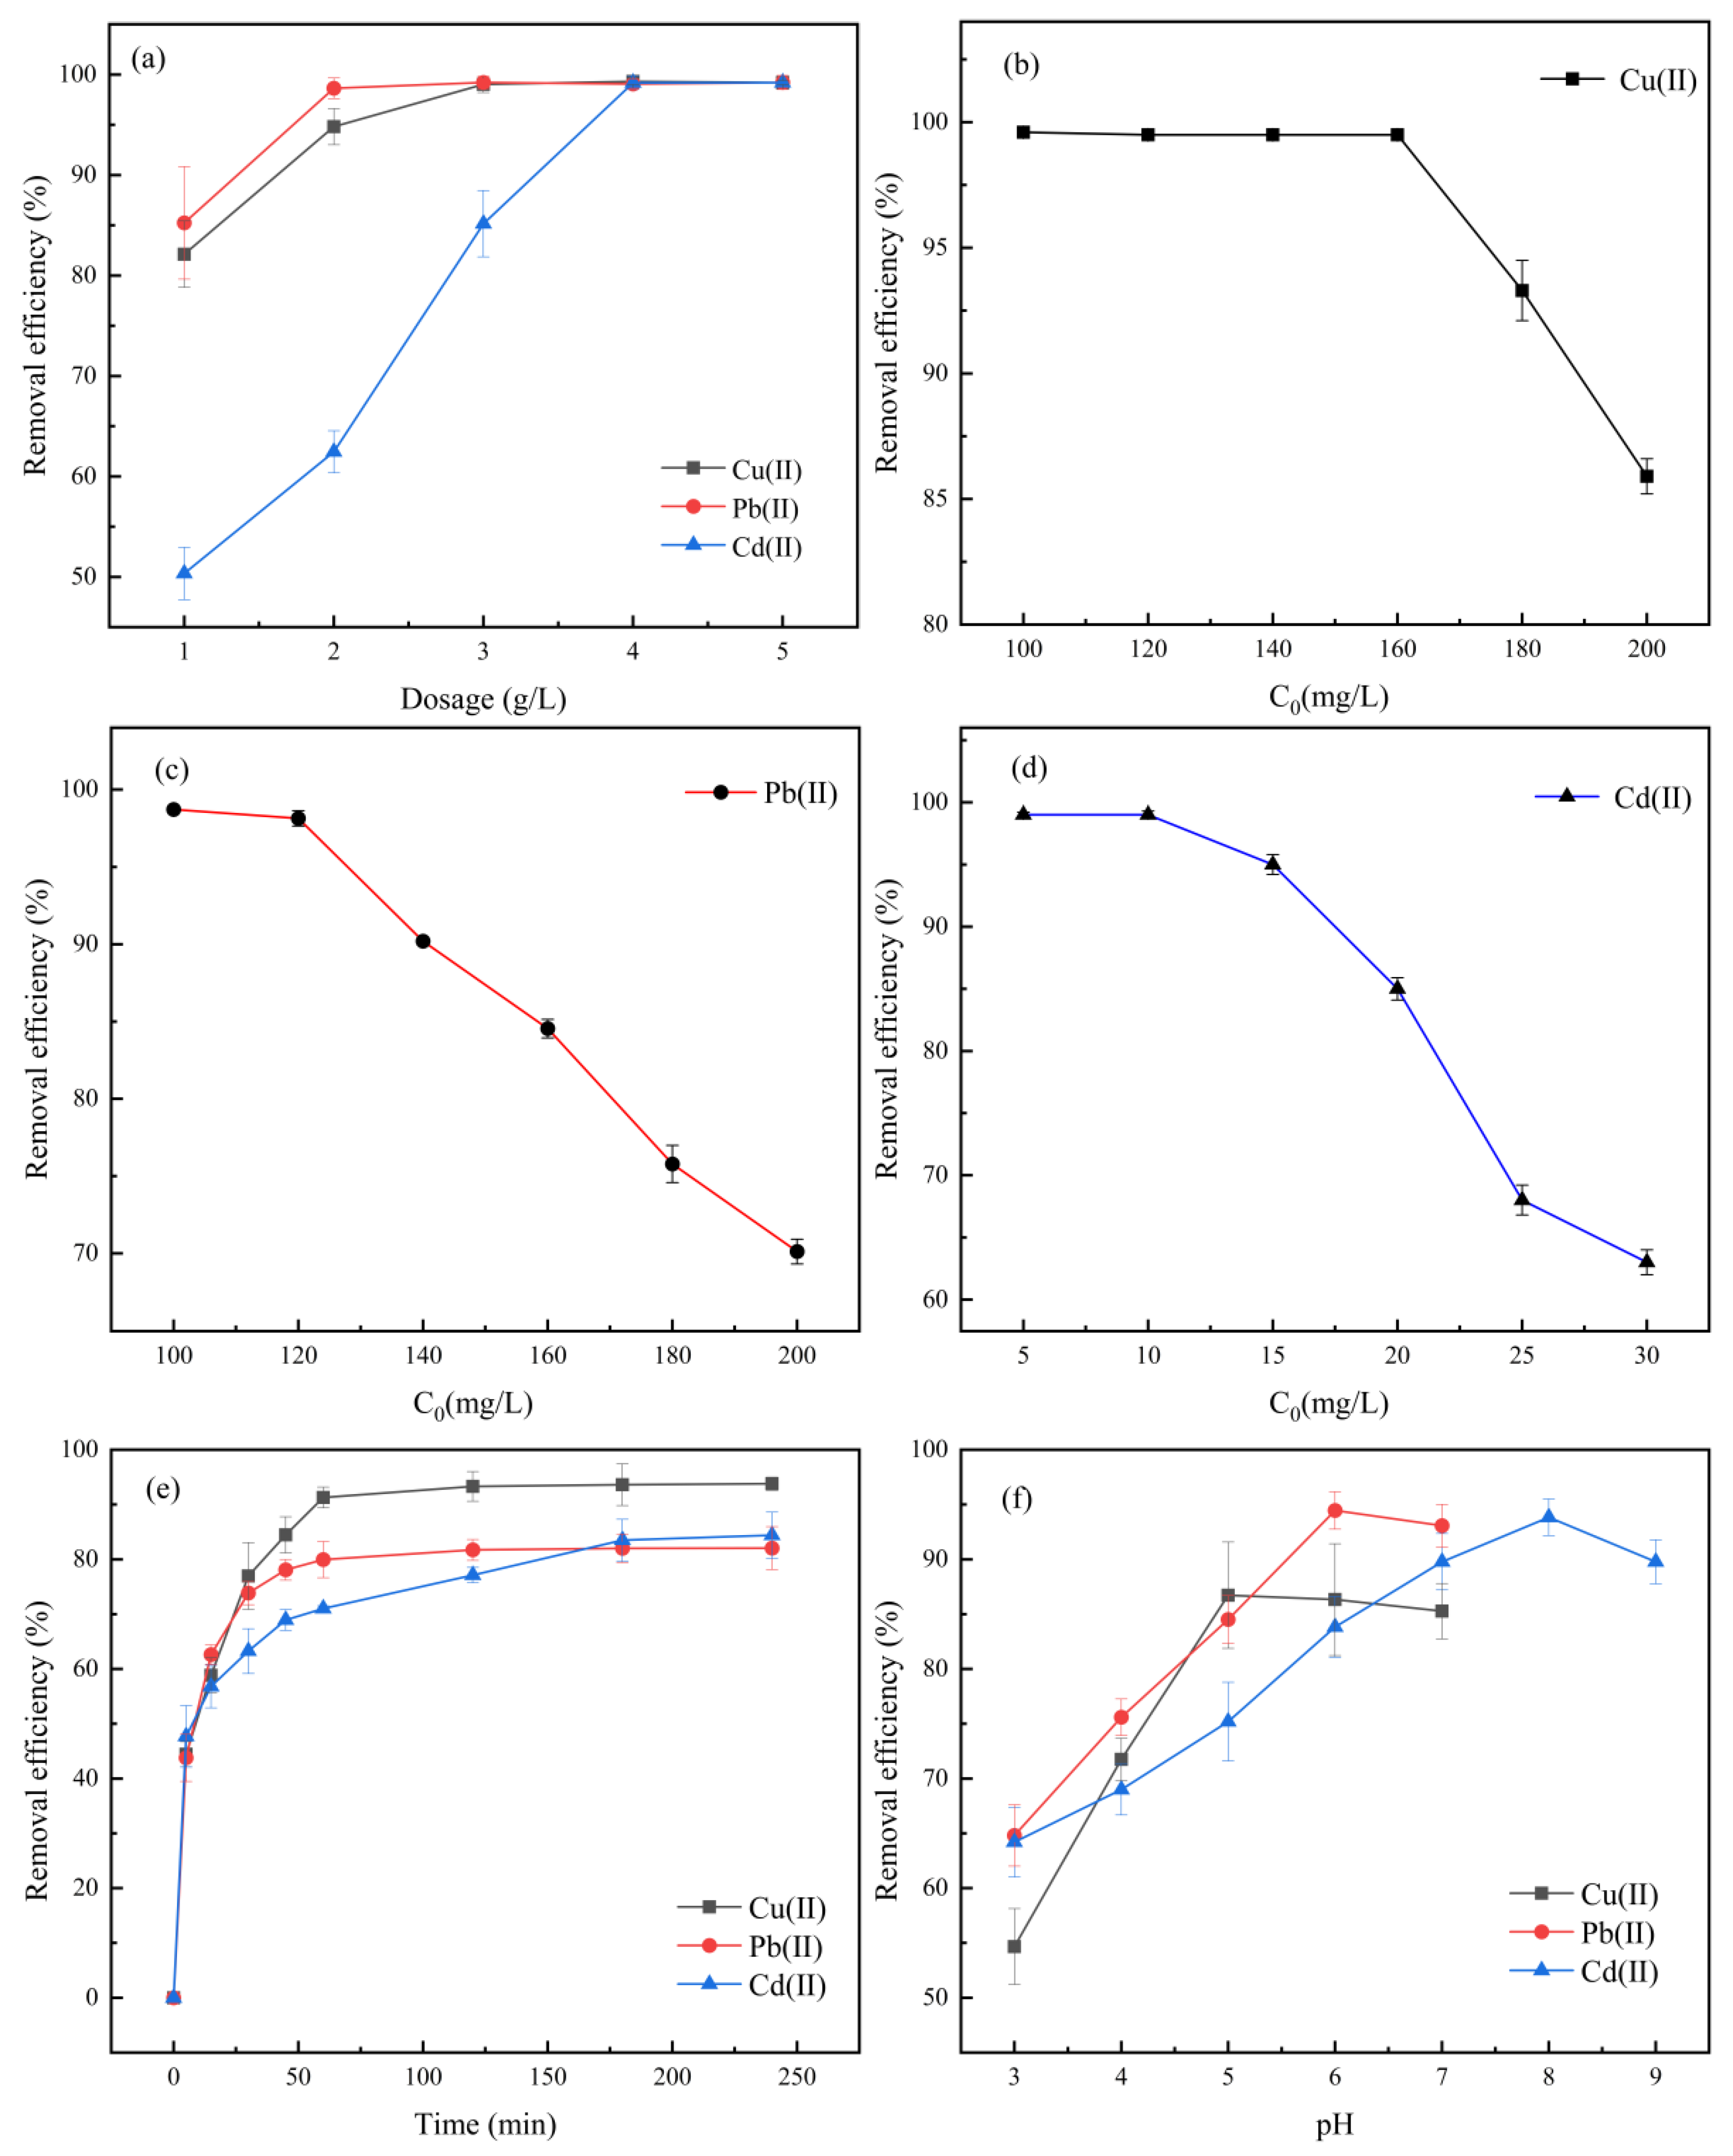
As shown in Figure 4, the following analysis can be performed:
(1)
The economic dosing thresholds of Cu2+, Pb2+, and Cd2+ are 3 g/L, 2 g/L, and 4 g/L, respectively. At this time, the adsorption capacity per unit mass and the removal rate reach equilibrium. Excessive addition leads to no significant change in the adsorption efficiency due to the particle aggregation effect, indicating that excessive addition has a limited effect on increasing the adsorption capacity.
(2)
The adsorption capacity increases with the increase in the concentration gradient. When the initial concentration reaches 180 mg/L (Cu2+), 160 mg/L (Pb2+), and 20 mg/L (Cd2+), the adsorption capacity approaches the maximum value. Further increasing the initial concentration will lead to a stabilization of the adsorption capacity, while the removal rate decreases due to the saturation of the adsorption sites. Therefore, the optimal initial concentrations are selected as Cu2+ 180 mg/L, Pb2+ 160 mg/L, and Cd2+ 20 mg/L. At this time, the adsorption capacity is close to the maximum value.
(3)
The removal rate of the adsorption process increased rapidly within the initial 60 min (Cu2+, Pb2+, and Cd2+ reached more than 85% of the equilibrium adsorption capacity, respectively), and then the adsorption rate slowed down significantly, basically reaching equilibrium after 240 min. From an economic perspective, the comprehensive benefit of adsorption efficiency and time cost is optimal at 60 min. Therefore, the adsorption time for subsequent experiments is uniformly set at 60 min.
(4)
At a low pH (3.0–5.0), H+ competes with heavy metal ions for adsorption sites, resulting in a relatively weak adsorption capacity. When the pH rises to 5.0–6.0, the deprotonation of surface functional groups enhances electrostatic attraction, and the adsorption capacity increases significantly. When pH further increases (>6.0), the adsorption capacity of Cu2+ and Pb2+ decreases due to the formation of hydroxide precipitates (Cu(OH)2 and Pb(OH)2) or hydroxyl complexes. Cd2+ begins to form Cd(OH)2 precipitates and Cd(OH)3 and other complexes when pH>8, resulting in a decrease in adsorption capacity.

3.5. Regeneration Experiment Analysis

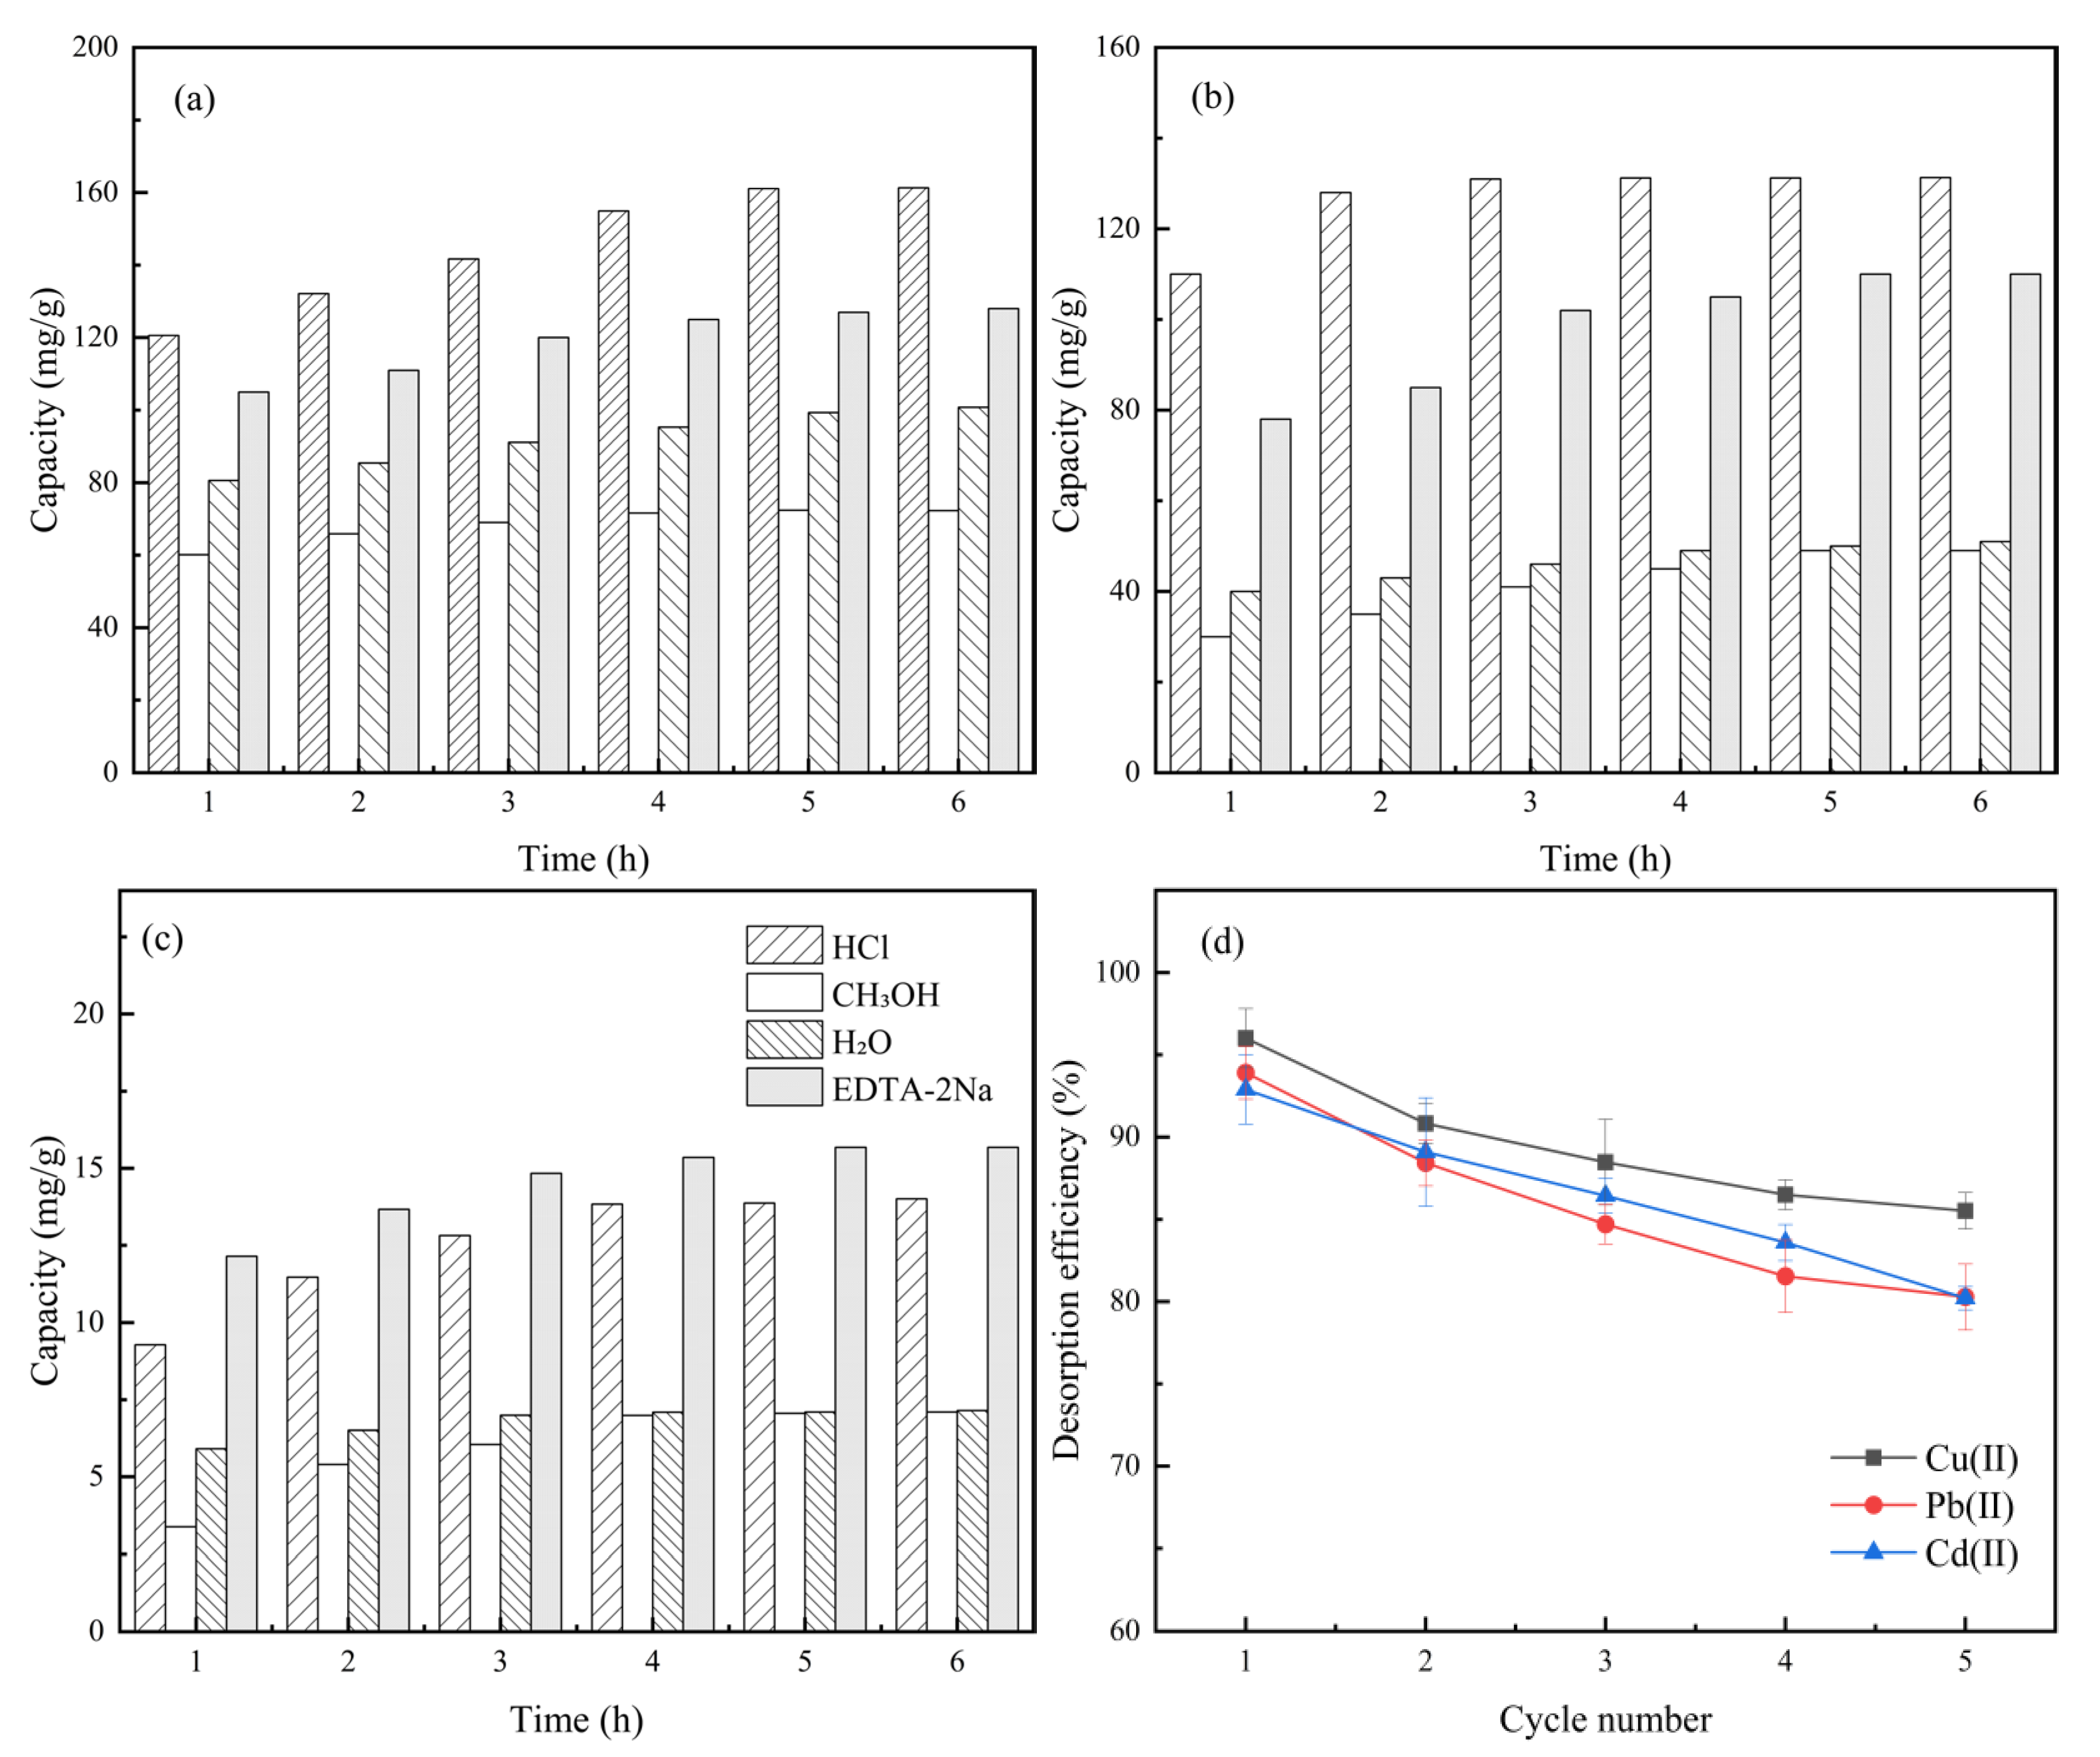
As shown in Figure 5, Cu2+ and Pb2+ were treated with 0.1 mol/L HCl as the desorption agent. Through the competition of H+ for adsorption sites, the coordination between heavy metals and the material surface was disrupted. The desorption rate was >85%, and the desorption efficiency was remarkable. An amount of 0.1 mol/L EDTA-2Na was selected as the desorption agent for Cd2+, and its desorption effect is the best because of its strong chelating ability, which forms a soluble complex with Cd2+. The desorption efficiency of methanol and deionized water is less than 20%, indicating that heavy metals mainly combine through chemical adsorption, and the physical desorption effect is limited. After five adsorption–desorption cycles, the retention rates of adsorption capacity of the material for Cu2+, Pb2+, and Cd2+ were 83%, 85%, and 80%, respectively, indicating that the material has good regeneration stability. The decline in adsorption capacity is mainly caused by two synergistic factors: physical corrosion (the desorbent (HCl/EDTA-2Na) dissolves Fe3O4 nanoparticles, destroying the pore structure and reducing the active surface area) and irreversible site occupation (the type of adsorption is mainly chemical adsorption, which consumes a large number of adsorption sites).

3.6. Analysis of Adsorption Mechanism

Adsorption Kinetics Analysis

As shown as Figure 6, Table 4 and Table 5, Kinetic studies of Cu2+, Pb2+, and Cd2+ by EDTA-2Na-Fe3O4-activated carbon composites show that this adsorption process is more in line with the pseudo-second-order kinetic model (R2 is 0.9986, 0.9984, and 0.9522, respectively), indicating that chemical adsorption is the main rate-controlling step. The equilibrium adsorption capacities can reach 169.49, 131.58, and 16.95 mg/g, respectively. This is due to the combination of the active sites on the surface of the composite material with Cu2+, Pb2+, and Cd2+ through coordination bonds or ion exchange. The intra-particle diffusion model further reveals the three-stage mechanism of the adsorption process: the initial stage is the rapid adsorption stage, mainly dominated by membrane diffusion of heavy metal ions migrating to the active sites on the material surface, and the mid-term adsorption rate decreases. At this time, heavy metal ions diffuse into the internal pores of the particles. This process is affected by the pore structure and concentration gradient of the material. The final adsorption is close to equilibrium. At this point, the surface active sites are basically saturated, and residual adsorption may be driven by a small number of unoccupied sites or weak interactions. The comprehensive analysis of the kinetics and diffusion models indicates that in the early stage of adsorption, surface chemical adsorption is dominant, while in the later stage, it is jointly regulated by intraparticle diffusion and surface reactions [14,15].

3.7. Adsorption Isotherm

As shown as Figure 7 and Table 6, through the fitting analysis of the Langmuir and Freundlich isotherm models, the differences in adsorption characteristics of EDTA-2Na-Fe3O4-activated carbon composite material for different heavy metals were revealed. The adsorption behavior of Cu2+ is more in line with the Freundlich model (R2 = 0.9996), and its non-uniform multilayer adsorption characteristics result from the synergistic coordination effect of carboxyl groups (-COOH) and amino groups (-NH2) on the material surface. The Freundlich constant KF = 3.10. And the index 1/n = 0.7657 indicates that the adsorption process is spontaneous and that the distribution of active sites is uneven [16,17,18]. The adsorption of Pb2+ and Cd2+ was more in line with the Langmuir model (R2 > 0.93), and the maximum adsorption capacities were Qmax = 157.60 mg/g and 18.76 mg/g, respectively, indicating that monolingual chemical adsorption was dominant, and Cd2+ showed a stronger affinity for the hexatentate chelating structure of EDTA-2Na.

4. Conclusions

In this study, by using waste coconut shells as raw materials, through the synergetic strategy of high-temperature carbonization, EDTA-2Na chelating modification, and Fe3O4 magnetic loading, EDTA-2Na-Fe3O4-activated carbon composite material (AC-EDTA-Fe3O4) with both efficient adsorption and magnetic separation characteristics was successfully prepared. And its adsorption performance and mechanism regarding the heavy metals Cu2+, Pb2+, and Cd2+ in water bodies were systematically explored. Through the processes of high-temperature carbonization at 800 °C combined with ultrasonic cleaning and mechanical crushing, and characterized by SEM, XRD, and FT-IR, it was confirmed that EDTA-2Na modification significantly enhanced the densities of functional groups such as carboxyl groups (-COOH) and amino groups (-NH2) on the material surface. Fe3O4 is loaded by the co-precipitation method (XRD shows characteristic peaks of 30.2° and 35.6°, and the Fe atomic concentration detected by EDS reaches 6.83%), endowing the material with magnetic separation ability (separation efficiency > 90%). Among the five chelating agents, namely EDTA-2Na, CA, DA, TA, and TEA, EDTA-2Na had the best comprehensive adsorption performance for Cu2+, Pb2+, and Cd2+, with removal rates reaching 86.73%, 94.45%, and 93.83%, respectively. The response surface method indicates that the optimal preparation ratio is activated carbon (EDTA-2Na:Fe3O4 = 2:0.6:0.2), and the model is highly significant (F = 233.64, p < 0.0001).
Adsorption experiments showed that the adsorption performance of AC-EDTA-Fe3O4 is significantly affected by pH. The adsorption of Cu2+ is optimal at pH = 5.0 (initial concentration of 180 mg/L, equilibrium adsorption capacity of 174.96 mg/g, and removal rate of 97.2%). The adsorption of Pb2+ was optimal at pH = 6.0 (initial concentration of 160 mg/L, equilibrium adsorption capacity of 157.60 mg/g, and removal rate of 98.5%). The adsorption of Cd2+ was optimal at pH = 8.0 (initial concentration of 20 mg/L, equilibrium adsorption capacity of 18.76 mg/g, and removal rate of 93.8%). Kinetic studies show that adsorption reaches equilibrium within 60 min, with a removal rate of >85%. The intra-particle diffusion model reveals that it is divided into three stages: In the initial stage (0–40 min), membrane diffusion is dominant (the diffusion coefficient (K1) values of Cu2+, Pb2+, and Cd2+ were 10.55, 14.85, and 0.80 mg/(g·min0.5), respectively). In the middle stage (40-60 min), pore diffusion restriction occurs (K2 decreases to 2.74, 4.35, and 0.44 mg/(g·min0.5) respectively), and in the final stage (>60 min), it tends to be in dynamic equilibrium. The pseudo-second-order kinetic model (R2 > 0.95) indicates that the type of adsorption is mainly chemical adsorption, involving the coordination and complexation of functional groups and metal ions. The isothermal adsorption experiment shows that Cu2+ adsorption conforms to the Freundlich model (R2 = 0.99959) and presents non-uniform multilayer adsorption characteristics. However, Pb2+ and Cd2+ are more in line with the Langmuir model (R2 > 0.93), and monolingual chemical adsorption is dominant.
Furthermore, the material exhibits excellent regeneration performance: a concentration of 0.1 mol/L HCl can effectively desorb Cu2+ and Pb2+, and EDTA-2Na is suitable for the desorption of Cd2+. After three cycles, the regeneration efficiency is >85%, after five cycles, the retention rate of adsorption capacity is >80%, and the magnetic separation efficiency is always >95%, which significantly reduces the treatment cost. In conclusion, the AC-EDTA-Fe3O4 composite material achieves efficient adsorption and convenient recovery of heavy metals through the synergistic effect of functional group modification and magnetic loading, and it has broad application prospects in wastewater treatment.

Author Contributions

Conceptualization, M.L.; methodology, F.M.; validation, Y.L., S.H. and X.B.; formal analysis, Y.L.; data curation, S.H., W.W., H.Z. and L.C.; writing—original draft preparation, Y.L., S.H. and Q.S.; writing—review and editing, M.L. and W.W. All authors have read and agreed to the published version of the manuscript.

Funding

We sincerely thank the Scientific Research Foundation of Hainan Tropical Ocean University (No. RHDRC202107), and the Hainan Tropical Ocean University Graduate Innovation Research Project (No. RHDYC-202414 and No. RHDYC-202416) for providing financial support.

Data Availability Statement

The data presented in this study are available upon request from the corresponding author.

Acknowledgments

Special thanks to the Laboratory Management Center of Hainan Tropical Ocean University for the support and assistance provided during the entire research process.

Conflicts of Interest

The authors declare no conflicts of interest.

References

  1. Zhang, P.; He, M.; Teng, W.; Li, F.; Qiu, X.; Li, K.; Wang, H. Ordered mesoporous materials for water pollution treatment: Adsorption and catalysis. Green Energy Environ. 2024, 9, 1239–1256. [Google Scholar] [CrossRef]
  2. Saravanan, A.; Kumar, P.S.; Jeevanantham, S.; Karishma, S.; Tajsabreen, B.; Yaashikaa, P.; Reshma, B. Effective water/wastewater treatment methodologies for toxic pollutants removal: Processes and applications towards sustainable development. Chemosphere 2021, 280, 130595. [Google Scholar] [CrossRef] [PubMed]
  3. Rashid, R.; Shafiq, I.; Akhter, P.; Iqbal, M.J.; Hussain, M. A state-of-the-art review on wastewater treatment techniques: The effectiveness of adsorption method. Environ. Sci. Pollut. Res. 2021, 28, 9050–9066. [Google Scholar] [CrossRef] [PubMed]
  4. Hao, Z.; Wang, C.; Yan, Z.; Jiang, H.; Xu, H. Magnetic particles modification of coconut shell-derived activated carbon and biochar for effective removal of phenol from water. Chemosphere 2018, 211, 962–969. [Google Scholar] [CrossRef] [PubMed]
  5. Liu, S.; Yu, B.; Wang, S.; Shen, Y.; Cong, H. Preparation, surface functionalization and application of Fe3O4 magnetic nanoparticles. Adv. Colloid Interface Sci. 2020, 281, 102165. [Google Scholar] [CrossRef] [PubMed]
  6. Kalavathy, H.; Regupathi, I.; Pillai, M.G.; Miranda, L.R. Modelling, analysis and optimization of adsorption parameters for H3PO4 activated rubber wood sawdust using response surface methodology (RSM). Colloids Surf. B Biointerfaces 2009, 70, 35–45. [Google Scholar] [CrossRef] [PubMed]
  7. Parsadoust, F.; Shirvani, M.; Shariatmadari, H.; Dinari, M. Effects of GLDA, MGDA, and EDTA chelating ligands on Pb sorption by montmorillonite. Geoderma 2020, 366, 114229. [Google Scholar] [CrossRef]
  8. Cui, X.; Martin, D.C. Fuzzy gold electrodes for lowering impedance and improving adhesion with electrodeposited conducting polymer films. Sens. Actuators A Phys. 2003, 103, 384–394. [Google Scholar] [CrossRef]
  9. Huang, Z.; Liu, S.; Zhang, B.; Xu, L.; Hu, X. Equilibrium and kinetics studies on the absorption of Cu (II) from the aqueous phase using a β-cyclodextrin-based adsorbent. Carbohydr. Polym. 2012, 88, 609–617. [Google Scholar] [CrossRef]
  10. Wu, F.C.; Tseng, R.L.; Juang, R.S. Initial behavior of intraparticle diffusion model used in the description of adsorption kinetics. Chem. Eng. J. 2009, 153, 1–8. [Google Scholar] [CrossRef]
  11. Chen, R.; Chai, L.; Li, Q.; Shi, Y.; Wang, Y.; Mohammad, A. Preparation and characterization of magnetic Fe3O4/CNT nanoparticles by RPO method to enhance the efficient removal of Cr(VI). Curr. Top. Microbiol. Immunol. 2013, 20, 7175–7185. [Google Scholar] [CrossRef] [PubMed]
  12. Ashrafi, S.D.; Kamani, H.; Jaafari, J.; Mahvi, A.H. Experimental design and response surface modeling for optimization of fluoroquinolone removal from aqueous solution by NaOH-modified rice husk. Desalination Water Treat. 2016, 57, 16456–16465. [Google Scholar] [CrossRef]
  13. He, D.; Du, J.; Liu, P.; Liu, X.; Chen, X.; Li, W.; Zhang, K.; Ma, F. Influence of EDTA-2Na on the hydroxyapatite coating deposited by hydrothermal-electrochemical method on Ti6Al4V surface. Surf. Coat. Technol. 2019, 365, 242–247. [Google Scholar] [CrossRef]
  14. Wang, X.; Tan, Z.; Shi, S.; Zhang, S.; Yang, S.; Zhang, X.; Gao, P.; Zhang, Y. Preparation of Cellulose-Grafted Acrylic Acid Stabilized Jujube Branch Biochar-Supported Nano Zero-Valent Iron Composite for Cr (VI) Removal from Water. Nanomaterials 2025, 15, 441. [Google Scholar] [CrossRef] [PubMed]
  15. Dong, H.; Liang, H.; Yang, L.; Yang, X.; Yang, C.; Hu, G.; Zhao, T. Porous biochar derived from waste distiller’s grains for hexavalent chromium removal: Adsorption performance and mechanism. J. Environ. Chem. Eng. 2023, 11, 110137. [Google Scholar] [CrossRef]
  16. Nguyen, T.H.H.; Pham, T.D.; Truong, T.T. Adsorption characteristics and mechanisms of individual and a quinary mixture of heavy metal ions on novel CoFe2O4-BiFeO3 nanosorbents in water. Inorg. Chem. Commun. 2024, 170, 113177. [Google Scholar] [CrossRef]
  17. Lv, Y.; Wen, W.; Han, S.; Li, K.; Fu, Z.; Mu, F.; Luo, M. Preparation, Characterization, and Mechanism of SMS Titanium–Manganese Nanocomposite for Antimony Removal from Water. Separations 2025, 12, 38. [Google Scholar] [CrossRef]
  18. Kamenická, B.; Weidlich, T.; Švancara, I. Voltammetric determination of flufenamic acid and adsorption studies with biochar in the absence/presence of cetyltrimethylammonium bromide. Talanta 2023, 266, 125073. [Google Scholar] [CrossRef] [PubMed]
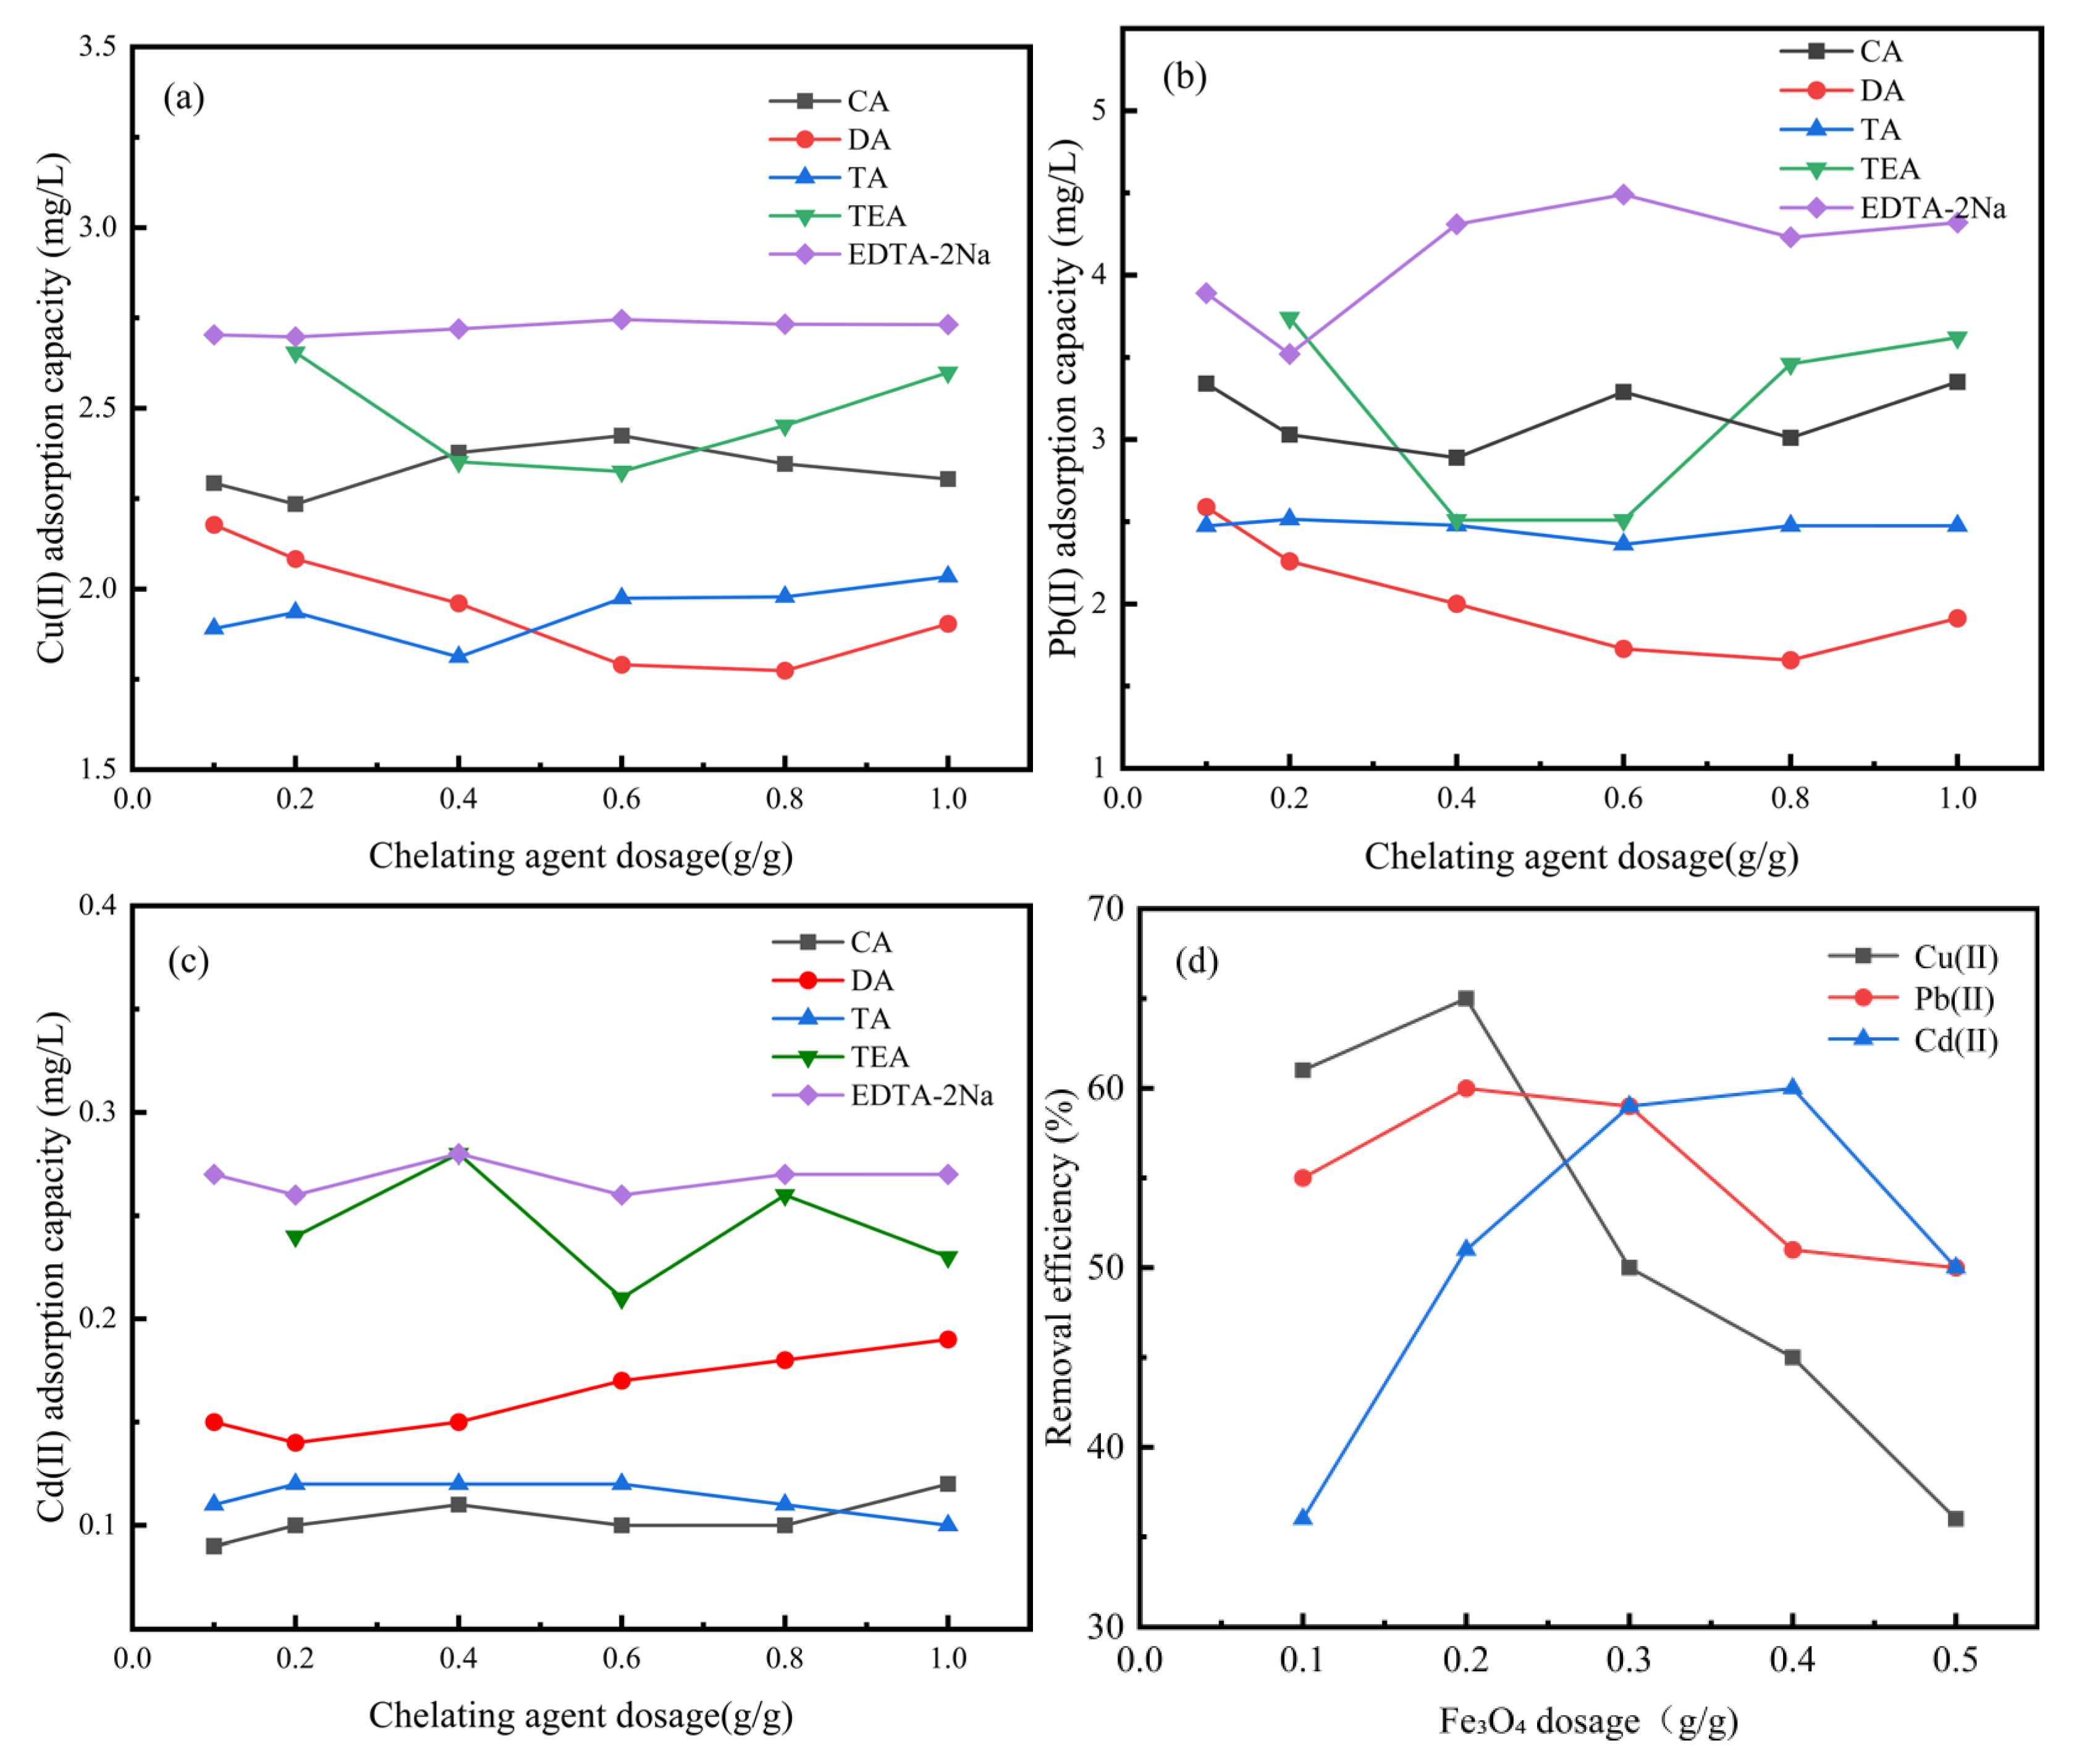
Figure 1. (a) Cu2+, (b) Pb2+, and (c) Cd2+ removal efficiency of different chelating agents; (d) Fe3O4 removal efficiency for three typical heavy metals.
Separations 12 00205 g001
Figure 2. (a) Response surface diagram showing addition of coconut shell activated carbon and chelating agent for copper removal; (b) response surface diagram showing copper removal with addition of coconut shell activated carbon and Fe3O4; (c) response surface diagram showing copper removal with addition of chelating agent and Fe3O4.
Separations 12 00205 g002
Figure 3. (a) Activated carbon carbonized at 800 °C. (b) EDTA-2Na-modified carbon material. (c) Scanning electron microscope image of EDTA-2Na-Fe3O4-modified carbon material. (d) Energy spectrum of activated carbon after carbonization at 800 °C. (e) Energy spectrum of EDTA-2Na-Fe3O4-modified carbon material. (f) Infrared spectrum of activated carbon. (g) X-ray diffraction pattern of activated carbon.
Separations 12 00205 g003
Figure 4. (a) The influence of dosage on the adsorption of Cu2+, Pb2+, and Cd2+. (b) The influence of the initial solution concentration on the adsorption of Cu2+. (c) The influence of the initial solution concentration on the adsorption of Pb2+. (d) The influence of the initial solution concentration on the adsorption of Cd2+. (e) The influence of adsorption time on the adsorption of Cu2+, Pb2+, and Cd2+. (f) The influence of pH on the adsorption of Cu2+, Pb2+, and Cd2+.
Separations 12 00205 g004
Figure 5. The desorption effects of four desorption agents on heavy metals (a) Cu2+, (b) Pb2+, and (c) Cd2+. (d) The relationship between the desorption frequency and the removal of Cu2+, Pb2+, and Cd2+ by EDTA-2Na-Fe3O4-activated carbon composites.
Separations 12 00205 g005
Figure 6. Adsorption kinetics model of EDTA-2Na-Fe3O4-activated carbon composite for heavy metal Cu2+ (a); intra-particle diffusion model (b); adsorption kinetics model of EDTA-2Na-Fe3O4-activated carbon composite for heavy metal Pb2+ (c); intra-particle diffusion model (d); adsorption kinetics model of activity of EDTA-2Na-Fe3O4; (e) and intra-particle diffusion model (f) of carbon composites for heavy metal Cd2+.
Separations 12 00205 g006
Figure 7. (a) Cu2+ isothermal adsorption curve; (b) Pb2+ isothermal adsorption curve; (c) Cd2+ isothermal adsorption curve.
Separations 12 00205 g007
Table 1. Experimental factor coding and levels.
Value LevelInfluence Factor
A—Coconut Shell Activated Carbon (g)B—Chelating
Agent (g)
C—Fe3O4 (g)
−110.40.1
020.60.2
130.80.3
Table 2. Analysis of variance of response surface model.
SourceSum of SquaresdfMean SquaresF
Value
Value
Prob > F
Model2.545890.2829233.6379<0.0001significant
A0.007810.00786.45280.0387
B0.035110.035129.00150.0010
C0.039210.039232.37760.0007
AB0.012110.01219.99410.0159
AC0.000610.00060.51620.4957
BC0.005610.00564.64600.0681
A21.105911.1059913.4451<0.0001
B20.118110.118197.5718<0.0001
C21.010911.0109835.0008<0.0001
Residual0.008570.0012
Lack of Fit0.004530.00151.49170.3447not significant
Pure Error0.004040.0010
Cor Total2.554316
Table 3. Analysis of variance for quadratic regression equations.
Std. Dev.0.034R-Squared0.9964
Mean2.39Adj R-Squared0.9929
C.V.%1.41Pred R-Squared0.9783
PRESS0.055Adeq Precision44.978
Table 4. Adsorption kinetics parameters of heavy metal ions in EDTA-2Na-Fe3O4-activated carbon composites.
Pseudo-First-Order ModelPseudo-Second-Order Model
K1
(min−1)
Qe
(mg/g)
R2K2
(g/(mg·min))
Qe
(mg/g)
R2
Cu0.012168.820.92410.00591169.490.9986
Pb0.018131.20.98520.00525131.580.9984
Cd0.01616.880.91240.05901916.950.9522
Table 5. Intra-particle diffusion model parameters of heavy metal ions in EDTA-2Na-Fe3O4-activated carbon composites.
Intraparticle Diffusion Model
K1
(g/mg/min0.5)
C1
(mg/g)
R12K2
(g/mg/min0.5)
C2
(mg/g)
R22K3
(g/mg/min0.5)
C3
(mg/g)
R32
Cu10.5507181.33090.996792.73737136.570610.876430.41067161.512770.81805
Pb14.8522438.760260.980864.3514294.76430.876430.27721126.812590.8659
Cd0.800187.994240.976410.4379410.755590.992220.0325416.309410.89743
Table 6. Parameters of isothermal adsorption curves of the Langmuir model and the Freundlich model.
LangmuirFreundlich
Qmax
(mg/g)
KL
(L/mg)
R2KF
(mg/g)
1/nR2
Cu181.840.002070.966193.102210.765740.99959
Pb162.310.008250.9366112.872750.456270.90977
Cd20.360.041870.970622.404710.620080.94158
Disclaimer/Publisher’s Note: The statements, opinions and data contained in all publications are solely those of the individual author(s) and contributor(s) and not of MDPI and/or the editor(s). MDPI and/or the editor(s) disclaim responsibility for any injury to people or property resulting from any ideas, methods, instructions or products referred to in the content.