
Extraction of Rubidium and Cesium Ions by Adsorption–Flotation Separation in Titanosilicate-Hexadecyltrimethylammonium Bromide System


Abstract
1. Introduction
2. Materials and Methods
2.1. Chemicals
2.2. Experimental Methods
2.2.1. Single-Factor Experiment
2.2.2. Response Surface Optimization Method
3. Results and Discussion
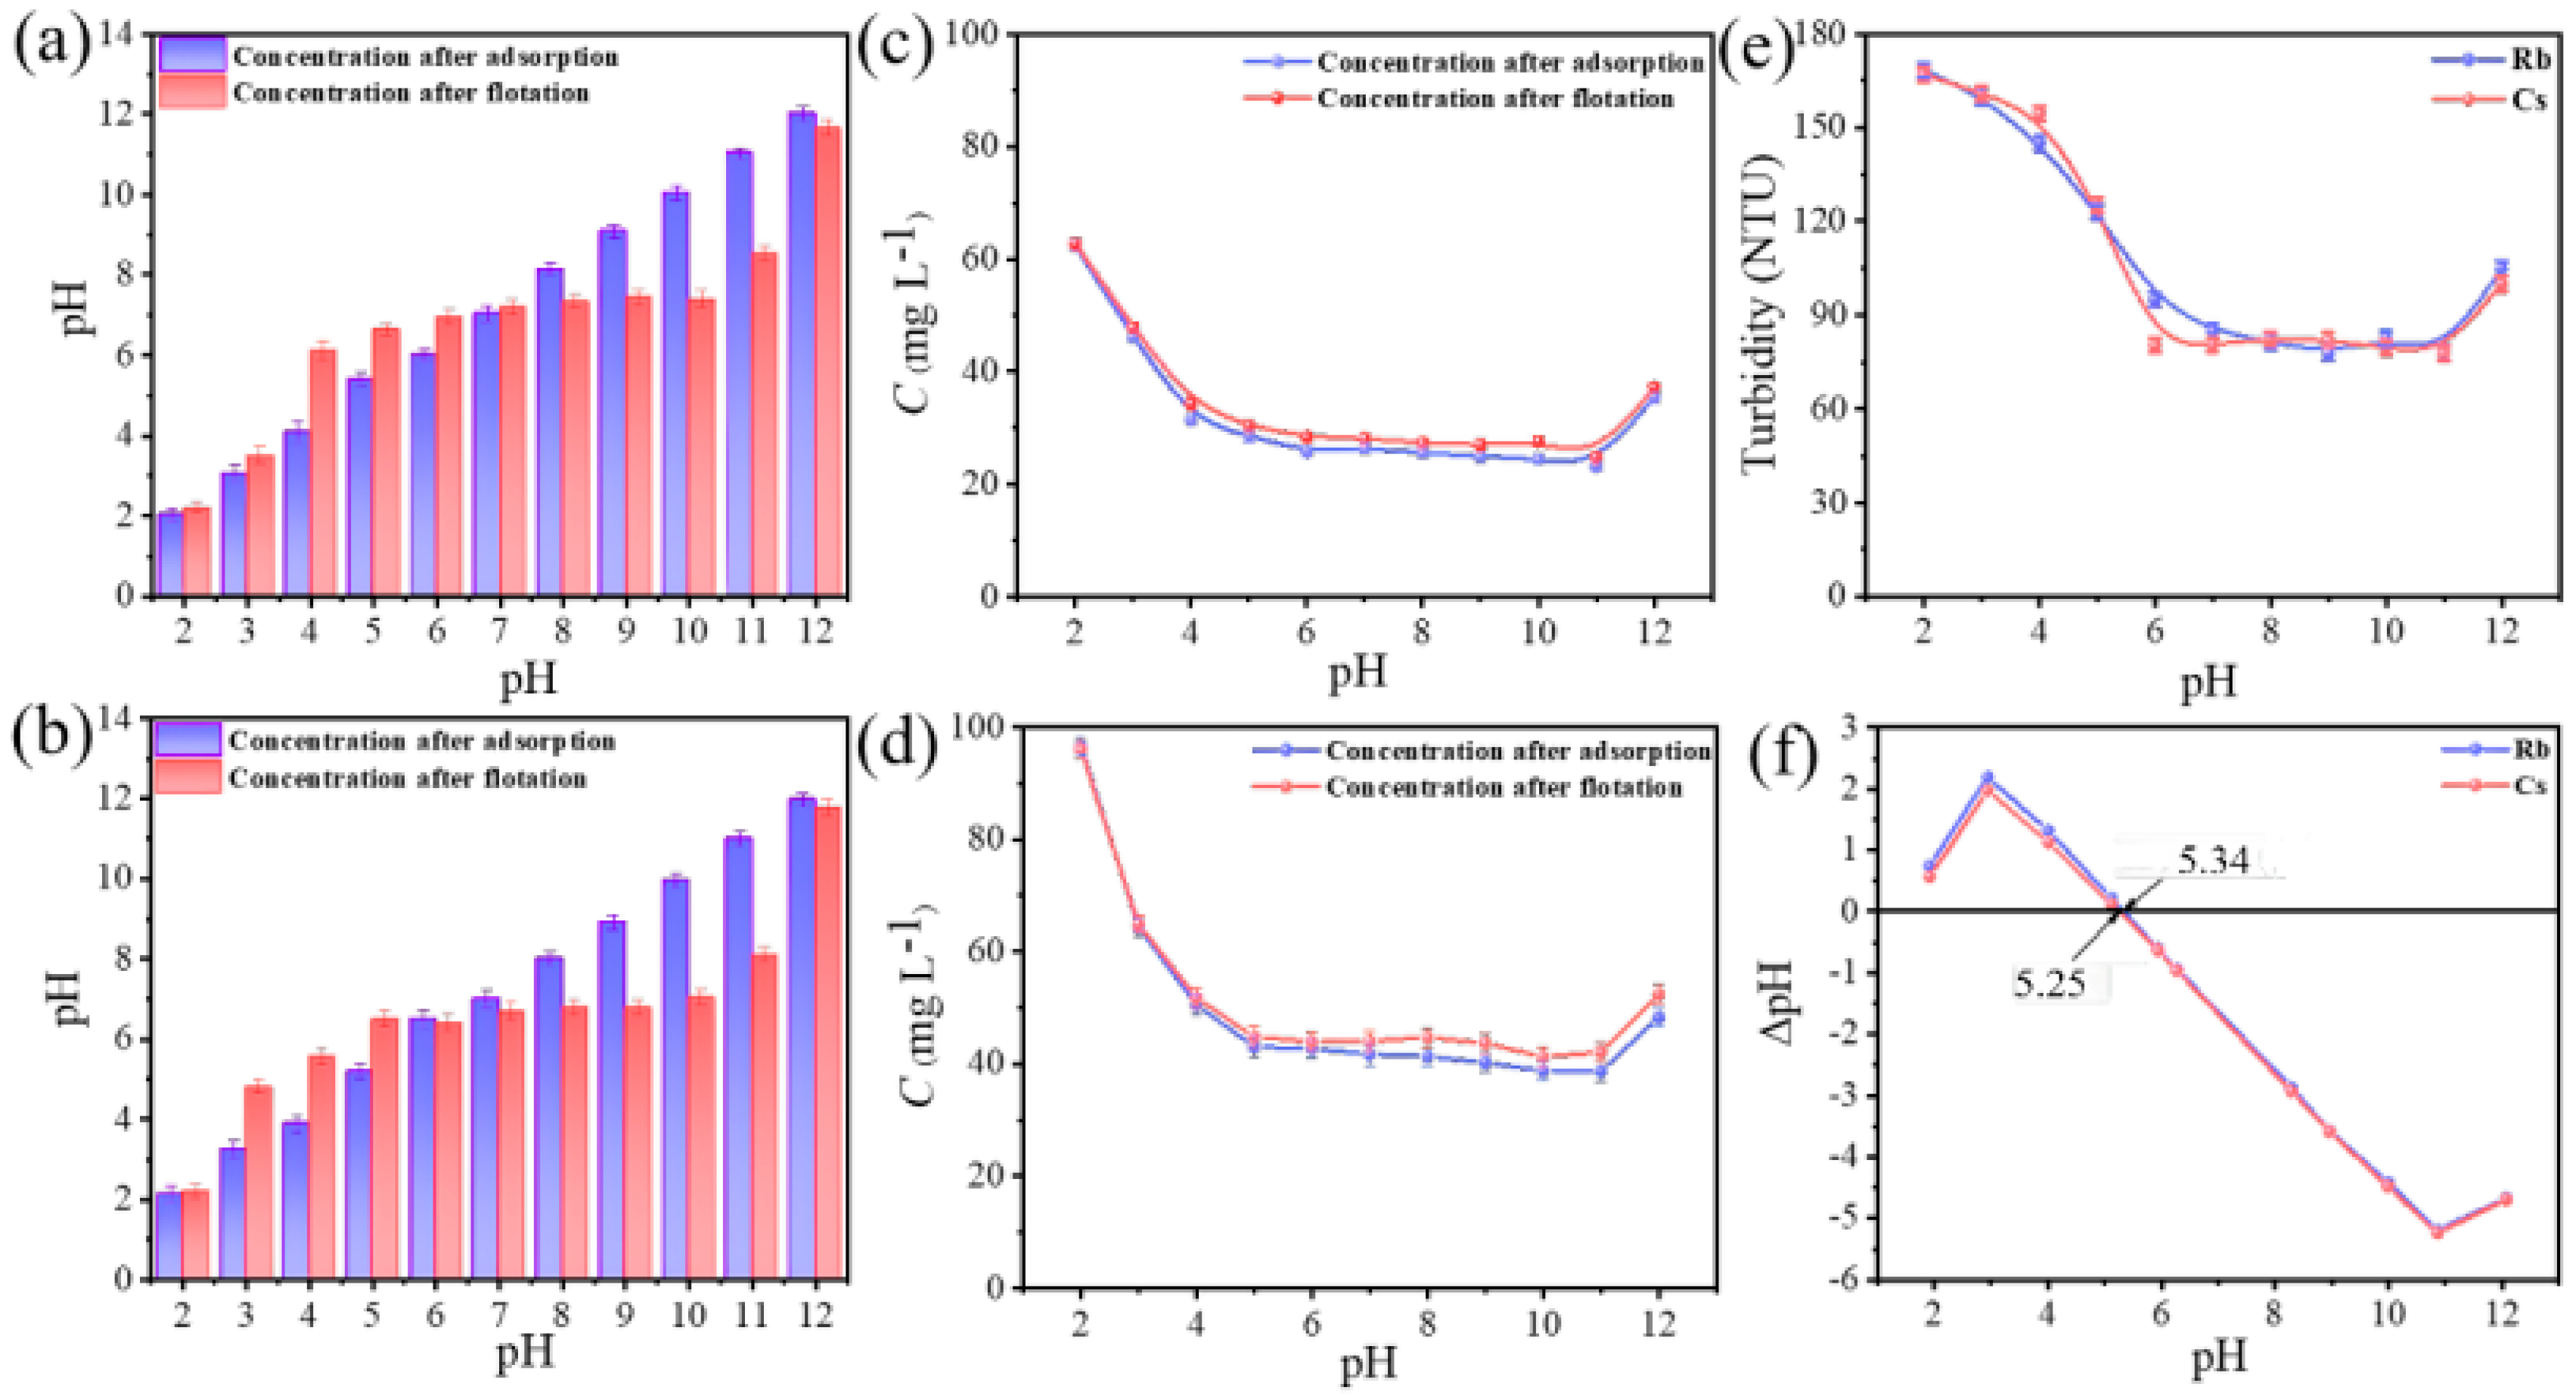
3.1. Effect of pH on the Effectiveness of Adsorption–Flotation
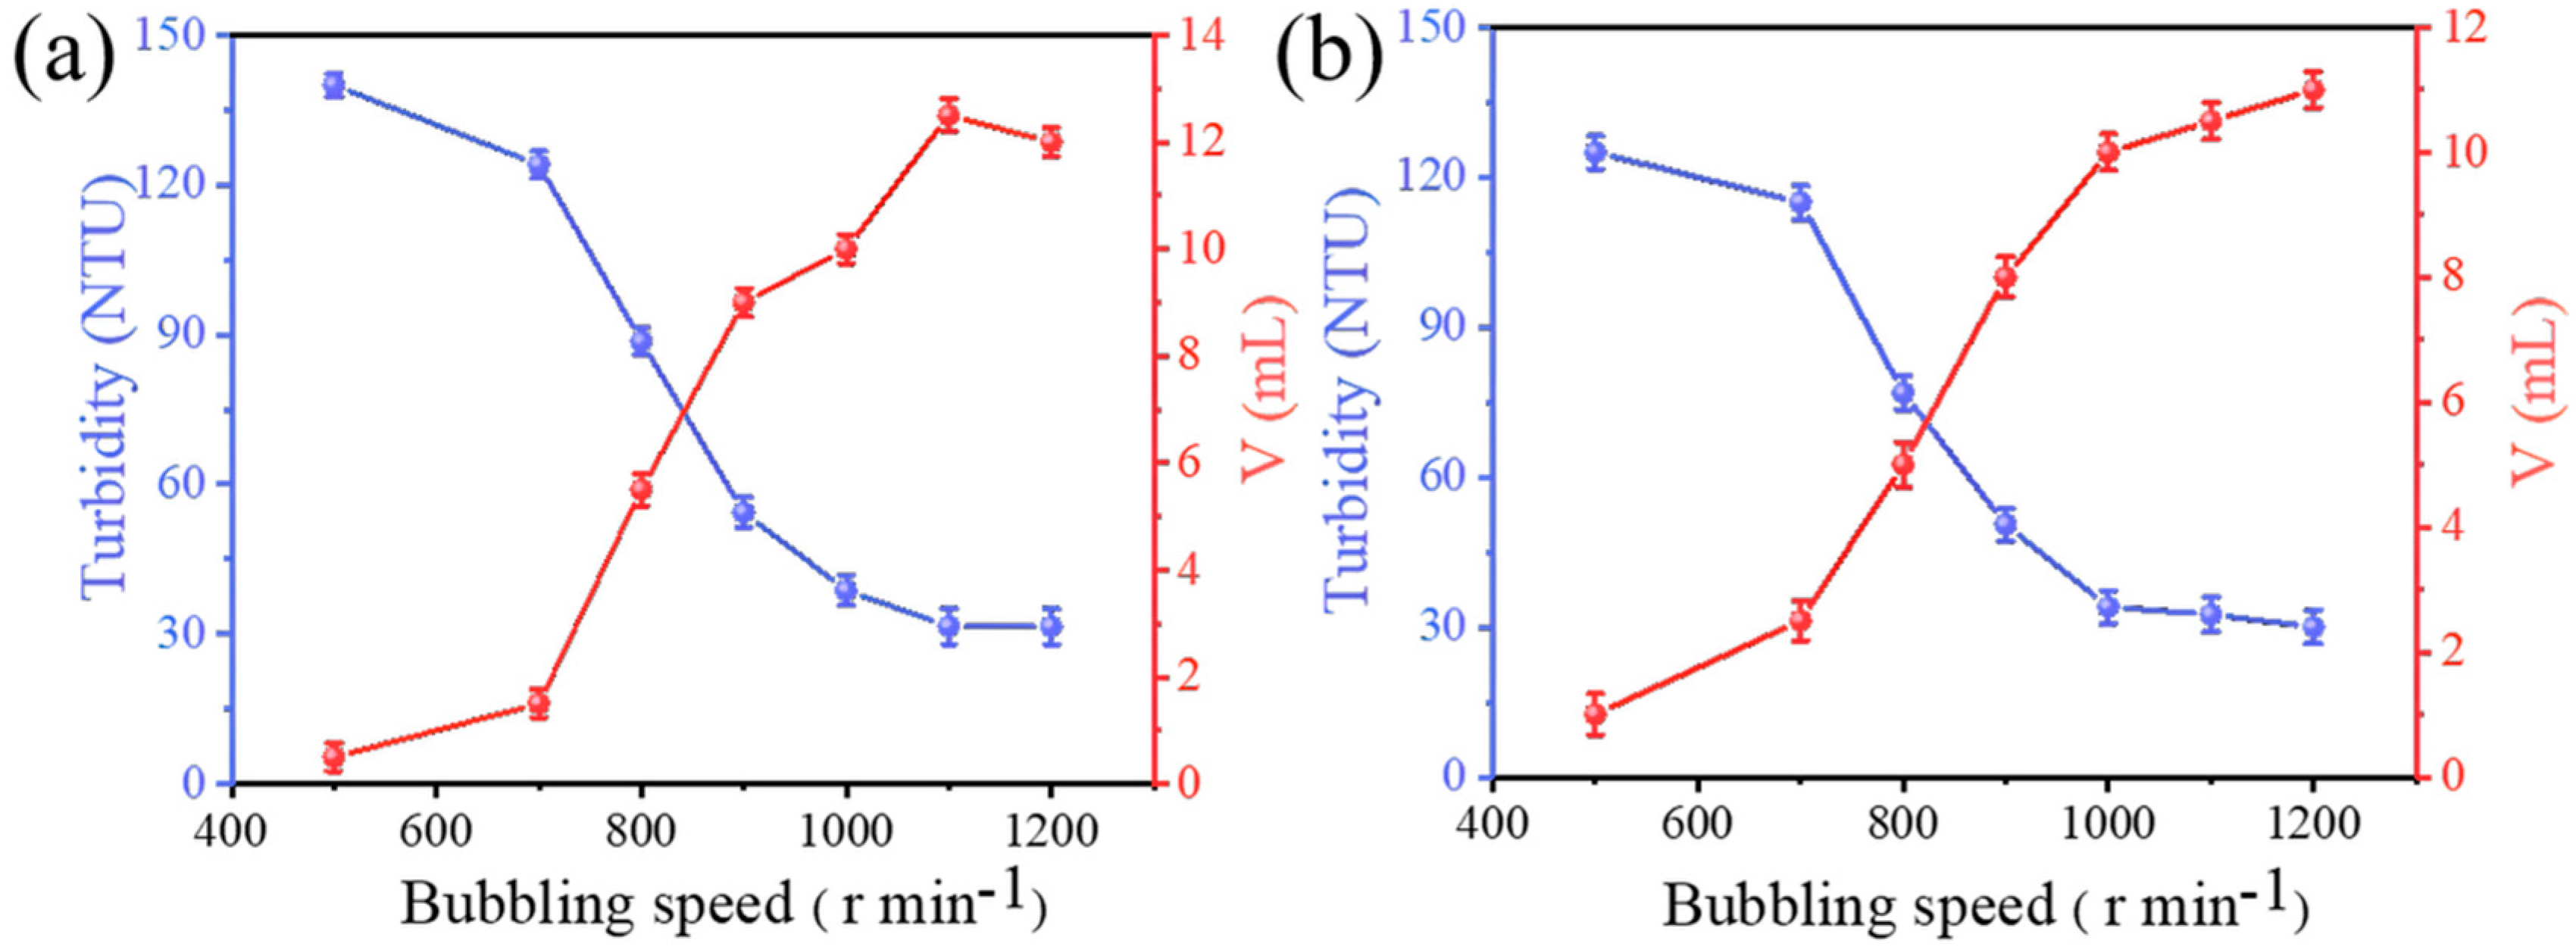
3.2. Effect of Aeration Rate on the Effectiveness of Adsorption Flotation
3.3. Effect of Concentration of CTAB on the Effectiveness of Adsorption–Flotation
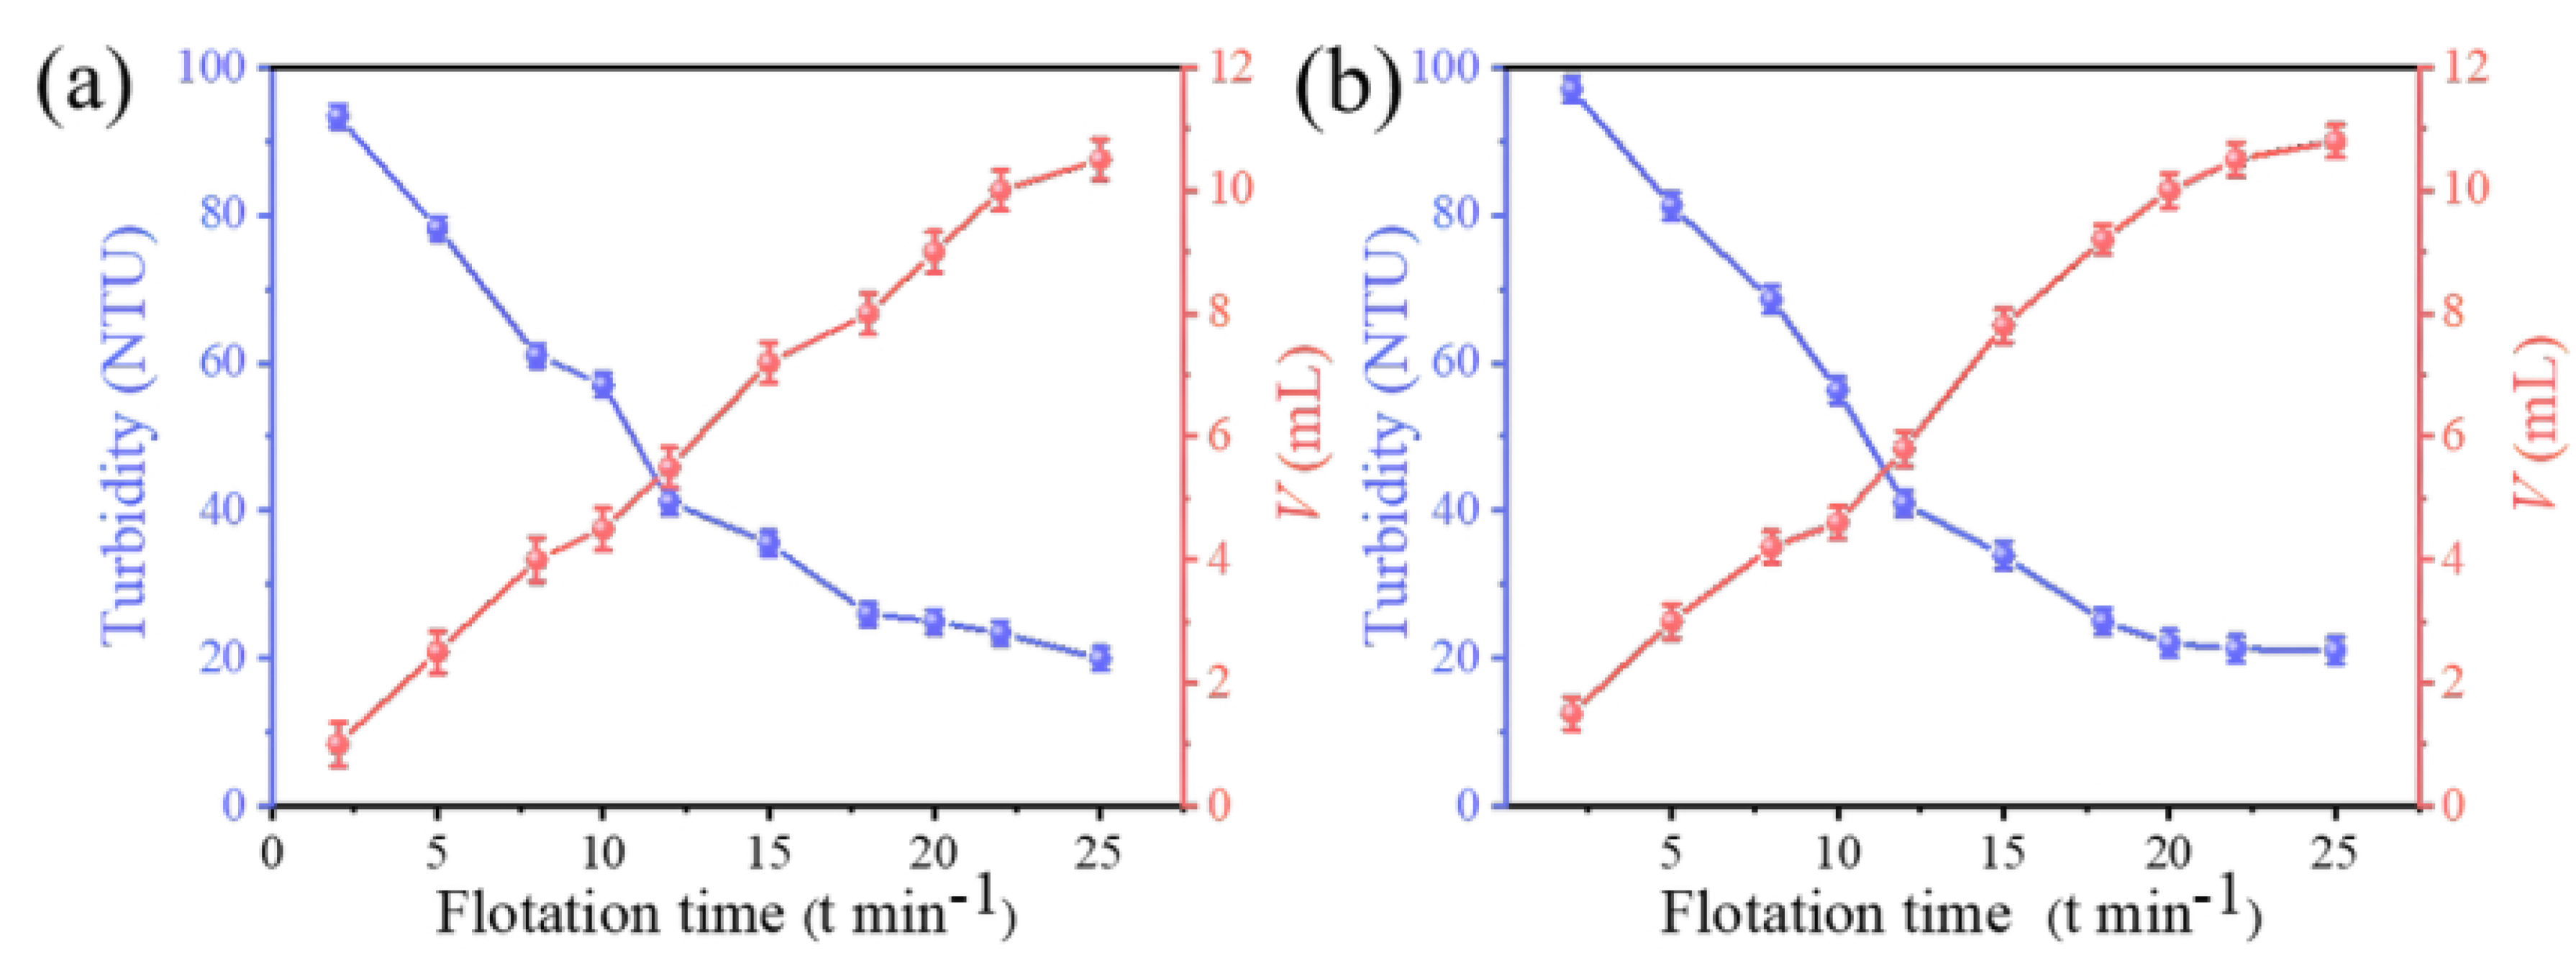
3.4. Effect of Flotation Time on the Effectiveness of Adsorption–Flotation
3.5. Response Surface Optimization
- (1)
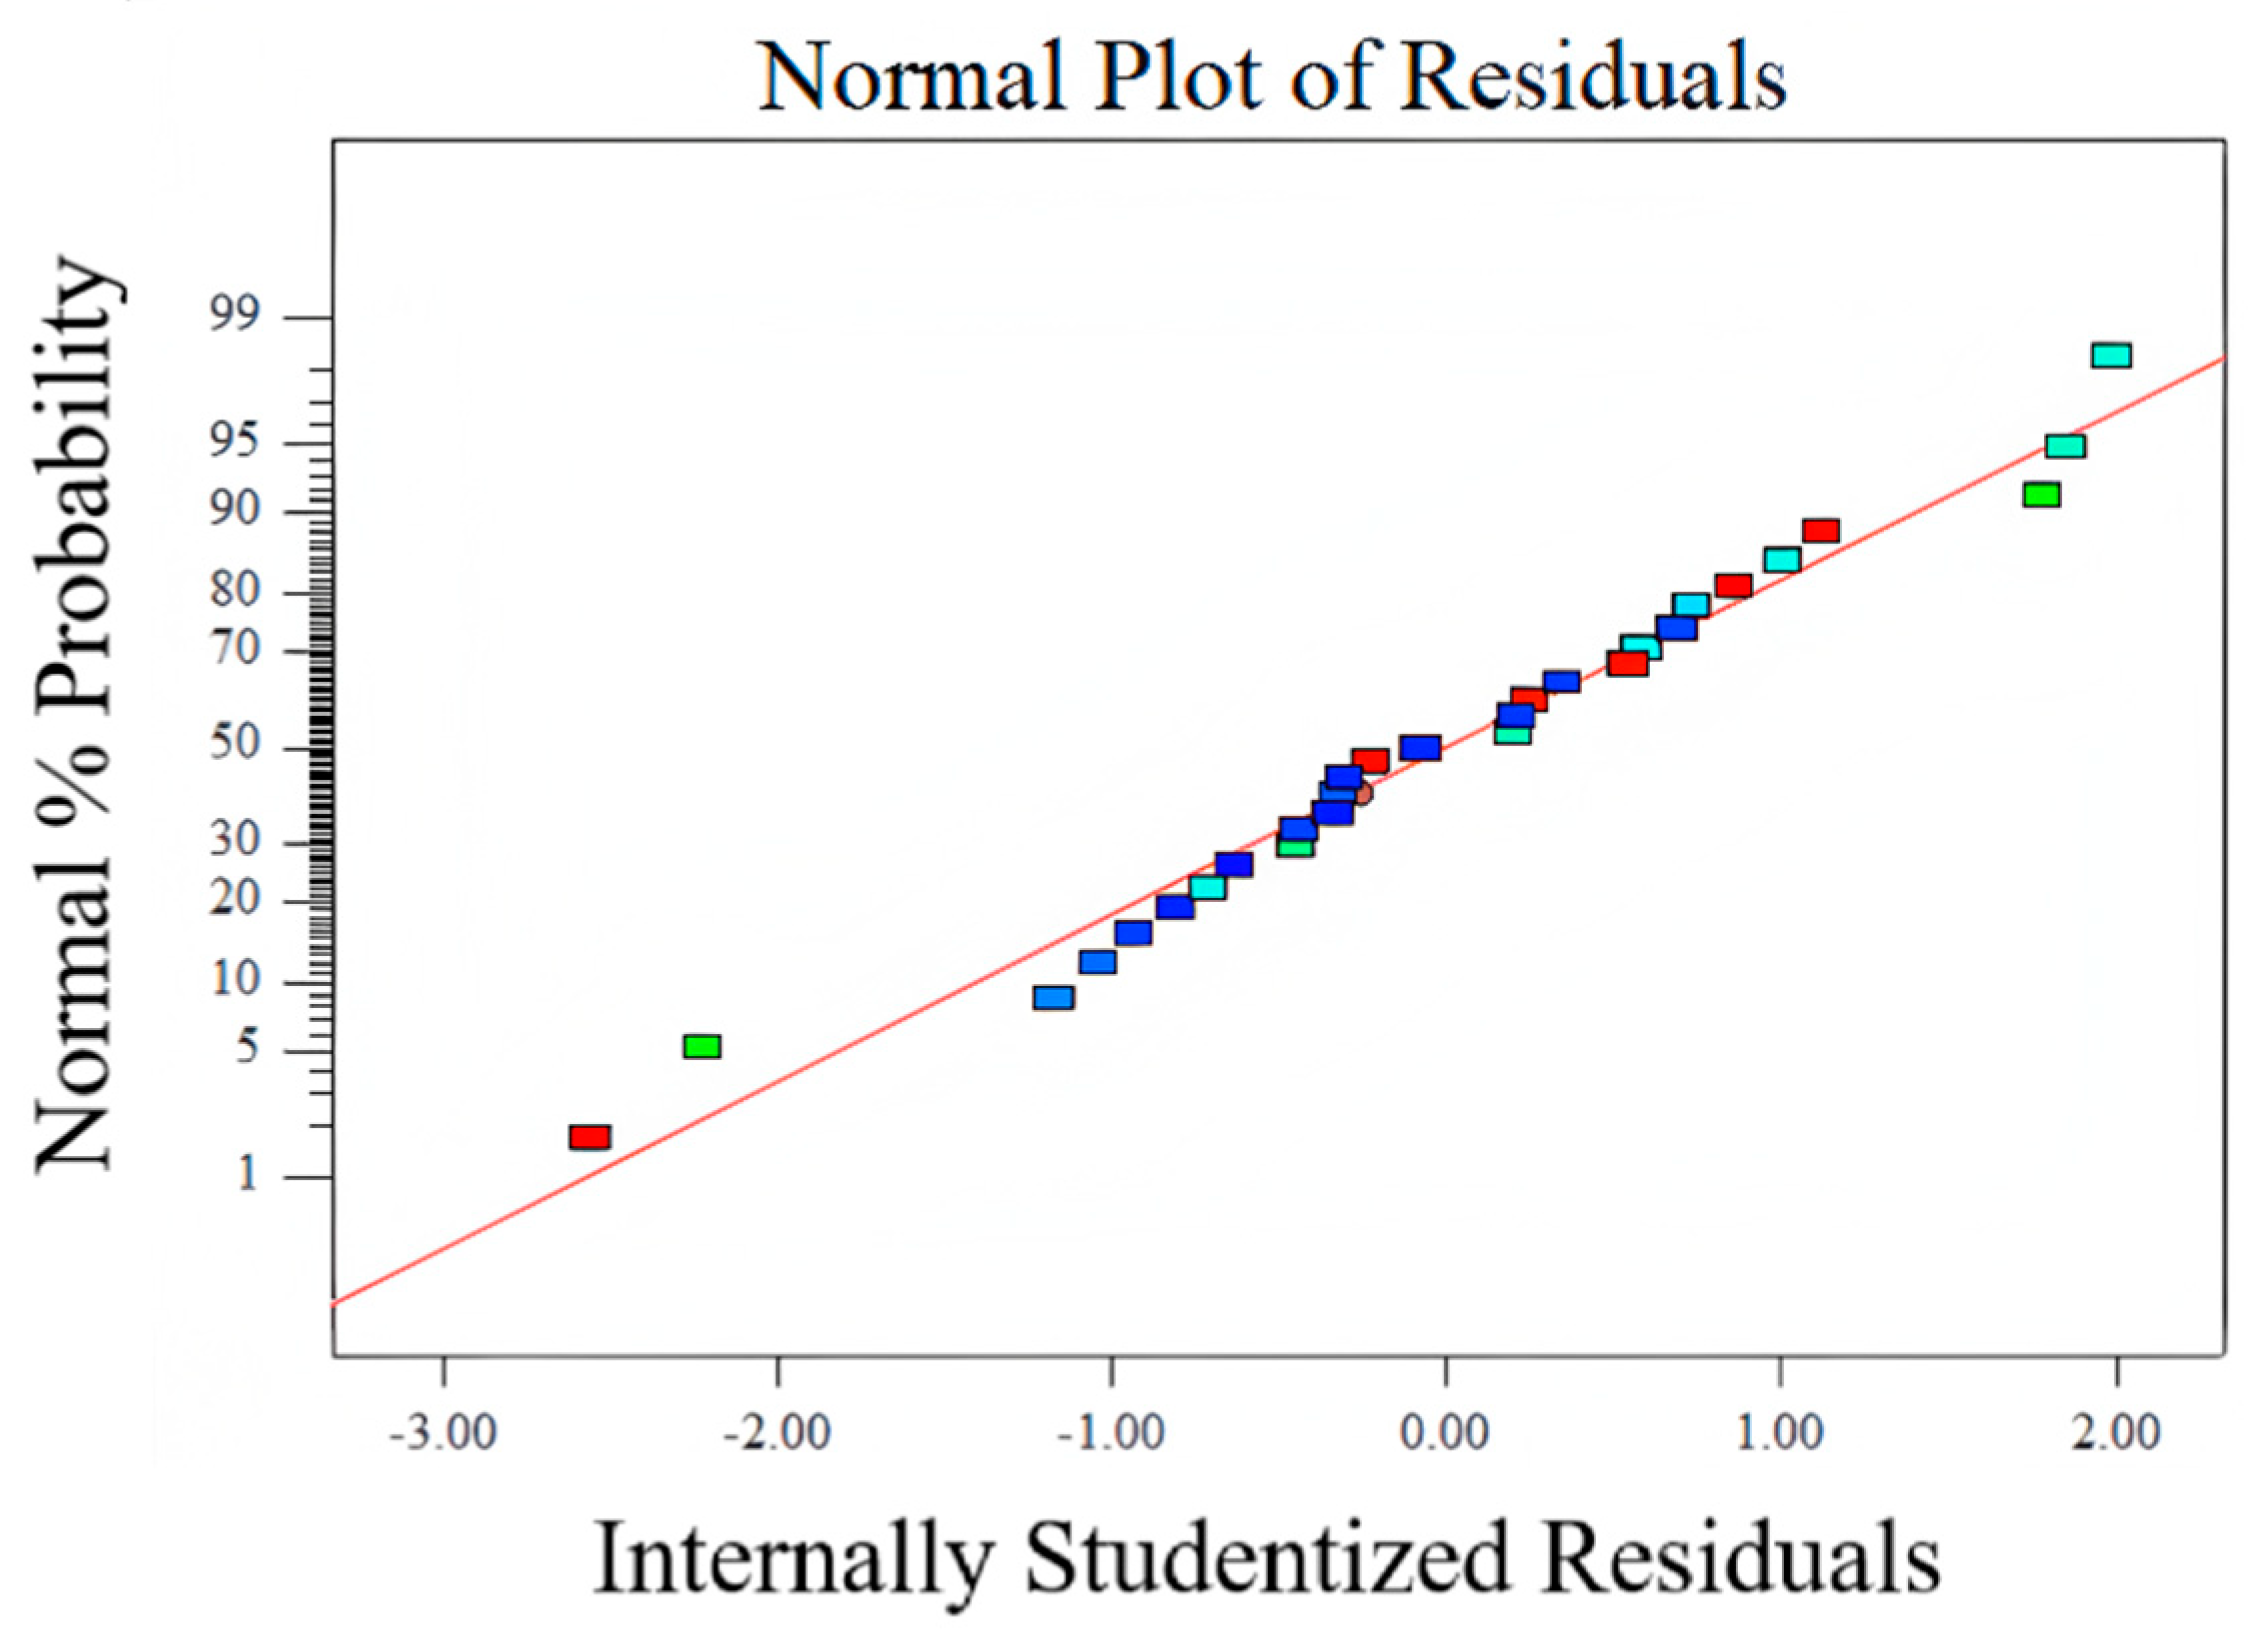
- Variance analysis
- (2)
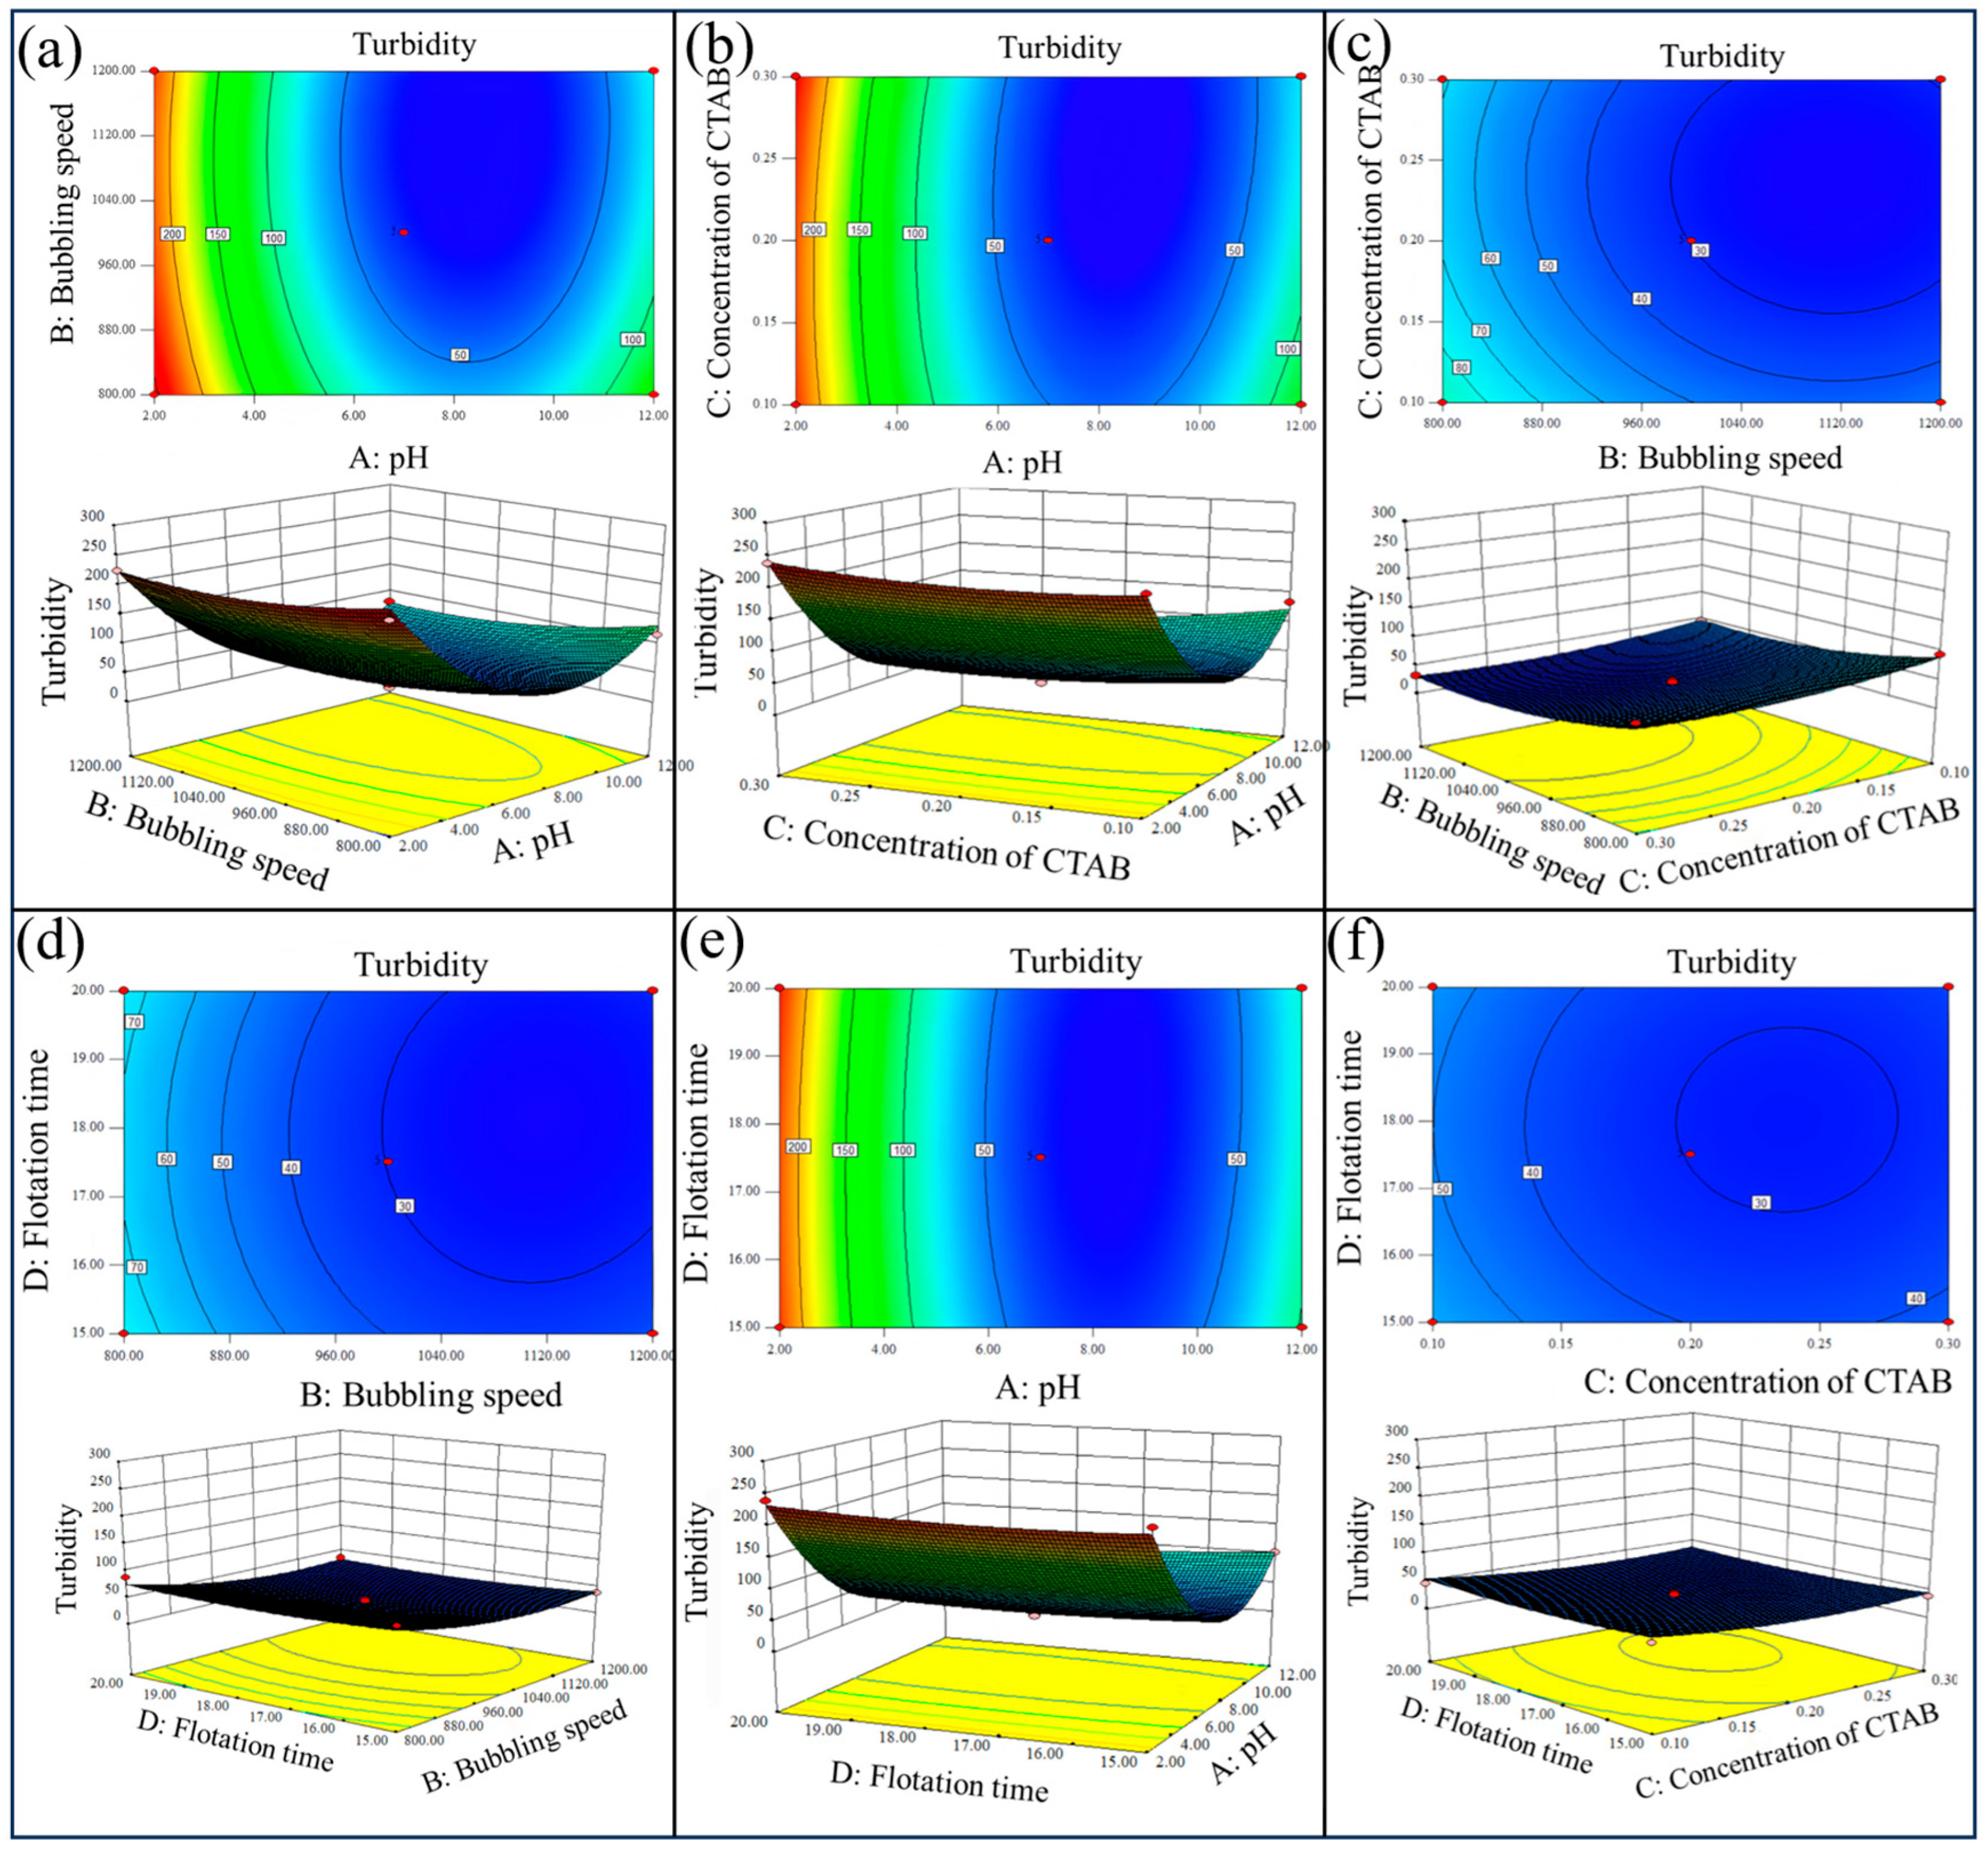
- The influence of flotation operation parameters on the turbidity of the flotation bottom liquid
- (3)
- Verification of optimized conditions
3.6. Adsorption–Flotation Machine
4. Conclusions
5. Future Directions
Author Contributions
Funding
Data Availability Statement
Conflicts of Interest
References
- Vinichuk, M.; Dahlberg, A.; Rosén, K. Cesium (137Cs and 133Cs), potassium and rubidium in macromycete fungi and sphagnum plants. In Radioisotopes—Applications in Physical Sciences; IntechOpen: Rijeka, Croatia, 2011. [Google Scholar]
- Kaczorowska, M.-A. Novel and Sustainable Materials for the Separation of Lithium, Rubidium, and Cesium Ions from Aqueous Solutions in Adsorption Processes—A Review. Materials 2024, 17, 6158. [Google Scholar] [CrossRef]
- Yan, J.; Zhang, B.; Li, J.; Yang, Y.; Wang, Y.-N.; Zhang, Y.-D.; Liu, X.-Z. Rapid and Selective Uptake of Radioactive Cesium from Water by a Microporous Zeolitic-like Sulfide. Inorg. Chem. 2023, 62, 12843–12850. [Google Scholar] [CrossRef] [PubMed]
- Liu, L. Status of Rubidium and Cesium Resources and Technology in China. Xinjiang Nonferrous Met. 2013, 1, 158–165. [Google Scholar]
- Bao, A.; Qian, Z.; Zheng, H.; Liu, Z.-Y.; Huang, D.-F.; Wang, S.-Y.; Li, B. Separation and extraction methods of rubidium and cesium and their research progress. Appl. Chem. Ind. 2017, 46, 1377–1382. [Google Scholar]
- Sun, H.; Bao, Y.; Cao, H.; Zhou, L. Research progress on brine water resources and analysis methods in Qinghai Salt Lake. Guangdong Chem. Ind. 2012, 39, 11–12. [Google Scholar]
- Li, Z.; Pranolo, Y.; Zhu, Z.; Cheng, C.Y. Solvent extraction of cesium and rubidium from brine solutions using 4-tert-butyl-2-(α-methylbenzyl)-phenol. Hydrometallurgy 2017, 171, 1–7. [Google Scholar] [CrossRef]
- Liu, H.; Wang, Y.; Zhang, Q.; Han, W.; Zhang, H.; Ye, X. High-Efficiency Selective Adsorption of Rubidium and Cesium from Simulated Brine Using a Magnesium Ammonium Phosphate Adsorbent. Separations 2024, 11, 277. [Google Scholar] [CrossRef]
- Soliman, M.A.; Rashad, G.M.; Mahmoud, M.R. Fast and Efficient Cesium Removal from Simulated Radioactive Liquid Waste by an Isotope Dilution–precipitate Flotation Process. Chem. Eng. J. 2015, 275, 342–350. [Google Scholar] [CrossRef]
- Yan, M.; Zhong, H.; Zhang, Y. Research Progress on Separation and Extraction of Rubidium and Cesium in Brine. Salt Lake Res. 2006, 14, 67–72. [Google Scholar]
- Li, C.; Li, K.; Li, S.; Ma, R. Efficient Enrichment of Rubidium and Cesium from High-Salt Solution by Copper Hexacyanoferrate Co-Precipitation. ChemistrySelect 2025, 10, e202406007. [Google Scholar] [CrossRef]
- Tan, X.M.; Zhang, L.Z.; Zhang, X.F. Research on Separating Rubidium from Deep Potassium-Rich Old Brine by Solvent Extraction. Appl. Mech. Mater. 2015, 700, 572–575. [Google Scholar] [CrossRef]
- Shi, Z.; Du, X.; Wang, S.; Guo, Y.; Deng, T. Application Status of Rubidium, Cesium and Research Situation of Its Separation from Brine with Solvent Extraction, IOP Conference Series. Mater. Sci. Eng. 2017, 274, 12081–12085. [Google Scholar]
- Wang, Y.; Zhang, Q.; Li, K.; Wang, C.; Fang, D.; Han, W.; Wu, Z. Efficient Selective Adsorption of Rubidium and Cesium from Practical Brine Using a Metal–Organic Framework-Based Magnetic Adsorbent. Langmuir 2024, 40, 9688–9701. [Google Scholar] [CrossRef]
- Wang, G.; Zhang, H.; Qian, W.; Tang, A.; Cao, H.; Feng, W.; Zheng, G. Synthesis and assessment of spherogranular composite tin pyrophosphate antimonate adsorbent for selective extraction of rubidium and cesium from salt lakes. Desalination 2024, 581, 117540. [Google Scholar] [CrossRef]
- Wang, M.; Xu, J.; Zhao, L.; Lin, C.; Gao, J.; Xia, Y. Adsorption of Rubidium/Cesium From Aqueous Solution Using Silane-Modified Prussian Blue-Based Composites. J. Sep. Sci. 2025, 48, e70164. [Google Scholar] [CrossRef] [PubMed]
- Ye, X.; Wu, Z.; Li, W.; Liu, H.; Li, Q.; Qing, B.; Ge, F. Rubidium and cesium ion adsorption by an ammonium molybdophosphate–calcium alginate composite adsorbent. Colloids Surf. A 2009, 342, 76–83. [Google Scholar] [CrossRef]
- Mimura, H.; Wu, Y.; Wang, Y.; Niibori, Y.; Yamagishi, I.; Ozawa, M.; Koyama, S. Selective separation and recovery of cesium by ammonium tungstophosphate-alginate microcapsules. In Proceedings of the 18th International Conference on Nuclear Engineering, Xi’an, China, 17–21 May 2010; pp. 419–427. [Google Scholar]
- Lei, H.; Muhammad, Y.; Wang, K.; Yi, M.; He, C.; Wei, Y.; Fujita, T. Facile fabrication of metakaolin/slag-based zeolite microspheres (M/SZMs) geopolymer for the efficient remediation of Cs+ and Sr2+ from aqueous media. J. Hazard. Mater. 2021, 406, 124292. [Google Scholar] [CrossRef] [PubMed]
- Cardoso, S.-P.; Lito, P.-F.; Rocha, J.; Lin, Z.; Silva, C.-M. Synthesis and permeation properties of small-pore Titanosilicate AM-3 membranes. Procedia Eng. 2021, 44, 926–927. [Google Scholar] [CrossRef]
- Oleksiienko, O.; Wolkersdorfer, C.; Sillanpää, M. Titanosilicates in cation adsorption and cation exchange—A review. Chem. Eng. J. 2017, 317, 570–585. [Google Scholar] [CrossRef]
- Clearfield, A.; Tripathi, A.; Medvedev, D.; Celestian, A.J.; Parise, J.B. In situ type study of hydrothermally prepared titanates and silicotitanates. J. Mater. Sci. 2006, 41, 1325–1333. [Google Scholar] [CrossRef]
- Hu, N.; Liu, W.; Jin, L.; Li, Y.; Li, Z.; Liu, G.; Yin, H. Recovery of trace Cu2+ using a process of nano-adsorption coupled with flotation: SNP as an adsorbing carrier. Sep. Purif. Technol. 2017, 184, 257–263. [Google Scholar] [CrossRef]
- Taşdemir, T.; Başaran, H.K. Removal of suspended particles from wastewater by conventional flotation and floc-flotation. El-Cezeri 2021, 8, 421–431. [Google Scholar] [CrossRef]
- Wang, J.Y.; Wang, L.; Cheng, H.Z.; Runge, K. A comprehensive review on aeration methods used in flotation machines: Classification, mechanisms and technical perspectives. J. Clean. Prod. 2024, 435, 140335. [Google Scholar] [CrossRef]
- Wang, J.; Cao, Y.; Li, G.; Deng, L.; Li, S. Effect of CTAB concentration on foam properties and discussion based on liquid content and bubble size in the foam. Int. J. Oil Gas Coal Eng. 2018, 6, 18–24. [Google Scholar] [CrossRef]
- Koh, P.T.L.; Smith, L.K. The effect of stirring speed and induction time on flotation. Miner. Eng. 2011, 24, 442–448. [Google Scholar] [CrossRef]
- Bai, C.; Guo, M.; Liu, Z.; Wu, Z.; Li, Q. A novel method for removal of boron from aqueous solution using sodium dodecyl benzene sulfonate and D-mannitol as the collector. Desalination 2018, 431, 47–55. [Google Scholar] [CrossRef]
- Ali, M.B.; Kairouani, L. Multi-objective optimization of operating parameters of a MSF-BR desalination plant using solver optimization tool of Matlab software. Desalination 2016, 381, 71–83. [Google Scholar] [CrossRef]
- Ding, D.; Li, K.; Fang, D.Z.; Ye, X.S.; Hu, Y.Q.; Tan, X.L.; Liu, H.N.; Wu, Z.J. Novel biomass-derived adsorbents grafted sodium titanium silicate with high adsorption capacity for Rb+ and Cs+ in the salt lake brine. ChemistrySelect 2019, 4, 13630–13637. [Google Scholar] [CrossRef]


| Level | A: pH | B: Aeration Rate (r min−1) | C: Concentration of CTAB (mmol L−1) | D: Flotation Time (min) |
|---|---|---|---|---|
| −1 | 2 | 800 | 0.1 | 15 |
| 0 | 7 | 1000 | 0.2 | 17.5 |
| 1 | 12 | 1200 | 0.3 | 20 |
| Source of Variance | Square Sum | Degrees of Freedom | Mean Square | F | p | |
|---|---|---|---|---|---|---|
| Model | 1.693 × 10⁵ | 14 | 12,094.30 | 132.50 | <0.0001 | significant |
| A-pH | 52,357.84 | 1 | 52,357.84 | 573.59 | <0.0001 | |
| B-Bubbling speed | 6904.80 | 1 | 6904.80 | 75.64 | <0.0001 | |
| C-Concentration of CTAB | 741.04 | 1 | 741.04 | 8.12 | 0.013 | |
| D-Flotation time | 48.80 | 1 | 48.80 | 0.53 | 0.48 | |
| AB | 435.77 | 1 | 435.77 | 4.77 | 0.047 | |
| AC | 432.64 | 1 | 432.64 | 4.74 | 0.047 | |
| AD | 131.10 | 1 | 131.10 | 1.44 | 0.25 | |
| BC | 52.20 | 1 | 52.20 | 0.57 | 0.46 | |
| BD | 9.15 | 1 | 9.15 | 0.10 | 0.76 | |
| CD | 0.39 | 1 | 0.39 | 4.279 × 10⁻³ | 0.95 | |
| A2 | 1.052 × 10⁵ | 1 | 1.052 × 10⁵ | 1152.63 | <0.0001 | |
| B2 | 2270.46 | 1 | 2270.46 | 24.87 | 0.0002 | |
| C2 | 671.92 | 1 | 671.92 | 7.36 | 0.017 | |
| D2 | 254.62 | 1 | 254.62 | 2.79 | 0.12 | |
| Residual | 1277.93 | 14 | 91.28 | |||
| Lack of Fit | 1176.75 | 10 | 117.67 | 4.65 | 0.076 | not significant |
| Pure Error | 101.18 | 4 | 25.30 |
Disclaimer/Publisher’s Note: The statements, opinions and data contained in all publications are solely those of the individual author(s) and contributor(s) and not of MDPI and/or the editor(s). MDPI and/or the editor(s) disclaim responsibility for any injury to people or property resulting from any ideas, methods, instructions or products referred to in the content. |
© 2025 by the authors. Licensee MDPI, Basel, Switzerland. This article is an open access article distributed under the terms and conditions of the Creative Commons Attribution (CC BY) license (https://creativecommons.org/licenses/by/4.0/).
Share and Cite
Fang, D.; Liu, H.; Ye, X.; Wang, Y.; Han, W. Extraction of Rubidium and Cesium Ions by Adsorption–Flotation Separation in Titanosilicate-Hexadecyltrimethylammonium Bromide System. Separations 2025, 12, 181. https://doi.org/10.3390/separations12070181
Fang D, Liu H, Ye X, Wang Y, Han W. Extraction of Rubidium and Cesium Ions by Adsorption–Flotation Separation in Titanosilicate-Hexadecyltrimethylammonium Bromide System. Separations. 2025; 12(7):181. https://doi.org/10.3390/separations12070181
Chicago/Turabian StyleFang, Dezhen, Haining Liu, Xiushen Ye, Yanping Wang, and Wenjie Han. 2025. "Extraction of Rubidium and Cesium Ions by Adsorption–Flotation Separation in Titanosilicate-Hexadecyltrimethylammonium Bromide System" Separations 12, no. 7: 181. https://doi.org/10.3390/separations12070181
APA StyleFang, D., Liu, H., Ye, X., Wang, Y., & Han, W. (2025). Extraction of Rubidium and Cesium Ions by Adsorption–Flotation Separation in Titanosilicate-Hexadecyltrimethylammonium Bromide System. Separations, 12(7), 181. https://doi.org/10.3390/separations12070181