Article

Surface Properties of NaCl and KCl in a Potassium−Sodium-Saturated System with Low-Natrium Salt

1
Key Laboratory of Comprehensive and Highly Efficient Utilization of Salt Lake Resources, Qinghai Institute of Salt Lakes, Chinese Academy of Sciences, Xining 810008, China
2
Key Laboratory of Salt Lake Resources Chemistry of Qinghai Province, Xining 810008, China
3
University of Chinese Academy of Sciences, Beijing 100190, China
4
Salt Lake Chemical Analysis & Test Center, Qinghai Salt Lake Research Institute, Chinese Academy of Sciences, Xining 810008, China
*
Author to whom correspondence should be addressed.
Separations 2025, 12(5), 131; https://doi.org/10.3390/separations12050131
Submission received: 20 February 2025 / Revised: 10 April 2025 / Accepted: 26 April 2025 / Published: 16 May 2025
(This article belongs to the Special Issue Green and Efficient Separation and Extraction of Salt Lake Resources)

Abstract

:
With the continuous development of the potash industry in salt lakes, the preparation of low-natrium salt for the green and environmentally friendly utilization of potassium and sodium resources in salt lakes has become a research hotspot. The primary method involves obtaining potassium brine from salt-lake brine through evaporation and then subjecting this mineral to transformation crystallization to obtain low-natrium salt crystals. In the crystallization vessel, a potassium−sodium-saturated solution is introduced, followed by the addition of an appropriate amount of water and solid magnesium chloride. After a thorough reaction, the solid−liquid separation yields the target product of low-natrium salt. Subsequently, the surface properties of KCl and NaCl crystals were calculated using first-principles methods. The research findings revealed that potassium chloride crystals, when they contained defects, readily adsorbed Na+ and NaCl. In a sodium−potassium-saturated system, KCl and NaCl easily formed heterojunctions, leading to embedded crystallization as the Mg2+ concentration increased in this saturated system. Feed rate and residence time directly affect the purity of low-natrium salt. A low-natrium salt meeting the requirements can be obtained after a residence time of more than 80 min under the following conditions.

1. Introduction

China, an agricultural giant with a population of 1.3 billion, is a severely potassium-deficient country. It has a high annual consumption of potash fertilizers and spends a substantial amount of foreign exchange on their import [1,2,3]. In Qinghai Province, the potassium resource reserves in major salt lakes such as Great Qaidam Salt Lake, Kunteyi Salt Lake, East (West) Tai Salt Lake, and Chaka Salt Lake have all reached industrial extraction levels [4,5]. Initially, potassium chloride was produced from chloride-type salt lakes. Since the late 20th century, the development of potassium sulfate products has been initiated in some salt-lake areas, and several companies have established potassium sulfate production lines at various scales. However, because of the low potassium recovery rates and high production costs, these production lines are currently in a state of suspension. As the current selling price of potassium sulfate products is similar to that of potassium chloride products, some companies have started to shift their production toward potassium chloride products [6,7,8].
Sylvinite ore is the primary raw materials needed to produce potassium chloride. Sylvinite is a type of incongruent complex salt. Sylvinite ore obtained from chloride-type salt lakes through solar evaporation is primarily composed of sylvinite and sodium chloride, and extensive research has been conducted on the process of mineral decomposition and water addition for these minerals. In the Qaidam Basin salt lakes, the primary subtype is magnesium sulfate. The initial raw material is brine with a magnesium sulfate subtype, and sylvinite ore is obtained through solar evaporation. Apart from sylvinite and sodium chloride, this sylvinite ore also contains magnesium sulfate. Potassium chloride and other products like potassium−magnesium alum are obtained through decomposition, conversion, and flotation processes. Research on the decomposition process of sylvinite ore is not comprehensive, and the decomposition process is a crucial factor for ensuring flotation recovery. As show in Figure 1, the crystallization route during the late stage of evaporation typically ranges from Zf-1 to Zf-5. In this stage, the main mineral obtained is sylvinite ore. It is used as a raw material and is subjected to decomposition and transformation with the addition of the appropriate amount of water in order to obtain low-natrium salt products. However, NaCl and KCl in the system interact with each other, leading to a relatively high sodium content in the low-natrium salt, causing the sodium-to-potassium ratio to fail to meet the specific requirements. The standard for low-natrium salt is QB/T-2019–2020 (NaCl 65.0–80.0%, KCl 20.0–35.0%, particle size greater than 150 μm), which includes both purity and particle size requirements. Examining the crystallization behavior of KCl and NaCl in the system provides technical support for improving the utilization of salt-lake potassium resources. The UK Food Standards Agency and the World Action on Salt and Health, among others, advocate for the practical use of low-natrium salt [9]. Excessive sodium intake can lead to various diseases such as hypertension. Using low-natrium salt as a substitute for regular table salt [10] and transitioning from a high-salt to a milder diet causes a gradual reduction in salt intake, resulting in a healthy lifestyle [11,12]. Therefore, developing low-cost industrial technologies for low-natrium salt production, creating an eco-friendly low-natrium salt brand in Qinghai Province, and standing out in fierce market competition will provide technical support to build a world-class salt-lake industry. In current industrial production, the impact of sodium chloride is commonly addressed by washing or attempting to maintain a higher K+ content in the tailings during flotation. This leads to complex processes and severe waste of potassium resources.
Meanwhile, research on the advantageous crystal interface properties of KCl and NaCl is lacking for this process. The heterojunction structure of BiOIO3/{110}BiOCl is conducive to the separation of photogenerated charge carriers [13,14]. The drying process, selective etching process, and annealing process are essential for the fabrication of Gr-to-Si heterojunction devices [15]. EPE-film heterojunction photovoltaic modules exhibit excellent weather resistance and reliability [16]. Low-natrium salt (70% NaCl and 30% KCl) is the primary reason for improving the rheological properties of dough, affecting the dough formation and characteristics [17]. Polyethylene glycol regulates the decomposition crystallization of sylvinite, thus controlling the crystallization behavior of low-natrium salt [18]. However, there has not been any relevant research on the surface behavior of low-natrium salt in saturated systems.
Currently, VASP has been widely used for computing the structural properties, material microstructure simulations, and atomic and electronic structure analysis of materials [19,20,21,22,23]. Nevertheless, there are limited research reports on the relevant issues concerning the interfacial properties of salt-brine systems. This is because of the complexity of salt-brine systems, which have intricate interactions and effects among coexisting ions. The existing literature cannot provide a comprehensive prediction and understanding of these processes. Therefore, this study employs the VASP computational method to investigate the crystallization and surface behavior of KCl and NaCl in salt-brine systems, along with their underlying mechanisms, providing theoretical support for the efficient utilization of salt-lake resources.

2. Experimental Methods and Materials

2.1. Experimental Materials

The chemical composition of sodium- and potassium-saturated solutions, used as experimental raw materials in research, is shown in Table 1.

2.2. Experimental Methods

A certain amount of KCl, NaCl saturated solution, and MgCl2·6H2O are introduced into the crystallizer at a specific rate. As the concentration of Mg2+ continuously increases, KCl crystallizes out of the saturated system. The morphology, content, and particle size of these crystals are examined. After complete reaction and transformation crystallization, the reactants are separated into solid and liquid. The solid represents the low-natrium salt product, which is further subjected to relevant analysis and characterization. Figure 2 shows the experimental schematic. At the same time, VASP software was used to study the surface properties of KCl crystals and NaCl crystals, and to explain the mechanism of their crystallization process.

3. Results and Discussions

3.1. The Effect of Feed Rate on Low-Natrium Salt

3.1.1. Study on the Impact of the Feeding Method on Low-Natrium Salt

The literature indicates that supersaturation directly affects the particle size of the product [24,25,26]. We conduct a comparative study on the effect of feed rate on crystalline products. Reactants are introduced into the crystallization vessel all at once, and after sieving, the particle size distribution is shown in Table 2 and the composition content is shown in Table 3.
The findings in Table 2 and Table 3 indicate that the proportion of low-natrium salt with particle sizes greater than 150 μm obtained from one-time feeding is too small, all of which are less than 10%. Therefore, in the following experimental plan, for the feed rate of MgCl2·6H2O and K+, the Na+//Cl-H2O-saturated solutions will be controlled, with the feed rates set at 10 mL·min−1 and 30 mL·min−1. For the feed rate of K+, the Na+//Cl-H2O-saturated solution is 10 mL·min−1. The particle size distribution is shown in Table 4, and the content analysis is presented in Table 5.
Table 4 and Table 5, along with Figure 3, demonstrate that when the feed rate of MgCl2·6H2O is set at 30 g·min−1, the proportion of low-natrium salt crystals with a particle size greater than 150 μm is 70.86%. However, when the feed rate is reduced to one-third, the proportion of low-natrium salt crystals with a particle size greater than 150 μm increases to 93.50%, representing a 20% increase. Therefore, the experimental results suggest that one-time feeding does not achieve the desired low-natrium salt effect. It is necessary to control the feed rate, and a feed rate of 10 g·min−1 for MgCl2·6H2O and a feed rate of 10 mL·min−1 for K+, Na+//Cl-H2O-saturated solutions can yield the ideal low-natrium salt product.

3.1.2. Continuous Crystallization Experimental Study

Feed rates for continuous crystallization experiments: Control the feed rate of MgCl2·6H2O at 10 g·min−1 and the feed rate of K+, for the Na+//Cl-H2O-saturated solution at 10 mL·min−1.
Drainage methods are shown in Table 6 and particle size distribution curves are shown in Figure 4 and Figure 6.
The continuous crystallization experiment, as indicated by the particle size analysis, demonstrates that after a residence time of 80 min, the proportion of low-natrium salt with a particle size greater than 150 μm exceeds 85%. In other words, after a residence time exceeding 80 min, the continuous crystallization process becomes stable, and the proportion of low-natrium salt consistently meets the requirements. The low-natrium salt content in continuous crystallization L1 is shown in Table 7.
To examine the crystal morphology of KCl, scanning electron microscopy (SEM) and energy-dispersive X-ray spectroscopy (EDS) are used to characterize the minerals after crystallization. Comparing Figure 5a,b, it can be observed that the surface of KCl crystals is relatively smooth, but there are significant defects in certain areas of the crystals. The comparison in Figure 5c,d reveals that KCl and NaCl crystals exhibit a pronounced tendency to embed into each other in the presence of defects. While some researchers have investigated the addition of dispersants to reduce the embedding crystallization of KCl and NaCl crystals [27], no explanation has been provided for the crystallization mechanism within the K+, Na+, Mg2+//Cl-H2O-saturated system. Therefore, this study examines the surface properties of KCl crystals and NaCl crystals to investigate the surface behavior and patterns exhibited within this system.

3.2. Study of the Surface Properties of Potassium Chloride

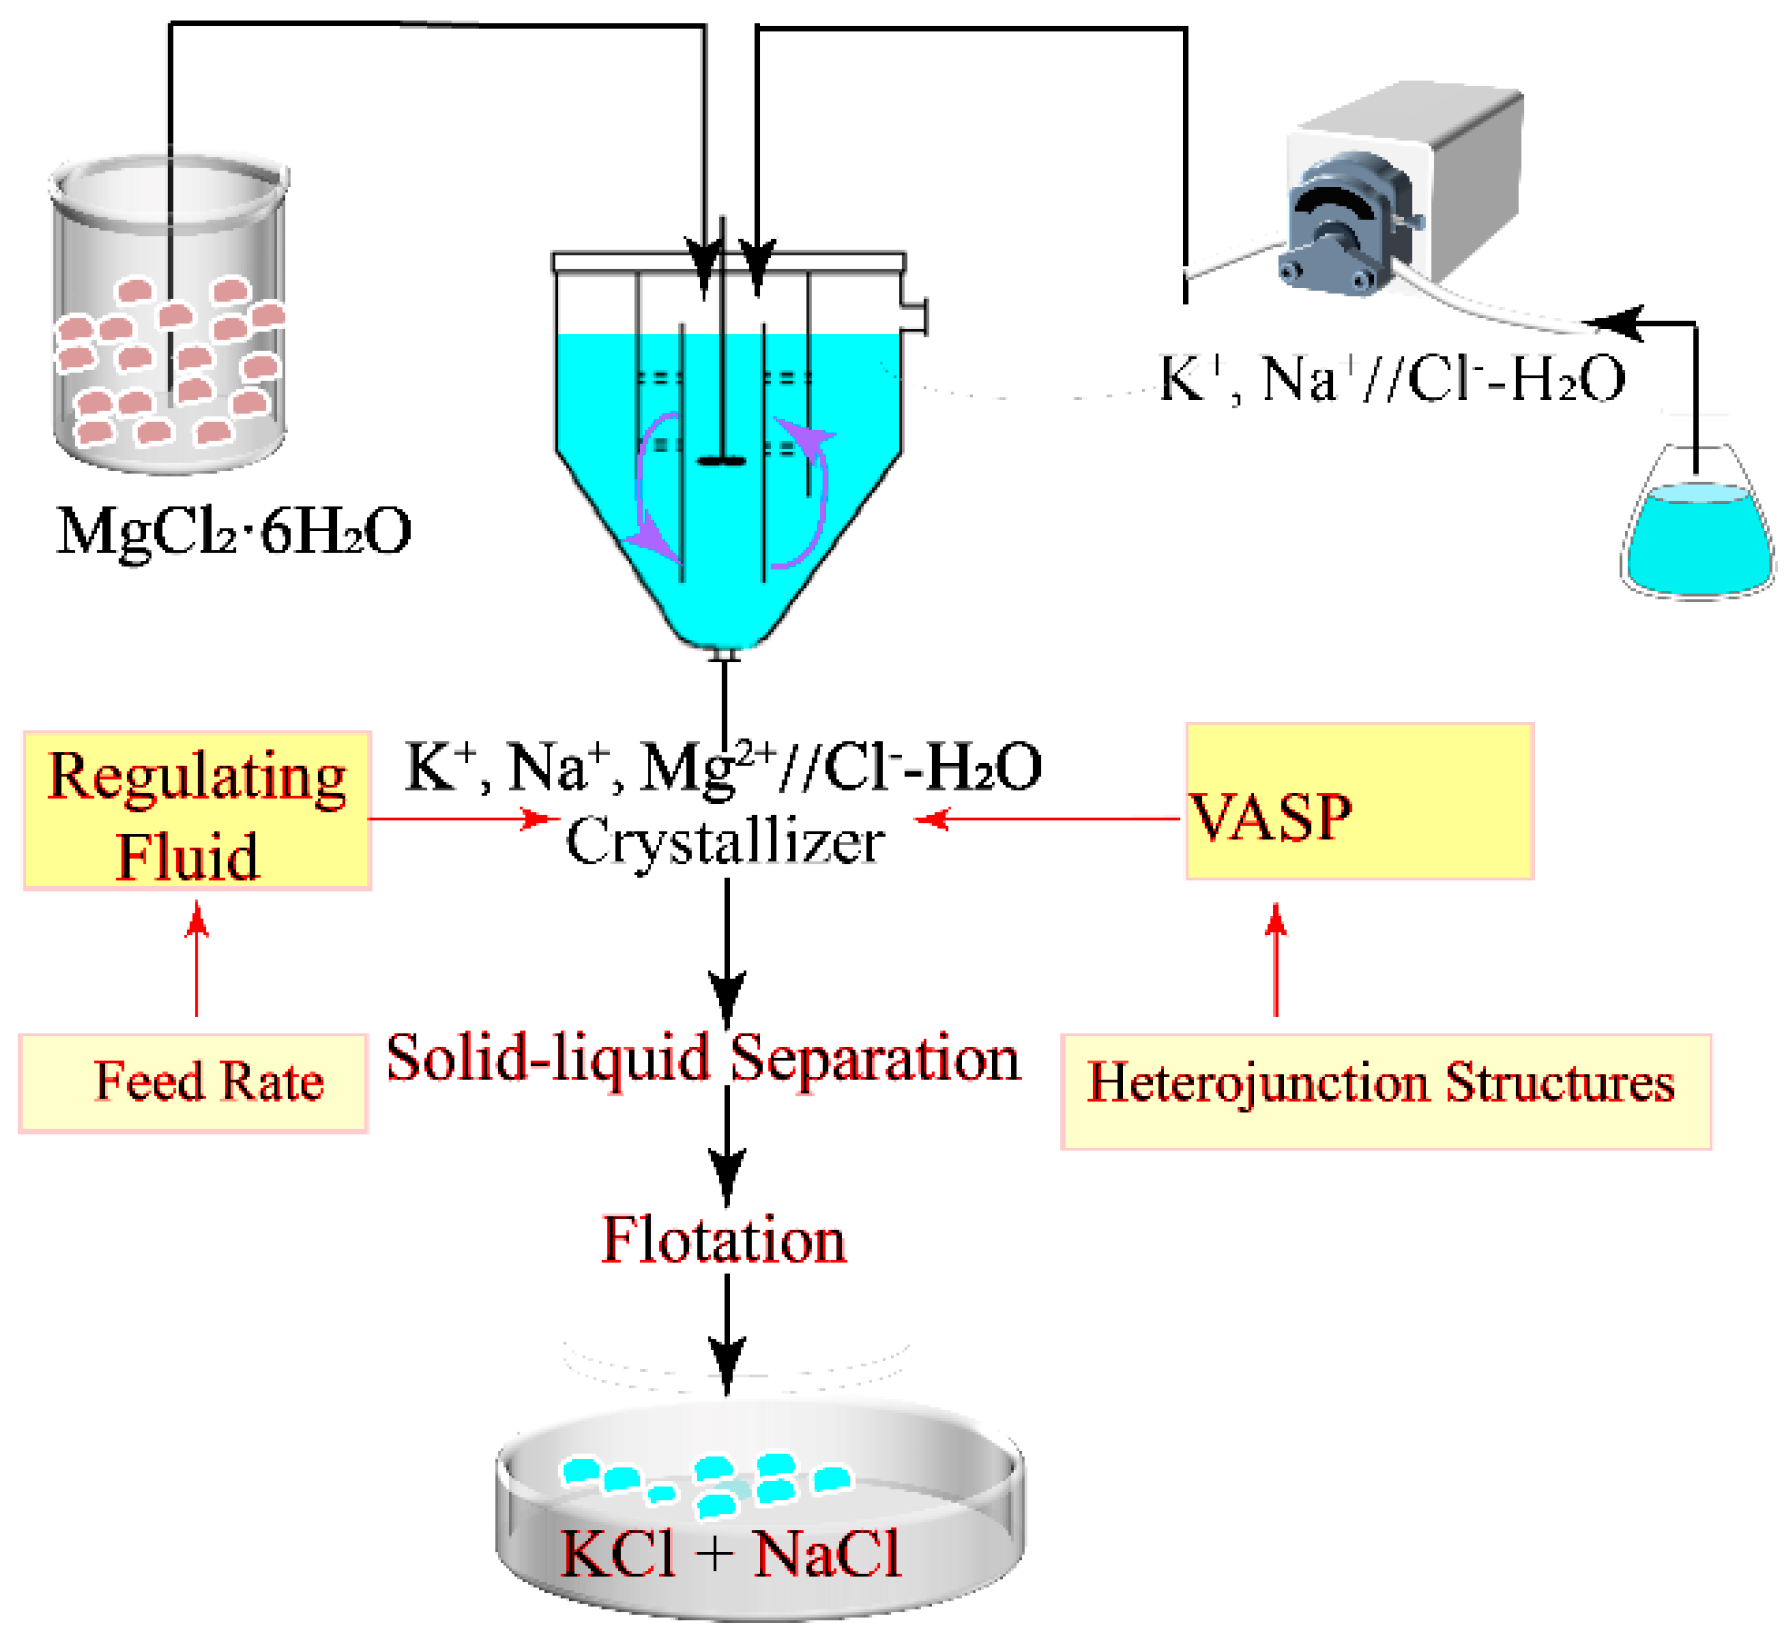
3.2.1. VASP Calculation Model and Its Method

(1)
Methodology
The calculations are implemented using VASP code [28]. The calculation of the correlation potentials is conducted using the GGA-PBE functional [29]. A Weak van der Waals interaction is considered using the DFT-D3 functional [30]. The cut-off energy for the plane-wave is 400 eV. The Gamma point in the Brillouin-zone is chosen for the integration. The total energies of the systems converge to 10−5 eV in the iteration solution of the Kohn−Sham equation. The optimized force per atom is 0.05 eV/Å.
(2)
Model Construction
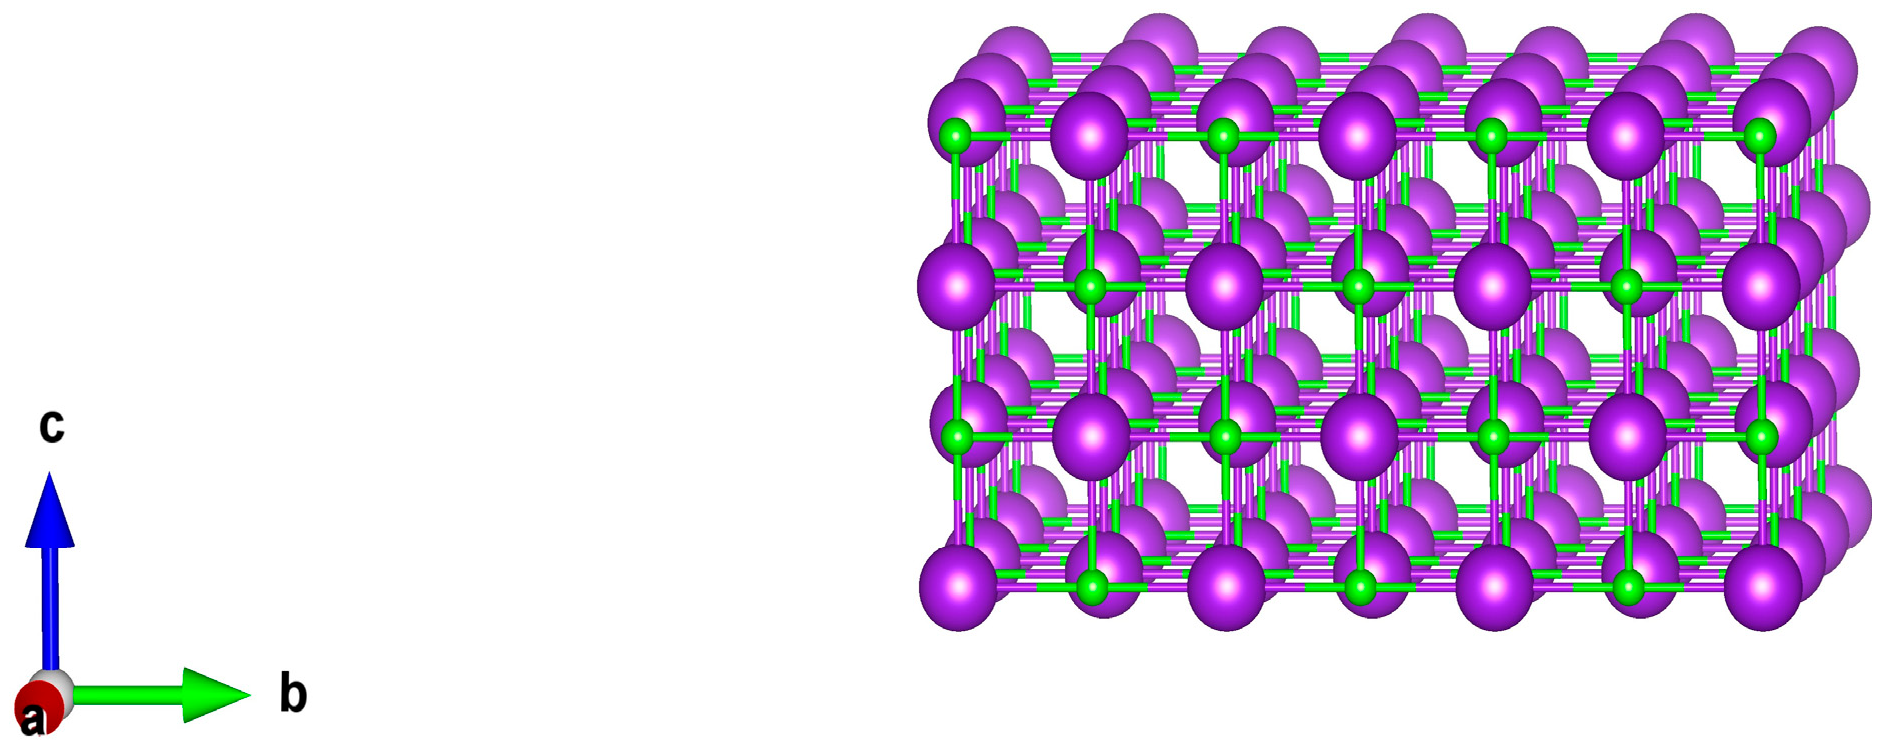
Firstly, the optimized crystal structure of KCl is shown in Table 8. After optimization, the lattice parameters are similar to the experimental values and the model is reliable. Comparative results are shown in Figure 5.
(3)
Adsorption energy calculation
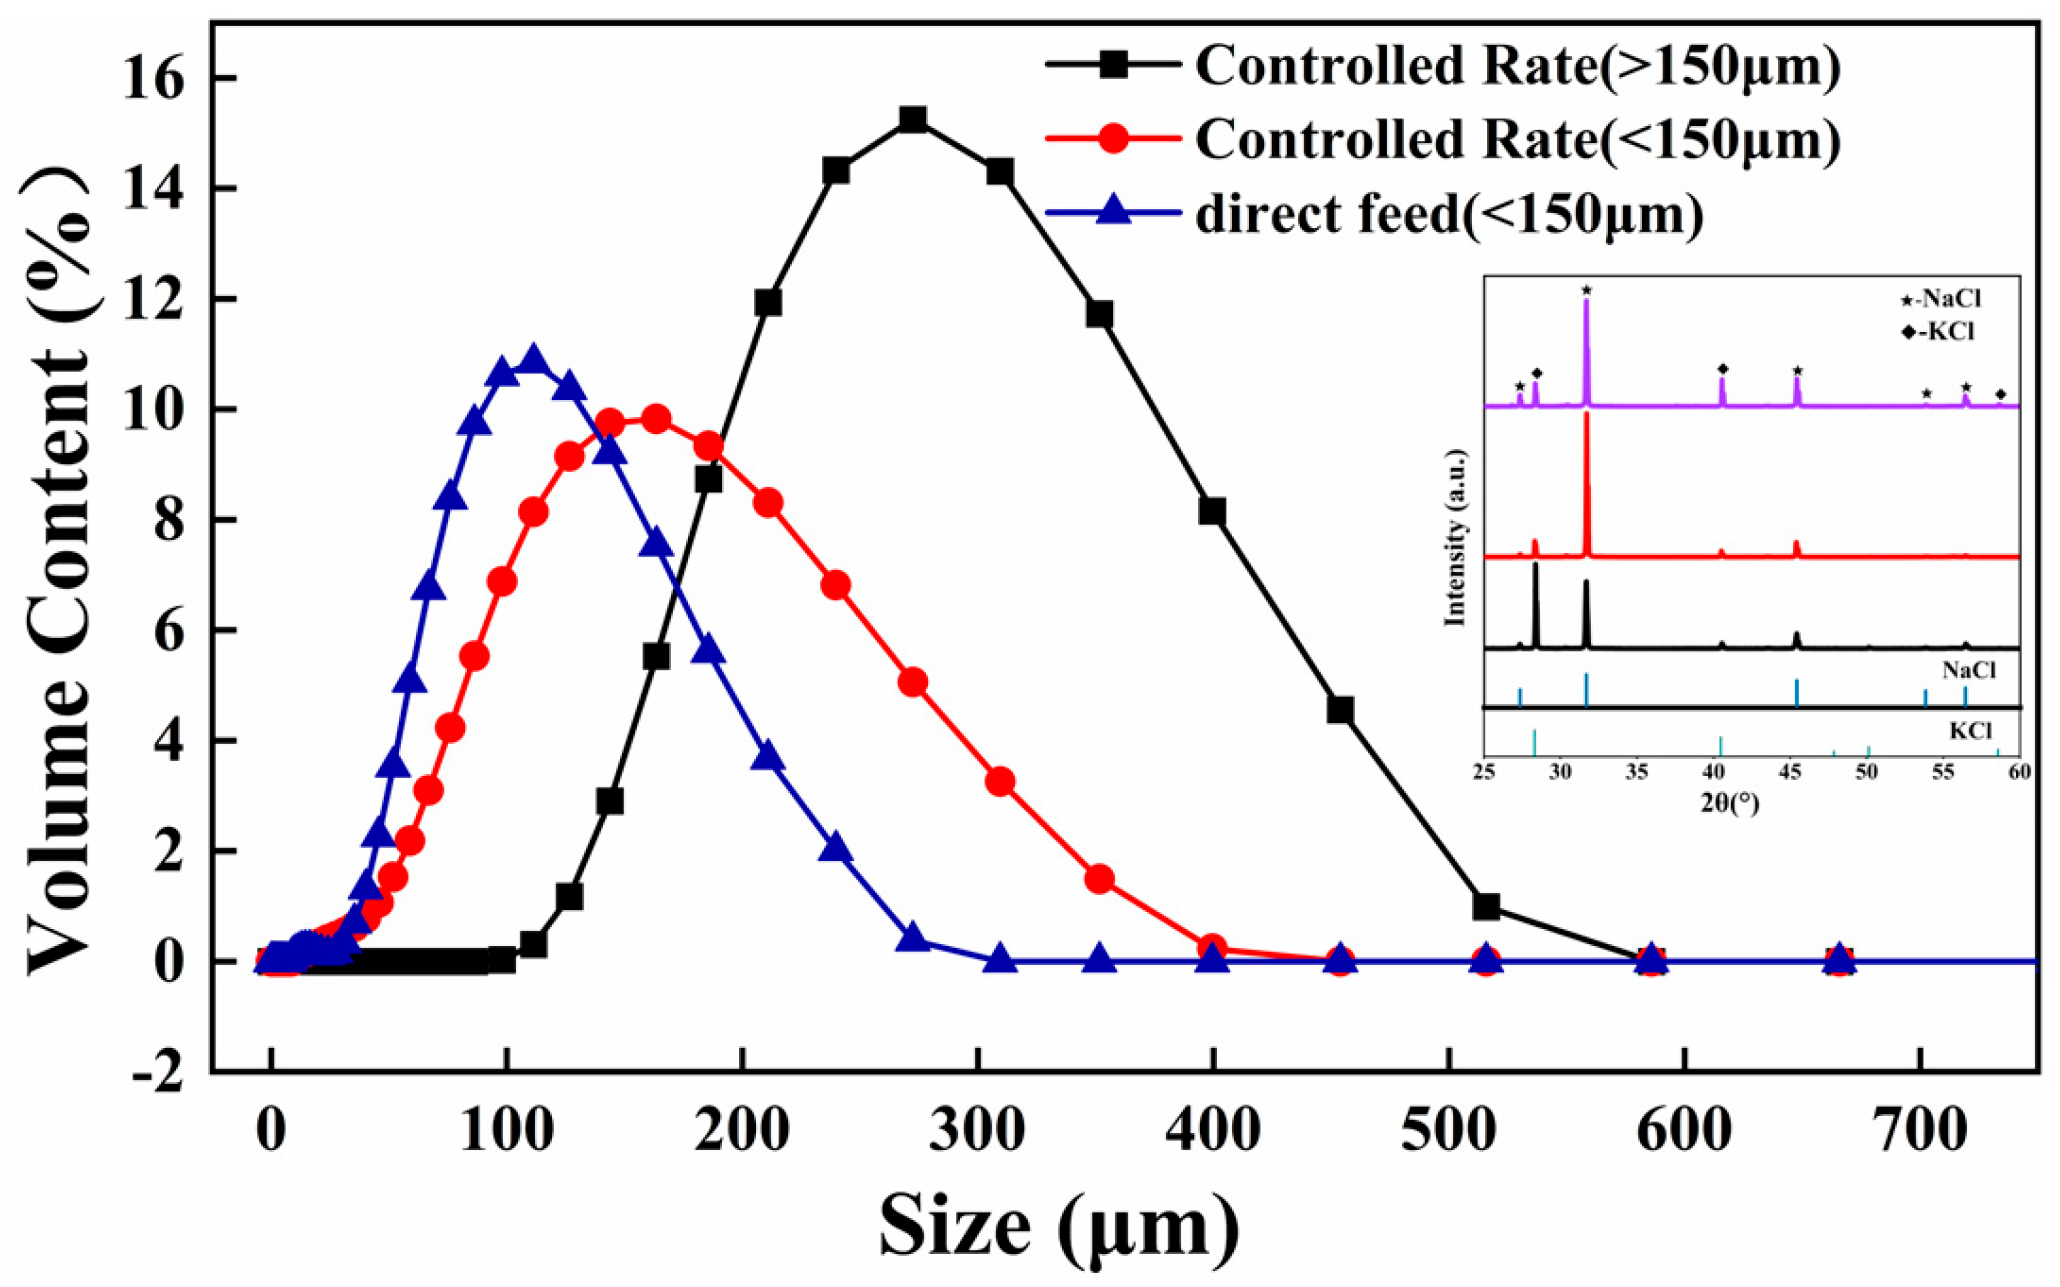
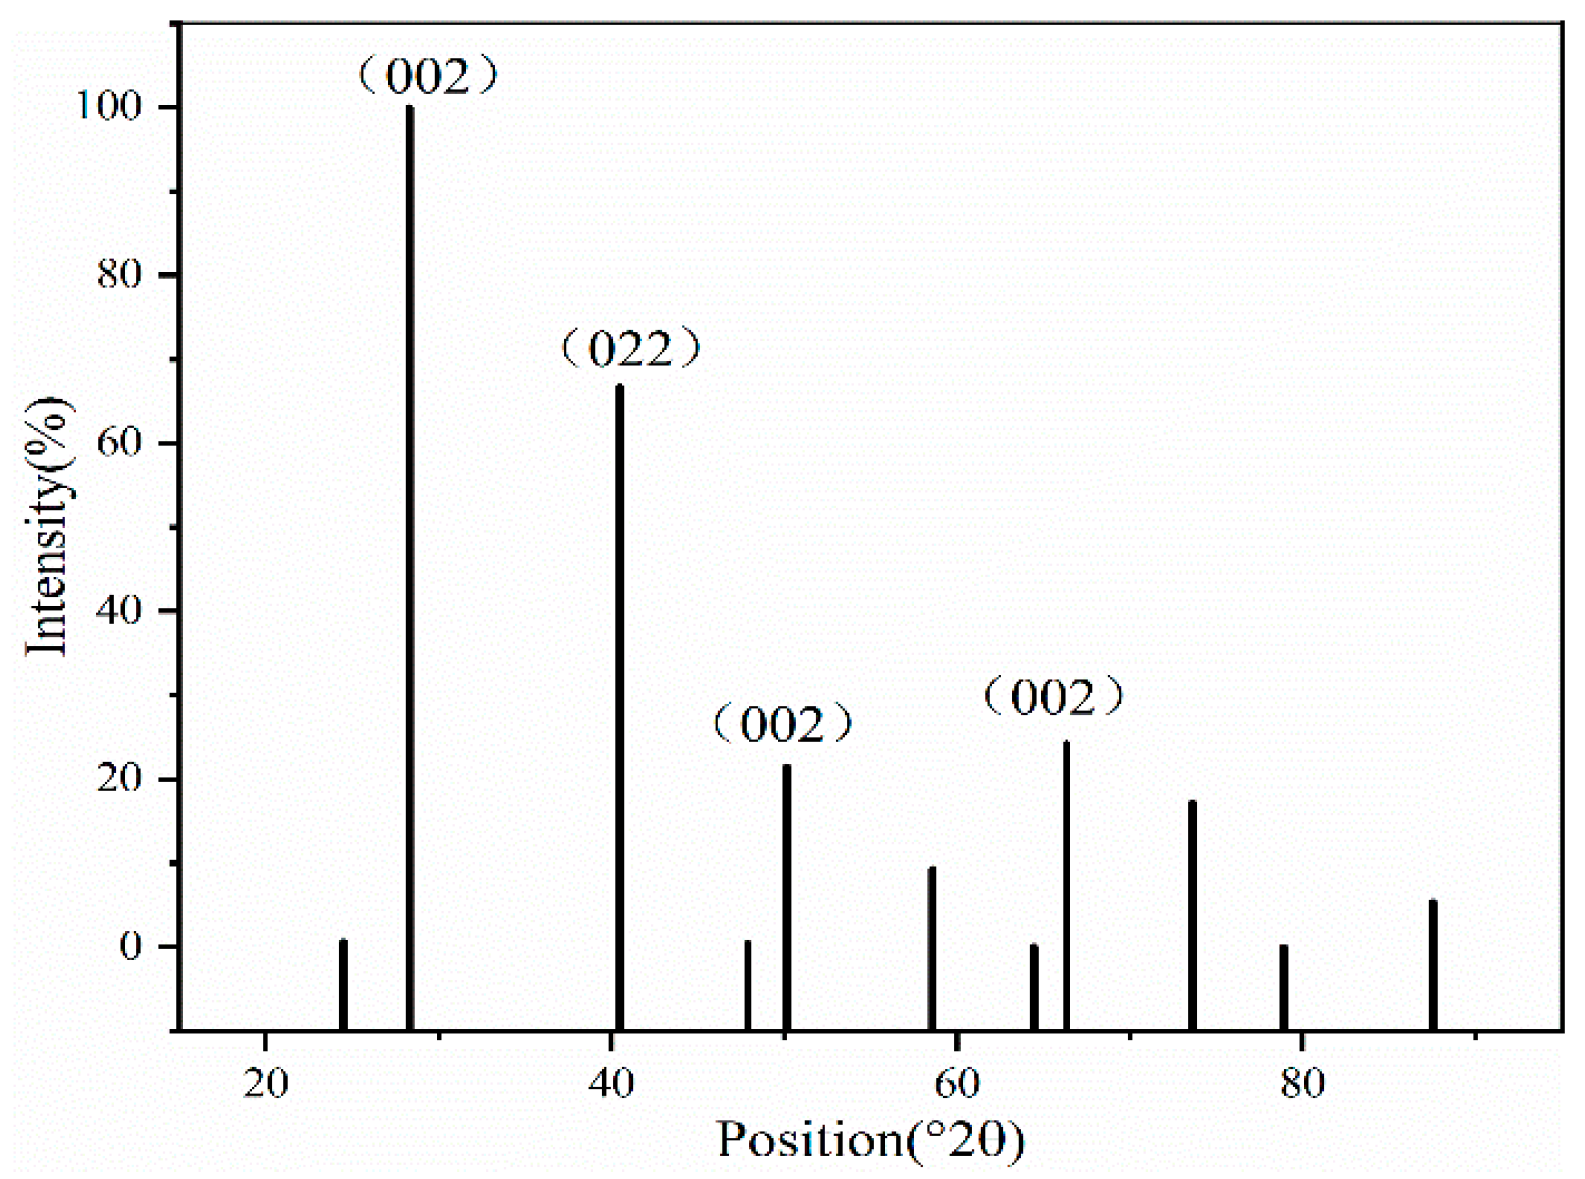
The XRD patterns of the KCl crystal during brine evaporation are shown in Figure 6 and Figure 7. The adsorption behavior of Na+ on the KCl (002) surface of each crystal of KCl is calculated and analyzed using the first-nature principle to examine the adsorption intensity of Na+ on the crystal surfaces. The crystal face model is constructed from the supercell structure of the crystal, fixing the atoms at the bottom of the surface of each of its faces, and adding a 15 Å thick vacuum layer in the Z-direction of the crystal face to prevent the neighboring layers from interacting with each other and affecting the results. Refs. [31,32] is defined as shown in Equation (1):
E ads = E s u r f a c e + a b s o r b a t e ( E s u r f a c e + E a b s o r b a t e )
Eads is the adsorption energy; Esurface+absorbate refers to total energy of absorbate on the crystal surface. Esurface—is the crystal surface energy; Eabsorbate is the energy of the adsorbed substance. According to this definition, negative values indicate exothermic and favorable adsorption processes, positive values indicate adsorptive and unfavorable adsorption processes [33].
(4)
Defect formation energy calculation
Defect formation can be used to assess the stability of the material defects. Formation energy is used to determine the stability of the doped system [34].
The formation energy of the Na atom replacing the K atom and Na atom in KCl crystal and NaCl crystals (2) [35,36]:
Δ H = E ( D ) E ( p ure ) μ N a + μ K
where E(D) is the total energy of system containing defect D; E(pure) is the total energy of the system with intact cells; μK, μNa denote the chemical potentials of K atom and Na atom, respectively.
The formation energy of Na atoms in the interstitial sites of KCl crystals and NaCl crystals (3) [35,36]:
Δ H = E ( D , q ) E ( p ure ) μ N a + q ( E V B M + E F )
where E(D) is the total energy of the system with defect D in charge state q; E(pure) is the total energy of the system with intact cell; EVBM is the valence band top of the defect-free system; EF is the Fermi energy level; and μNa denotes the K atomic chemical potential. The chemical potential of the Na atom in an Na-rich environment is (4):
μ Na E ( N a )
The chemical potential of the Na atom in an Na-poor environment is (5):
μ Na [ E ( N a C l ) 1 2 E ( 2 C l ) ]
where E represents the energy of various bulk materials. Na-rich and Na-poor environments are those with the highest and lowest Na atomic chemical potentials, respectively.

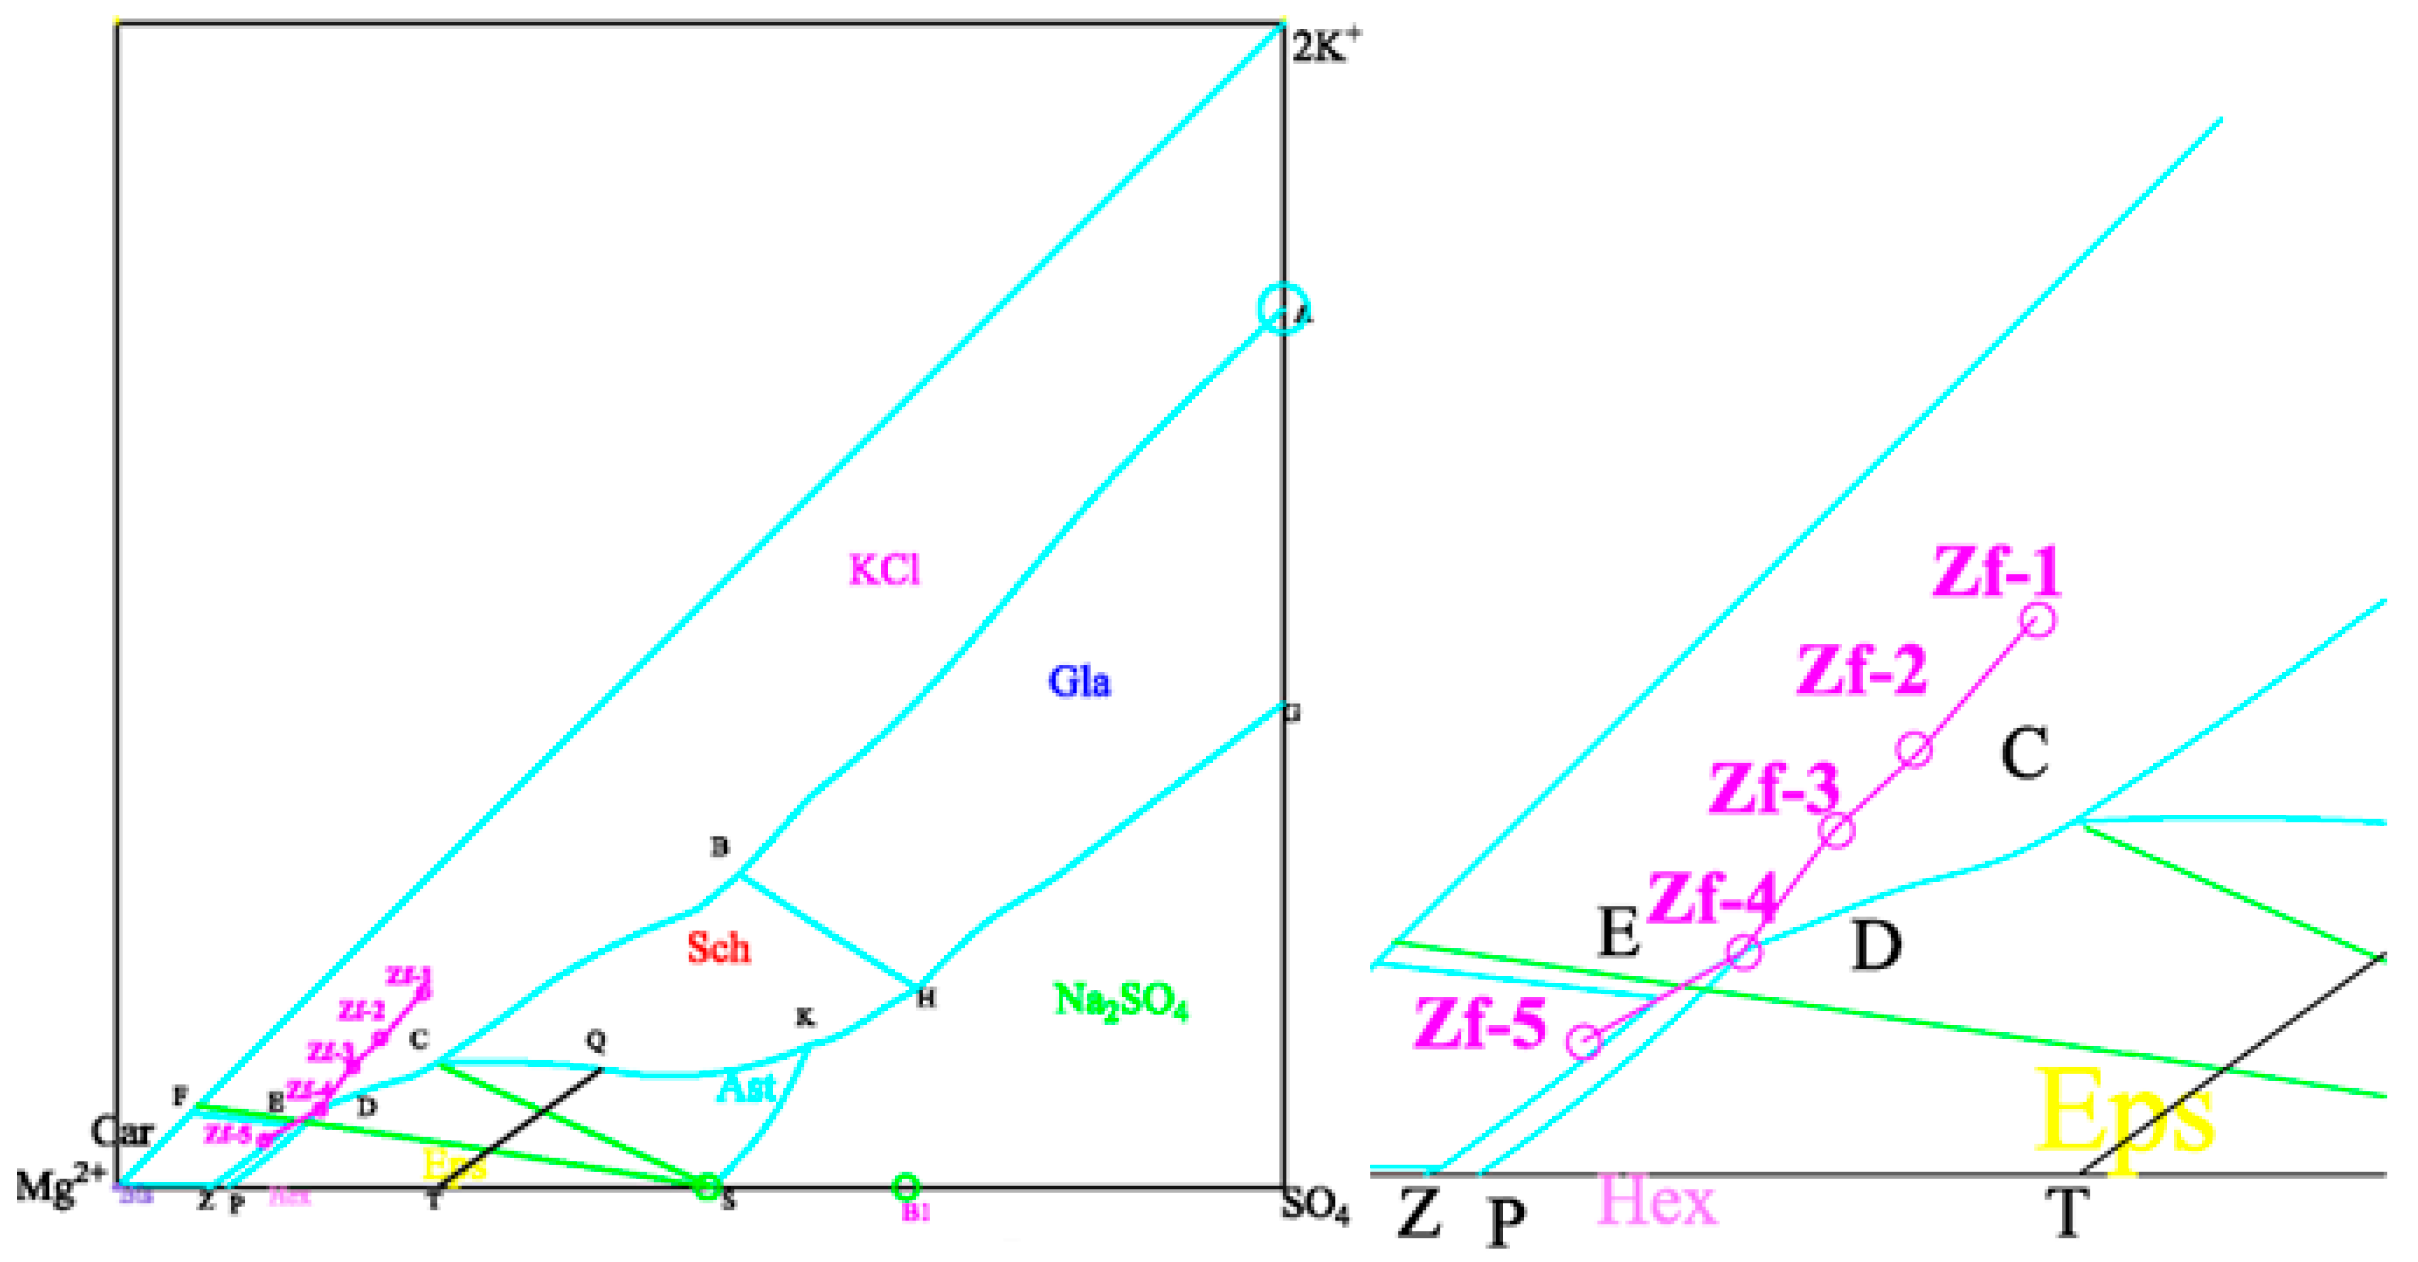
3.2.2. Study of Na Adsorption Behavior on the Surface of the Crystal Cell

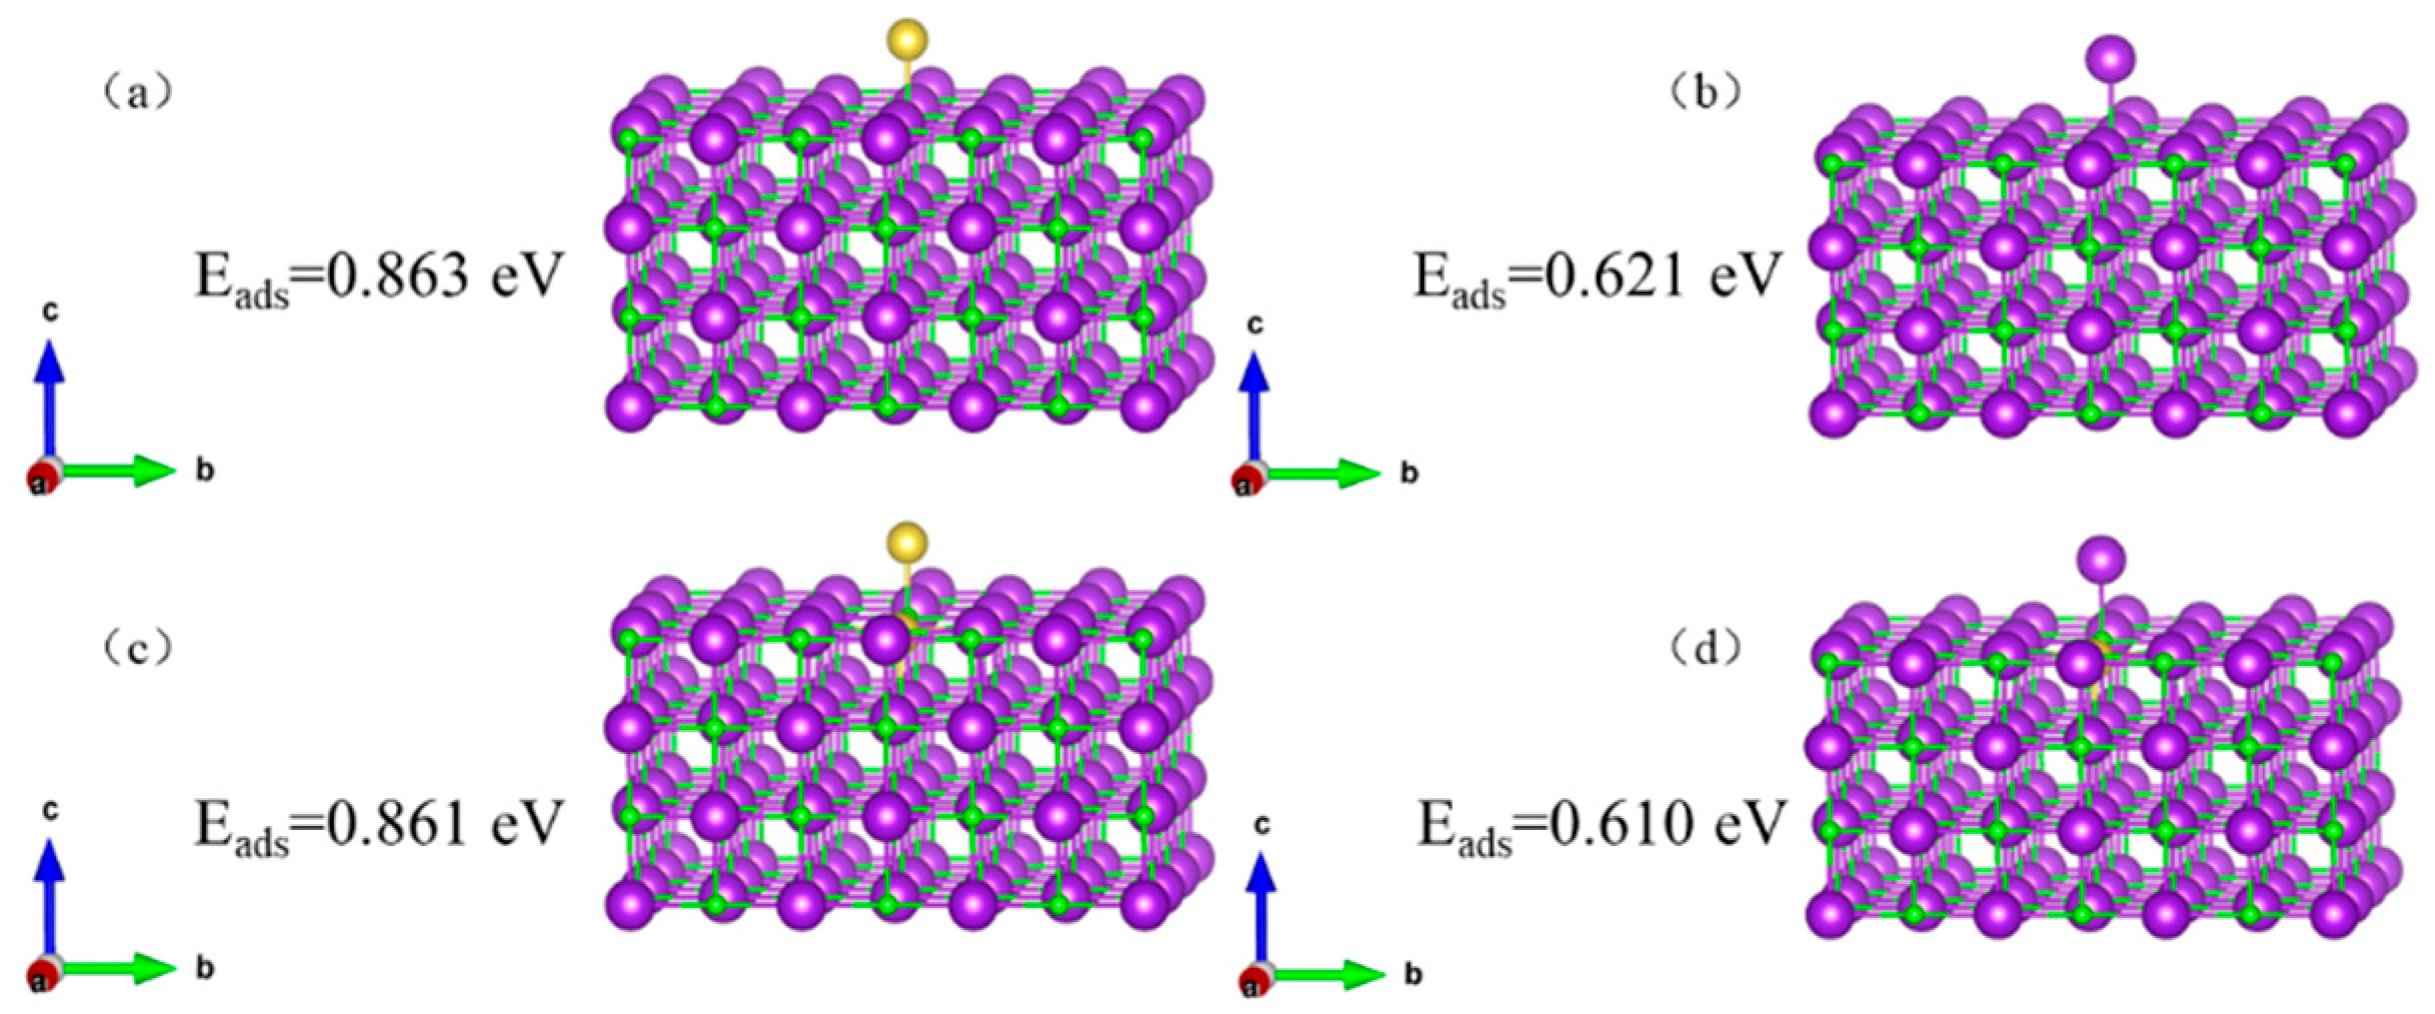
Adsorption structure and adsorption energy of K/Na on the KCl (002) surface and KCl (002) surface with K vacancy (Na replaces K) are calculated respectively, as shown in Figure 8.
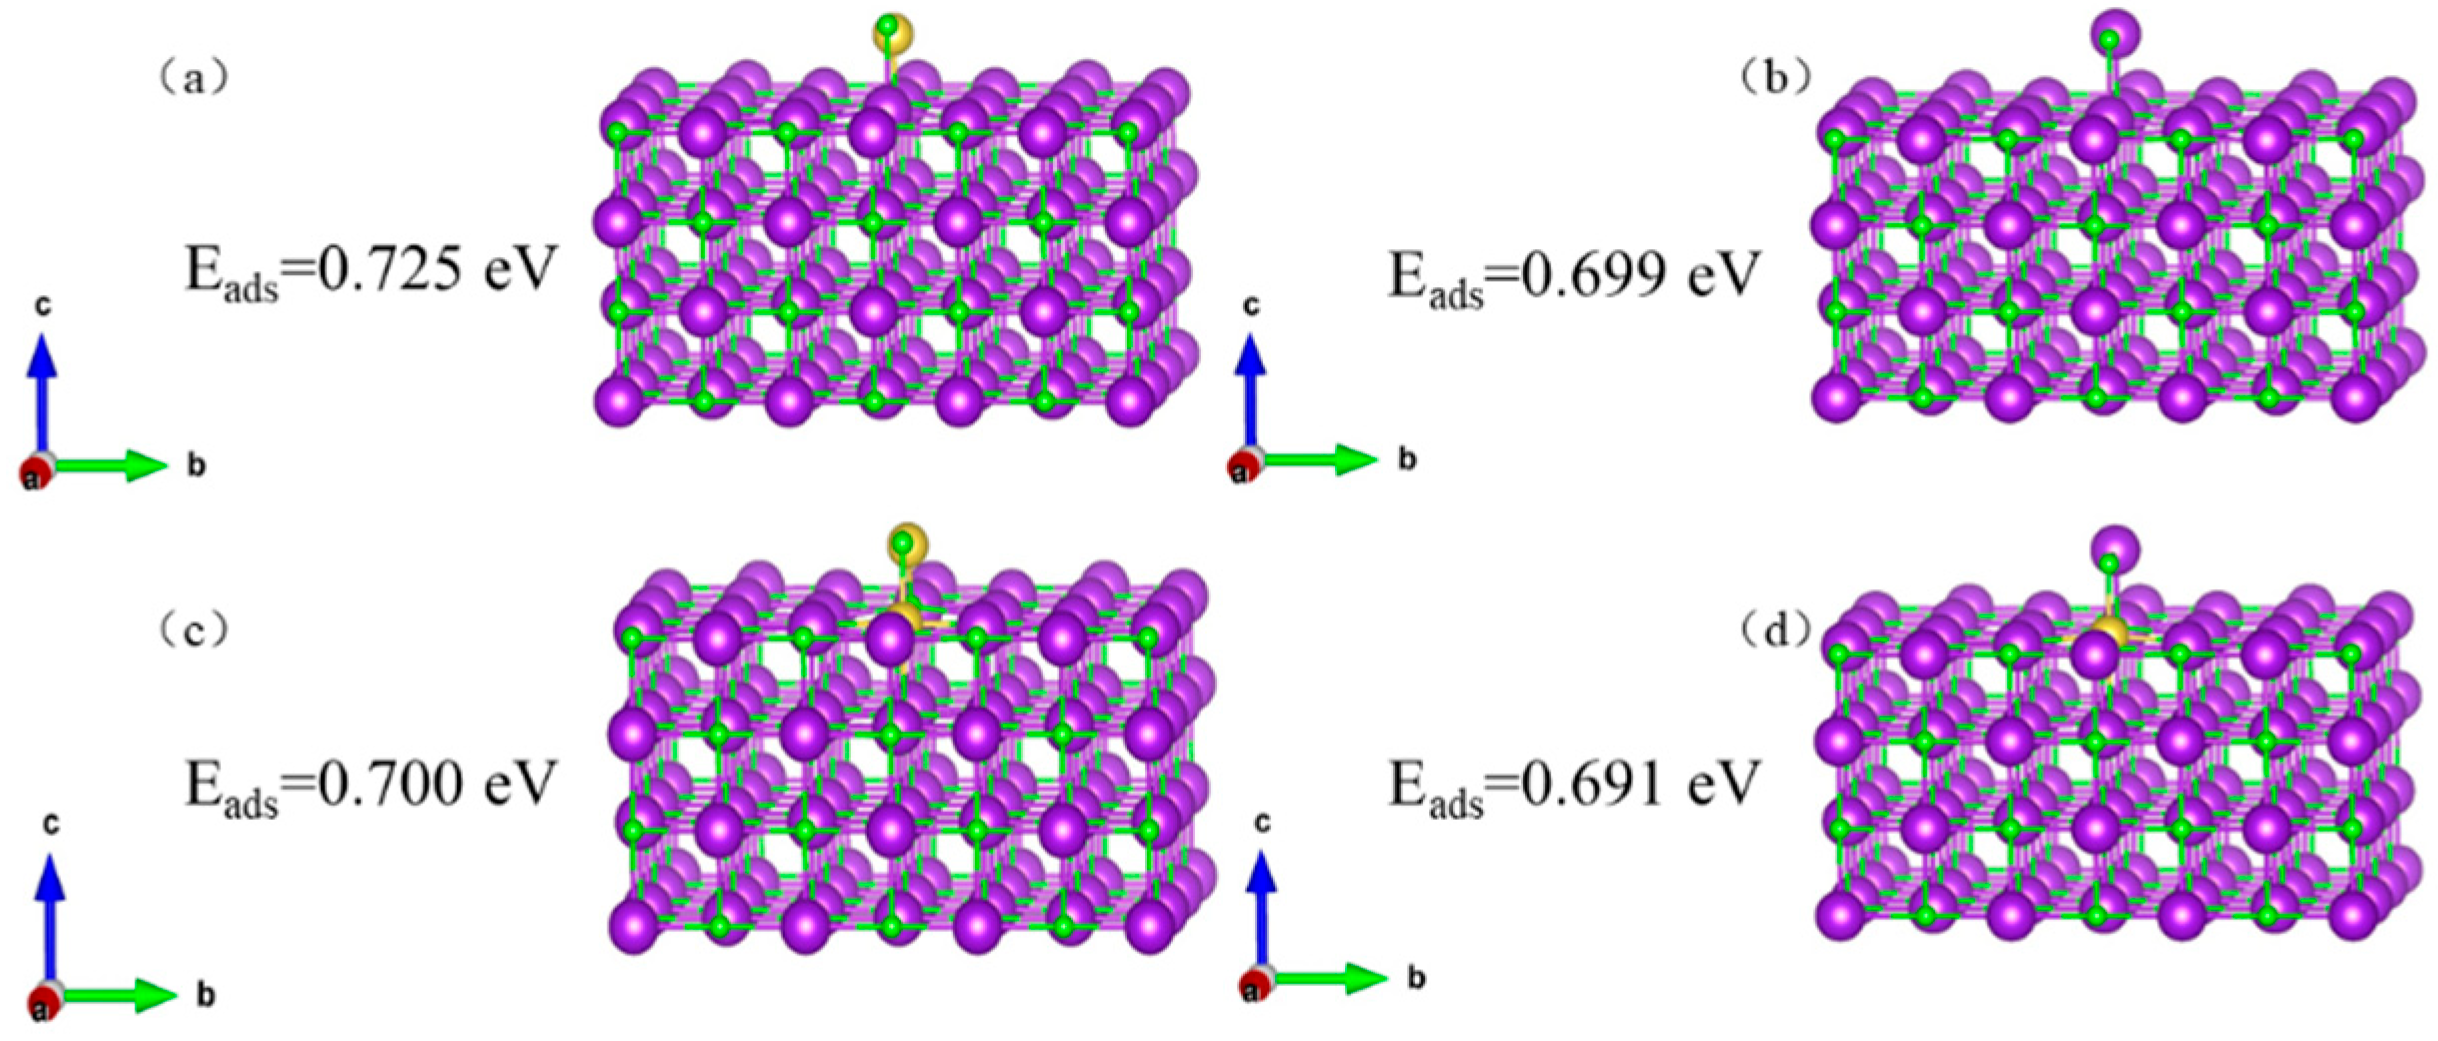
Adsorption structures and energies were calculated for KCl/NaCl on the KCl (002) surface and the KCl (002) surface with K replaced by Na, as shown in Figure 9.
The adsorption behavior of the KCl crystal surface was studied, and the adsorption structures and adsorption energies of K2Cl2 and Na2Cl
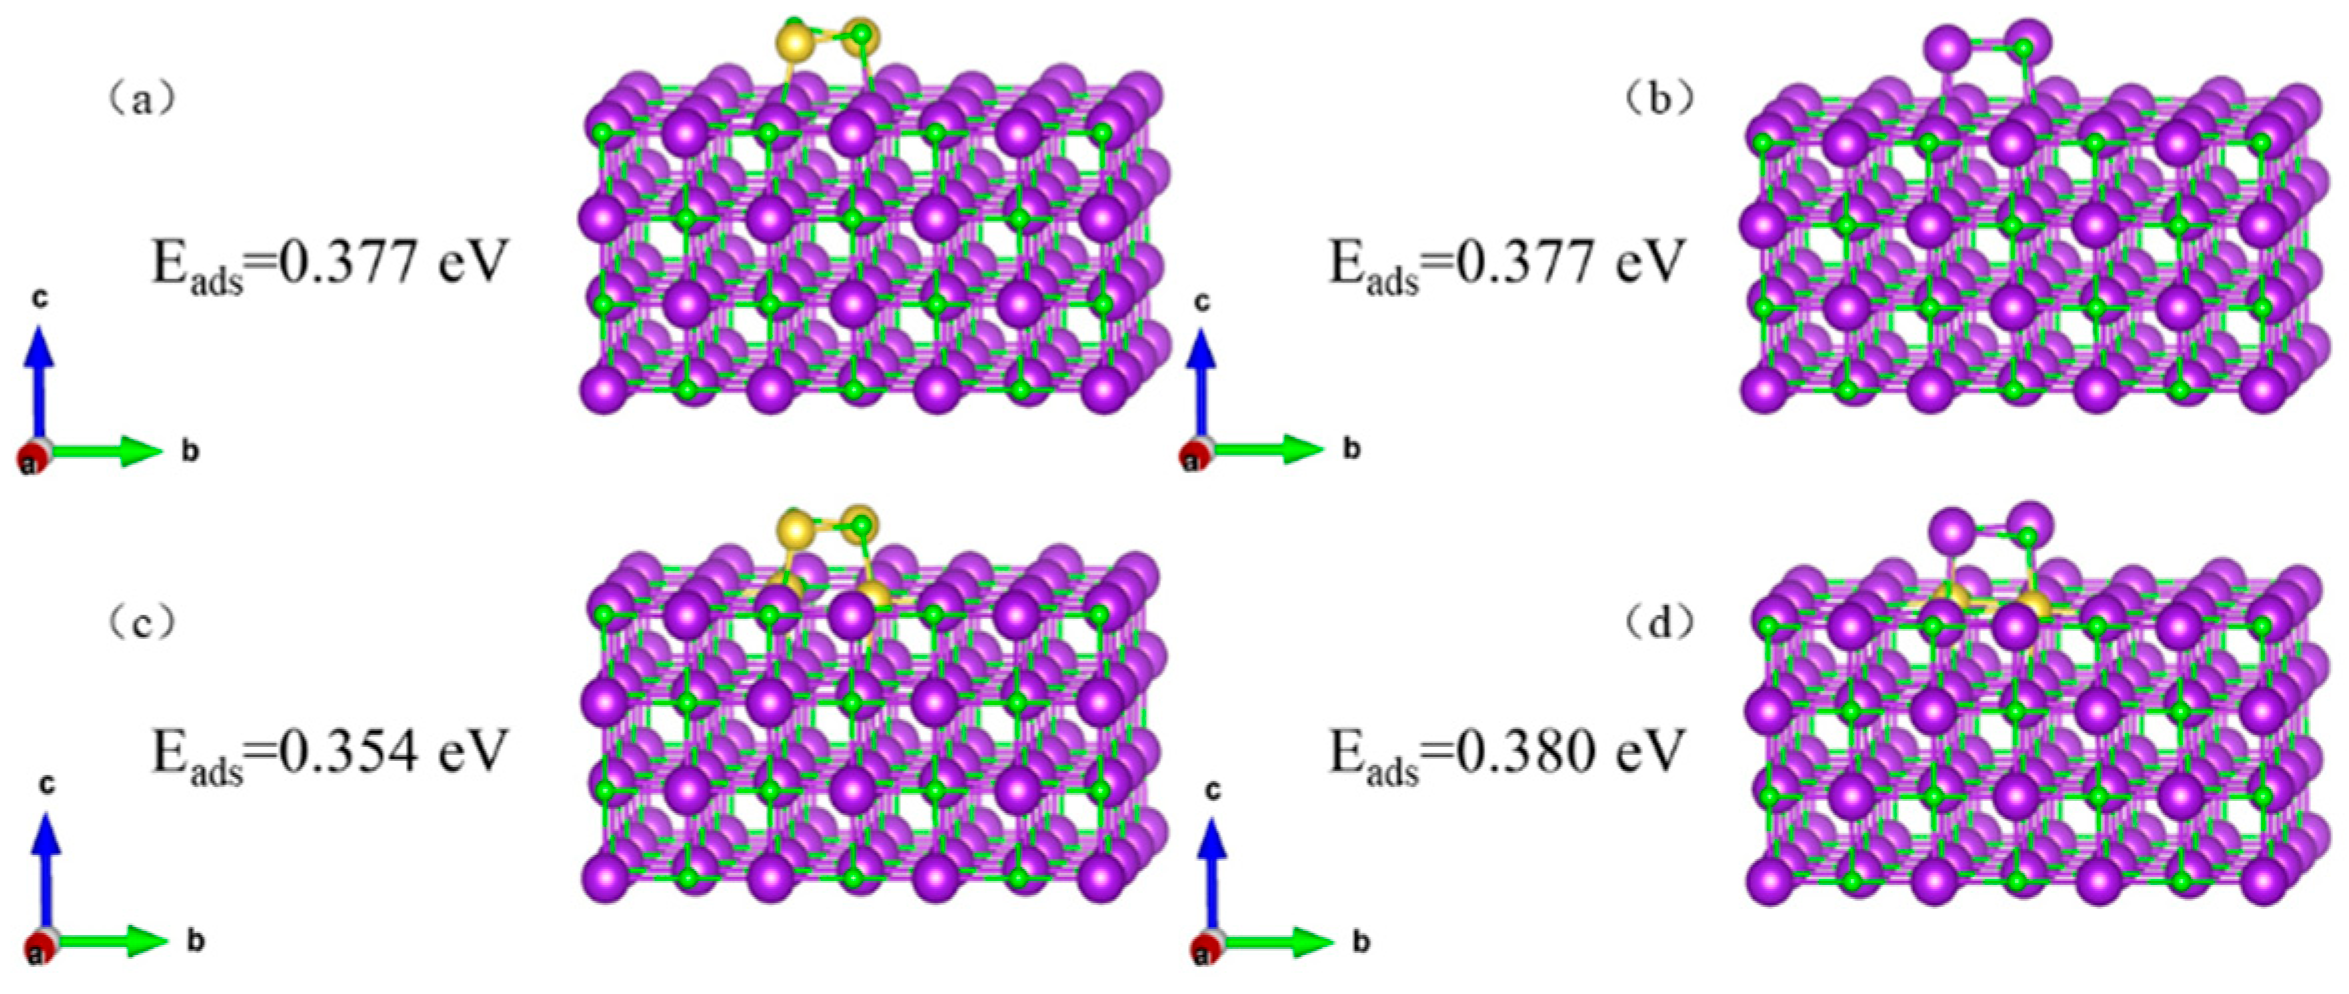
2 dimers on KCl (002) and KCl (002) surfaces were calculated, respectively, after K was replaced by Na, as shown in Figure 10.
Figure 8 shows that the KCl crystal has a stronger ability to adsorb K than to adsorb Na (0.863 eV > 0.621 eV), and the defective KCl crystal has a stronger ability to adsorb K than to adsorb Na (0.861 eV > 0.610 eV).
Figure 9 indicates that the KCl crystal has a slightly stronger ability to adsorb KCl than to adsorb NaCl (0.725 eV > 0.699 eV), and the defective KCl crystal has a slightly stronger ability to adsorb KCl than to adsorb NaCl (0.700 eV > 0.691 eV).
Figure 10 shows that the KCl crystal has an equal ability to adsorb K2Cl2 and Na2Cl2 (0.377 eV), while the defective KCl crystal has a weaker ability to adsorb 2 KCl compared to 2 NaCl (0.354 eV < 0.380 eV).
The ability of the KCl crystal to adsorb Na (0.863 eV), NaCl (0.725 eV), and 2 NaCl (0.377 eV) gradually increases, while the ability of the defective KCl crystal to adsorb Na (0.861 eV), NaCl (0.700 eV), and 2 NaCl (0.354 eV) also gradually increases.
It is more difficult for the non-defective KCl surface to adsorb Na atoms than K atoms (with a higher Na adsorption energy of 0.242 eV), and the adsorption energy for NaCl molecules is 0.026 eV higher than that for KCl, indicating that if single molecules or dimers of NaCl form in the solution, it favors the nucleation of NaCl.
Furthermore, the adsorption energy of NaCl on the defective KCl crystal surface is 0.009 eV higher than that of KCl, and the adsorption energy of Na2Cl2 dimer is 0.026 eV lower than that of KCl dimer. This indicates that the surface substitution of K by Na favors the nucleation of NaCl, and the growth of NaCl crystals is relatively easier (with a smaller difference in adsorption energy).
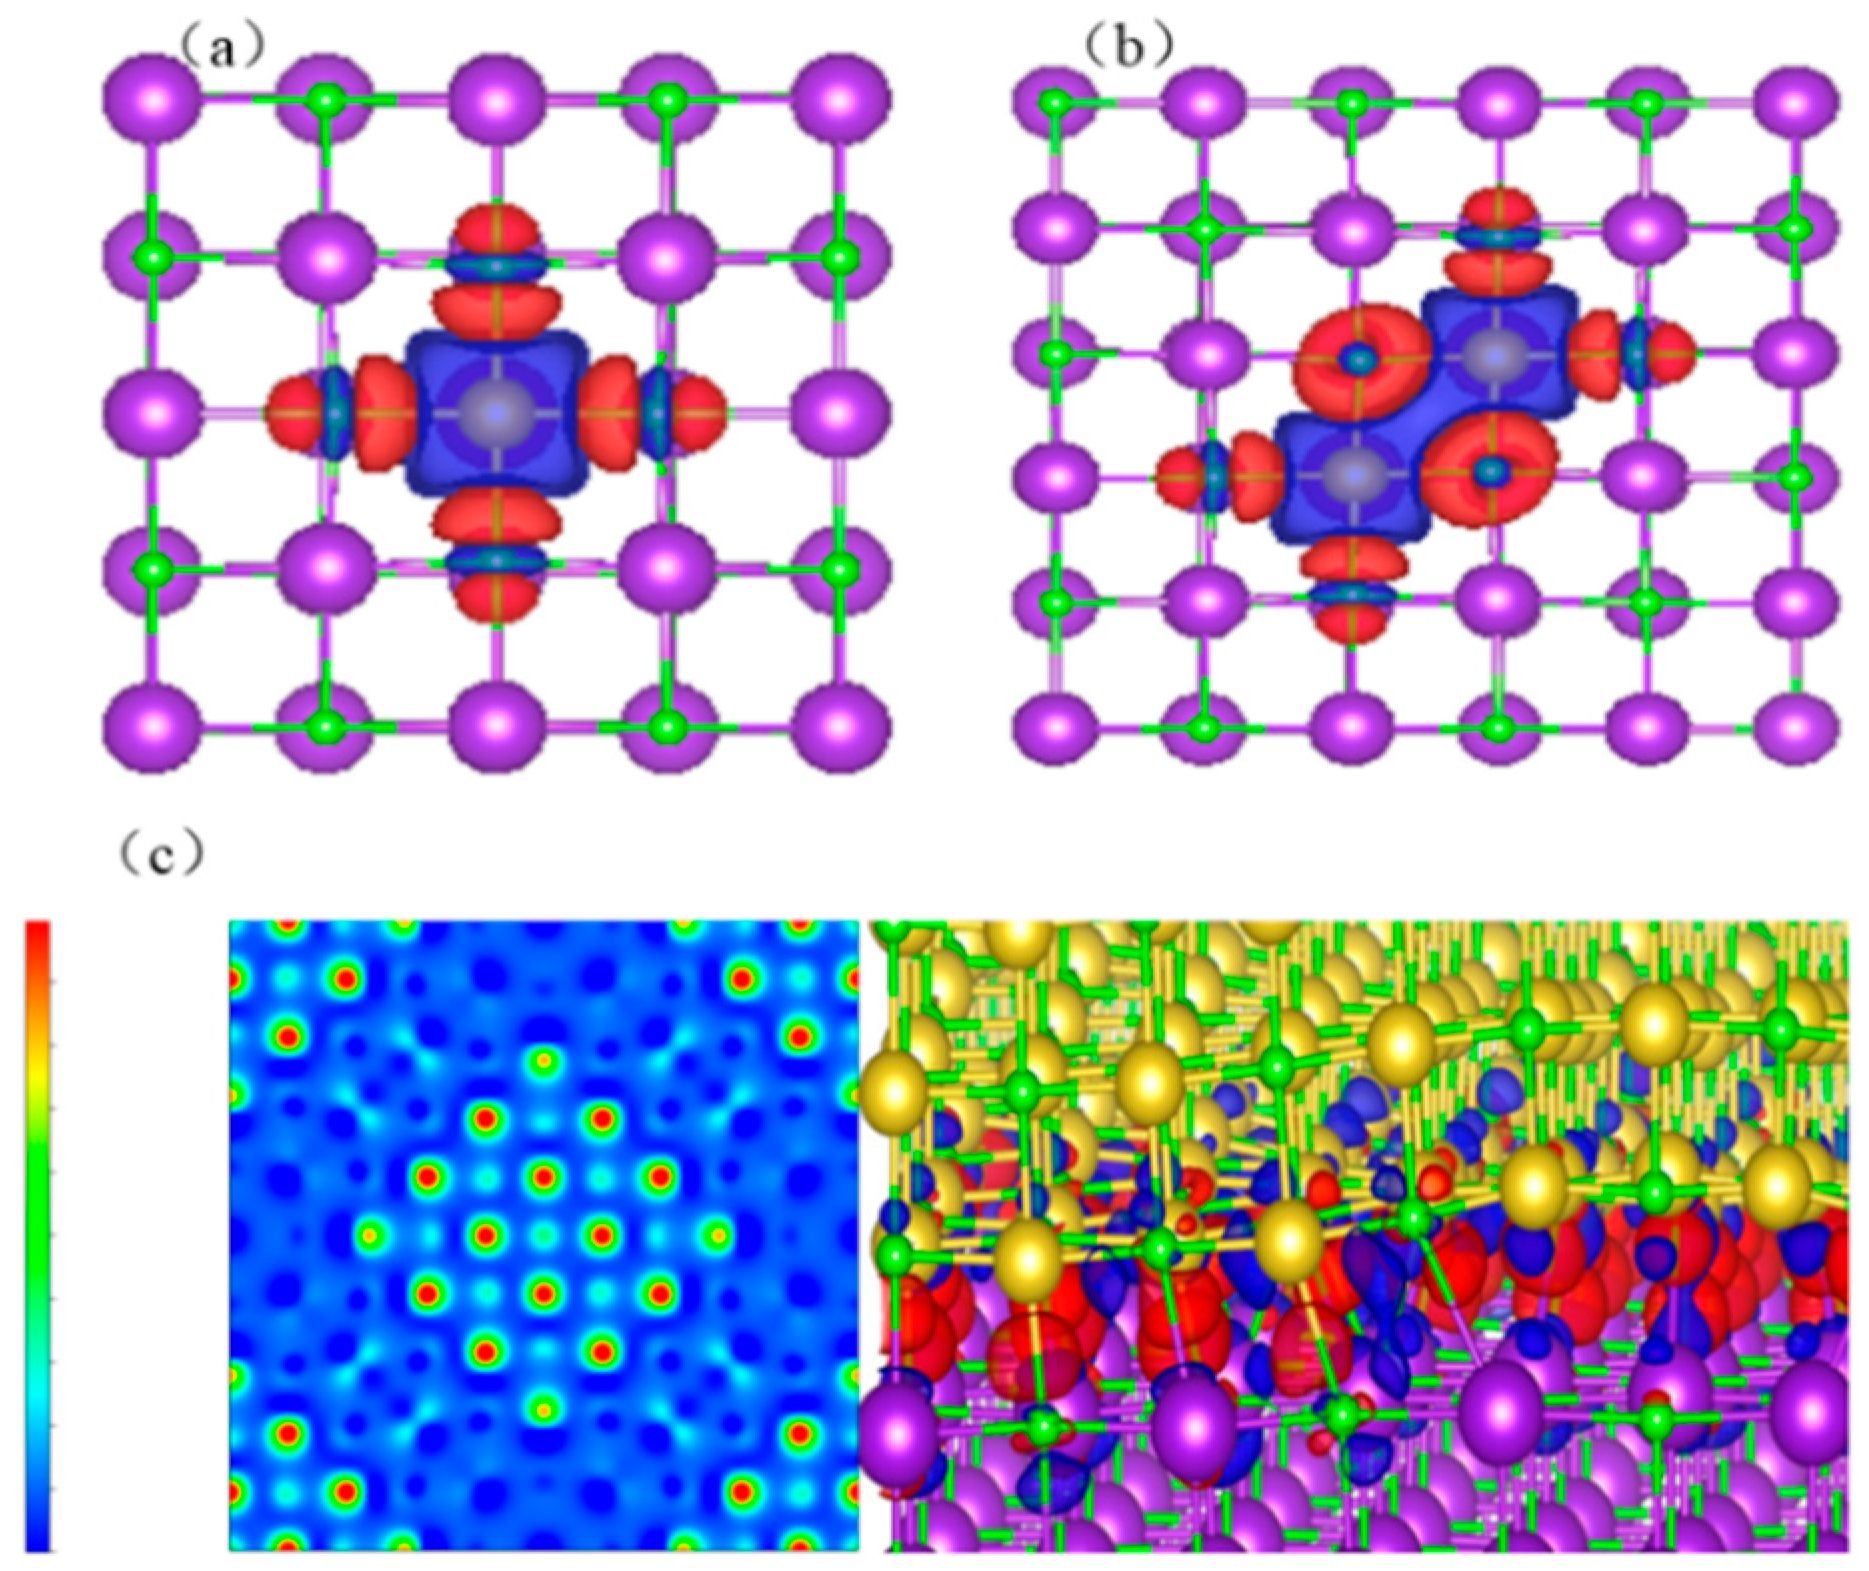
The differential charge density on the surfaces of KCl crystals, KCl (002) surfaces with K replaced by Na, and the heterojunction of KCl and NaCl crystals are shown in Figure 11.
Through the aforementioned studies, it was observed that NaCl and KCl readily formed heterojunction structures in the coexisting system. The formation energies for heterojunctions and defective KCl crystals were both 0.49 eV, and the transfer of electrons between Na and K was nearly identical. However, from Figure 6, it can be observed that the charge density distribution gradually increased for KCl crystals, defective KCl crystals, and the heterojunction structure of KCl and NaCl, confirming the hypothesis that NaCl and KCl form heterojunctions in the coexisting system.
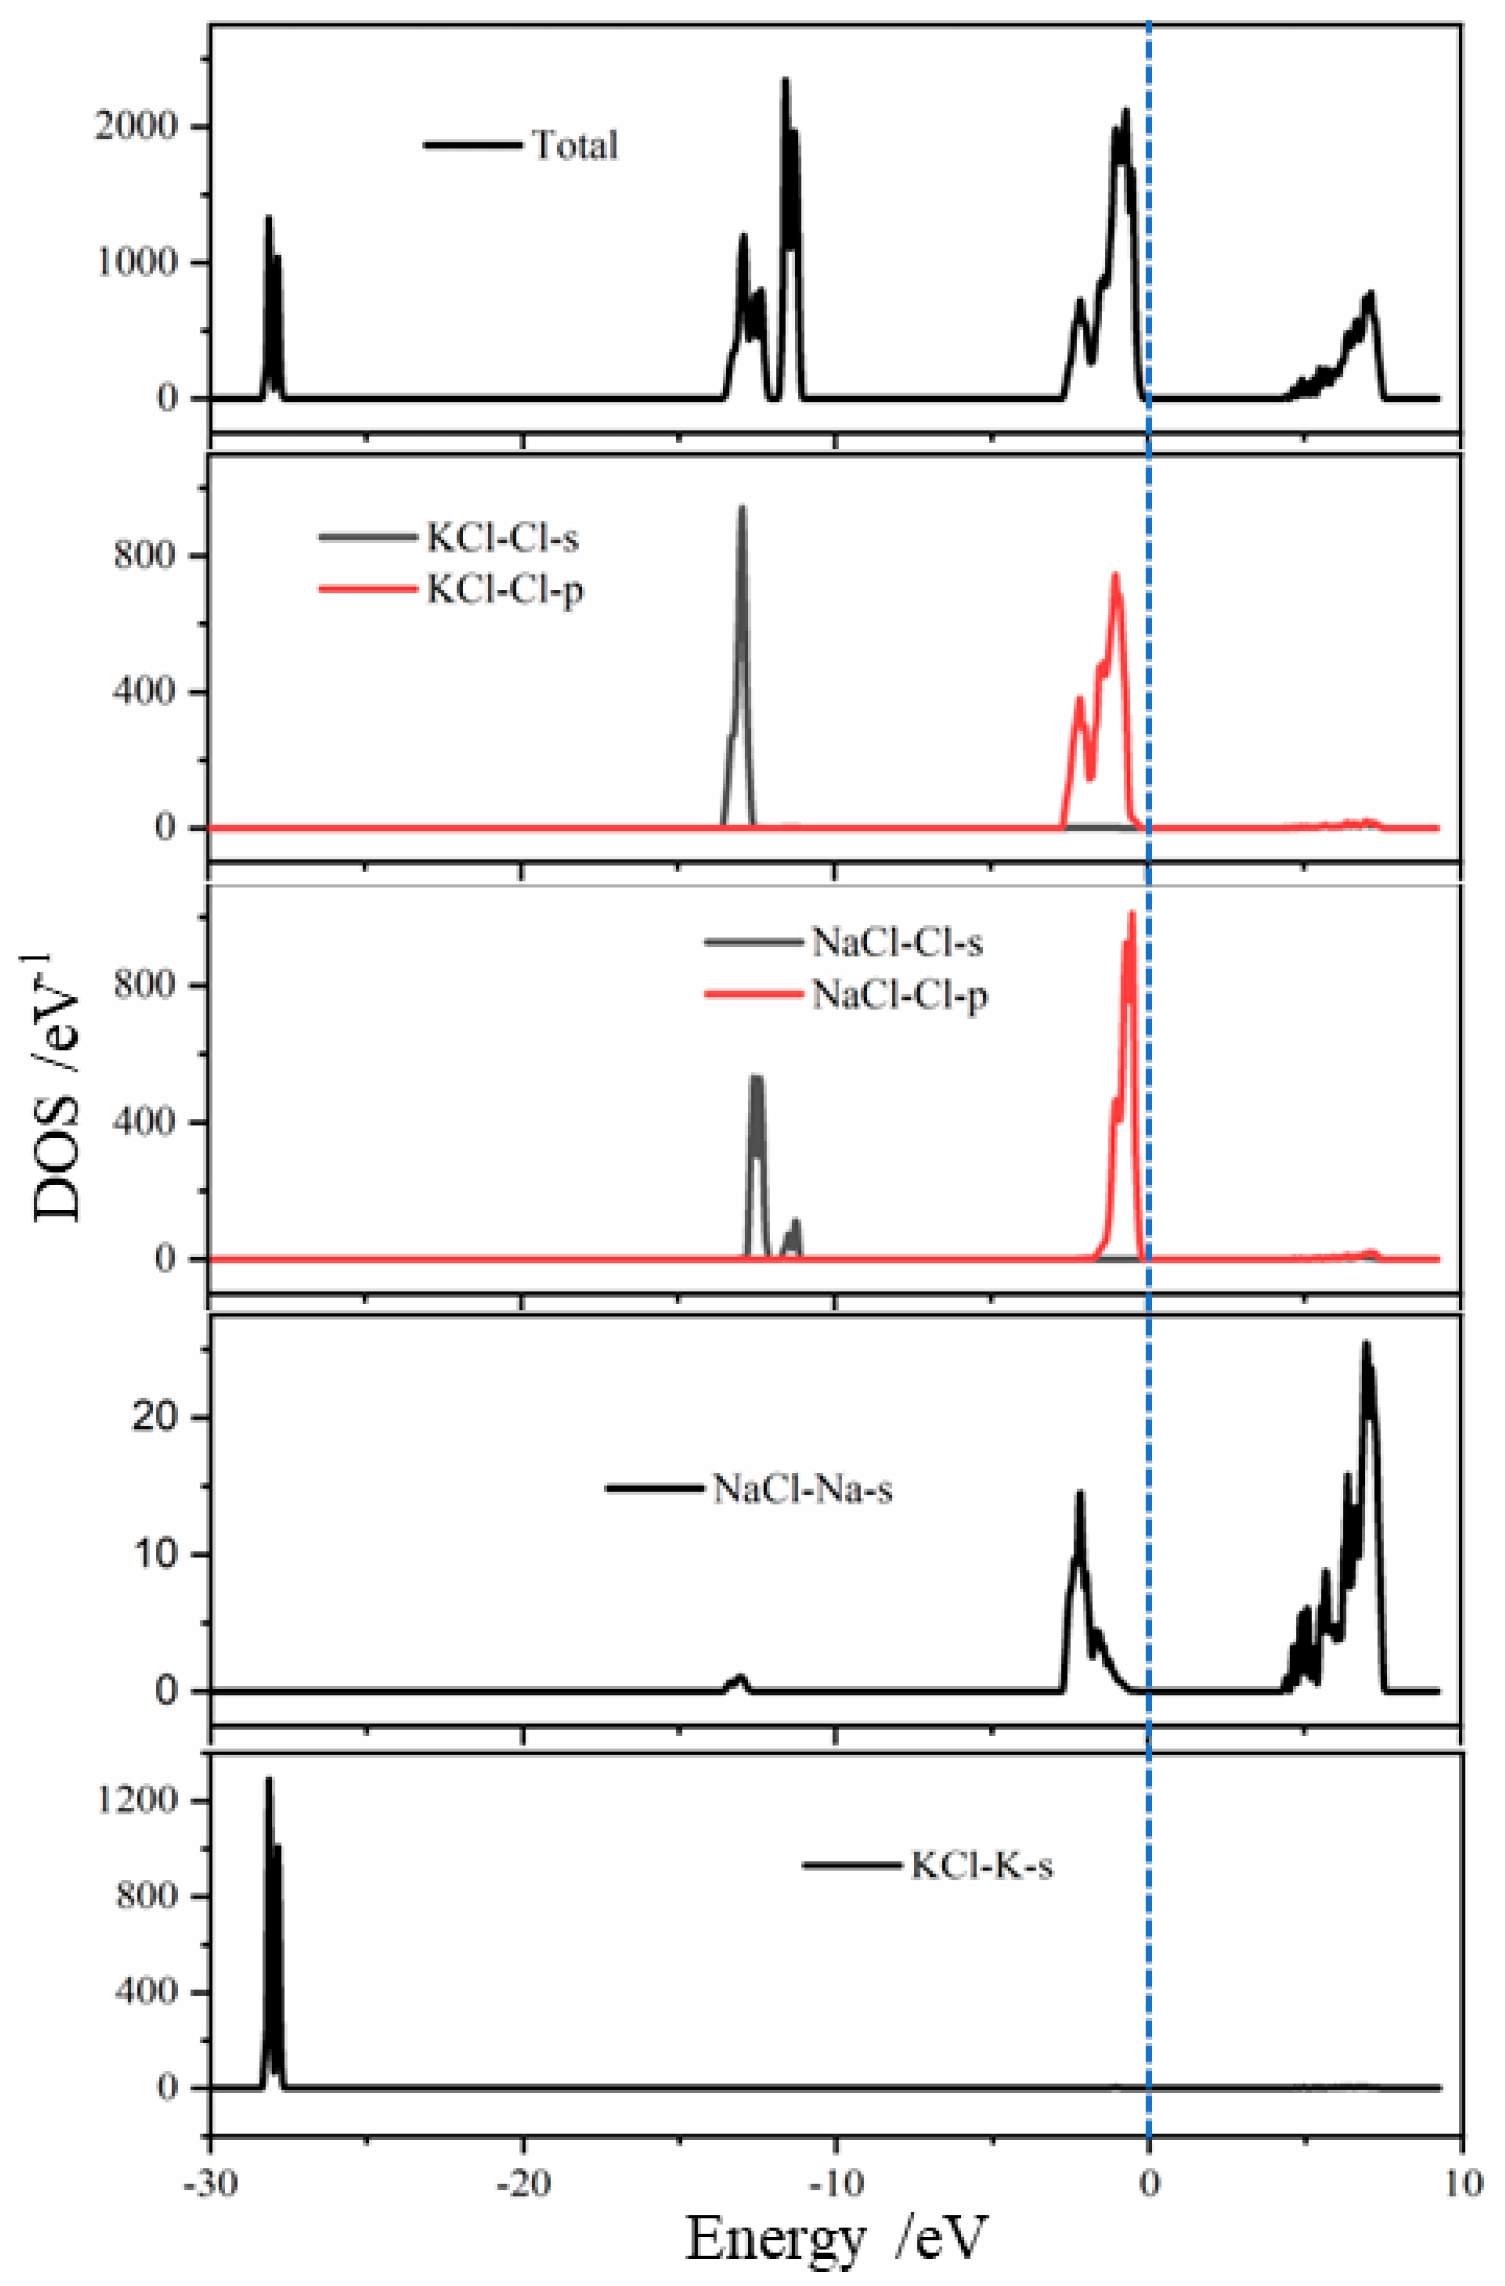
Density of states is defined as the number of electronic states that can occur within a unit energy interval. By analyzing the system’s density of states, we can gain further insights into each other’s mechanisms between ions and surface ions [37]. In order to investigate the electronic structure changes of NaCl and KCl in greater depth, the density of states before and after adsorption on various crystal surfaces was calculated, using the energy zero point as the Fermi level. The results are shown in Figure 12. There was a negative shift in the energy of K-s orbitals within the crystal, and the position of the Fermi level (5–10 eV) due to Na-s orbitals enhanced the overall density of states. This further confirmed the ease with which NaCl and KCl formed heterojunctions in the coexisting system.

4. Conclusions

This paper adopts a combination of experimental and computational approaches to investigate the potassium−natrium interaction and its effects during the crystallization process of low-natrium salt. The results of the study are of great significance in guiding the efficient utilization of potassium resources. The specific conclusions are as follows: The feed rate and residence time directly affect the quality of low-natrium salt. By controlling the interface properties and process conditions, a low-natrium salt that meets the requirements is obtained with the following conditions: MgCl2·6H2O feed rate of 10 g·min−1, K+, Na+//Cl-H2O saturated solution feed rate of 10 mL·min−1, agitation speed at a linear velocity of 0.2 m·s−1, and a residence time exceeding 80 min; In the K+, Na+, Mg2+//Cl-H2O saturated system, during the nucleation and crystallization processes of KCl and NaCl, NaCl nuclei readily grow by epitaxy on the defects of KCl nuclei during the nucleation and growth of KCl; in the K+, Na+, Mg2+//Cl-H2O saturated system, during the nucleation and crystallization processes of KCl and NaCl, they easily form heterojunction structures with formation energies significantly lower than that of individual KCl and NaCl crystals. This is the main reason for the difficulty in separating K+ and Na+ in this saturated system.

Author Contributions

Writing—review and editing, Y.M., S.H., X.L., X.S., Y.D. and H.L. All authors have read and agreed to the published version of the manuscript.

Funding

This research was funded by “Kunlun Elite·High-end Innovation and Entrepreneurial Talent” of Qinghai in 2023; Enterprise Technology Demonstration Project, grant number ZC0609-0006.

Data Availability Statement

Data are contained within the article.

Conflicts of Interest

The authors declare no conflicts of interest.

References

  1. Bao, R.; Liu, S.; Yan, W. The distribution situation of potash resources in the world and our countermeasures. Land Resour. Inf. 2010, 44–47. [Google Scholar]
  2. Chen, Y.; Zhang, Z.; Lan, Y. Development and utilization of potash fertilizer from potash salt in China. Morden Min. 2011, 27, 92–94. [Google Scholar]
  3. Zheng, M.; Zhang, Z.; Hou, X.; Lin, Y. The Prospects and the Mining Development Strategy of Potassium Resources in China. Land Resour. Inf. 2015, 3–9. [Google Scholar]
  4. Jia, S.; Wang, J. Technical analysis of potash fertilizer production in Qarhan Salt Lake. Chem. Enterp. Manag. 2018, 78. [Google Scholar]
  5. Li, R.; Liu, Y. Comprehensive Utilization of water resources of potash fertilizer project in Chaerhan Salt Lake. In Proceedings of the 9th China Water Ecology Conference, Matsue, Japan, 21–24 November 2021; pp. 269–273. [Google Scholar]
  6. Chen, W.; Zhang, Q.; Zhao, X.; Li, X. Discuss on the Utilization of Potassium Resources in Qarhan Salt Lake. J. Salt Sci. Chem. Ind. 2022, 51, 50–54. [Google Scholar]
  7. Jing, F. Study on balance exploitation of potash resources in Qinghai Salt Lake. Inorg. Chem. Ind. 2015, 47, 4–7. [Google Scholar]
  8. Wang, X.; Wang, S.; Tian, H.; Yu, X.; Zhu, J.; Liu, W. Potassium extraction technologyprogress in Qinghai Salt Lake and development of potash fertilizerindustry in China. Ind. Miner. Process. 2017, 46, 48–52. [Google Scholar]
  9. Yang, L. Research and development of low sodium salt products. Chekiang Ind. Mon. 2014, 34–35. [Google Scholar]
  10. Zhang, H.; Li, M.-Z.; Guo, M.; Wu, Z.; Li, Q. Low-sodium Salt and Its Preparation. China Condiment 2015, 40, 6–16. [Google Scholar]
  11. Li, L.; Yi, X. Studies have shown that low sodium salt to prevent cardiovascular disease and apply. J. Sci. Technol. 2022. [Google Scholar]
  12. The editorial department of this journal. Promote low sodium salt, medium salt in action. China Natl. Salt Ind. 2023, 14–15.
  13. Li, M.; Wang, Z.; Qi, J.; Yu, R. Progress in the Construction of Metal Oxide Heterojunctions and Their Application in Photocatalytic CO2 Reduction. Chem. J. Chin. Univ. 2023, 44, 35–51. [Google Scholar]
  14. Huang, Z.; Zheng, Y.; Yang, E.; Song, X.-C. Preparation and photocatalytic performance of BiOIO3/BiOCl heterojunction with dominated facet. Chin. J. Inorg. Chem. 2023, 39, 263–271. [Google Scholar]
  15. Yang, Y.; Zhang, G. Relationship between the preparation process of the graphene/silicon hetero-junction photodetector and its voltage-current characteristics. Chin. Opt. 2023, 16, 1149–1156. [Google Scholar]
  16. Guo, Q.; Shen, H.; Li, Y.-F. Feasibility Study on Application of UV Light Conversion Adhesive Film in Heterojunction Photovoltaic Modules. Plast. Sci. Technol. 2023, 51, 28–31. [Google Scholar]
  17. Wang, X. The Aggregation Characteristics of Gluten in Dough Mediated by Low-Sodium Salt and Its Effect on Noodle Processing Quality; Henan University of Technology: Zhengzhou, China, 2023. [Google Scholar]
  18. Yu, X.; Fu, Z.; Ma, Y.; Li, C.; Zhang, S.; Zhang, Z. Polyethylene glycol regulated carnallite decomposition-crystallization: Experimental and theoretical analysis. Miner. Eng. 2023, 195, 1–12. [Google Scholar] [CrossRef]
  19. Gao, H.; Pishney, S.; Janik, M.J. First Principles Study on the Adsorption of CO2 and H2O on the K2CO3 (001) Surface. Surf. Sci. 2013, 609, 140–146. [Google Scholar] [CrossRef]
  20. Paster, L.; Massaro, F.R.; Aquilano, D. Experimental and Theoretical Morphology of Single and Twinned Crystals of Li2CO3 (zabuyelite). Cryst. Growth Des. 2007, 7, 2749–2755. [Google Scholar] [CrossRef]
  21. Ji, Y.; Bian, L.; Liu, N.; Liu, Y.; Du, Y. Electronic Structure of Cs Adsorption on Al0.5 Ga0.5N (0001) Surface. Mater. Sci. Semicond. Process. 2020, 119, 195–213. [Google Scholar] [CrossRef]
  22. Ding, J.F.; Li, X.M.; Cui, L.L.; Cao, C.; Wang, H.H.; Cao, J. Electronic and Optical Properties of Anion-Doped c-ZrO2 from First-Principles Calculations. J. Cent. South Univ. 2014, 21, 2584–2589. [Google Scholar] [CrossRef]
  23. Jia, L.; Gu, M.; Song, G.; Zhu, J. Stability and Electronic Properties of O Vacancies and Ce4+ in Lu2SiO5 Tuned by C Doping. Opt. Mater. 2019, 93, 15–18. [Google Scholar] [CrossRef]
  24. Guigo, N.; Papageorgiou, G.Z.; Poulopoulou, N.; Bikiaris, D.N.; Sbirrazzuoli, N. Kinetics and mechanism of nonisothermal crystallization of biobased poly (hexamethylene 2,5-furan dicarboxylate). Polymer 2023, 285, 126366. [Google Scholar] [CrossRef]
  25. Ding, G. Study on Taurine Crystallization Processes in the Presenceof Process Impurities; Zhejiang Universsity of Science & Technology: Hangzhou, China, 2023. [Google Scholar]
  26. Tang, Y.; Wu, G.; Chen, H.; Xue, F. Effect of Stirring and Seeding Technology on Crystallization. Shandong Chem. Ind. 2021, 20, 50–65. [Google Scholar]
  27. Yu, X. Crystallization Behavior of Potassium Chloride and Sodium Chloride During the Decomposition of Sodium-Containing Carnallite; University of Chinese Academy of Sciences: Beijing, China, 2023. [Google Scholar]
  28. Kresse, G.; Furthmuller, J. Efficient iterative schemes for ab initio total-energy calculations using a plane-wave basis set. Phys. Rev. B 1996, 54, 11169. [Google Scholar] [CrossRef]
  29. Perdew, J.P.; Burke, K.; Ernzerhof, M. Generalized Gradient Approximation Made Simple. Phys. Rev. Lett. 1996, 77, 3865–3868. [Google Scholar] [CrossRef]
  30. Grimme, S.; Antony, J.; Ehrlich, S.; Krieg, H.J. A Consistent and Accurate ab Initio Parametrization of Density Functional Dispersion Correction (DFT-D) for the 94 Elements H-Pu. Chem. Phys. 2010, 132, 154104. [Google Scholar]
  31. Sowul, L. Crystallization Kinetics of Sucrose in a MSMPR Evaporative Crystallizer. Ind. Eng. Chem. Proc. Des. Dev. 1981, 20, 197–199. [Google Scholar] [CrossRef]
  32. Tavare, N.S.; Garside, J. Simultaneous Estimation of Crystal Nucleation and Growth Kinetics from Batch Experiments. Chem. Eng. Res. Des. 1986, 4, 109–118. [Google Scholar]
  33. Maret, L.; Tuomas, K.; Aittamaa, J. Secondary Nucleation Due to Crystal–Impeller and Crystal–Vessel Collisions by Population Balances in CFD-Modelling. J. Cryst. Growth 2002, 237, 218–219. [Google Scholar]
  34. Hess, B.; Bekker, H.; Berendsen, H.; Fraaije, J.G. LINCS: A Linear Constraint Solver for Molecular Simulations. J. Comput. Chem. 1997, 18, 1463–1472. [Google Scholar] [CrossRef]
  35. Menon, A.; Kramer, H.; Grievink, J.; Jansens, P. Modelling the Cyclic Behaviour in a DTB Crystallizer-a Two-Population Balance Model Approach. J. Cryst. Growth 2005, 275, 1373–1381. [Google Scholar] [CrossRef]
  36. Farhat, C.; Lesoinne, M.; Tallec, P.L. Load and Motion Transfer Algorithms for Fluid/Structure Interaction Problems with Non-Matching Discrete Interfaces: Momentum and Energy Conservation, Optimal Discretization and Application to Aeroelasticity. Comput. Methods Appl. Mech. Eng. 1998, 157, 95–114. [Google Scholar] [CrossRef]
  37. Geshi, M.; Klug, D.D.; Tse, J.S. First-principles studies of pressure-induced phase transitions in SiO2. J. Phys. Condens. Matter 2002, 14, 10891–10894. [Google Scholar] [CrossRef]
Figure 1. Five-component phase diagram K+, Na+, Mg2+//Cl, SO42−-H2O, and its evaporation pathways (note: H—NaCl; T—Na2SO4; S—KCl; Gla—3K2SO4·Na2SO4; Ast—MgSO4·Na2SO4·4H2O; Sch—K2SO4·MgSO4·6H2O; Bis—MgCl2·6H2O; Car—hydrated potassium magnesium chloride mineral; Eps—magnesium sulfate heptahydrate; Hex—magnesium sulfate hexahydrate).
Separations 12 00131 g001
Figure 2. Experimental schematic.
Separations 12 00131 g002
Figure 3. Comparison of crystal particle size and XRD for different feeding methods in the crystallizer.
Separations 12 00131 g003
Figure 4. Comparison of particle size for the continuous crystallization experiment.
Separations 12 00131 g004
Figure 5. SEM-EDS images of low-natrium salt ((a,b): >150 μm; (c,d): <150 μm).
Separations 12 00131 g005
Figure 6. Standard spectrum of potassium chloride.
Separations 12 00131 g006
Figure 7. Potassium chloride crystal lattice.
Separations 12 00131 g007
Figure 8. Cell structure of the crystal KCl surface adsorbed of Na and K. ((a): KCl surface adsorbed of Na; (b): KCl surface adsorbed of K; (c): KCl defect surface adsorbed of Na; (d): KCl defect surface adsorbed of K).
Separations 12 00131 g008
Figure 9. Cell structure of crystal KCl surface adsorbed of KCl and NaCl. ((a): KCl surface adsorbed of NaCl; (b): KCl surface adsorbed of KCl; (c): KCl defect surface adsorbed of NaCl; (d): KCl defect surface adsorbed of KCl).
Separations 12 00131 g009
Figure 10. Cell structure of the crystal KCl surface adsorbed of K2Cl2 and Na2Cl2. ((a): KCl surface adsorbed of Na2Cl2; (b): KCl surface adsorbed of K2Cl2; (c): KCl defect surface adsorbed of Na2Cl2; (d): KCl defect surface adsorbed of K2Cl2).
Separations 12 00131 g010
Figure 11. Differential charge density of Na and NaCl adsorbed on the surface of KCl crystal ((a): KCl surface; (b): KCl cell surface K defect site; (c): KCl and NaCl heterojunction; Red means charge increase, Blue means charge decrease).
Separations 12 00131 g011
Figure 12. Density of states of NaCl and KCl.
Separations 12 00131 g012
Table 1. Chemical composition of experimental materials (wt.%).
constituteK+Na+ *ClH2O
material5.605.5313.5275.35
Note: * indicates values calculated by subtraction.
Table 2. Comparison of particle size distribution for low-natrium salt.
Size DistributionProportion of Low-Natrium Salt
123
>150 μm6.28%2.91%4.91%
<150 μm93.71%97.09%95.08%
Table 3. Chemical composition and content of low-natrium salt (wt.%).
Serial NumberK+Mg2+Na+ClKClNaCl
14.500.379.5014.4134.0456.03
24.600.369.5614.5234.5256.38
34.820.349.3914.5736.1955.38
Table 4. Comparison of particle size distribution of low-natrium salt.
Size DistributionFeed Rate of MgCl2·6H2O
30 g·min−110 g·min−1
>150 μm71.86%93.50%
<150 μm28.14%6.49%
Table 5. Chemical composition and content of low-natrium salt (wt.%).
Serial NumberK+Mg2+Na+ ClKClNaCl
14.820.269.4514.5336.1255.73
25.260.229.5114.9939.4656.08
34.820.349.3914.5736.1955.38
Table 6. Continuous crystallization experiment.
NO.012345
residence time40 min80 min120 min160 min210 min260 min
>150 μm19.08%94.05%87.62%98.21%97.49%93.51%
<150 μm80.92%5.95%12.38%1.79%2.51%6.49%
Table 7. The low-natrium salt content in continuous crystallization L1 (wt.%).
NO.KClNaCl
130.8367.99
228.9869.71
331.2666.84
428.9868.10
Table 8. Lattice constants of KCl.
KCl
Calculated ValueExperiment Value
a/Å6.2996.3914
b/Å6.2996.3914
c/Å6.2996.3914
α/°90.0090.00
β/°90.0090.00
γ/°90.0090.00
Disclaimer/Publisher’s Note: The statements, opinions and data contained in all publications are solely those of the individual author(s) and contributor(s) and not of MDPI and/or the editor(s). MDPI and/or the editor(s) disclaim responsibility for any injury to people or property resulting from any ideas, methods, instructions or products referred to in the content.

