Abstract
Surface roughness directly affects the interaction between mineral surfaces and water, as well as the adhesion of particles to bubbles during mineral flotation processes. Currently, there is a significant amount of research on the relationship between mineral surface roughness and wettability, yet the conclusions drawn are not consistent. To investigate the impact of roughness on the adhesion and detachment behavior between droplets and coal surfaces, this study prepared a series of coal samples with varying roughness using sandpaper of different grit sizes. A highly sensitive adhesion force measuring instrument was employed to study the continuous attachment and detachment processes between droplets and coal surfaces of different roughness levels. Contact angle results indicated that as the roughness of the coal sample surface increased, the contact angle gradually decreased, suggesting an increase in the hydrophilicity of the coal surface. This study proposed a concavo-convex roughness model for predicting the contact angle on coal surfaces, which was validated for feasibility and accuracy through experimental data. The adhesion force between droplets and coal surfaces increased with roughness. As the roughness increased from 0.30 μm to 2.39 μm, the spreading force of the droplet increased from 159.00 μN to 209.60 μN, the maximum adhesion force increased from 406.76 μN to 441.08 µN, and the detachment force increased from 95.37 μN to 102.39 μN. A smaller contact angle between the droplet and the coal surface corresponded to a larger contact diameter and greater interaction force. The forces measured by the adhesion force measurement device showed good consistency with theoretical calculations. This study provides theoretical support for understanding the interaction processes between droplets and rough solid surfaces.
1. Introduction
The most critical bubble–particle interaction in the flotation process is essentially an interfacial physicochemical phenomenon [1]. This process is not only influenced by the surface properties of the bubbles but is also directly affected by the chemical properties and physical structure of the particles [2]. Specifically, the surface morphology of the particles can significantly impact the rupture of the hydration film on the particle surface, the expansion of the three-phase contact (TPC) line, and the adhesion strength between the bubble and particle [3,4,5]. Krasowska et al. [6] found that the roughness of Teflon surfaces is a key parameter affecting bubble collision and adhesion. As the surface roughness increases, the static contact angle rises from 99.6° to 128.8° and a substantial reduction in the formation time of the TPC line and adhesion of bubbles is achieved.
Conflicting conclusions exist concerning the relationship between surface roughness and contact angle measurements across heterogeneous surfaces [7]. Busscher et al. [8] investigated the contact angles and their hysteresis on polymers with different surface roughnesses. Their conclusions indicate that an average roughness greater than 100 nanometers increases the contact angle for surfaces with contact angles above 86° (relatively hydrophobic surfaces) and decreases the contact angle for surfaces with contact angles below 60° (relatively hydrophilic surfaces). They assert that roughness has no effect on surfaces with contact angles between 60° and 86°. The research findings of Szczerkowska et al. [9] support this conclusion. Using the sessile drop technique, they measured the advancing contact angles of the aqueous phase. They found that roughness has a minimal impact on the advancing contact angles of PS sheets measured in pure water and low-concentration nonionic surfactant solutions (with a smooth surface contact angle of approximately 76°).
Shibuichi et al. [10] conducted research that revealed a significant influence of surface roughness on contact angles. On hydrophobic materials, the observed contact angle is greater than Young’s contact angle; conversely, hydrophilic substrates exhibit a contact angle reduction relative to the Young’s contact angle. In essence, surface roughness enhances both the hydrophobicity and hydrophilicity of solid surfaces. This finding confirms that contact angles can be modulated through surface roughness, underscoring the substantial impact of roughness on contact angles. Wang et al. [11] created varying degrees of roughness on Teflon sheets using sandpaper grinding. Their study found that as the root mean square (RMS) roughness increased from 5 to 20 μm, both the advancing and receding angles initially increased and then decreased. Notably, contact angle measurements on roughened substrates systematically exceeded those obtained from the smoothest samples, indicating that roughness can augment the contact angle of hydrophobic surfaces. The explanation proposed by Extrand [12] is that the contact angle on rough hydrophobic surfaces is higher because the edges of the droplet are “trapped” by the boundaries of the grooves, preventing the liquid from moving across the scratches. Drelich et al. [13] suggest that the factors influencing the contact angle on rough surfaces include the following three aspects: (i) deformation of the TPC line, (ii) deformation of fluid motion due to mechanical and surface free energy barriers of the rough surface, and (iii) gas entrapment on rough hydrophobic surfaces. These results highlight the complex interplay between surface roughness and contact angles, emphasizing the potential for surface engineering to control wettability. This knowledge is crucial for the development of materials with tailored surface properties for various applications, from self-cleaning surfaces to efficient separation processes.
In the context of coal, the prevailing research to date has predominantly concluded that surface roughness exerts a detrimental influence on coal’s floatability [14,15,16,17,18,19]. Liu and colleagues investigated the contact angles of coal surfaces with varying degrees of roughness, employing the captive bubble technique [17]. Their findings revealed that on a coal surface characterized by a roughness of Ra = 0.34 μm, the contact angle was measured at 60.1°. However, when the roughness was escalated to 2.98 μm, it was observed that bubbles failed to adhere to the coal surface. These results imply that an augmentation in coal surface roughness is correlated with a diminution in contact angle. The outcomes reported by Chen and Niu align fundamentally with these observations [18,19]. It was discovered that the contact angles of both coking coal and anthracite, as determined through the captive bubble method, exhibited a decline in response to increased surface roughness. Niu et al. [19] postulated that within the flotation pulp, the coal surface is enveloped by a substantial water film, which adversely impacts the adhesion between bubbles and particles. Therefore, the flotation efficacy of coal particles featuring porous surfaces is compromised when compared to that of coal particles with smoother surfaces. Chen et al. [18] conducted an analysis of the induction times and contact angles associated with different grades of coarse coking coal and anthracite. Their research indicated that as surface roughness increased, so too did the induction time, while the contact angle correspondingly decreased. It is plausible that water becomes sequestered within the pores or fissures of rough coal surfaces, thereby impeding the adhesive forces between the coal surface and bubbles, as well as the migration of the three-phase contact (TPC) line.
Nonetheless, there have been reports indicating an increase in the contact angle of coal with the augmentation of surface roughness. Specifically, when the surface roughness (Ra) of ultra-low-ash coal was escalated from 0.2 μm to 1.6 μm, a corresponding increase in the contact angle from 77° to 83° was observed. Xia [20] hypothesized that grooves and depressions of suitable dimensions could impede the dispersion of water droplets, thereby elevating the contact angle. The surface of Taixi anthracite is characterized by hydrophobic pores, grooves, and channels that are saturated with air. During the assessment of the contact angle, these air-occupied pores present a significant barrier to the infiltration of water droplets, thereby inhibiting their spread and consequently resulting in an enlarged contact angle. Hence, the contact angle of the planar TaiXi coal surface escalates in tandem with the increase in surface roughness. A number of researchers have posited that surface roughness can enhance the adhesion efficiency of bubbles to particles, which in turn can improve the flotation performance of low-rank coal particles [21,22]. Investigations have revealed that the wetting film interposed between bubbles and rough coal surfaces is prone to rupture, swiftly leading to the formation of a three-phase contact (TPC) line. This phenomenon is attributed to the accelerated thinning of the liquid layer at the air/liquid interface over the asperities of rough surfaces. As the surface roughness of low-grade coal increases, the rate of expansion of the TPC line diameter has been noted to surge from 10 mm/s to 58 mm/s.
In summary, the consensus regarding the impact of surface roughness on the wettability of coal surfaces and the interactions between liquids/bubbles and coal surfaces remains inconclusive. In recent years, with the advancement of micro-force measurement systems, significant progress has been made in the measurement of adhesion forces between water droplets and solid particles/surfaces [23]. Samuel et al. [24] employed a micro-electromechanical balance to investigate the adhesion forces between water droplets and twenty different surfaces. Their results indicated that the adhesion force consistently decreased with the reduction of the advancing contact angle. Similarly, the detachment force was found to continuously decline with the increase of the receding contact angle. Sun et al. [25,26] utilized an adhesion force measuring instrument (DCAT 21) to measure the adhesion forces between water droplets and smooth as well as patterned polymers (both isotropic and anisotropic). They proposed a modified computational model for isotropic curved surfaces and introduced the concept of contact line density. By integrating a CCD camera with the adhesion force measuring instrument and synchronizing images with the acting forces, parameters such as adhesion force, dynamic contact angle, and the contact diameter of droplets with the surface during the continuous process of droplet–coal surface attachment and separation can be obtained. This provides a foundation for studying the influence of roughness on the droplet–coal interaction process.
Therefore, this study employs an adhesion force measuring instrument (DCAT 25) to analyze the impact of micron-scale roughness on the continuous process of droplet–coal surface adhesion and separation, investigating the relationship between adhesion force and dynamic contact angle as well as contact diameter. This research aims to provide support for understanding the role of surface physical morphology in the droplet–coal surface interaction process and to offer a theoretical foundation for modulating mineral hydrophobicity and floatability based on surface roughness, thereby enhancing the efficiency of flotation separation.
2. Materials and Methods
2.1. Preparation of Coal Samples with Different Roughness
The coal samples were sourced from the Guandi coal preparation plant in Shanxi, China, and are classified as lean coal. Coal blocks with a density of 1.3–1.4 g/cm3 were obtained through float-and-sink tests. A small cutting machine was used to cut the blocks into approximately 15 × 15 × 10 mm pieces. At room temperature, sanding machines TSG 250/E (PROXXON, Ansbach, Germany) and sandpaper were employed to polish the samples until a fresh, flat, crack-free coal surface was exposed. The sandpapers used in this experiment had grit numbers of 320, 600, 1000, and 2000. The four rough coal surfaces produced were named R320, R600, R1000, and R2000, respectively. After polishing, the blocks were sonicated for 20 s to remove any residual particles from the surface, followed by extensive rinsing with deionized water. The cleaned samples were then placed in covered containers to air dry naturally and were finally sealed for storage.
Table 1 presents the industrial analysis of the coal samples. Drawing from the industrial analysis data detailed in Table 1, one can garner a preliminary comprehension of several fundamental characteristics of the coal samples. The moisture content of the coal samples stands at 0.54%, a relatively low figure; the ash content is a mere 5.20%, signifying a minimal presence of impurity minerals within the sample. The volatile matter content is noted at 11.15%, which is deemed to be on the lower side, while the fixed carbon content is a substantial 83.11%. In summary, the coal samples are typified by their low volatile matter content, high fixed carbon content, and low levels of both moisture and ash.

Table 1.
Industrial analysis of coal samples.
2.2. XRD and FTIR
X-ray diffraction analysis was conducted on the samples using a Thermo Scientific Nicolet iS20 model X-ray diffractometer (Thermo Fisher Scientific, Waltham, MA, USA). The test conditions were as follows: X-ray voltage of 40 kV and current of 30 mA, with a Cu target; a goniometer radius of 250 mm and detector opening of 3°; both the incident side and diffracted side Soller slits were set to 2.5°. The scanning angle ranged from 3° to 70°, with a scanning speed of 0.1 s/step and a step size of 0.02°.
The surface functional groups of the coal were measured using a Thermo Scientific Nicolet iS20 model Fourier-transform infrared spectrometer (Thermo Fisher Scientific, Waltham, MA, USA). A small amount of coal powder was thoroughly mixed with dry potassium bromide powder in a 1:10 ratio, ground in a mortar, and then pressed into a pellet. The infrared spectrum was collected after first acquiring the background spectrum and then the sample’s infrared spectrum. The resolution was set to 4 cm−1, with 32 scans performed over a wavenumber range of 400–4000 cm−1, and the measurement temperature was 25 °C.
2.3. Roughness Measurement
The surface roughness of the coal was photographed and measured using a surface roughness measuring instrument (Mitutoyo SJ-210, Kawasaki, Japan). During the roughness measurement, the roughness traces intersected perpendicularly with the probe’s motion direction. The roughness measuring instrument was connected to a computer for data recording. The length of the single measurement area of the surface roughness measuring instrument was 4 mm, with a sampling step length of 10 μm and a test speed of 0.5 mm/s. The average arithmetic deviation () index was selected to characterize the roughness of different rough surfaces, which is represented as
where N represents the total number of discrete points along the measurement profile; Zi denotes the vertical displacement of the i-th measurement point relative to the mean plane; and corresponds to the arithmetic mean elevation across the entire measurement segment. is the average height of the entire measurement line. Each rough surface was randomly measured 5 times and the average value was calculated to determine the roughness of the four different rough surfaces.
2.4. Contact Angle Measurement
The contact angles of coal surfaces with different roughness levels were determined using a HARKE-SPCA model contact angle goniometer (Hake, Beijing, China). The testing method employed was the sessile drop method. For each rough surface, measurements were randomly taken five times and the average value was calculated to determine the contact angles of the four different rough surfaces.
2.5. Adhesion Force Measurement of Water Droplets to Coal Surfaces
In this study, a high-sensitivity adhesion force measuring instrument (DCAT 25, Dataphysics, Filderstadt, Germany) was utilized to measure the adhesion force between water droplets and coal surfaces. Integrated with a charge-coupled device (CCD) imaging module, the instrument can record video sequences during an adhesion force test, allowing for a direct observation of the water droplet–mineral interaction process (Figure 1). All experimental values are the average of at least five independent measurements to minimize errors.
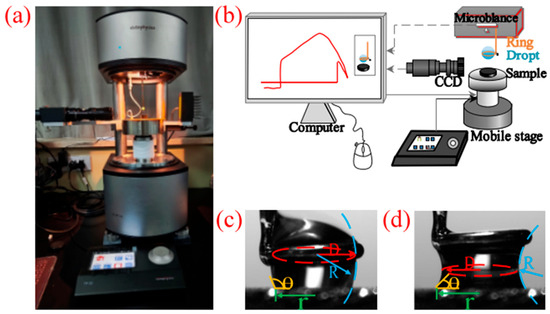
Figure 1.
Adhesion force measurement setup. (a) DCAT25, (b) schematic diagram of the adhesion and detachment process between a water droplet and coal, and (c,d) schematic diagrams for measuring contact angle and radius of curvature (D and R) when the droplet is in different states.
Figure 2 is a curve diagram of the interaction process between a water droplet and a rough coal surface. The entire process was continuously recorded by a CCD camera with a frame rate of 40 fps, capturing the attachment, spreading, compression, stretching, and separation of the water droplet. A micro-syringe was used to suspend a volume of ultrapure water droplet on a Du Noüy ring (with inner and outer diameters of 2.02 mm and 2.32 mm, respectively) connected to a microbalance. Synchronizing the image sequences with the force measurements allowed the determination of the contact angle (θ) and contact radius (r) of the droplet on the coal surface using Image-J software (version 1.8.0). Before measuring the force, the resultant force of the system was set to zero at point A, shown in Figure 2. The relationship between force and position is composed of five distinct steps (Figure 2): (i) The sample stage automatically rises and approaches the droplet without any recorded interaction force (from point A to B). (ii) The droplet adheres to the mineral surface, causing instantaneous spreading of the droplet (from point B to C). (iii) After adhering to the sample surface, the droplet continues to rise for a certain distance (from point C to D). (iv) The sample stage begins to descend, initiating the separation of the droplet from the sample surface (from point D to F), with the maximum adhesion force reached at point E. (v) The droplet detaches from the sample surface (from point F to G).
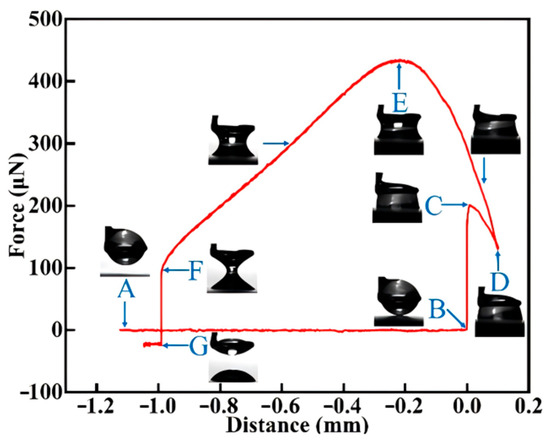
Figure 2.
Example of a typical record of a water droplet and rough coal surface system.
In this study, a 4 µL volume ultrapure water droplet (resistivity of 18.2 MΩ.cm) was first placed on a hanging ring. A programmatically controlled lifting platform moved the coal surface with different roughness levels upward at a constant speed of 0.03 mm/s until the DCAT 25 detected the coal sample surface (Point B). Upon contact with the coal surface, the speed immediately reduced to 0.01 mm/s, and at Point C, an attractive force was measured, reflecting the spontaneous spreading process of the droplet on the coal surface after adhesion. The recorded force is referred to as the spreading force (). During the spreading process, the droplet attempts to displace the air on the coal surface; thus, the contact angle measured at Point C is the advancing contact angle (). The force curve from Point C to Point D represents the compression process of the droplet on the rough coal surface. The compression distance was set to 0.1 mm to ensure an expanded contact area between the droplet and the coal surface, which aids in the repeatability of adhesion force measurements. At Point D, after the mechanical compression ends, the lifting platform carrying the coal sample begins to descend at a speed of 0.01 mm/s, and the droplet is gradually stretched. During the descent, a peak appears on the force curve, known as the maximum adhesion force (), and the equilibrium contact angle corresponding to peak adhesion force is designated as the most stable contact angle () [27]. As the droplet continues to be stretched, the liquid bridge formed during the descent gradually thins until it is pulled apart (Point F), and the force recorded at this time is referred to as the detachment force (). During the pulling process, the droplet is subjected to an upward traction force that causes the droplet to contract on the coal surface; therefore, the contact angle determined at coordinate F corresponds to the receding contact angle () [8,19]. After the liquid bridge is broken, the lifting platform movement is stopped and the measurement is also halted. All experimental measurements were performed under controlled ambient temperature (25 ± 1 °C), with replicate data averaging at least five independent trials to reduce measurement uncertainty.
3. Results and Discussion
3.1. XRD and FTIR Analysis
Figure 3 illustrates the XRD pattern of the coal sample. As depicted in the figure, the minerals within the coal sample primarily consist of kaolinite, quartz, and a minor amount of illite. Kaolinite and illite are hydrophilic clay minerals that readily disintegrate in water, thereby enhancing the wettability of the coal surface.
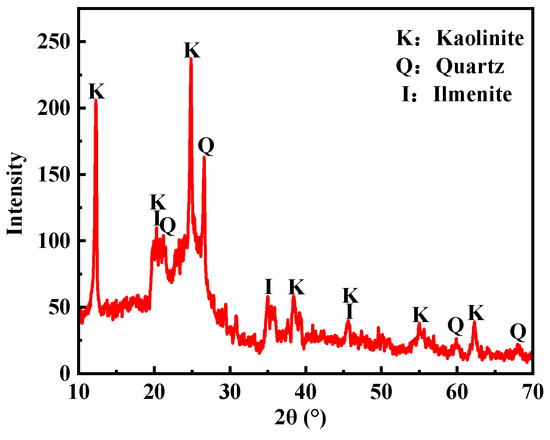
Figure 3.
XRD pattern of the coal sample.
Figure 4 displays the infrared spectrum of the sample. The peaks near the wavenumbers 3688 cm−1, 3647 cm−1, and 3619 cm−1 are due to the stretching vibration of -OH, and the absorption peaks are not obvious in the measured coal sample, indicating that the surface -OH has a negligible effect on the wettability of the coal surface. The wavenumber at 3031 cm−1 is due to the C-H vibration of aromatic hydrocarbons and the wavenumber at 2858 cm−1 is due to the stretching vibration of methylene in aliphatic hydrocarbons. The wavenumber near 1594 cm−1 is due to the vibration of C=C double bonds, and 1435 cm−1 is due to the bending vibration of -CH3. The wavenumbers between 670 and 864 cm−1 are due to the vibration information of oxygen-containing functional groups and hydrocarbon groups in the carbon skeleton of the sample.
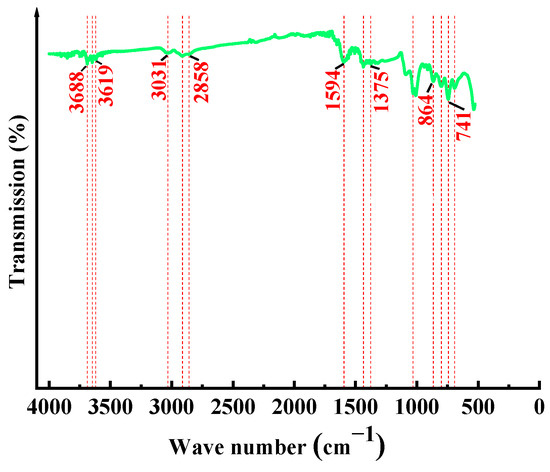
Figure 4.
Infrared spectrum of the coal sample.
3.2. Roughness Analysis
Figure 5 presents the roughness measurement evaluation curves for various rough coal surfaces. The waveform depicted is effectively the trajectory traced by the probe as it traverses the rough coal surface. Examining these four evaluation curves, it is evident that the roughness curve exhibits significant fluctuations following polishing with 320-grit sandpaper, indicating substantial changes in coal surface roughness. As the grit size of the sandpaper increases, the magnitude of roughness variation diminishes progressively. After treatment with 2000-grit sandpaper, the roughness curve displays a tendency toward gentle undulations, with the least amount of roughness change observed, suggesting that the surface approaches a smoother state.
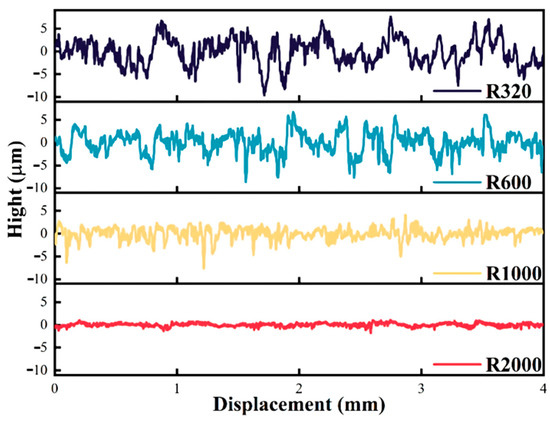
Figure 5.
Roughness measurement evaluation curve.
Figure S1 shows the relationship between sandpaper grit size and coal surface roughness. As the grit size of the sandpaper increases from 320 to 2000, the coal surface roughness (Ra) gradually decreases. After processing with 320-, 600-, 1000-, and 2000-grit sandpaper, the Ra values of the different rough coal surfaces are 2.39, 1.89, 1.03, and 0.30 µm, respectively. The change in pattern with the grit size of the sandpaper is consistent with the measurement results of other scholars; that is, it decreases with the increase of the grit size of the sandpaper and changes between 2.52 and 0.30 µm [28,29].
3.3. Contact Angle Measurement Result
3.3.1. Effect of Surface Roughness on Contact Angle
Figure 6 shows the relationship between roughness and contact angle measured by the sessile drop method. As the roughness increases, the contact angle gradually decreases. When the coal surface roughness increases from 0.30 µm to 1.03, 1.89, and 2.39 µm, the contact angle values decrease from 72.6° to 68.8°, 66.3°, and 61.6°, respectively. The measured static contact angle values are between the advancing contact angles (77.84–93.02°) and receding contact angles (29.98–67.45°) measured by Guo et al. [28], indicating that the contact angle measurement results are credible. Compared with the contact angle results measured by Liu et al. and Zhang et al. [17,29] (64.03–91.42° and 84.3–88.6°), the change pattern is basically consistent and the contact angle decreases with the increase of roughness. The variations in contact angle values reported for coal across different literature sources are likely attributable to differences in coal quality. Concurrently, the aforementioned data also suggest that the contact angle measured on coal surfaces does not invariably grow with a decrease in ash content. The contact angle of the coal surface is influenced by a multitude of factors, encompassing the structural morphology and chemical heterogeneity of the coal surface.
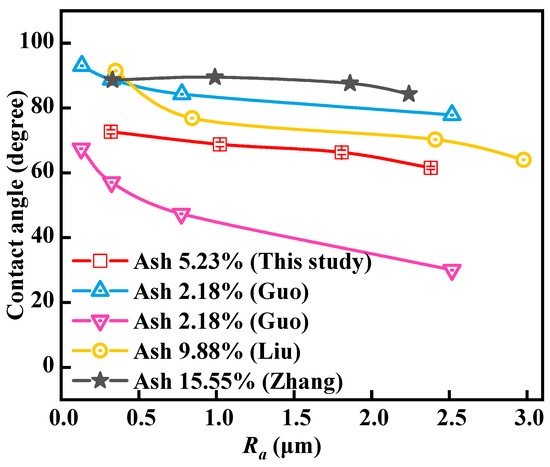
Figure 6.
Relationship between roughness and contact angle; ▲ and ▼, ●, and ★ indicate data are from Guo et al. [28], Liu [17], and Zhang [29], respectively.
3.3.2. Prediction of Contact Angle on Rough Coal Surfaces
Surface roughness is correlated with alterations in coal surface morphology and thereby influences its wetting behavior. In 1805, Young [30] first made a qualitative analysis of the contact angle of droplets on smooth surfaces and gave the famous Young’s equation. However, actual mineral surfaces are often not ideal smooth surfaces. Subsequent researchers have modified Young’s equation for actual rough mineral surfaces, proposing two classic models, namely the Wenzel [31] model and the Cassie [32] model, as shown in Figure 7.
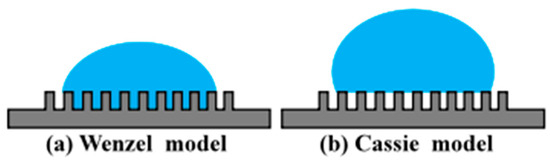
Figure 7.
Wettability model for rough surfaces. (a) Wenzel model; (b) Cassie–Baxter model.
Wenzel et al. believe that the grooves of hydrophilic surfaces (θ < 90°) will be replete with water, so the effective contact area between solid and liquid phases will expand under actual operating conditions, thereby reducing the contact angle. This is represented as
where is the ratio of the actual surface area to the projected area. The Wenzel model indicates that the liquid can completely penetrate the “valleys” of the rough mineral surface. Therefore, the projected area of the rough surface is smaller than the actual surface area and is generally greater than 1. θ is the equilibrium contact angle on a smooth flat coal surface and is the apparent contact angle in the Wenzel state.
Cassie and his colleagues proposed a composite contact theory. They extended the theory to heterogeneous surfaces and put forward a new viewpoint; that is, the liquid on hydrophobic surfaces cannot fill the “valleys,” and there will be gas retention between the droplet and the solid. The contact between the droplet and the rough surface is a composite contact, so the solid–liquid interface is actually composed of solid and gas. At this time, the apparent contact angle satisfies the Cassie equation:
where is the contact angle of the composite contact surface; and are the contact angles of the two phases; and and are the area fractions of these two phases on the surface, satisfying . When one of the phases is air, its liquid–gas contact angle is 180°, so the following equation is obtained:
Generally, on the same surface, droplets can exist in both the Wenzel state and the Cassie–Baxter state. When the surface is in the Cassie–Baxter state, it exhibits strong hydrophobicity; however, when the surface wetting state transitions from the Cassie–Baxter state to the Wenzel state, the surface becomes hydrophilic and the contact angle of the droplet decreases significantly. According to the Wenzel model, a smoother surface can be achieved through polishing, thereby enhancing the hydrophobicity of coal and improving its floatability. As the grit size of the sandpaper increases, leading to an increase in surface roughness from 0.30 µm to 2.39 µm, the contact angle value correspondingly decreases from 72.6° to 61.6°. The results of the contact angle measurements are consistent with the predictions of the Wenzel model.
Based on the roughness coefficient and the contact angle of the smooth surface, the apparent contact angle of the rough coal surface can be predicted using the method proposed by Wenzel. Therefore, the authors assumed two types of rough surface structure models (Figure 8) for calculation and approximated the contact angle of the coal surface with the smallest roughness (0.30 µm) as the equilibrium contact angle of the smooth surface, thereby calculating the contact angle of different roughness coal surfaces.
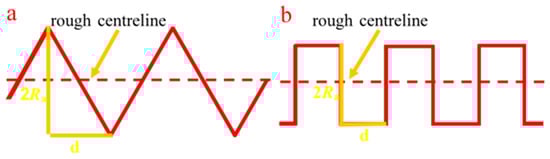
Figure 8.
Rough structure models, (a) serrated and (b) convex-concave.
For the serrated rough structure,
For the convex-concave rough structure,
where is the measured surface roughness, which is also the average arithmetic deviation of the profile, and d is the sampling step size of the roughness measuring instrument.
Figure 9 shows the relationship between the contact angles calculated under the two rough structure models and the experimental contact angle (θexp). When the surface roughness is 0.30, 1.03, 1.89, and 2.39 µm, the contact angles of the serrated different rough surfaces (θser) calculated by Formulas (1) and (4) are 72.3°, 71.5°, 70.7°, and 71.5°, respectively. The calculated contact angles largely do not change, which is inconsistent with the actual measurement results. The contact angles of the different convex-concave rough surfaces (θcon) calculated by Formulas (1) and (5) are 71.5°, 68.9°, 65.9°, and 63.9°, respectively. The calculated contact angles decrease with the increase of roughness, which is mostly consistent with the experimental contact angle results (72.6°, 68.8°, 66.3°, and 61.6°), and the calculation error does not exceed 3%. Therefore, it can be considered that the convex-concave type is more in line with the rough surface structure, and this model can accurately predict the contact angle of coal surfaces with different roughness.
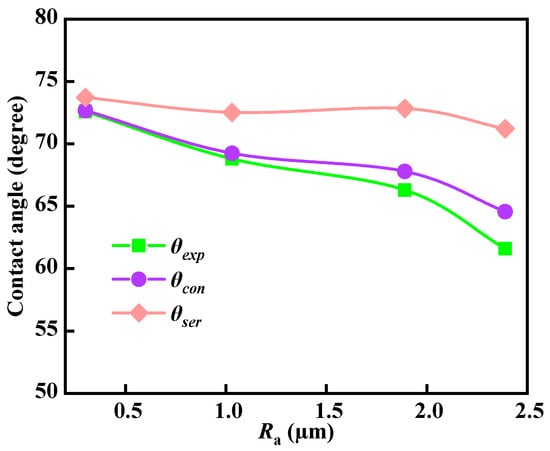
Figure 9.
Comparison of calculated contact angles with actual contact angles for different roughness models.
3.4. Interaction Between Droplets and Rough Coal Surfaces
3.4.1. Effect of Roughness on Interaction Force, Contact Angle, and Contact Diameter
To elucidate the interaction mechanisms between water droplets and coal surfaces, a deeper comprehension of the influence of roughness on the expansion, adhesion, separation, and detachment processes of droplets on coal surfaces was achieved through force measurement. Figure 10 illustrates the force curve when water droplets interact with coal surfaces of varying roughness. Table 2 presents the values of spreading force, maximum adhesion force, and detachment force during the interaction process between droplets and coal surfaces of different roughness levels. Initially, no force is recorded as the droplet gradually approaches the coal surface. Subsequently, upon establishing contact with the coal surface, the droplet instantaneously spreads, generating a spreading force that increases with surface roughness. This suggests that increased roughness enhances the hydrophilicity of the coal surface. For all four samples, the adhesion and spreading of the droplet occur spontaneously.
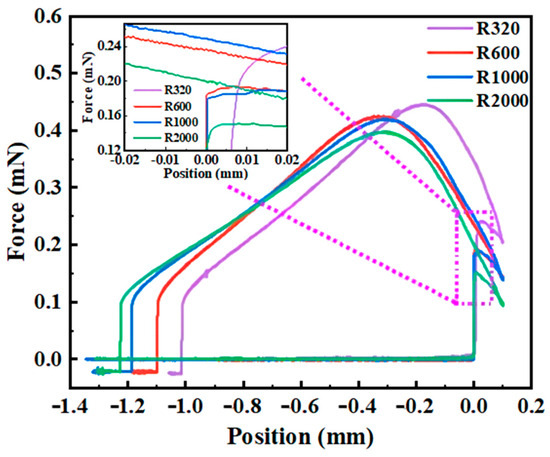
Figure 10.
Adhesion force measurement curves for different rough coal surfaces, with an inset showing a magnified view of the force during the spontaneous spreading of droplets on the coal surface.
Table 2.
Adhesion forces of different rough samples at points C, E, and F.
Following a continuous compression of 0.1 mm, the retraction of the coal causes the droplet to gradually elongate until the maximum adhesion force is reached (point E), with this maximum adhesion force increasing as the surface roughness escalates. Upon the emergence of the critical water bridge diameter, the adhesive force between the droplet and the coal surface surpasses the cohesive force within the water, leading to the droplet splitting into two segments prior to complete detachment (being pulled out) from the coal surface. However, prior to the appearance of the critical water bridge diameter, the maximum adhesion force that prevents the droplet from detaching is observed at point E, marking a significant point on the force curve.
Figure 11 establishes the correlation between roughness and adhesion force, contact angle, and contact diameter at critical point (points C, E, and F) between water droplets and coal surfaces of different roughness. As exhibited by Figure 11a, all three forces increase with the increase of roughness. For example, as the roughness increases from 0.30 µm to 1.03, 1.82, and 2.39 µm, the spreading force increases from 159.00 µN to 177.82, 200.99, and 209.60 µN, the maximum adhesion force increases from 406.76 µN to 416.08, 419.48, and 441.08 µN, and the detachment force increases from 95.37 µN to 96.63, 98.32, and 102.39 µN. This is expected because roughness increases the hydrophilicity of the coal surface, and water can fill the grooves formed on the concave surface, causing the water to spread faster on its surface [33,34], and the adhesion interaction between water and the coal surface is enhanced through surface roughening.
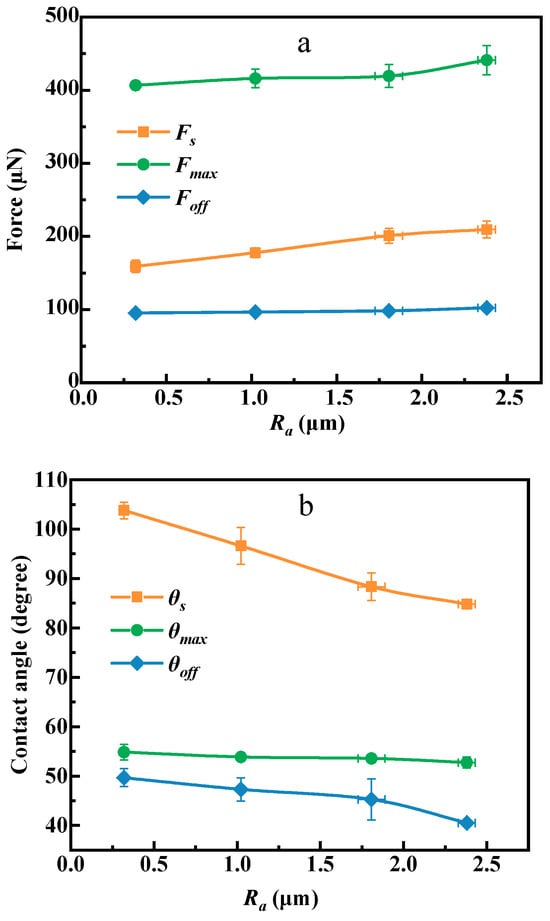
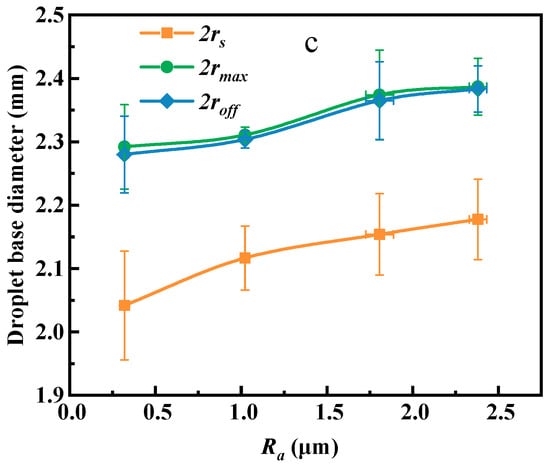
Figure 11.
Adhesion (a), contact angle (b), and contact baseline curves (c) of droplets at different roughness.
As shown in Figure 11b, the advancing contact angle (measured at point C), the most stable contact angle (measured at point E), and the receding contact angle (measured at point F) decrease with the increase of roughness, which is consistent with the contact angle measurement results. As the roughness increases from 0.30 µm to 1.03, 1.82, and 2.39 µm, the advancing contact angle decreases from 103.8° to 96.6°, 88.3°, and 84.8°, the most stable contact angle decreases from 54.8° to 53.9°, 53.6°, and 52.7°, and the receding contact angle decreases from 49.7° to 47.3°, 45.3°, and 40.5°.
As shown in Figure 11c, the three contact diameters of the droplet adhering to the coal surface (at points C, E, and F) all increase with the increase of roughness. As the roughness increases from 0.30 µm to 1.03, 1.82, and 2.39 µm, the contact diameter at the spreading point increases from 2.04 mm to 2.12 mm, 2.15 mm, and 2.18 mm, the contact diameter at the maximum adhesion point increases from 2.29 mm to 2.31 mm, 2.37 mm, and 2.39 mm, and the contact diameter at the detachment force point increases from 2.28 mm to 2.30 mm, 2.36 mm, and 2.39 mm.
Figure 12 is the contact images of droplets with coal of different roughness at points C, E, and F. As the roughness of the coal surface increases from 0.30 µm to 2.39 µm, the measured contact angle of the water droplet decreases from 103.8° to 84.8°, and it is also found that the gas–liquid interface gradually changes from a convex liquid surface to a concave liquid surface. This phenomenon may be attributed to the fact that as surface roughness increases, the coal surface becomes more hydrophilic. Consequently, the droplet adheres more strongly to the rough coal surface, spreading to a greater extent. The downward pull exerted by the droplet causes the liquid surface to gradually transform into a concave shape.
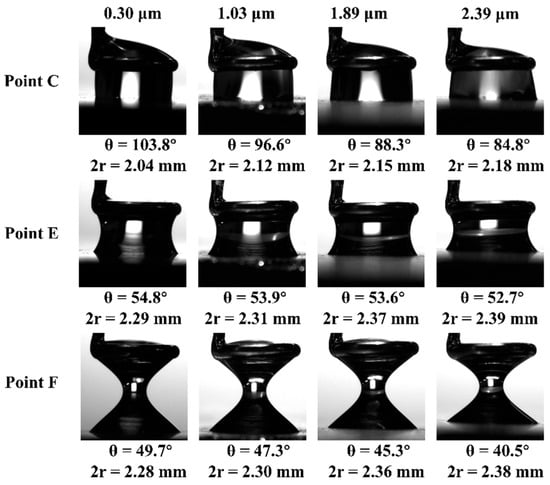
Figure 12.
Synoptic images of droplets with coals of different roughness at points C, E, and F.
At the maximum adhesion force point E, as the roughness of the coal surface increases, the curvature deformation of the gas–liquid interface progressively intensifies. In comparison with point C, the droplet further spreads across the coal surface, leading to a slight increase in the contact diameter. Concurrently, the contact angle transitions from the advancing angle to the receding angle, with a notable decrease observed. For example, the contact angle on the surface of the R2000 sample decreases from 103.8° to θmax 54.8°.
In contrast to point E, observations at the detachment point F reveal that the distance between the probe and the coal surface incrementally increases, with the gas–liquid interface becoming increasingly curved. The contact angle continues its decline, while the contact diameter remains essentially unchanged. This suggests that during the retraction phase on the coal surface, the three-phase contact line becomes pinned to the rough coal surface and is immobilized. Notably, even on the smoothest coal surface, characterized by a roughness Ra of 0.30 µm, the inherent rough structure is capable of “trapping” the three-phase contact line, thereby inhibiting its movement.
Figure 13 shows the relationship between the residual force of the droplet on the coal surface and roughness. The residual force reflects the size of the droplet volume remaining on the coal surface after the droplet separates from the coal surface. It is obvious that the residual force of the droplet increases with the increase of roughness. As the roughness increases from 0.30 µm to 2.39 µm, the residual force of the droplet increases from 20.74 µN to 23.64 µN. This phenomenon owes its existence to the reality that as the surface roughness increases, droplets adhere more extensively to the coal surface. When the droplet is stretched and begins to separate from the surface, the volume of the liquid bridge reaches the microliter level, at which point the influence of gravity becomes relatively significant. Under these conditions, the weight of the lower part of the liquid bridge exceeds that of the upper part, causing the liquid bridge to rupture more rapidly during the stretching process of the water droplet [35]. Concurrently, the cohesive force of the droplet struggles to overcome the pinning of the contact line, making it difficult to retract the spread droplet. This ultimately results in an increase in the residual volume of the droplet on the surface as roughness increases.
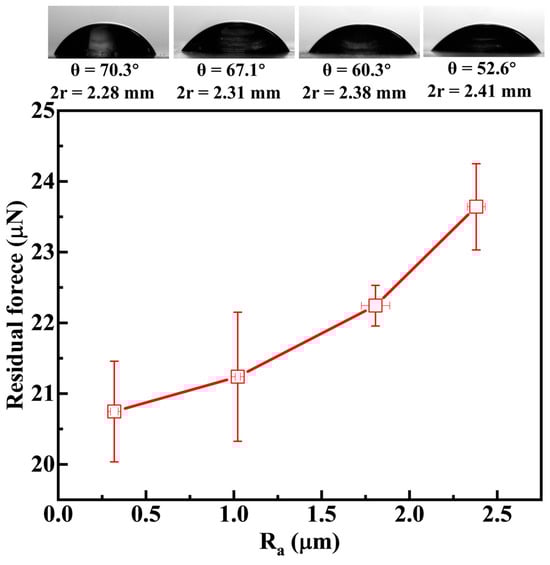
Figure 13.
Roughness in relation to droplet residual force.
Since the increase in roughness increases the hydrophilicity of the coal surface, the contact angle of the residual droplet decreases with the increase of roughness, and the contact diameter increases with the increase of roughness. For example, as the roughness of the coal surface increases from 0.30 µm to 2.39 µm, the contact angle of the residual droplet after detachment decreases from 70.3° to 52.6°, and the contact diameter increases from 2.28 mm to 2.41 mm. It is worth noting that for the sample R320 with the largest roughness, the contact diameter at point F before detachment is 2.38 mm (Figure 13) and the contact diameter after detachment becomes 2.41 mm (Figure 13), indicating that the droplet remaining on the coal surface after detachment will further spread spontaneously, while the smoothest R2000 does not exhibit a similar phenomenon. This further indicates that the increase in roughness enhances the hydrophilicity of the coal surface.
Additionally, the contact angle of the residual droplet varies with roughness in a manner analogous to that of the static contact angle. However, as illustrated in Table 3, these two values are not identical. The disparity between them (Δθ) augments with an increase in roughness. During the detachment process of the droplet, the droplet’s spread on a rougher coal surface encounters greater difficulty in traversing the surface grooves, and the pinning effect of the contact line is more pronounced. This results in minimal retraction of the contact line and a larger contact diameter, thereby increasing the divergence from the static contact angle of the rough coal surface.
Table 3.
Comparison of contact angles of residual droplets and static contact angles.
3.4.2. Relationship Between Force and Dynamic Contact Angle, Contact Diameter
Figure 14a shows the relationship between the spreading force, maximum adhesion force, and detachment force of droplets and the advancing contact angle, most stable contact angle, and receding contact angle. The smaller the contact angle, the greater the corresponding droplet–coal interaction force. At the spreading point, when the contact angle decreases from 103.8° (Ra = 0.30 µm) to 84.8° (Ra = 2.39 µm), the spreading force increases from 159.00 µN to 209.60 µN. At the maximum adhesion force point, when the contact angle decreases from 54.8° (Ra = 0.30 µm) to 52.7° (Ra = 2.39 µm), the maximum adhesion force increases from 406.76 µN to 441.08 µN. At the detachment point, when the contact angle decreases from 49.7° (Ra = 0.30 µm) to 40.5° (Ra = 2.39 µm), the detachment force increases from 95.37 µN to 102.39 µN.
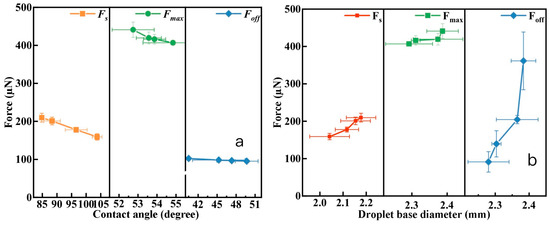
Figure 14.
Dependence of adhesive force on the contact angle (a) and contact diameter (b).
There is a good correlation between dynamic contact angle and adhesion force. This is consistent with the research results of Zhu et al. [36]. They found that there is a linear correlation between spreading force and advancing contact angle, and therefore believe that the advancing contact angle should be the key parameter controlling spontaneous spreading. Sun [26] also reported that the spreading force increases with the decrease of the advancing contact angle and that the maximum adhesion force between water droplets and methylated glass increases with the decrease of the most stable contact angle value.
Figure 14b shows the relationship between the spreading force, maximum adhesion force, and detachment force of droplets and the corresponding contact diameter of the droplets. As the baseline diameter of the droplet increases, the corresponding droplet–coal interaction force also increases. At the spreading point, when the droplet baseline diameter increases from 2.04 mm (Ra = 0.30 µm) to 2.18 mm (Ra = 2.39 µm), the spreading force increases from 159.00 µN to 209.60 µN. At the maximum adhesion force point, when the droplet baseline diameter increases from 2.29 mm (Ra = 0.30 µm) to 2.39 mm (Ra = 2.39 µm), the maximum adhesion force increases from 406.76 µN to 441.08 µN. At the detachment point, when the contact diameter increases from 2.28 mm (0.30 µm) to 2.39 mm (2.39 µm), the detachment force increases from 95.37 µN to 102.39 µN.
On surfaces with greater roughness, the presence of increased microscopic undulations and irregular structures leads to an expanded contact area between the droplet and the solid surface, effectively increasing the contact diameter. Concurrently, the three-phase contact line lengthens with heightened surface roughness, signifying enhanced interaction among the liquid, gas, and solid phases, thereby augmenting the adhesion force. Moreover, on such rougher surfaces, the liquid becomes enveloped by minute protrusions, inducing a contact line pinning effect, which further escalates the adhesion force between the droplet and the solid surface. Thus, it can be concluded that on rougher surfaces, the adhesion force between water droplets and solid surfaces is significantly greater, a phenomenon that is correlated with both the increase in contact diameter and the elongation of the three-phase contact line.
3.5. Theoretical Calculation of Interaction Force Between Droplets and Coal Surfaces
The interaction force (F) between droplets and coal surfaces consists of two parts [26]: (i) One is the vertical component of the gas–liquid interface tension acting along the circumference of the three-phase contact line, called surface tension (FT) and (ii) the other is the Laplace pressure force (FL) caused by the pressure difference on the gas–liquid interface due to the stretching of the droplet.
where is the length of the three-phase contact line. is the gas–liquid interface tension; is the contact angle; A is the projected contact area at the bottom of the droplet; and is the Laplace pressure described by the Young–Laplace equation, calculated by the following formula.
For a convex gas–liquid interface,
For a concave gas–liquid interface,
where D and R are the principal radii of the gas–liquid interface (as shown in Figure 1).
For an ideal smooth, uniform, and flat surface, the length of the three-phase contact line can be defined as , where r is the contact radius. For a real surface, can be higher or lower than the calculated value. By increasing the roughness of the hydrophilic coal surface (θ < 90°), the droplet can be trapped in the grooves, thereby strengthening the twisting of the contact line, making , but this is difficult to achieve experimentally and quantitatively. Because it is necessary to obtain the dynamic twisting degree of the three-phase contact line in three-dimensional space from a microscopic perspective and perform quantitative calculations, which is difficult to achieve in experiments. Moreover, due to the irregularity of the rough coal surface structure, the microscopic contact angle and contact line twisting degree at each point on the three-phase contact line are different, so it is almost impossible to accurately obtain the contact line density on the rough coal surface [26]. However, it can be affirmed that the increase in contact line length is the main reason for increasing the surface tension component in the above formula.
Figure 15 is a comparison chart of the calculated values and experimental values of the spreading force and maximum adhesion force. When the roughness changes from 0.30 µm to 2.39 µm, the calculated spreading forces are 147.86 µN, 170.63 µN, 191.50 µN, and 207.99 µN, respectively, with an error of no more than 8% compared to the corresponding experimental values. The calculated maximum adhesion forces are 384.01 µN, 411.39 µN, 420.68 µN, and 426.54 µN, respectively, with an error of no more than 6% compared to the corresponding experimental values. The calculated detachment forces are 89.56 µN, 93.77 µN, 97.16 µN, and 105.83 µN, respectively, with an error of no more than 7% compared to the corresponding experimental values. Therefore, it can be concluded that the above theoretical formula can be used to calculate the interaction force between droplets and actual rough mineral surfaces.
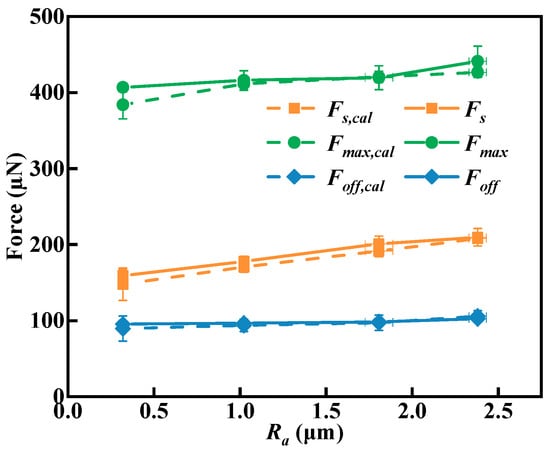
Figure 15.
Comparison of calculated and experimental forces at different roughness.
The differences between the calculated values and experimental values may be attributed to errors in the measurement of contact angle, droplet radius, surface curvature, and adhesion diameter on the microbalance-captured images. In addition, the shape adjustment of the three-phase contact line to the terrain features due to surface roughness also corresponds to these differences. The differences caused by roughness await further study.
4. Conclusions
This study analyzed the adhesion and detachment process of droplets on coal with different roughness using a highly sensitive adhesion force measurement instrument to obtain forces and synchronous images. The relationship between surface roughness and wettability was explored through experiments and theoretical models, which is of great significance for understanding the adhesion mechanism of particles and droplets, bubbles during the mineral flotation process. The specific conclusions are as follows:
This study meticulously examined the adhesion and detachment dynamics of droplets on coal surfaces exhibiting different levels of roughness. A sophisticated, highly sensitive adhesion force measurement instrument was employed to simultaneously gather force metrics and corresponding visual data. This research delved into the interplay between surface roughness and wettability through both empirical experimentation and theoretical constructs, insights that are crucial for grasping the adhesion mechanics of particles and droplets, as well as the behavior of bubbles in mineral flotation. The specific conclusions drawn from this research are as follows:
- (1)
- As the roughness increases, the spreading force, maximum adhesion force, and detachment force of the droplets gradually increase. When the coal surface roughness increases from 0.30 µm to 1.03, 1.82, and 2.39 µm, the spreading force increases from 159.00 µN to 177.82, 200.99, and 209.60 µN, the maximum adhesion force increases from 406.76 µN to 416.08, 419.48, and 441.08 µN, and the detachment force increases from 95.37 µN to 96.63, 98.32, and 102.39 µN.
- (2)
- At the points of droplet spreading, maximum adhesion, and critical detachment, the contact angle, contact diameter, and corresponding forces exhibit fundamental consistency. As surface roughness increases, the contact angle decreases, the contact diameter expands, and the interaction force intensifies.
- (3)
- The interaction forces between droplets and coal surfaces were subjected to theoretical calculations and analyses. The computed values for the spreading force, maximum adhesion force, and detachment force were found to increase in tandem with the rise in surface roughness. These calculated forces align closely with experimental forces, exhibiting a discrepancy of no more than 8%. This level of accuracy validates their utility in forecasting the magnitude of interaction forces between water droplets and coal surfaces.
Supplementary Materials
The following supporting information can be downloaded at: https://www.mdpi.com/article/10.3390/separations12060137/s1, Figure S1: Relationship between roughness and sandpaper grit size, ▲, ▼, ◆ data are from references [14], [28] and [20], respectively.
Author Contributions
S.H., data curation and writing original draft; P.X., writing, review and editing; X.D., supervision, review and editing; H.C., methodology and writing; S.L., data acquisition; Y.S., conceptualization, methodology, formal analysis, funding acquisition, and supervision. All authors have read and agreed to the published version of the manuscript.
Funding
This research was funded by National Natural Science Foundation of China grant number 52204275 and a research project supported by the Shanxi Scholarship Council of China grant number 2022-059.
Data Availability Statement
The authors confirm that the data supporting the findings of this study are available within the article.
Conflicts of Interest
Author Peng Xiong was employed by the company Tongling Nonferrous Metals Group Holding Co., Ltd. The remaining authors declare that the research was conducted in the absence of any commercial or financial relationships that could be construed as a potential conflict of interest.
References
- Krasowska, M.; Zawala, J.; Bradshaw-Hajek, B.H. Interfacial characterisation for flotation: 1. Solid-liquid interface. Curr. Opin. Colloid. Interface Sci. 2018, 37, 61–73. [Google Scholar] [CrossRef]
- Sun, Y.; Bu, X.; Ulusoy, U.; Guven, O.; Hassas, B.V.; Dong, X. Effect of surface roughness on particle-bubble interaction: A critical review. Miner. Eng. 2023, 201, 108223. [Google Scholar] [CrossRef]
- Yang, X.J. Flotation experiment of poor-floatability slime with B-H collector. Coal Eng. 2023, 55, 165–169. [Google Scholar]
- Qu, J.Z.; Luo, C.; Li, P.Y. Advances in flotation collectors of low-rank coal and its interaction mechanism. Metal. Mine 2023, 8, 28–35. [Google Scholar]
- Yang, C.H.; Hou, Y.; Tong, M. Study on the influence of different types of surfactant—Emulsified coal oil on the flotation of low-rank coal. Coal Eng. 2023, 55, 158–164. [Google Scholar]
- Krasowska, M.; Terpilowski, K.; Chibowski, E. Apparent contact angles and time of the three-phase contact formation by the bubble colliding with Teflon surfaces of different roughness. Physicochem. Probl. Miner. Process. 2006, 40, 293–306. [Google Scholar]
- Bu, X.; Tong, Z.; Sun, Y.; Xie, G.; Dong, X. Research progress on the impact of mineral surface roughness on particle-bubble interaction. J. China Coal Soc. 2023, 48, 4171–4182. [Google Scholar]
- Busscher, H.J.; van Pelt, A.W.J.; de Boer, P. The Effect of Surface Roughening of Polymers on Measured Contact Angles of Liquids. Colloids Surf. 1984, 9, 319–331. [Google Scholar] [CrossRef]
- Szczerkowska, S.; Wiertel-Pochopien, A.; Zawala, J. Kinetics of Froth Flotation of Naturally Hydrophobic Solids with Different Shapes. Miner. Eng. 2018, 121, 90–99. [Google Scholar] [CrossRef]
- Shibuichi, S.; Onda, T.; Satoh, N. Super water-repellent surfaces resulting from fractal structure. J. Phys. Chem. 1996, 100, 19512–19517. [Google Scholar] [CrossRef]
- Wang, D.H.; Zhu, Z.L.; Yang, B. Nano-scaled roughness effect on air bubble-hydrophilic surface adhesive strength. Colloids Surf. A 2020, 603, 125228. [Google Scholar] [CrossRef]
- Extrand, C.W. Contact angles and hysteresis on surfaces with chemically heterogeneous islands. Langmuir 2003, 19, 3793–3796. [Google Scholar] [CrossRef]
- Drelich, J.; Miller, J.D.; Good, R.J. The effect of drop (bubble) size on advancing and receding contact angles for heterogeneous and rough solid surfaces as observed with sessile-drop and captive-bubble techniques. J. Colloid. Interface Sci. 1996, 179, 37–50. [Google Scholar] [CrossRef]
- Xing, Y.W.; Zhang, Y.F.; Ding, S.H. Effect of surface roughness on the detachment between bubble and glass beads with different contact angles. Powder Technol. 2020, 361, 812–816. [Google Scholar] [CrossRef]
- Xia, W.C. Role of surface roughness in the attachment time between air bubble and flat ultra-low-ash coal surface. Int. J. Miner. Process. 2017, 168, 19–24. [Google Scholar] [CrossRef]
- Liu, A.; Han, F.; Li, Z.H. Research progress of nano-bubble in micro-fine mineral flotation. Res. Prog. Nanobubble Micro-Fine Miner. Flotat. 2018, 3, 81–86. [Google Scholar]
- Liu, M.; Zhang, Y.F.; Guo, F.Y. Effect of surface roughness on floatability of coal slime. Coal Sci. Technol. 2019, 47, 253–258. [Google Scholar]
- Chen, Y.R.; Xia, W.C.; Xie, G.Y. Contact angle and induction time of air bubble on flat coal surface of different roughness. Fuel 2018, 222, 35–41. [Google Scholar] [CrossRef]
- Niu, C.K.; Xia, W.C.; Xie, G.Y. Effect of low-temperature pyrolysis on surface properties of sub-bituminous coal sample and its relationship to flotation response. Fuel 2017, 208, 469–475. [Google Scholar] [CrossRef]
- Xia, W.C.; Li, Y.F. Role of roughness change on wettability of taixi anthracite coal surface before and after the heating process. Energy Fuels 2016, 30, 281–284. [Google Scholar] [CrossRef]
- Wang, S.W.; Guo, J.F.; Tang, L.F. Effect of surface roughness of Chinese sub-bituminous coal on the kinetics of three-phase contact formation. Fuel 2018, 216, 531–537. [Google Scholar] [CrossRef]
- Tao, D. Role of bubble size in flotation of coarse and fine particles—A review. Separ. Sci. Technol. 2005, 39, 741–760. [Google Scholar] [CrossRef]
- Sun, Y.; Li, Y.; Dong, X.; Bu, X.; Drelich, J.W. Spreading and adhesion forces for water droplets on methylated glass surfaces. Colloids Surf. A 2020, 591, 124562. [Google Scholar] [CrossRef]
- Samuel, B.; Zhao, H.; Law, K.Y. Study of wetting and adhesion interactions between water and various polymer and superhydrophobic surfaces. J. Phys. Chem. C 2011, 115, 14852–14861. [Google Scholar] [CrossRef]
- Sun, Y.J.; Jiang, Y.H.; Choi, C.H. The most stable state of a droplet on anisotropic patterns: Support for a missing link. Surf. Innov. 2018, 6, 133–140. [Google Scholar] [CrossRef]
- Sun, Y.J.; Jiang, Y.H.; Choi, C.H. Direct measurements of adhesion forces of water droplets on smooth and patterned polymers. Surface Innov. 2017, 6, 93–105. [Google Scholar] [CrossRef]
- Marmur, A.; Della Volpe, C.; Siboni, S. Contact angles and wettability: Towards common and accurate terminology. Surf. Innov. 2017, 5, 3–8. [Google Scholar] [CrossRef]
- Guo, Z.M.; Yang, J.G.; Wang, Y.L. Mineral Processing; Studies from China University of Mining and Technology in the Area of Mineral Processing Described (An Investigation of Continuous Interaction Process Between Air Bubble and Various Roughness Coal Surfaces Using Microbalance). Min. Miner. 2020, 56, 12–22. [Google Scholar]
- Zhang, J.; Xu, B.; Wei, J.P. Numerical simulation of coal surface contact angle based on roughness. Coal Sci. Technol. 2023, 51, 96–104. [Google Scholar]
- Young, T. An essay on the cohesion of fluids. Philos. Trans. R. Soc. Lond. 1805, 95, 65–87. [Google Scholar]
- Wenzel, R.N. Surface roughness and contact angle. J. Phys. Chem. 1949, 53, 1466–1467. [Google Scholar] [CrossRef]
- Cassie, A.B.D.; Baxter, S.J. Wettability of porous surfaces. Trans. Faraday Soc. 1944, 40, 546–551. [Google Scholar] [CrossRef]
- Krasowska, M.; Malysa, K. Wetting films in attachment of the colliding bubble. Adv. Colloid. Interface Sci. 2007, 134, 138–150. [Google Scholar] [CrossRef]
- Chen, H.; Tang, T.; Zhao, H. How pinning and contact angle hysteresis govern quasi-static liquid drop transfer. Soft Matter 2016, 12, 1998–2008. [Google Scholar] [CrossRef]
- Ding, S.H.; Xing, Y.W.; Zheng, X. New Insights into the Role of Surface Nanobubbles in Bubble-Particle Detachment. Langmuir 2020, 36, 4339–4346. [Google Scholar] [CrossRef]
- Zhu, C.Y.; Li, G.S.; Xing, Y.W. Adhesion forces for water/oil droplet and bubble on coking coal surfaces with different roughness. Int. J. Min. Sci. Technol. 2021, 31, 681–687. [Google Scholar] [CrossRef]
Disclaimer/Publisher’s Note: The statements, opinions and data contained in all publications are solely those of the individual author(s) and contributor(s) and not of MDPI and/or the editor(s). MDPI and/or the editor(s) disclaim responsibility for any injury to people or property resulting from any ideas, methods, instructions or products referred to in the content. |
© 2025 by the authors. Licensee MDPI, Basel, Switzerland. This article is an open access article distributed under the terms and conditions of the Creative Commons Attribution (CC BY) license (https://creativecommons.org/licenses/by/4.0/).