Abstract
The antihypertensive drugs indapamide, atenolol, metoprolol, propranolol and bisoprolol were considered in this research. Because they have structures that are affected by pH, developing a chromatographic method was challenging. Based on the speciation diagram of these compounds versus pH scale, a mixed-mode stationary phase (hydrophobic stationary phase, C18 and strong cation exchanger (SCX)) was our first choice. Design of Experiments (DoE) was used to estimate how various factors such as pH, mobile phase composition and flow rate influenced chromatographic performance. As a result, the separation was achieved in 24 min using an aqueous phosphate buffer phase (pH 7.20) and 20 mM triethylamine, with methanol being used as organic modifier (30%). Their retention mechanism was investigated. The new method was validated in term of linearity, limits of detection and quantification, precision, accuracy, and robustness. The method was applied to river water samples, and good results were obtained.
1. Introduction
Antihypertensive drugs include several classes of compounds designed to prevent, control or treat high blood pressure, also known as hypertension [1]. This is a lifelong condition that increases the risk of developing various cardiovascular disorders, including coronary heart disease, heart attack, atrial fibrillation, congenital heart disease, heart failure, stroke and peripheral vascular disease [2]. Five different classes of first-line drugs (beta-blockers, diuretics, calcium channel blockers, angiotensin-converting enzyme inhibitors and angiotensin II receptor blockers) are recommended to reduce blood pressure and cardiovascular events, either as monotherapy or in a combination therapy [3,4]. For example, using a combination of a beta-blocker and a thiazide diuretic has an additive antihypertensive effect, compared with using a single drug [5].
Determining drug levels in biological matrices, or therapeutic drug monitoring, could be an effective tool for controlling therapy and ensuring appropriate dosing of antihypertensive drugs. Also, screening analysis of beta-blockers and diuretics is essential in doping control, as these classes of antihypertensive drugs are prohibited in certain sports by the World Anti-Doping Agency [6]. In addition, with the increased consumption of dietary supplements that may offer performance and health benefits, especially those with botanical ingredients, the adulteration of these types of products has become a public health issue [7]. Because the chemicals are cheaper than the active ingredients found in some herbal dietary supplements, they are added illegally and can cause adverse cardiovascular effects through a contaminant, a herbal ingredient or a herbal–drug interaction [8].
Another problem that continues to pose a significant global threat is environmental pollution. The presence of antihypertensive drugs in aquatic environments, particularly beta-blockers, is attracting attention because of potential adverse effects on aquatic organisms and consequent risks to human health [9]. Considering that antihypertensive treatment is long-term, and subject to hepatic metabolism and renal excretion, significant quantities of unmodified drugs or by-products may be released into the environment [10]. The presence of these contaminants in the environment is due to incomplete removal during passage through wastewater treatment plants and the relatively high persistence of some of them in water matrices [11].
In this context, the simultaneous determination of antihypertensive drugs is useful. This requires a selective and sensitive analytical method to identify the drug type in different matrices and to quantify it at low concentrations. High-performance liquid chromatography (HPLC) coupled with sensitive detectors is the analytical technique of choice in pharmaceutical development and production. It is also an indispensable tool in biological, environmental and toxicological studies for separating components from complex mixtures.
Progress in the development of LC-MS methods for antihypertensive drugs has been significant over the last decade; they now offer enhanced sensitivity and specificity, as well as the ability to analyze a wide range of analytes with varying polarities. Some of these methods have been used to determine beta-blockers in environmental samples [12] or in biological fluids [13], both with [14,15,16,17] and without gradient elution [18,19]. All these methods have a short time of analysis and detection limits of nanograms/L, comparable with HPLC-FLD [20], but much more sensitive than HPLC-DAD [21]. However, this is not a general rule, as there are also HPLC-DAD methods with detection limits comparable to those of LC-MS methods [22].
A thorough review of the literature reveals a few liquid chromatographic methods for the simultaneous screening of antihypertensive agents in human urine samples for doping control [23,24,25], but also as adulterants of herbal products [26,27,28,29,30]. There are also some interesting overviews of current trends in chromatographic approaches to the separation and analysis of cardiovascular drugs and their metabolites [31,32,33,34,35].
This paper proposes for the first time a method which not only achieves simultaneous determination of the diuretic indapamide (IDP) and the beta-blockers atenolol (ATN), bisoprolol (BSP), metoprolol (MTP) and propranolol (PPL), but also provides evidence in elucidating the retention mechanisms of these compounds on a duet stationary phase. The method was applied to river water samples, and good results were obtained.
2. Materials and Methods
2.1. Chemicals and Reagents
All the chemicals and solvents were of analytical grade. Atenolol (99.4%) and indapamide (99.8%) were kindly provided by Laropharm (Bragadiru, Romania). Metoprolol (99.68%), propranolol (99.7%), bisoprolol (99.7%), methanol (HPLC grade) and acetonitrile (HPLC grade) were purchased from Sigma Aldrich (Darmstadt, Germany). Potassium dihydrogen phosphate, dipotassium hydrogen phosphate and potassium nitrate were acquired from Merck (Darmstadt, Germany).
Each of the stock standard solutions (1 mg/mL) of ATN, MTP, PPL, BSP and IDP were daily prepared by dissolving the appropriate quantity of the analyte in 25 mL methanol. Working standard solutions (0.1 mg/mL) used for the system suitability test were prepared in 10 mL volumetric flasks by diluting the corresponding stock standard solution with methanol.
Solutions of 0.01 mg/mL, obtained by appropriate dilution, were used to record the UV spectra of each analyte against methanol.
Potassium nitrate (0.1 mg/mL) was used to establish the void volume of the column.
2.2. Instrumentation
Chromatographic analysis was performed with an HPLC Finnigan Surveyor system (Thermo-Electron Corporation, Waltham, MA, USA) equipped with a quaternary pump, an automatic injector, a column thermostat, temperature-controlled sample trays, an on-line degasser and a photodiode array detector with a cell length of 50 mm. The system was controlled by ChromQuest software (version 5.0). The calibration of the HPLC followed our own calibration plans based on risk assessment and historical data. Flow rate, caffeine spectral scans and pressure testing are the parameters we regularly check.
Ultra-pure water (18 MΩ·cm) was produced using an ULTRA CLEAR system (Richfield, UT, USA). pH values of buffer solutions were measured using a pH/mV-meter Consort P901 (Turnhout, Belgium). A Jasco V530 spectrometer (Tokyo, Japan), controlled by Spectra Manager software (version 1.54) and provided with a quartz cell (1 cm), was used for UV spectra recording.
The HPLC method was developed using a Hypersil Duet C18/SCX column (250 mm × 4.6 mm) containing a mixed-mode stationary phase of C18 and SCX with 5 µm particle size (Thermo Scientific, Waltham, MA, USA). Elution was isocratic, and the mobile phase was delivered at a flow rate of 2 mL/min, being composed of phosphate buffer (pH 7.20) and methanol as organic modifier (30%). The temperature of the column was kept constant at 25 °C, the injection volume was 10 µL, and the detection was performed with a diode array detector (DAD) at 226 nm. The flow rate was set at 1 mL/min.
Separation was completed in 24 min at room temperature using an aqueous phosphate buffer phase (pH 7.20) and TEA 20 mM, with methanol being used as organic modifier (30%). Elution was isocratic at a flow rate of 2 mL/min, detection was performed at 226 nm, and the volume of injection was 10 µL.
2.3. Sample Preparation
River water samples were collected according to ISO 5667-6 [36] from the Sabar River (44°23′50.7″ N 25°54′50.8″ E), located in the western part of Bucharest. Using this procedure, we obtained a composite sample of 2 L which was stored in amber glass at 4 °C before analysis. The first step was to filter the sample through a filter paper to remove larger particles; pH was then adjusted to 10.0 using a solution of KOH 1 mol/L. The SPE method used has been described in the literature [37] and was applied as follows: cartridges (Supelclean ENVI-18 SPE, 500 mg, MilliporeSigma Supelco, Bellefonte, PA, USA) were conditioned with 3 mL of both methanol and ultrapure water; a 250 mL water sample was then loaded at a flow rate of 10 mL/min. The cartridges were washed with ultrapure water and allowed to dry. Finally, the retained analytes were eluted with methanol (two fractions, 3 mL of each). The effluents were re-combined and then analyzed by HPLC.
2.4. Method Performance
In order to validate the method according to the ICH guidelines [38], the following performance parameters were optimized: linearity, limit of detection (LOD), limit of quantification (LOQ), accuracy, precision, and robustness.
The linear concentration range was established by three replicate injections of each of the mixed-standard working solutions with concentrations ranging from 0.1 to 1 μg/L. Calibration curve equations were obtained from the peak areas versus concentrations plot using linear regression. LOD and LOQ were calculated as 3sa/b and 10sa/b, respectively, where sa is the residual standard deviation of the intercept of the regression equation and b is the slope of the calibration curve. The precision of the method was evaluated in terms of repeatability (intra-day) and intermediate precision (inter-day). Accuracy was estimated by calculating the percentage recoveries of the concentrations of the target compounds added to the river water sample. The robustness of the method was assessed by making small but deliberate changes to values of temperature, mobile phase pH, and the wavelength at which the detection was made.
3. Results and Discussion
3.1. HPLC Method Development
3.1.1. Setting the Wavelength for DAD Detection
Spectra recorded between 200 and 400 nm were used to determine the optimal wavelength for the simultaneous determination of all five compounds. In this region, ATN and PPL have maxima at 225 and 229 nm, respectively, IDP and MTP absorb at 226 nm but have no maximum, and MTP has a maximum at 222 nm. Therefore, based on these UV spectra, 226 nm was selected as the best wavelength for DAD detection.
3.1.2. Compound Speciation over pH
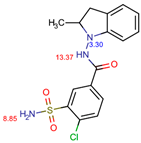
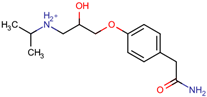
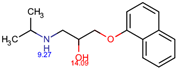
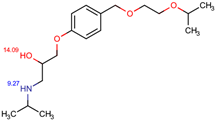
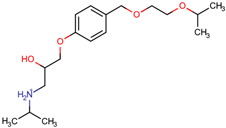
The structures of the five compounds studied are shown in Table 1.

Table 1.
Structure, acidity constants and dominant species of each compound at pH 6.50.
As one can observe, depending on their pKa, the compounds of interest may be ionic or neutral, making it difficult to determine the optimal conditions for their simultaneous separation. Although ion-pair chromatography is recommended under these conditions, its use is limited because it is sensitive to small variations in reagent concentration, pH and temperature, making method transfer between laboratories or instruments difficult. In addition, ion-pair reagents (e.g., alkyl sulfonates, quaternary ammonium salts) tend to adsorb to the stationary phase, resulting in long equilibration times and potential column degradation.
Under these circumstances, we decided to use a mixed stationary phase consisting of both a C18 and a cation-exchange (SCX) component. Neutral compounds are separated on C18, while cationic ones on SCX. The presence of one or the other is controlled by the pH of the aqueous phase.
Using the information provided by the Chemicalize database regarding variation in structures and charges of the compounds as a function of pH, we compiled Table 1. Based on speciation of IDP and ATN, we found that at pH 6.50 the former is neutral and the latter is cationic. This gave rise to the idea of using a mixed C18/SCX stationary phase.
Under these circumstances, a solution of 1 mg/mL IDP and ATN was used to check the performance parameters of the chromatographic method: resolution and peaks asymmetry. The aqueous phase was a phosphate buffer solution at pH 6.50, with methanol (30%) as organic modifier, as it is known that phosphates are well soluble in this organic solvent. The temperature of the column was kept constant at 25 °C, the injection volume was 10 µL, and detection was performed at 226 nm. The flow rate was set at 1 mL/min.
Using the chromatographic conditions described in the paragraph above, ATN was eluted at 8.33 min and IDP at 15.45 min. If the peak for ATN had 1.50 as asymmetry factor (AF) measured at 10% of the peak height, the peak for IDP had a front and an asymmetry of 0.75. Because the typical range of AF is 1.0–1.5, we may consider the performance of the chromatographic methods to be far from good, considering the IDP peak shape. This particular shape may be caused by residual silanol groups present in the stationary phase matrix which may interact with IDP. To reduce this effect, the polarity of the mobile phase can be changed, or triethylamine (TEA) can be added to the aqueous phase [39]. A first attempt was made to modify the polarity of the mobile phase by adding acetonitrile, while keeping all other conditions the same. This change did not produce the expected impact on separation performance as ATN and IDP were eluted at 9.19 min and 22.54 min, with asymmetries of 1.021 and 2.23, respectively. These chromatographic conditions are therefore favorable for obtaining very good asymmetry for ATN, but completely inefficient for both IDP peak asymmetry and total analysis time. A further experiment was then carried out using an aqueous mobile phase with a pH of 6.50 with 20 mM TEA and 30% methanol as organic modifier. Still, even under these conditions, the asymmetry of the IDP peak did not change significantly.
Subsequently, Design of Experiments (DoE) was used to optimize this chromatographic method. An optimal set of conditions has been identified that gives the best resolutions, peak shapes and retention times. This eliminates the need for multiple runs, which are time- and material-consuming.
3.2. Design of Experiments
Critical factors affecting the separation were identified in preliminary experiments as follows: pH of the mobile phase; concentration of TEA in the aqueous phase and flow rate. IDP peak asymmetry was chosen as a response, because deviation from a perfect symmetrical shape can indicate issues with the column, sample or system. In addition, IDP asymmetry is likely to influence the resolution between IDP and BSP.
Two levels (low and high) were set for these factors, as follows: mobile phase pH 6.50 and 7.20; TEA concentration 0 and 20 mM; flow rate 1 and 2 mL/min. The full factorial design for the three factors provided a matrix with eight runs, and all of the corresponding chromatograms were recorded in laboratory. At the end, the data matrix and response was constructed, as presented in Table 2.
Table 2.
Data matrix and response for DoE factorial design.
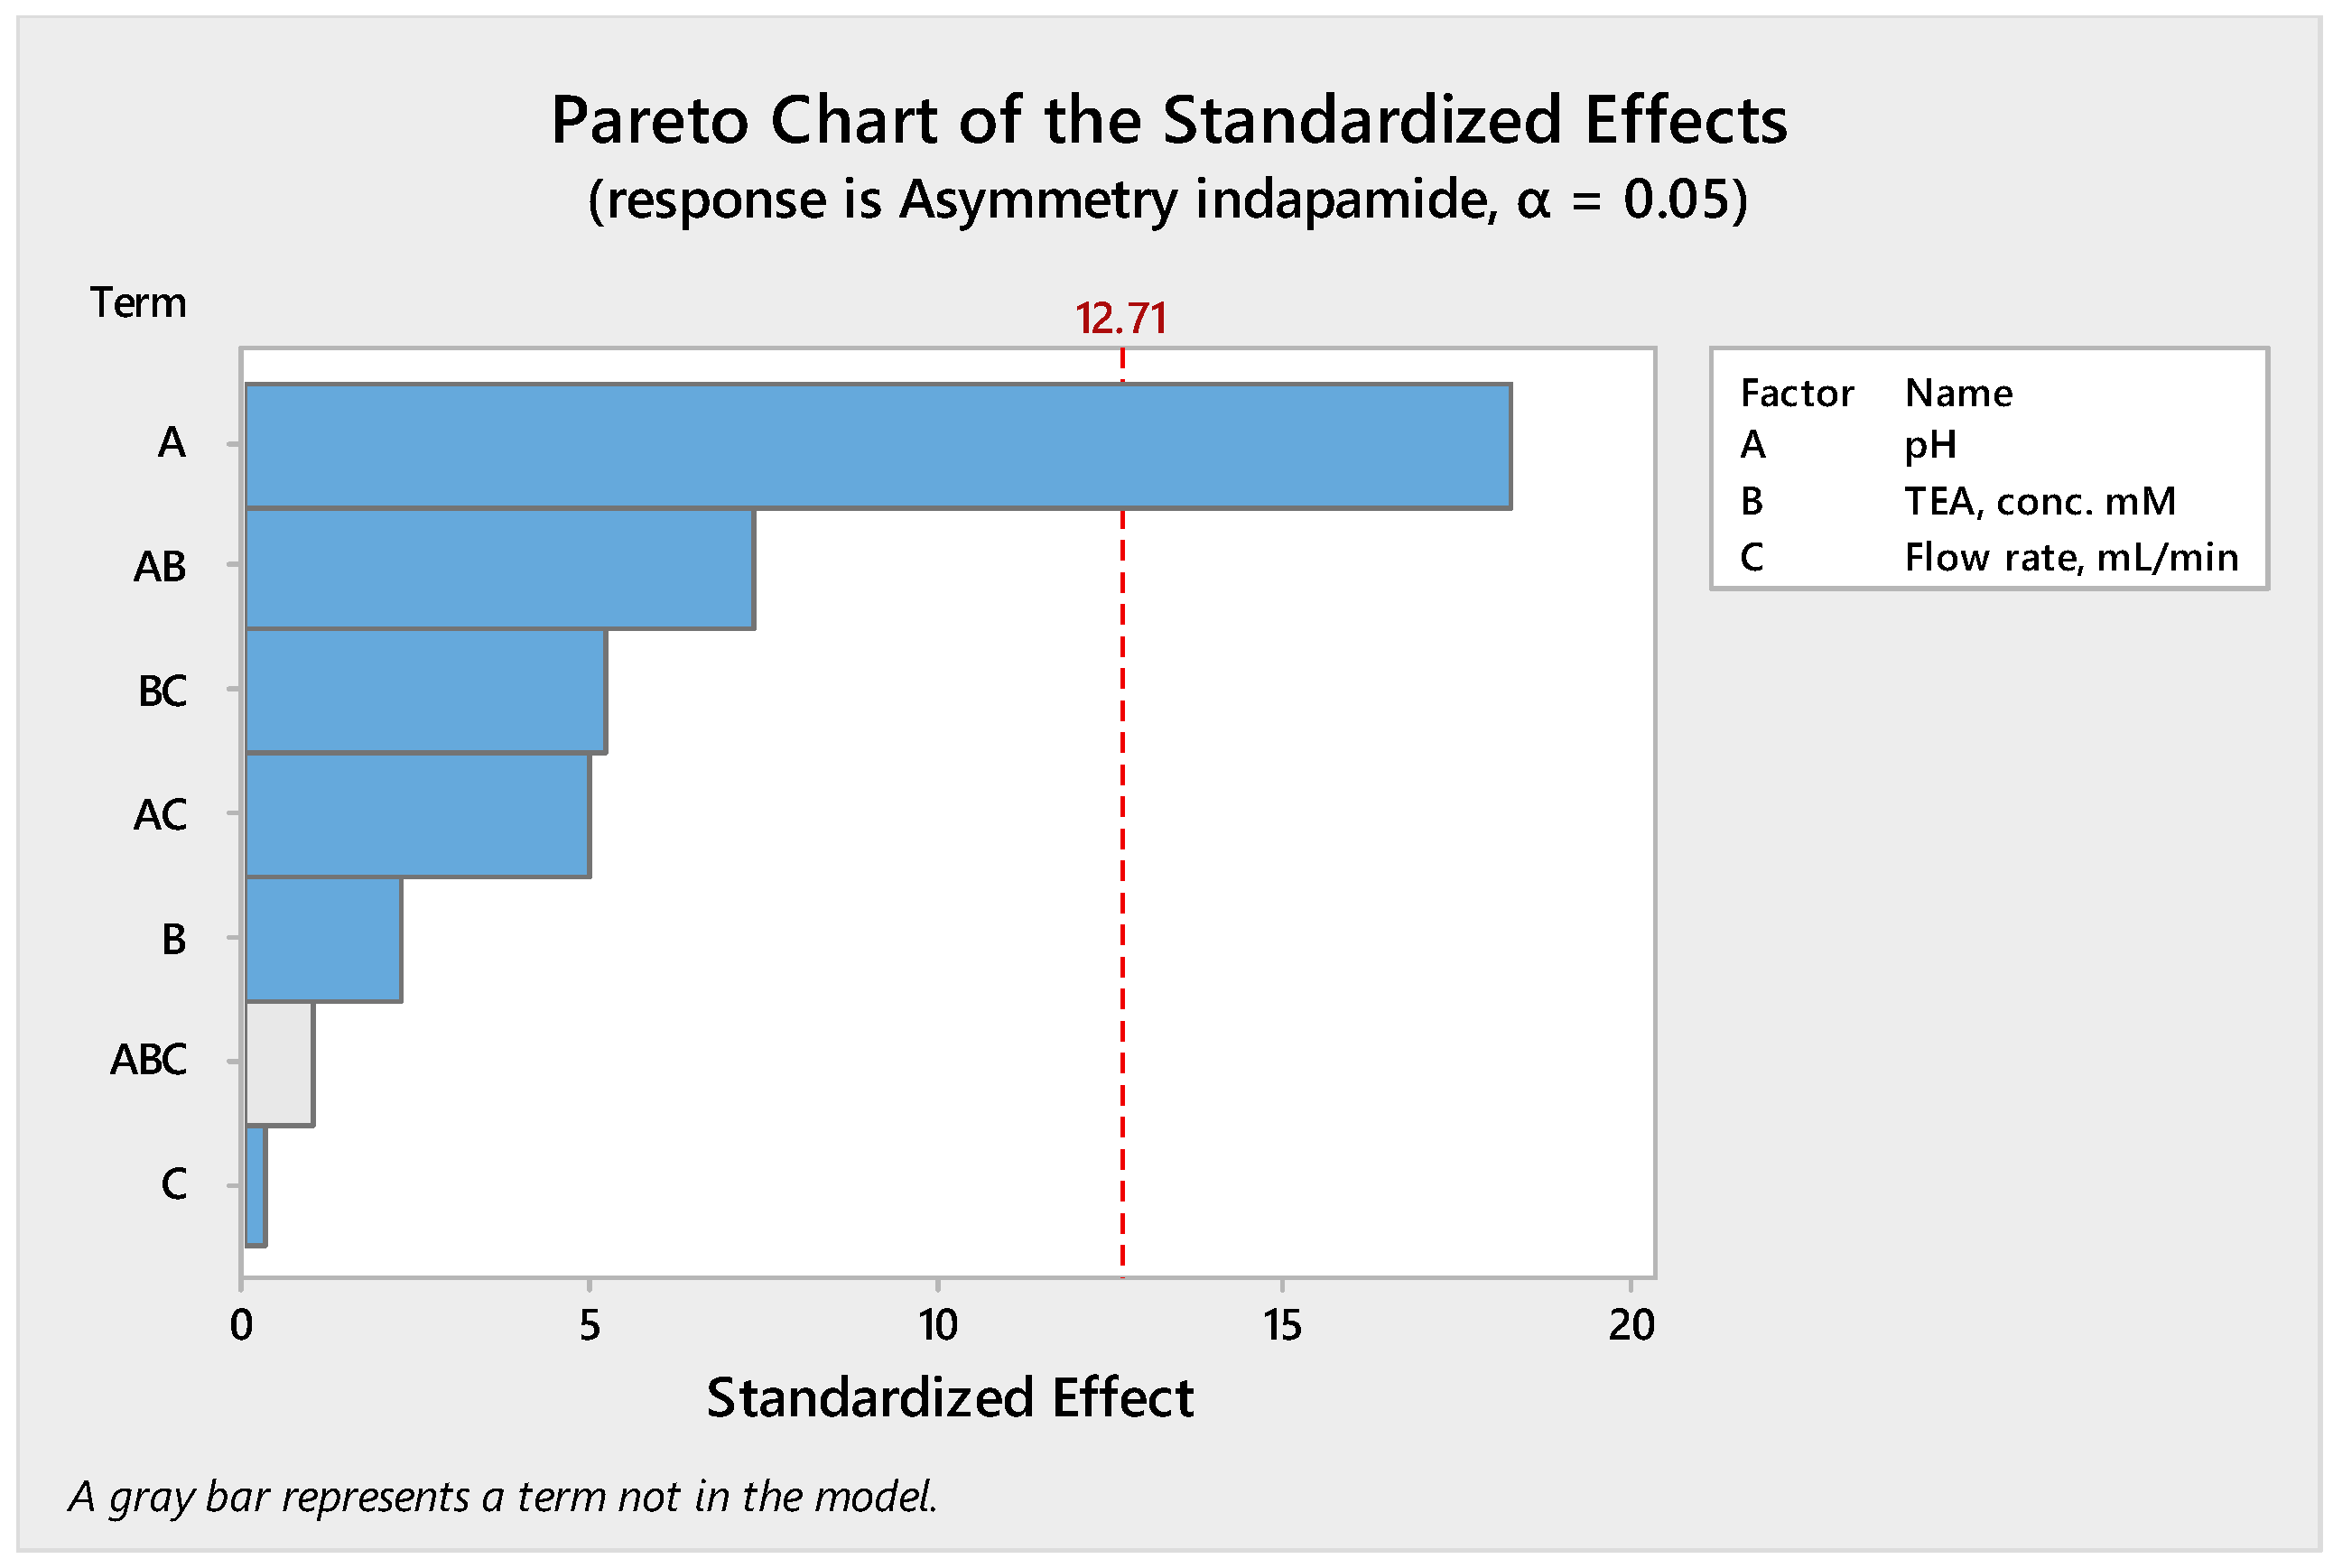
These data were analyzed using a factorial design in the Minitab software (version 17). Additionally, a regression model analysis was performed to determine the relationship between the responses and the independent variables. Figure 1 shows the results obtained as a Pareto chart of standardized effects (Figure 1) in which the bars that exceed the reference line (usually based on a t-distribution at α = 0.05) indicate statistically significant factors. It can be seen that pH is the only relevant factor, with TEA concentration and flow rate having little to no significant impact.

Figure 1.
Pareto chart showing the effect of pH on asymmetry of IDP.
Analysis of variance provided the results presented in Table 3.
Table 3.
Results of analysis of variance.
The analysis of variance gives a p-value of 0.035 for pH, with values ranging from 0.086 to 0.264 for the other factors. Thus, the low p-value for pH (≤ 0.05) indicates that there is strong evidence against the null hypothesis, meaning that the observed result is unlikely to be due to chance. In addition, the Pareto chart shows that the term ABC (pH × TEA × Flow) is statistically insignificant or has only a very small effect on the IDP asymmetry, so this is not included in the final model. Performing the regression model analysis on the above data, the following second order polynomial equation was obtained between the response and the independent variable:
Asymmetry of IDP = −9.636 + 1.596 pH + 0.1799 TEA + 2.556 Flow −
− 0.02893 pH × TEA − 0.3929 pH × Flow + 0.01425 TEA × Flow
− 0.02893 pH × TEA − 0.3929 pH × Flow + 0.01425 TEA × Flow
We can also see in Table 3 that the standard error of the coefficient is similar for all the predictor variables, although this is not the usual expectation. However, a small standard error means that the estimate is more stable and probably closer to the true value.
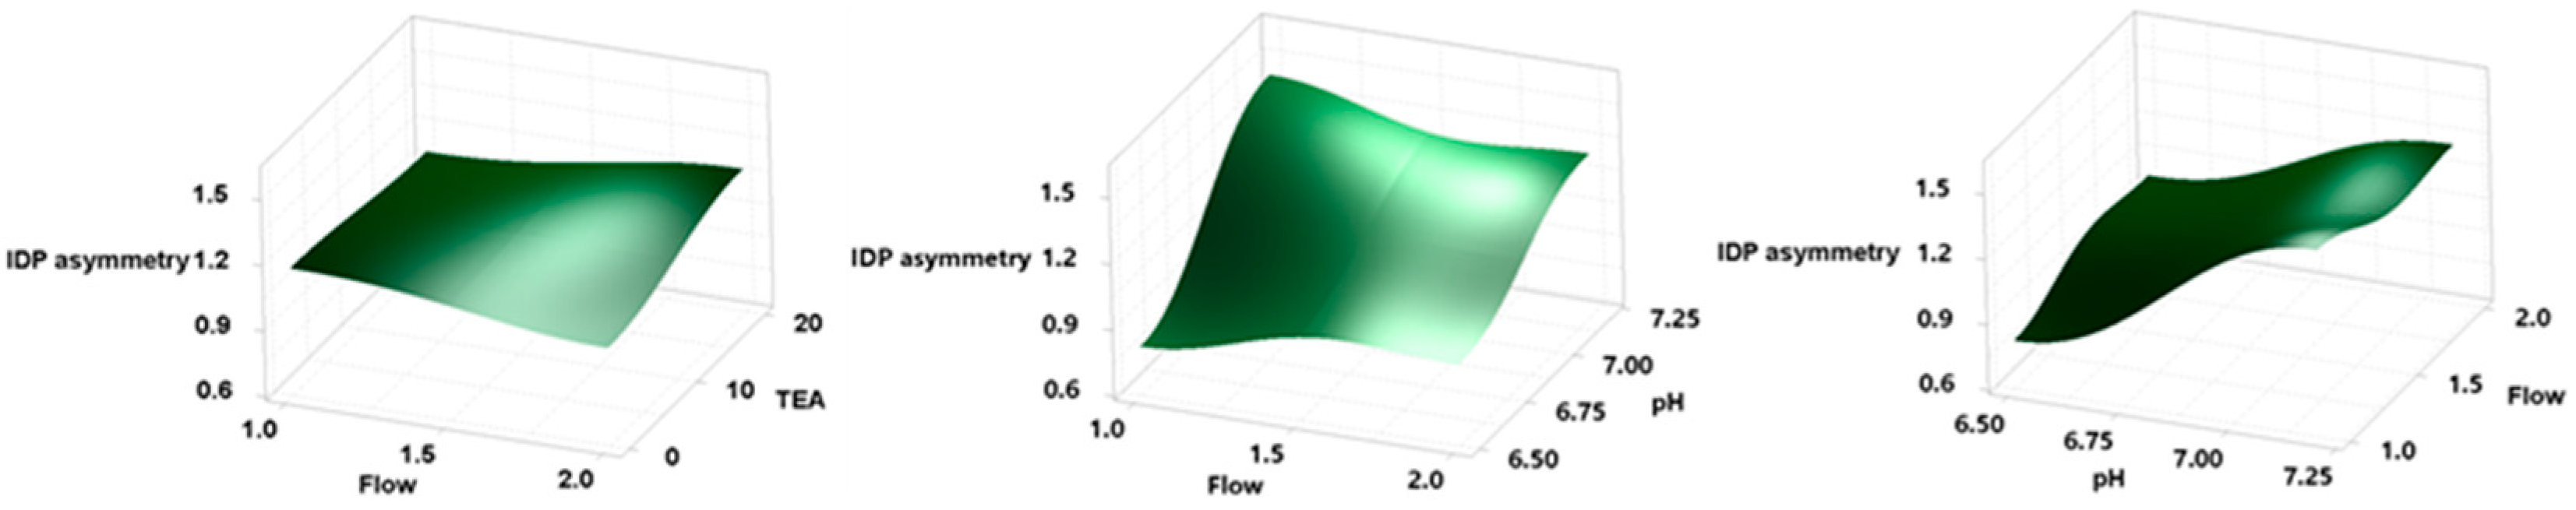
Figure 2 shows 3D response surface plots demonstrating the effect of the independent variables on IDA asymmetry. It can be observed that the response variable IDP asymmetry was significantly influenced by pH. Conversely, the effects of flow and TEA concentration on the response variable were found to be negligible.

Figure 2.
Three-dimensional response surface plots showing the effects of independent variables on IDA asymmetry.
3.3. Optimized Chromatographic Method
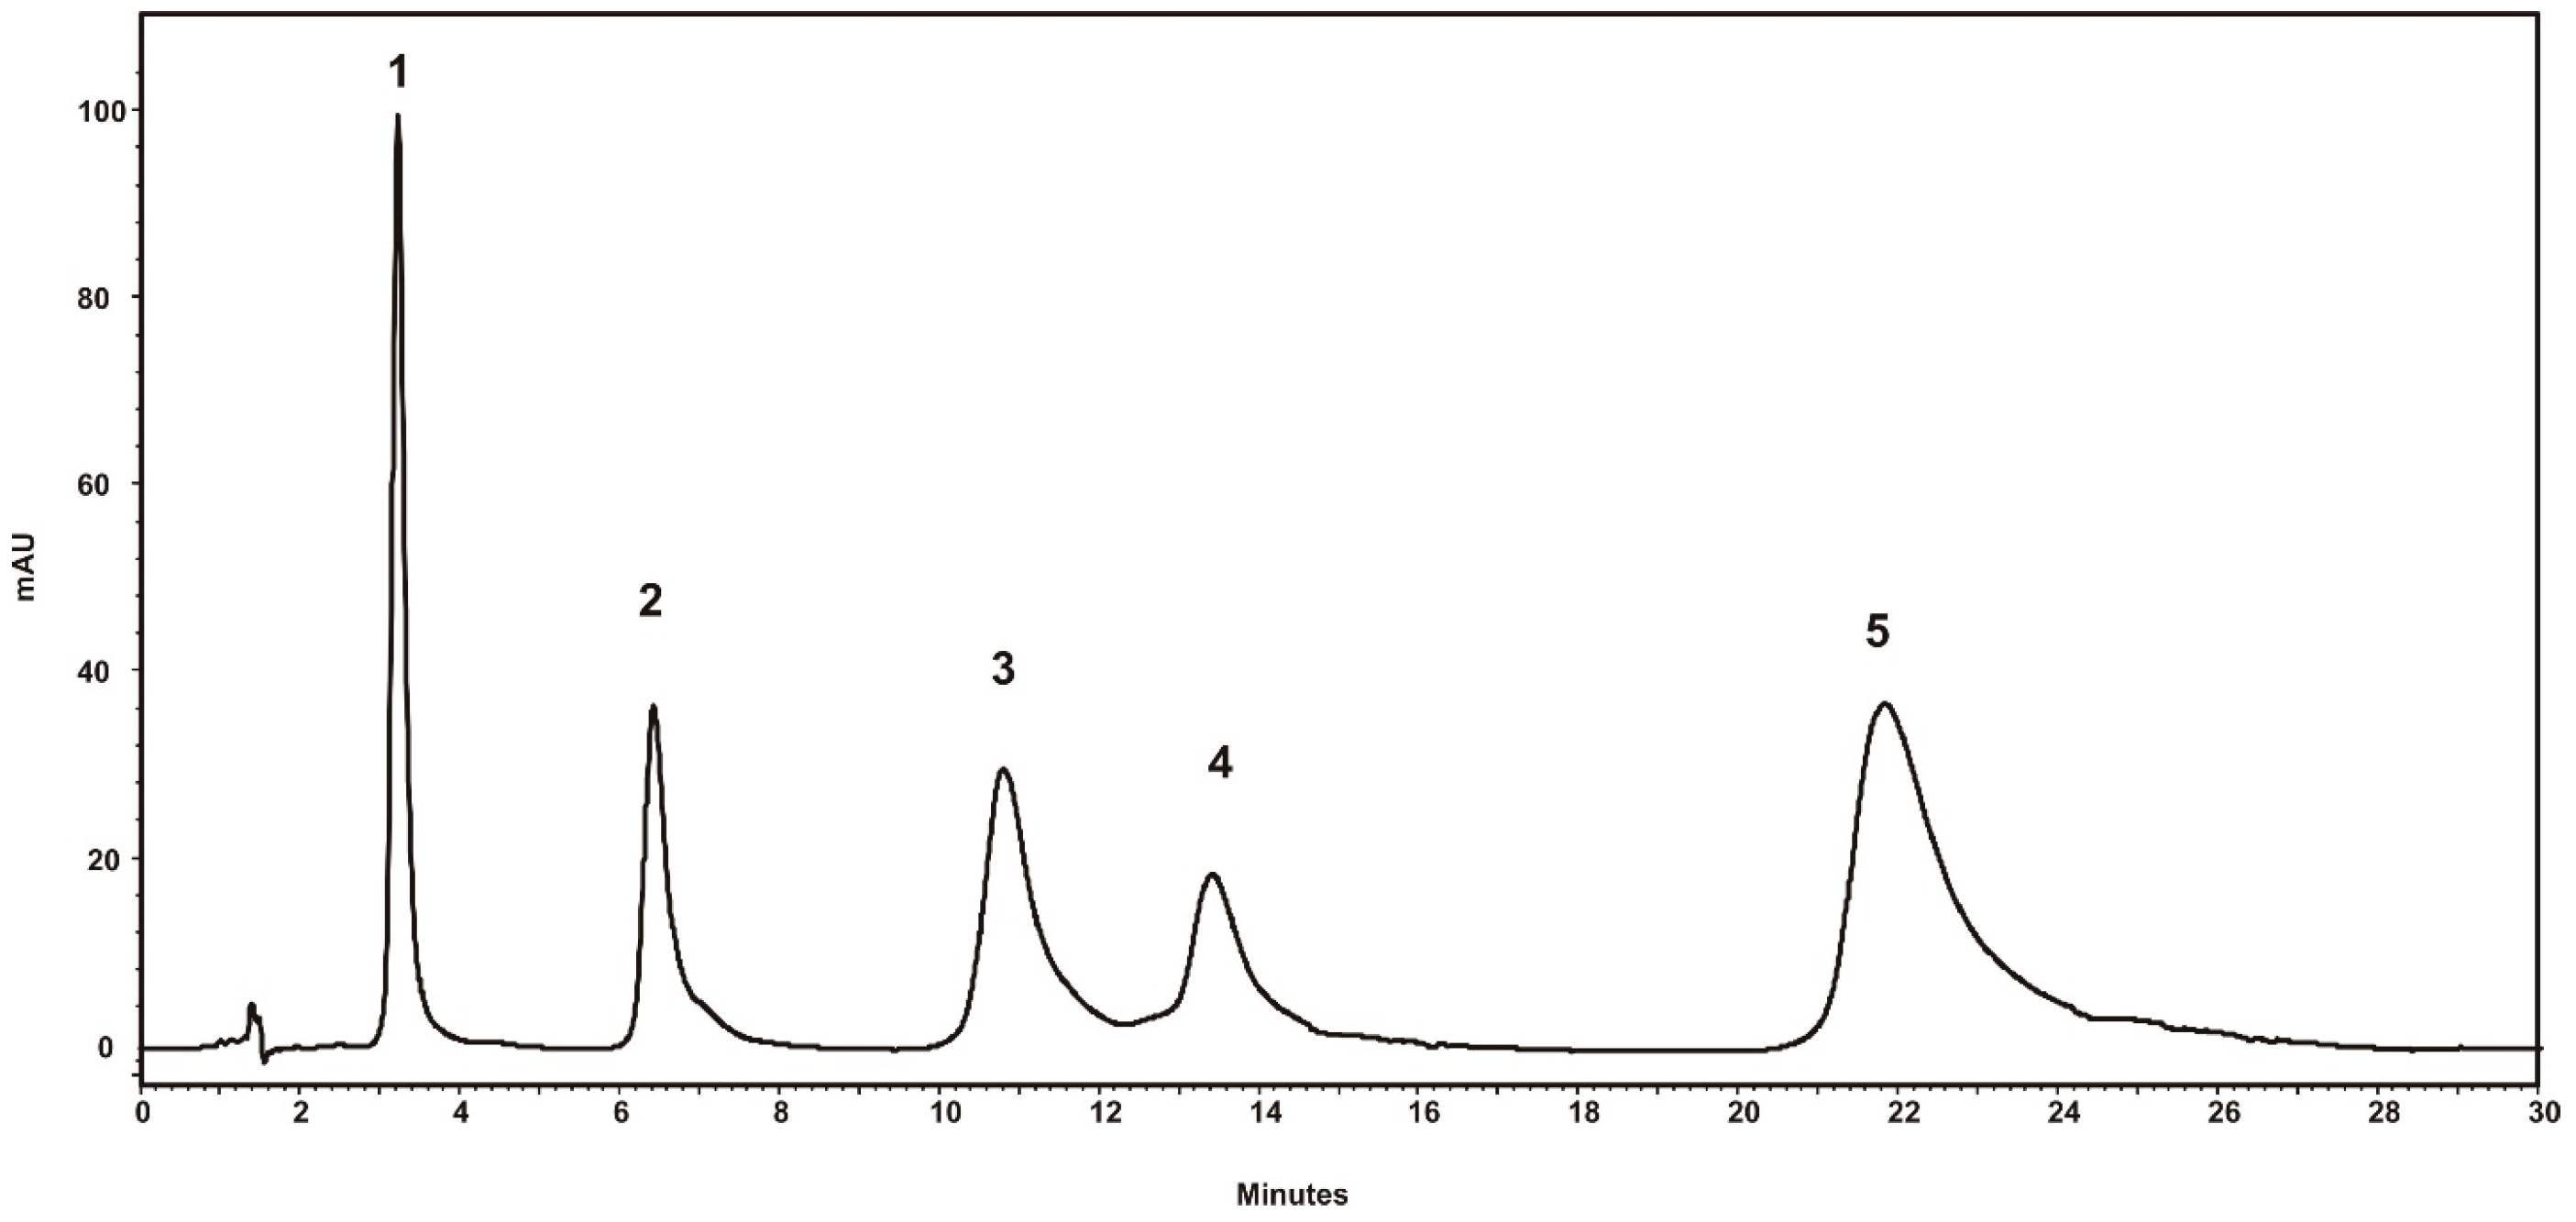
After application of the DoE, the best chromatographic conditions were selected, so that the peak asymmetry of IDP was optimal and the separation of the four beta-blockers was achieved with maximum efficiency. A volume of 10 µL of a mixture containing all compounds at a concentration of 0.1 mg/mL was eluted at a flow rate of 2 mL/min. Separation was completed in 24 min using an aqueous phosphate buffer phase (pH 7.20) and TEA 20 mM, with methanol being used as organic modifier (30%). Detection was performed at 226 nm. The chromatogram obtained is shown in Figure 3, and the chromatographic parameters for the five compounds are presented in Table 4.

Figure 3.
Chromatogram obtained using optimized separation condition: aqueous phosphate buffer phase (pH 7.20) and TEA 20 mM; methanol as organic modifier (30%); and flow rate of 2 mL/min, λ 226 nm: 1—ATN, 2—MTP, 3—IDP, 4—BSP, 5—PPL.
Table 4.
Chromatographic parameters for the five analytes.
The results show resolution between IDP and BSP of greater than 2.00, for asymmetry factors of 1.21 and 1.42, respectively, these being values that fall in a typical range for this parameter.
This method may be used for quantitative determination of the five target compounds in complex matrices such as environmental and pharmaceutical ones; therefore, linearity, LOD and LOQ, precision, accuracy and robustness were established according to the ICH guidelines [38]. Thus, the linear concentration range was found to be between 0.1 and 1 µg/L for all of the analytes. The calculated LODs and LOQs, as well as the results obtained by performing the linear regression in Excel using the Linest function, are presented in Table 5.
Table 5.
Parameters of the linear regression analysis for the chromatographic method.
From the data presented in Table 5, it can be seen that the value of the correlation coefficient, R, is almost equal to 1 in all cases. This means that there is a very good correlation between peak area and concentration. The intercept values are small, indicating that there is no procedural error. Very good results for linearity are noteworthy, even though for BSP and PPL their peaks have an asymmetry close to the maximum allowed limit.
Two other critical validation parameters used to characterize the performance of this analytical method, namely, precision and accuracy, were evaluated. Therefore, six replicates of synthetic samples containing 0.4 μg/L of each analyte were analyzed on the same day and on different days. RSD % values were calculated to evaluate the repeatability and intermediate precision. The results shown in Table 6 indicate that the method meets the requirements for this performance parameter at the mentioned concentration level.
Table 6.
Results obtained for evaluating the precision and the accuracy of the method.
The accuracy of the method was estimated on river water samples analyzed before and after the addition of the analytes at three concentration levels representing 80, 100 and 120% of the concentration level of each compound in the synthetic samples, i.e., 0.4 μg/L. The results (three replicates for each concentration level) for the percentage recovery values are shown in Table 6. The acceptable values obtained are an indication that the method is accurate.
The robustness of the HPLC method was evaluated to ensure its reliability even with small, deliberate variations in method parameters. The wavelength at which the determinations are made is important. Because not all compounds have maxima at 226 nm, the resolution between the critical peaks of the IDP and BSP, as well as the column temperature, were considered. The results are presented in Table 7. A common acceptance criterion is that the parameters considered for each analyte should not deviate by more than ±2% of the values obtained under the optimized operating conditions.
Table 7.
Results obtained for robustness evaluation.
The results show that the method can produce reliable results even given the small variations that inevitably occur in any analytical laboratory.
3.4. Study of the Mechanism of Chromatographic Retention
3.4.1. Influence of Mobile Phase Composition on Chromatographic Separation
In order to obtain information about the retention mechanism occurring during the separation of ATN, IDP, MTP, PPL and BSP on a mixed-type stationary phase, the theory of the influence of organic modifier concentration on the retention factor was applied for each active ingredient. Thus, the model provided by Equation (2) can explain the reverse phase separation mechanism that takes place on a C18-type stationary phase:
where k is the retention factor, kw is the retention factor when using a 100% aqueous mobile phase, φ is the percentage of organic modifier in the mobile phase, and S gives information about the hydrophobicity of the analyte.
log k = logkw − S × φ
A solution consisting of IDP, ATN, PPL, MTP and BSP, each at a concentration of 1 mg/mL, was used to investigate the influence of the mobile phase composition on the performance parameters of the developed chromatographic method. Chromatograms were recorded under the previously developed chromatographic conditions for the following percentages of organic modifier (methanol): 20%, 25%, 30%, 35%.
The elucidation of the nature of the retention mechanism was based on the graphical representation of log k’ as a function of the percentage of organic modifier in the mobile phase. It was hypothesized that this plot should be linear. The closer the value of the correlation coefficient value is to 1, the better the model describes the interaction of the solute with the stationary phase by a sorption-desorption mechanism.
Table 8 presents the experimental data used to construct the regression model between log k and percent organic modifier.
Table 8.
Experimental results used for the regression model.
The results presented in Table 8 show that as the organic modifier concentration increases, the retention factor (k) generally decreases. This is because a higher organic modifier concentration reduces the polarity of the mobile phase, making it a better solvent for hydrophobic analytes. Consequently, the analytes spend less time interacting with the stationary phase and elute more quickly. In addition, the R values derived from the relationship between log k and the organic modifier concentration provide insights into the retention mechanism. For instance, in pure reversed-phase adsorption, R is typically large and positive, as for IDP (0.9946). This indicates a strong dependence of retention on the organic modifier concentration and of adsorption mechanism on C18 moiety. In ion-exchange chromatography, the R value is generally smaller, compared with reversed-phase adsorption, because the retention is primarily governed by electrostatic interactions between the analyte and the charged stationary phase. The other compounds have somewhat lower values for R which may support a mechanism based on ion exchange. Most interesting is the case of PPL, whose charge and R value makes it a candidate for ion exchange and adsorption mechanism, respectively. The competition between the two mechanisms is determined by the concentration of the PPL species at pH 7.20, which certainly also influences its peak asymmetry.
3.4.2. Effect of Temperature on Chromatographic Separation
The dependence between the retention (expressed as the retention factor) and the temperature at which the chromatographic separation takes place is given by the Van ’t Hoff equation:
which shows the existence of a linear relationship between the natural logarithm of the retention factor (ln k) for a solute and the reciprocal of the absolute temperature (1/T) in the chromatographic column, where ∆H and ∆S are the standard variation of enthalpy and entropy, respectively (corresponding to the transfer of the solute from the mobile phase to the stationary phase), and R is the universal gas constant.
ln k = −ΔH/RT + ΔS/R
A solution of IDP, ATN, PPL, MTP and BSP, each at a concentration of 1 mg/mL, was used to determine the influence of temperature on the performance parameters of the developed chromatographic method. The chromatograms were recorded under the previously developed chromatographic conditions for four temperature values, as presented in Table 9.
Table 9.
Thermodynamics parameters obtained for investigation of influence of temperature.
As can be seen, all enthalpy values are negative. This confirms that the proposed separation mechanisms for each compound are energetically favorable. Conversely, entropy variation is different, having both negative and positive values. IDP has the lowest entropy value (−44.1 J/(mol·K), supporting the proposed adsorption mechanisms. Strong, specific interactions between the analyte and the stationary phase can lead to a more ordered arrangement, resulting in a negative ΔS. This is often seen with interactions like hydrogen bonding, or other strong intermolecular forces. In the case of cations separated by ion-exchange mechanisms, there may be changes in the hydration state of the ions and, therefore, in the arrangement of these species. For this reason, it is common to see a negative value for the entropy, as the ions become more ordered when specific interactions with the functional groups have taken place on the stationary phase. It is worth mentioning that BSP is the only compound whose entropy change is positive. This suggests that hydration effects or the release of bound ions play a significant role in the retention mechanism. Notably, the total change in Gibbs free energy calculated at 298.15 K is negative for all compounds, indicating that the thermodynamic process shaping the proposed reaction mechanism is spontaneous for all species studied.
4. Conclusions
Based on the acid-base character of the diuretic IDP and the beta-blockers ATN, BSP, MTP and PPL, a new HPLC method for the simultaneous determination of target compounds was developed. Design of Experiment methodology was used to identify the critical factors affecting separation, to understand the cause-effect relationships, and to optimize the separation. IDP asymmetry was identified as a critical parameter, and its value was maintained within acceptable limits using a method with the following characteristics: a mixed-mode C18/SCX stationary phase, aqueous phosphate buffer (pH 7.20) mobile phase and 20 mM TEA modified with methanol (30%) at a flow rate of 2 mL/min with detection at 226 nm. Under these chromatographic conditions, the IDP separation occurs on the C18 fragment, while separation of the other ionic species takes place on the cation exchange fragment. These separation mechanisms were confirmed by a model of the influence of organic modifier concentration on the retention factor, and also by thermodynamic studies. The method has good performance parameters, namely, linear range, LOD and LOQ, and can be applied for the determination of these chemical species from different samples.
Author Contributions
Conceptualization, I.A.B. and A.M.; methodology, I.A.B., D.E.P., M.B., A.M.T. and A.M.; validation, I.A.B., D.E.P. and M.B.; formal analysis, A.M. and A.M.T.; investigation, I.A.B., A.M., D.E.P. and M.B.; writing—original draft preparation, I.A.B.; writing—review and editing, D.E.P. and M.B.; supervision, I.A.B. All authors have read and agreed to the published version of the manuscript.
Funding
This research received no external funding.
Data Availability Statement
Data are contained within the article.
Conflicts of Interest
The authors declare no conflicts of interest.
References
- Jackson, R.E.; Bellamy, M.C. Antihypertensive drugs. BJA Educ. 2015, 15, 280–285. [Google Scholar] [CrossRef]
- Kjeldsen, S.E. Hypertension and cardiovascular risk: General aspects. Pharmacol. Res. 2018, 129, 95–99. [Google Scholar] [CrossRef] [PubMed]
- World Health Organization. Guideline for the Pharmacological Treatment of Hypertension in Adults; World Health Organization: Geneva, Switzerland, 2021. [Google Scholar]
- Mancia, G.; Kreutz, R.; Brunström, M.; Burnier, M.; Grassi, G.; Januszewicz, A.; Muiesan, M.L.; Tsioufis, K.; Agabiti-Rosei, E.; Algharably, E.A.E.; et al. 2023 ESH Guidelines for the management of arterial hypertension The Task Force for the management of arterial hypertension of the European Society of Hypertension: Endorsed by the International Society of Hypertension (ISH) and the European Renal Association (ERA). J. Hypertens. 2023, 41, 1874–2071. [Google Scholar]
- Skolnik, N.S.; Beck, J.D.; Clark, M. Combination antihypertensive drugs: Recommendations for use. Am. Fam. Physician 2000, 61, 3049–3056. [Google Scholar] [PubMed]
- WADA. World Anti-Doping Program. TUE Physician Guidelines—Cardiovascular Conditions; Version 4.0; WADA: Montreal, QC, Canada, 2023; pp. 1–19. [Google Scholar]
- Rocha, T.; Amaral, J.S.; Oliveira, M.B.P.P. Adulteration of dietary supplements by the illegal addition of synthetic drugs: A review. Compr. Rev. Food Sci. Food Saf. 2016, 15, 43–62. [Google Scholar] [CrossRef]
- Muschietti, L.; Redko, F.; Ulloa, J. Adulterants in selected dietary supplements and their detection methods. Drug Test Anal. 2020, 12, 861–886. [Google Scholar] [CrossRef]
- Yi, M.; Sheng, Q.; Sui, Q.; Lu, H. β-blockers in the environment: Distribution, transformation, and ecotoxicity. Environ. Pollut. 2020, 266, 115269. [Google Scholar] [CrossRef]
- Dias, I.M.; Mourão, L.C.; De Souza, G.B.M.; Abelleira-Pereira, J.M.; Dos Santos-Junior, J.M.; De Freitas, A.C.D.; Cardozo-Filho, L.; Alonso, C.G.; Guirardello, R. Treatment of antihypertensive and cardiovascular drugs in supercritical water: An experimental and modeled approach. Water 2024, 16, 125. [Google Scholar] [CrossRef]
- Godoy, A.A.; Kummrow, F.; Pamplin, P.A.Z. Occurrence, ecotoxicological effects and risk assessment of antihypertensive pharmaceutical residues in the aquatic environment—A review. Chemosphere 2015, 138, 281–291. [Google Scholar] [CrossRef]
- Hernando, M.D.; Gómez, M.J.; Agüera, A.; Fernández-Alba, A.R. LC-MS analysis of basic pharmaceuticals (beta-blockers and anti-ulcer agents) in wastewater and surface water. TrAC Trends Anal. Chem. 2007, 26, 581–594. [Google Scholar] [CrossRef]
- Saleem, K.; Ali, I.; Kulsum, U.; Aboul-Enein, H.Y. Recent developments in HPLC analysis of β-blockers in biological samples. J. Chromatogr. Sci. 2013, 51, 807–818. [Google Scholar] [CrossRef] [PubMed]
- Alder, A.C.; Schaffner, C.; Majewsky, M.; Klasmeier, J.; Fenner, K. Fate of β-blocker human pharmaceuticals in surface water: Comparison of measured and simulated concentrations in the Glatt Valley Watershed, Switzerland. Water Res. 2010, 44, 936–948. [Google Scholar] [CrossRef]
- Iancu, V.I.; Puiu, D.; Radu, G.L. Determination of some beta-blockers in surface water samples. UPB Sci. Bull. Ser. B Chem. Mater. Sci. 2020, 82, 121–130. [Google Scholar]
- Iancu, V.I.; Radu, G.L.; Scutariu, R. A new analytical method for the determination of beta-blockers and one metabolite in the influents and effluents of three urban wastewater treatment plants. Anal. Methods 2019, 11, 4668–4680. [Google Scholar] [CrossRef]
- Matter, B.; Bourne, D.W.A.; Kompella, U.B. A High-Throughput LC-MS/MS Method for the simultaneous quantification of twenty-seven drug molecules in ocular tissues. AAPS PharmSciTech 2022, 23, 192. [Google Scholar] [CrossRef] [PubMed]
- Stankiewicz, A.; Giebułtowicz, J.; Stankiewicz, U.; Wroczyński, P.; Nałecz-Jawecki, G. Determination of selected cardiovascular active compounds in environmental aquatic samples—Methods and results, a review of global publications from the last 10 years. Chemosphere 2015, 138, 642–656. [Google Scholar] [CrossRef]
- Maurer, M.; Escher, B.I.; Richle, P.; Schaffner, C.; Alder, A.C. Elimination of β-blockers in sewage treatment plants. Water Res. 2007, 41, 1614–1622. [Google Scholar] [CrossRef] [PubMed]
- Vázquez, P.P.; Galera, M.M.; Guirado, A.S.; Vázquez, M.M.P. Determination of five beta-blockers in wastewaters by coupled-column liquid chromatography and fluorescence detection. Anal. Chim. Acta 2010, 666, 38–44. [Google Scholar] [CrossRef]
- Baranowska, I.; Kowalski, B. Using HPLC Method with DAD Detection for the Simultaneous Determination of 15 Drugs in Surface Water and Wastewater. Pol. J. Environ. Stud. 2011, 20, 21–28. [Google Scholar]
- Raoufi, A.; Ebrahimi, M.; Bozorgmehr, M.R. Application of response surface modeling and chemometrics methods for the determination of Atenolol, Metoprolol and Propranolol in blood sample using dispersive liquid-liquid microextraction combined with HPLC-DAD. J. Chromatogr. B Anal. Technol. Biomed. Life Sci. 2019, 1132, 121823. [Google Scholar] [CrossRef]
- Deventer, K.; Van Eenoo, P.; Delbeke, F.T. Simultaneous determination of beta-blocking agents and diuretics in doping analysis by liquid chromatography/mass spectrometry with scan-to-scan polarity switching. Rapid Commun. Mass Spectrom. 2005, 19, 90–98. [Google Scholar] [CrossRef] [PubMed]
- Murray, G.J.; Danaceau, J.P. Simultaneous extraction and screening of diuretics, beta-blockers, selected stimulants and steroids in human urine by HPLC-MS/MS and UPLC-MS/MS. J. Chromatogr. B 2009, 877, 3857–3864. [Google Scholar] [CrossRef]
- Musenga, A.; Cowan, D.A. Use of ultra-high pressure liquid chromatography coupled to high resolution mass spectrometry for fast screening in high throughput doping control. J. Chromatogr. A 2013, 1288, 82–95. [Google Scholar] [CrossRef]
- Kesting, J.R.; Huang, J.Q.; Sørensen, D. Identification of adulterants in a Chinese herbal medicine by LC-HRMS and LC-MS-SPE/NMR and comparative in vivo study with standards in a hypertensive rat model. J. Pharm. Biomed. Anal. 2010, 51, 705–711. [Google Scholar] [CrossRef] [PubMed]
- Woo, H.; Kim, J.W.; Han, K.M.; Lee, J.H.; Hwang, I.S.; Lee, J.H.; Kim, J.; Kweon, S.J.; Cho, S.; Chae, K.R.; et al. Simultaneous analysis of 17 diuretics in dietary supplements by HPLC and LC-MS/MS. Food Addit. Contam. Part A 2012, 30, 209–217. [Google Scholar] [CrossRef]
- Lu, Y.L.; Zhou, N.L.; Liao, S.Y.; Su, N.; He, D.X.; Tian, Q.Q.; Chen, B.; Yao, S.Z. Detection of adulteration of anti-hypertension dietary supplements and traditional Chinese medicines with synthetic drugs using LC/MS. Food Addit. Contam. Part A 2010, 27, 893–902. [Google Scholar] [CrossRef] [PubMed]
- Zeng, L.; Li, Y.; Wu, X.; Zhang, J.; Xie, J.; Sun, C. Simultaneous determination of 10 adulterants in antihypertensive functional foods using multi-walled carbon nanotubes-dispersive solid-phase extraction coupled with high performance liquid chromatography. J. Chromatogr. Sci. 2015, 53, 1611–1621. [Google Scholar] [CrossRef]
- Moreira, A.P.L.; Gobo, L.A.; Viana, C.; de Carvalho, L.M. Simultaneous analysis of antihypertensive drugs and diuretics as adulterants in herbal-based products by ultra-high performance liquid chromatography-electrospray tandem mass spectrometry. Anal. Methods 2016, 8, 1881–1888. [Google Scholar] [CrossRef]
- Baranowska, I.; Magiera, S.; Baranowski, J. Clinical applications of fast liquid chromatography: A review on the analysis of cardiovascular drugs and their metabolites. J. Chromatogr. B 2013, 927, 54–79. [Google Scholar] [CrossRef]
- Yildirim, S.; Erkmen, C.; Uslu, B. Novel trends in analytical methods for β-blockers: An overview of applications in the last decade. Crit. Rev. Anal. Chem. 2020, 52, 131–169. [Google Scholar] [CrossRef]
- Yang, Y.; Wang, Y.; Bao, Z.; Yang, Q.; Zhang, Z.; Ren, Q. Progress in the enantioseparation of β-blockers by chromatographic methods. Molecules 2021, 26, 468. [Google Scholar] [CrossRef] [PubMed]
- Fukushima, T.; Koishi, M.; Sakamoto, T.; Onozato, M. Use of commercial mixed-mode stationary phases and sorbents in the high-performance liquid chromatography analysis and solid-phase extraction of ionized and hydrophilic bioactive compounds. Molecules 2024, 29, 2341. [Google Scholar] [CrossRef] [PubMed]
- Nisyriou, S.; Zacharis, C.K. Microextraction-based techniques for the determination of beta-blockers in biological fluids: A review. Separations 2025, 12, 14. [Google Scholar] [CrossRef]
- ISO 5667-6:2014; Water Quality—Sampling. Part 6: Guidance on Sampling of Rivers and Streams. International Organization for Standardization: Geneva, Switzerland, 2014; p. 26.
- Pocrnić, M.; Ansorge, M.; Dovhunová, M.; Tesařová, E.; Galić, N. Chiral separation of beta-blockers by high-performance liquid chromatography and determination of bisoprolol enantiomers in surface waters. Arh. Hig. Rada Toksikol. 2020, 71, 56–62. [Google Scholar] [CrossRef]
- ICH. Validation of Analytical Procedures Q2(R2); International Council for Harmonisation of Technical Requirements for Pharmaceuticals for Human Use (ICH): Geneva, Switzerland, 2023; pp. 10–11. [Google Scholar]
- Li, S.; Tian, M.; Row, K.H. Effect of mobile phase additives on the resolution of four bioactive compounds by RP-HPLC. Int. J. Mol. Sci. 2010, 11, 2229–2240. [Google Scholar] [CrossRef]


Disclaimer/Publisher’s Note: The statements, opinions and data contained in all publications are solely those of the individual author(s) and contributor(s) and not of MDPI and/or the editor(s). MDPI and/or the editor(s) disclaim responsibility for any injury to people or property resulting from any ideas, methods, instructions or products referred to in the content. |
© 2025 by the authors. Licensee MDPI, Basel, Switzerland. This article is an open access article distributed under the terms and conditions of the Creative Commons Attribution (CC BY) license (https://creativecommons.org/licenses/by/4.0/).