Article

Cyclone Shapes for Sand and Microplastic Separation: Efficiency and Reynolds Number Relationships

1
Mechanical Engineering Education Department, Chungnam National University, Daejeon 34134, Republic of Korea
2
Mechanical Engineering Department, Chungnam National University, Daejeon 34134, Republic of Korea
3
Automotive Engineering Department, Ajou Motor College, Boryeong-si 33415, Republic of Korea
*
Authors to whom correspondence should be addressed.
Separations 2024, 11(8), 222; https://doi.org/10.3390/separations11080222
Submission received: 30 June 2024 / Revised: 16 July 2024 / Accepted: 18 July 2024 / Published: 23 July 2024

Abstract

:
In this study, three geometries were analyzed for sand and microplastic separation to confirm the applicability of cyclones. This research aimed to apply plastic-based samples such as Styrofoam, PET, PP, and PU to an analytical model, characterized by separating sand spread on Korean beaches into different outlets using a cyclone model. Regarding the numerical analysis, the results of sand particle separation were analyzed by designing a general cyclone (Type A), a cone-shaped cyclone (Type B), and a cone-shaped cyclone (Type C) with double the cone length, for four microplastics in three shapes. The results of the analysis of the characteristics showed that Type B, which has a conical shape, achieved an efficiency of 99.3–100% for sand, 72.7% for Styrofoam, and 95.7–100% for other plastics at an exit speed of 5–7 m/s, after which the efficiency decreased as the speed increased. Type C showed an efficiency of 92.2–100% for sand, 66.6–70.8% for Styrofoam, and 61% for PET at 5–10 m/s. Type C showed a maximum efficiency of 95.5% for PP and 73.4% for PU at 11 m/s. As the speed increased, the efficiency decreased. This is believed to be due to differences in the Reynolds number range, which helps separate particles depending on their shape; therefore, the applicability of the cone-shaped cyclone separator for sand and microplastic separation was confirmed, and it was found that an optimal speed condition exists in relation to the Reynolds number.

1. Introduction

As global plastic use continues to rise, significant amounts of plastic are entering the ocean. According to plastics mixture researchers [1], approximately 370 million tons of plastic were produced globally in 2020, of which nearly 85% entered the coasts without being buried or collected in the soil. Once in the ocean, plastic undergoes weathering and breaks down into microplastics smaller than 5 mm [2]. These microplastics can impact human health and cause diseases when contaminated drinking water, fish, and seafood are consumed [3]. While there has been active research and discussion about the severity of microplastic pollution, the development of effective microplastic collection methods remains inadequate [4]. Additionally, the coasts in Korea experience higher levels of microplastic pollution compared to other countries, mainly due to Styrofoam. Therefore, developing efficient microplastic collection equipment is crucial.
Similar research has shown that injecting air bubbles into water enhances the separation efficiency of microplastics when using a hydrocyclone [5]. Research on vortex finder diameter demonstrated that adjusting both the cyclone’s top diameter and vortex finder diameter affects the removal efficiency of small microplastics (PMMA) with a size of 10 μm. Specifically, increasing the cyclone’s top diameter while decreasing the vortex finder’s diameter led to a greater amount of underflow particles and improved separation efficiency [6]. Other work showed that the cone angle of the cyclone affects the separation performance of PET and PVC, with an optimal angle for each type of particle [7]. Additionally, similar studies examined the separation efficiency of microplastics in relation to the geometric parameters of the cyclone, including underflow diameter, overflow diameter, cone and cylinder height, and inlet angle [8].
The need for this study arises from the significant disparity in microplastic collection research compared to the heightened levels of microplastic pollution on domestic Korean coasts, which surpass those of many foreign countries [9]. Unlike regions abroad where high-density plastics are prevalent, Korean coasts are predominantly affected by Styrofoam. The types of plastic in domestic seawater are polyethylene (PE), polypropylene (PP), polyethylene terephthalate (PET), etc. [10]. However, the distribution of Styrofoam is high on sandy beaches due to the buoys used in fish farms [11]. Given that particle density plays a crucial role in cyclone separation, the methods developed for separating microplastics abroad may not effectively apply to the low-density Styrofoam particles found here. Hence, it has become apparent that unique challenges necessitate the development of novel microplastic collection methods specifically tailored to Korean coasts characterized by a high Styrofoam distribution.
Unlike existing cyclone research that separated particles through a single outlet, this study is original in its approach, whereby separation was performed using two different types of particles, sand and plastic, as well as using a model with different outlet shapes. Therefore, the objective of this study was to perform numerical analysis and interpret the findings to assess the cyclone separator’s effectiveness in separating sand and microplastics. Additionally, the results are presented by comparing and analyzing the separation efficiency based on variations in microplastic density and in the design of the cyclone separator.

2. Analysis Constructs and Methods

2.1. Cyclone Shape Design and Method

Figure 1 presents the three cyclone separator designs aimed at identifying a model suitable for separating sand and microplastic particles; it also indicates the locations of sand and microplastic collection. Type A is a general tangential inflow cyclone, while Type B retains only the cone portion of a typical cyclone. Type C is similar to Type B but has a cone that is twice as long. In these designs, air and particles are injected through the inlets (①) of all three shapes, microplastic is collected through the outlets (②), and sand is separated into the sand collection bins (④).
Figure 2 shows the analytical mesh structure of the three cyclone separator shapes. The number of nodes and minimum orthogonal quality are presented in Table 1. In general, the number of nodes did not have a significant effect on the results, so the mesh was constructed with a focus on orthogonal quality: if it was 0.2 or higher, it was determined that there was no problem during analysis. Additionally, the polyhedra mesh type was used to increase mesh quality and analysis convergence.

2.2. Analytical Mesh Structure

Plastic and Styrofoam buoys account for more than half of Korean marine debris [12]. Plastics, such as PVC and PET, constitute the largest proportion of this debris, followed by Styrofoam buoys [13]. Styrofoam is primarily used in fish farms along the coast of Korea, and each piece can break down into millions of microplastic particles [14]. Additionally, widely used plastics like polyethylene, polypropylene, and polystyrene do not decompose easily.
Therefore, three types of plastic, Styrofoam, and sand particles, which are widely distributed along the coast, were selected for this study, with their physical properties listed in Table 2. The shape factor is a coefficient that expresses the shape of a particle numerically and is the value obtained by dividing the surface area of a sphere of the same volume by the actual surface area of the particle [15]. The shape factor of a sphere is 1, and as the object deviates from the sphere and the corner of the object become sharper, the shape factor decreases [16]. Because many microplastics have non-spherical shapes, the analysis was conducted assuming an extreme shape factor of 0.1. The density of air was set to 1.225 kg/m3 for the calculations.

2.3. Governing Equations

The basic theoretical equations that govern the physical phenomena in numerical analysis include the conservation of mass, conservation of momentum, and energy equations; this study followed the continuity and momentum equations.
Continuity equation
· ρ V = S m
Momentum equation
· ρ V V = p + · τ ̿ + ρ g + F
where p is the static pressure, τ ̿ is the stress tensor, and ρ g and F are the gravitational body force and external body forces, respectively.
The stress tensor τ ̿ is given by Equation (3).
τ ̿ = μ [ v + v 2 3 · v I ]
In this analysis, the kε standard turbulence model, which is mainly used to understand the internal flow of a cyclone, was used. These are the equations for turbulent kinetic energy (k) and dissipation rate (ε):
x i ρ k u i = x j μ + μ t σ k + G k + G b ρ ε Y M S k
and
x i ρ ε u i = x j μ + μ t σ e ε x j + C 1 ε ε k ( G k + C 3 ε G b ) C 2 ε ρ ε 2 k S ε
Turbulent viscosity ( μ t ) is defined as Equation (6), and C μ is a constant:
μ t = ρ C μ k 2 ε
Model constants C 1 ε , C 2 ε , C μ , σ k , and σ ε have the following values:
C 1 ε = 1.44 , C 2 ε = 1.92 , C μ = 0.09 , σ k = 1.0 , σ ε = 1.3
where G k represents the generation of turbulent kinetic energy due to the average velocity gradient, and G b represents the generation of turbulent kinetic energy due to buoyancy. Y M is the contribution of the fluctuating expansion of the compressible turbulence to the calculated overall dissipation rate; C 1 ε , C 2 ε , and C 3 ε are constants; σ k and σ ε are the turbulent Prandtl numbers, respectively; and S k and S ε represent user-defined sources.
Ansys Fluent (2019 R2) predicts the trajectory of particles by integrating the particle force balance recorded in the Lagrange method. This force balance equates the particle inertia with the force acting on the particle and can be expressed as Equation (8).
m p d u p d t = m p u u p τ r + m p g ( ρ p ρ ) ρ p + F
Haider and Levenspiel developed a correlation for non-spherical particles [17],
C D = 24 R e s p h 1 + b 1 R e s p h b 2 + b 3 R e s p h b 4 + R e s p h
where b 1 , b 2 , b 3 , and b 4 are defined as
b 1 = exp 2.3288 6.4581 φ + 2.4486 φ 2 b 2 = 0.0964 + 0.5565 φ b 3 = e x p 4.905 13.8944 φ + 18.4222 φ 2 10.2599 φ 3 b 4 = e x p ( 1.4681 + 12.2584 φ 20.7322 φ 2 + 15.8855 φ 3 )
The shape factor (φ) is defined as
φ = s S
where s is the surface area of a sphere having the same volume as the particle, and S is the actual surface area of the particle. For calculating the particle mass, drag force, and R e s p h , the particle size d p should be the diameter of a sphere having the same volume.

2.4. Theoretical Efficiency of a Cyclone

Ansys Fluent was used for the numerical simulation of the cyclone separator. For the turbulent flow inside the cyclone, we used the k–ε turbulent model [18]. Therefore, the flow was assumed to be in a three-dimensional steady state, and the kε standard turbulence model was used. The efficiency of a cyclone separator typically increases with the flow rate, but beyond a certain range, separation efficiency decreases due to inertial turbulence. Consequently, this study analyzed outlet velocities ranging from 5 to 13 m/s in 1 m/s intervals. After completing the flow analysis, a particle behavior simulation was performed using the discrete phase model (DPM) integrated into Fluent.
It is important to determine the pressure drop inside a cyclone, as it helps in understanding the internal flow characteristics. In this study, the pressure drop was calculated as the difference between the inlet and outlet pressures, as shown in Equation (12):
P = P i n P o u t
where P [Pa] is the pressure drop in the cyclone separator, P i n [Pa] is the average inlet pressure in the cyclone separator, and P o u t [Pa] is the average outlet pressure.
The flow inside a cyclone is turbulent, which is related to the Reynolds number [19]. The cyclone Reynolds number is often used to describe the flow within a pipe based on the cyclone diameter. Given the complex flow characteristics inside a cyclone, this study assumed flow on a plate through the cyclone cylinder and cone and calculated it as shown in Equation (2).
R e = ρ v L μ
The Reynolds number (Re) for the cyclone separator is defined using dynamic viscosity (μ) and air density (ρ), where outlet velocity (v) and cyclone height (L) are critical parameters.
Equations (14) and (15) were used to compute the particle separation efficiency of the sand and microplastics in the cyclone. η s a n d , the efficiency of sand separation, was determined by dividing the number of sand particles collected at the sand outlet by the total particle count. For microplastics, their separation efficiency was calculated by dividing the number of microplastic particles collected at the plastic outlet by the total particle count, excluding the sand particles captured at the plastic outlet.
η s a n d = t r a p s a n d t o t a l p a r t i c l e × 100
η p l a s t i c = e s c a p e p l a s t i c e s c a p e s a n d t o t a l p a r t i c l e × 100
where η s a n d is the separation efficiency of the sand particles, ‘trap sand’ represents the sand separated at the sand collection location, η p l a s t i c is the separation efficiency of the microplastics, ‘escape plastic’ denotes the plastic particles separated at the plastic separation outlet, ‘escape sand’ refers to the sand particles collected at the plastic separation outlet, and ‘total particle’ is the total number of particles.

3. Results and Discussion

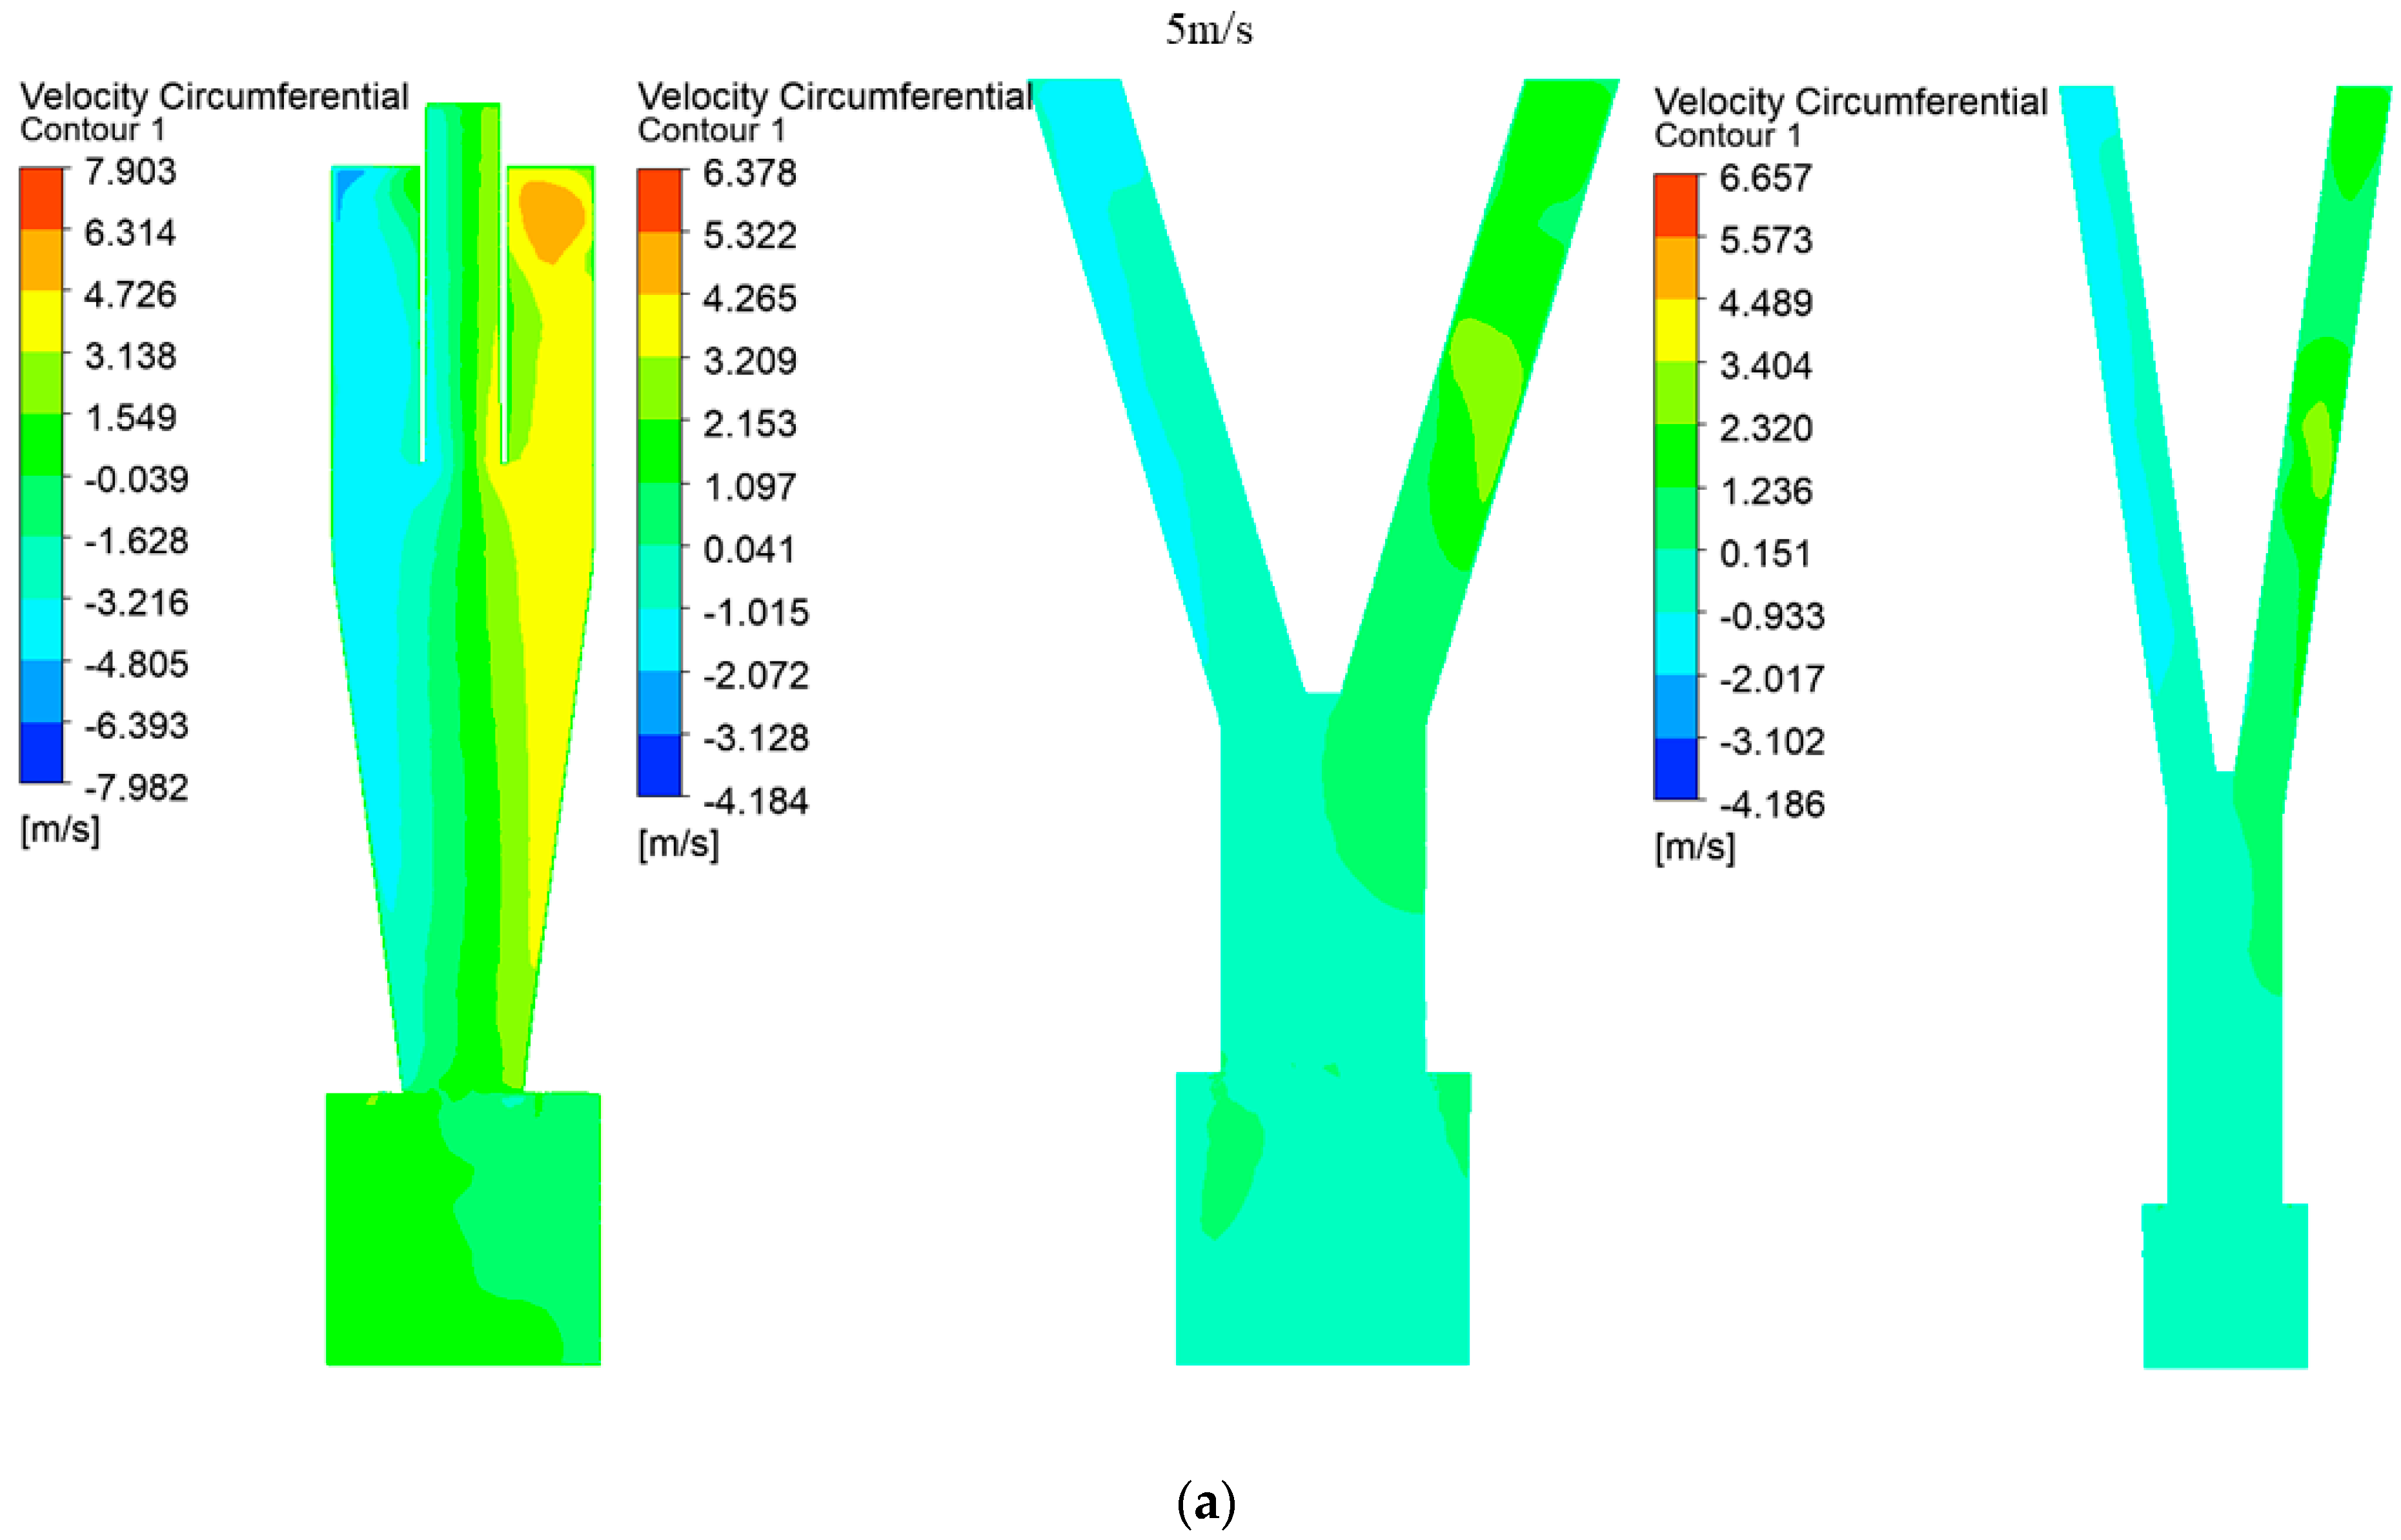
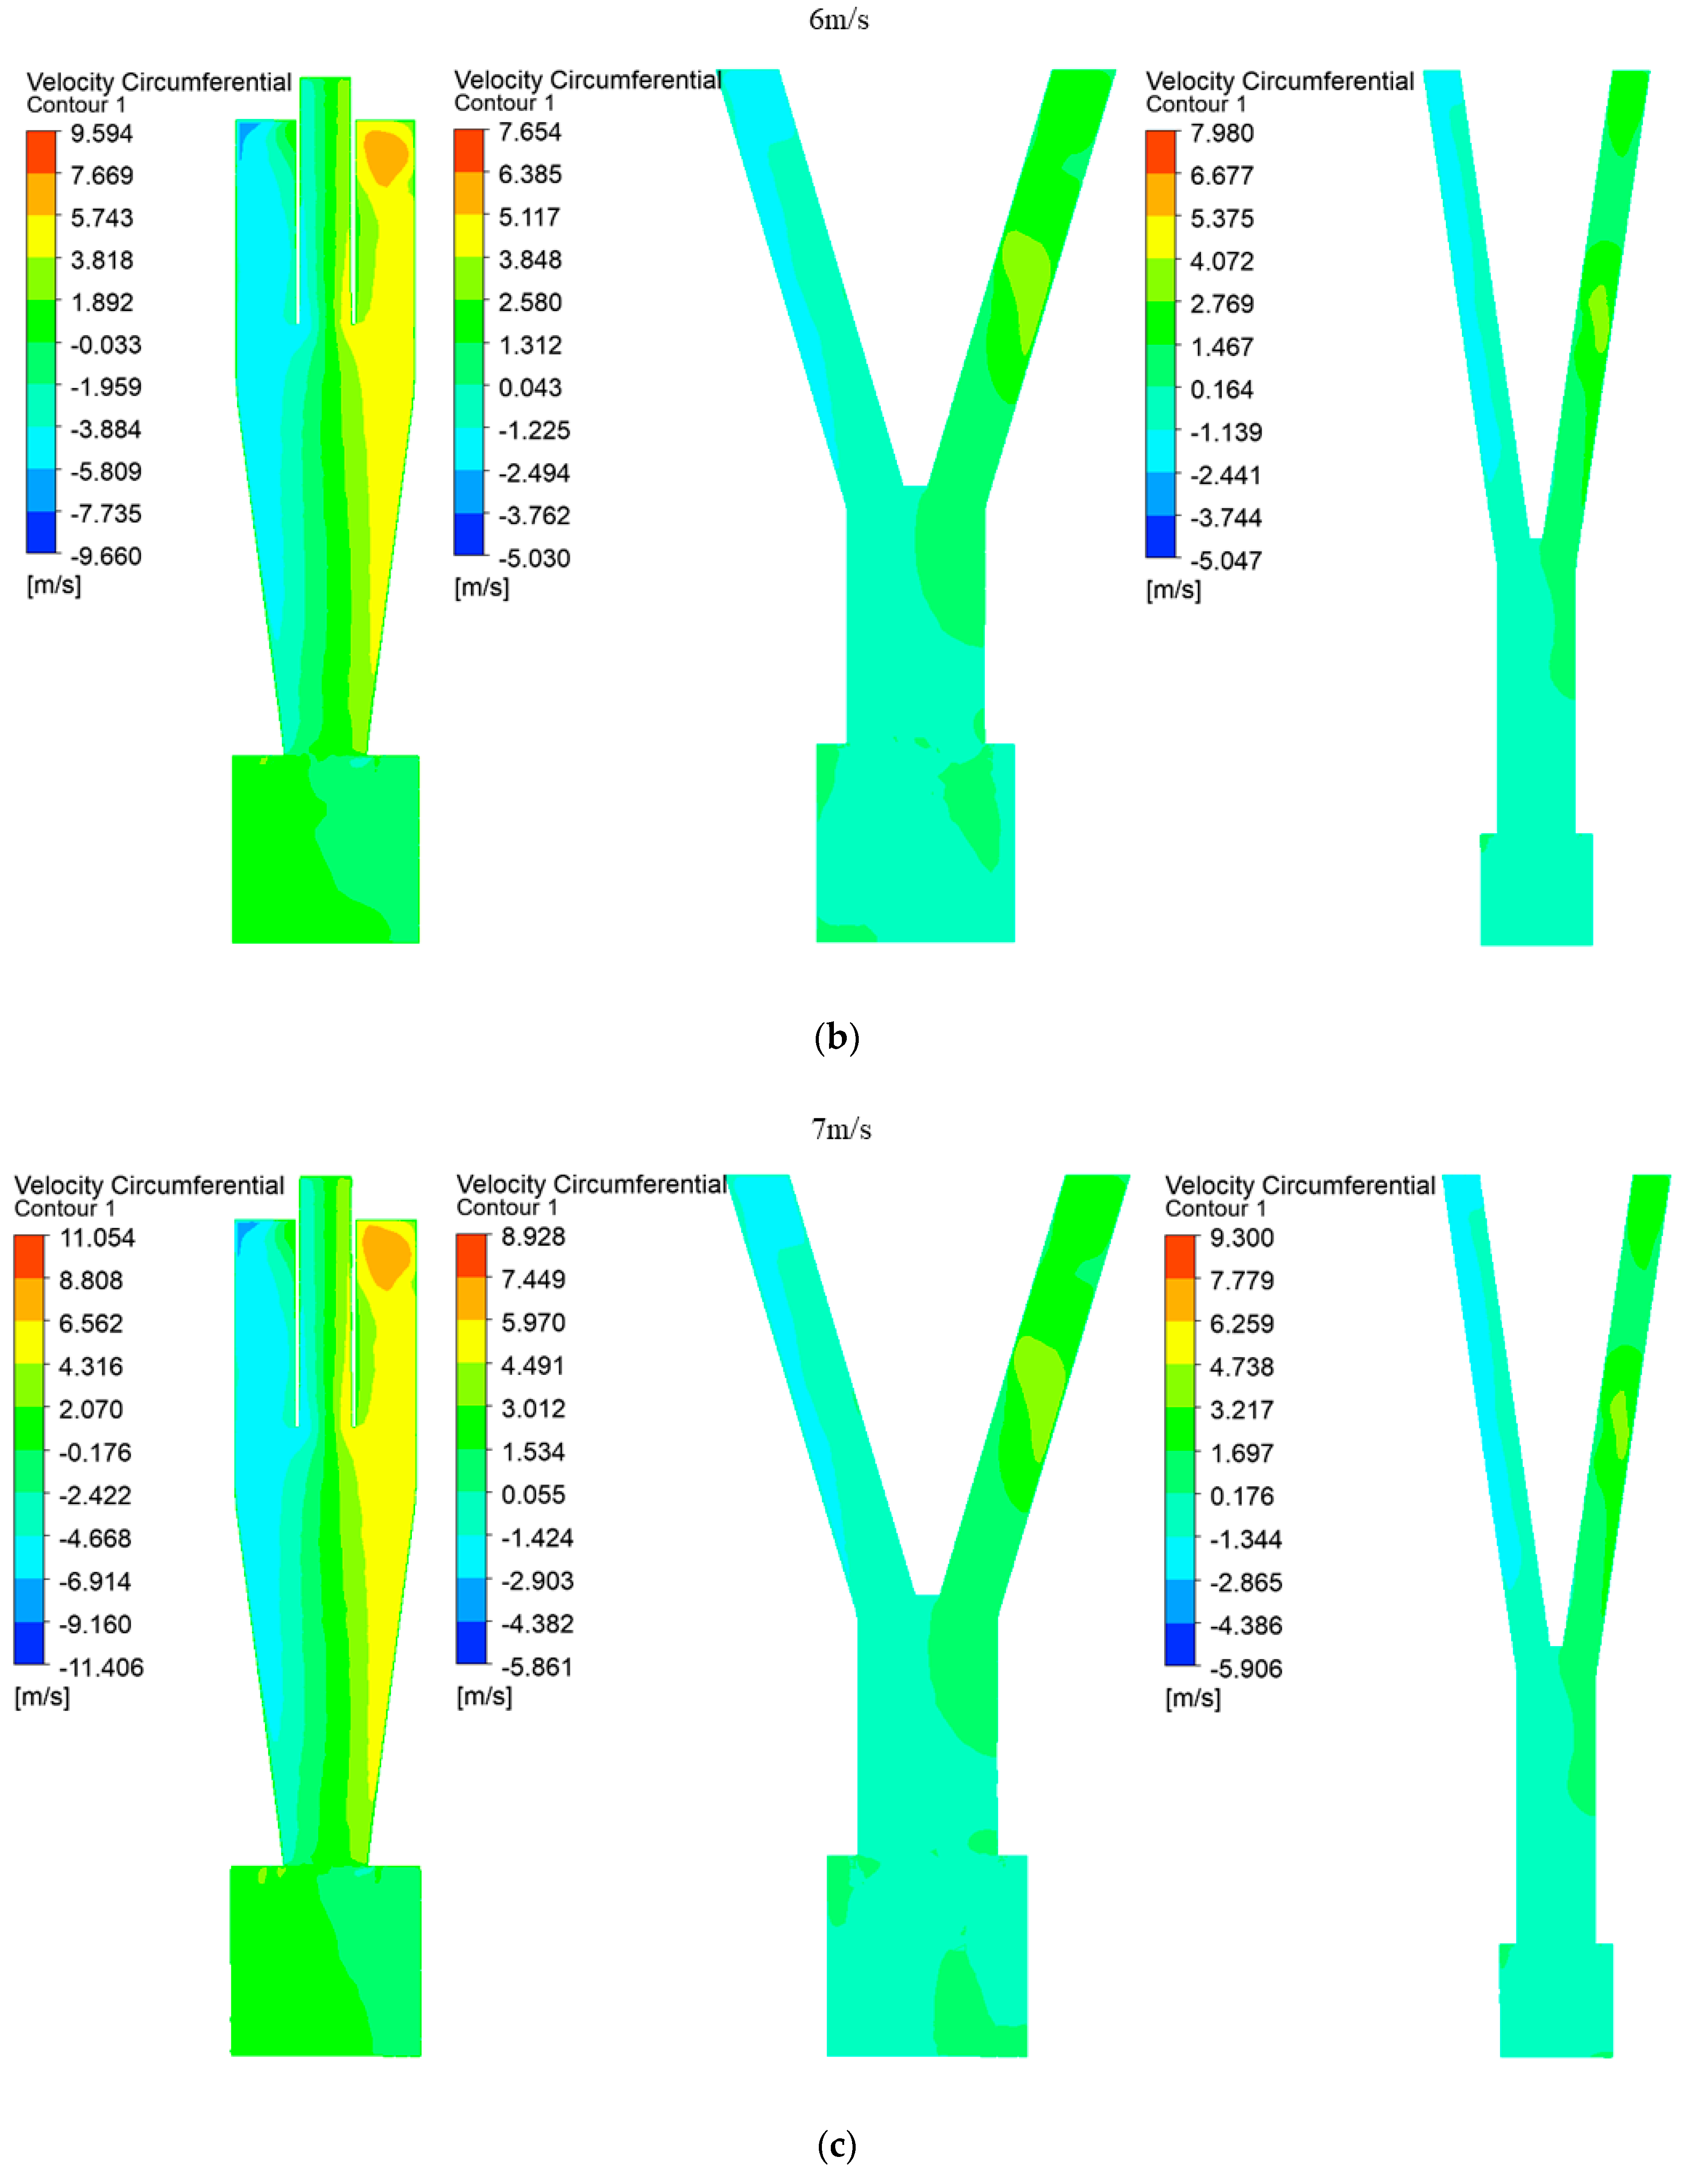
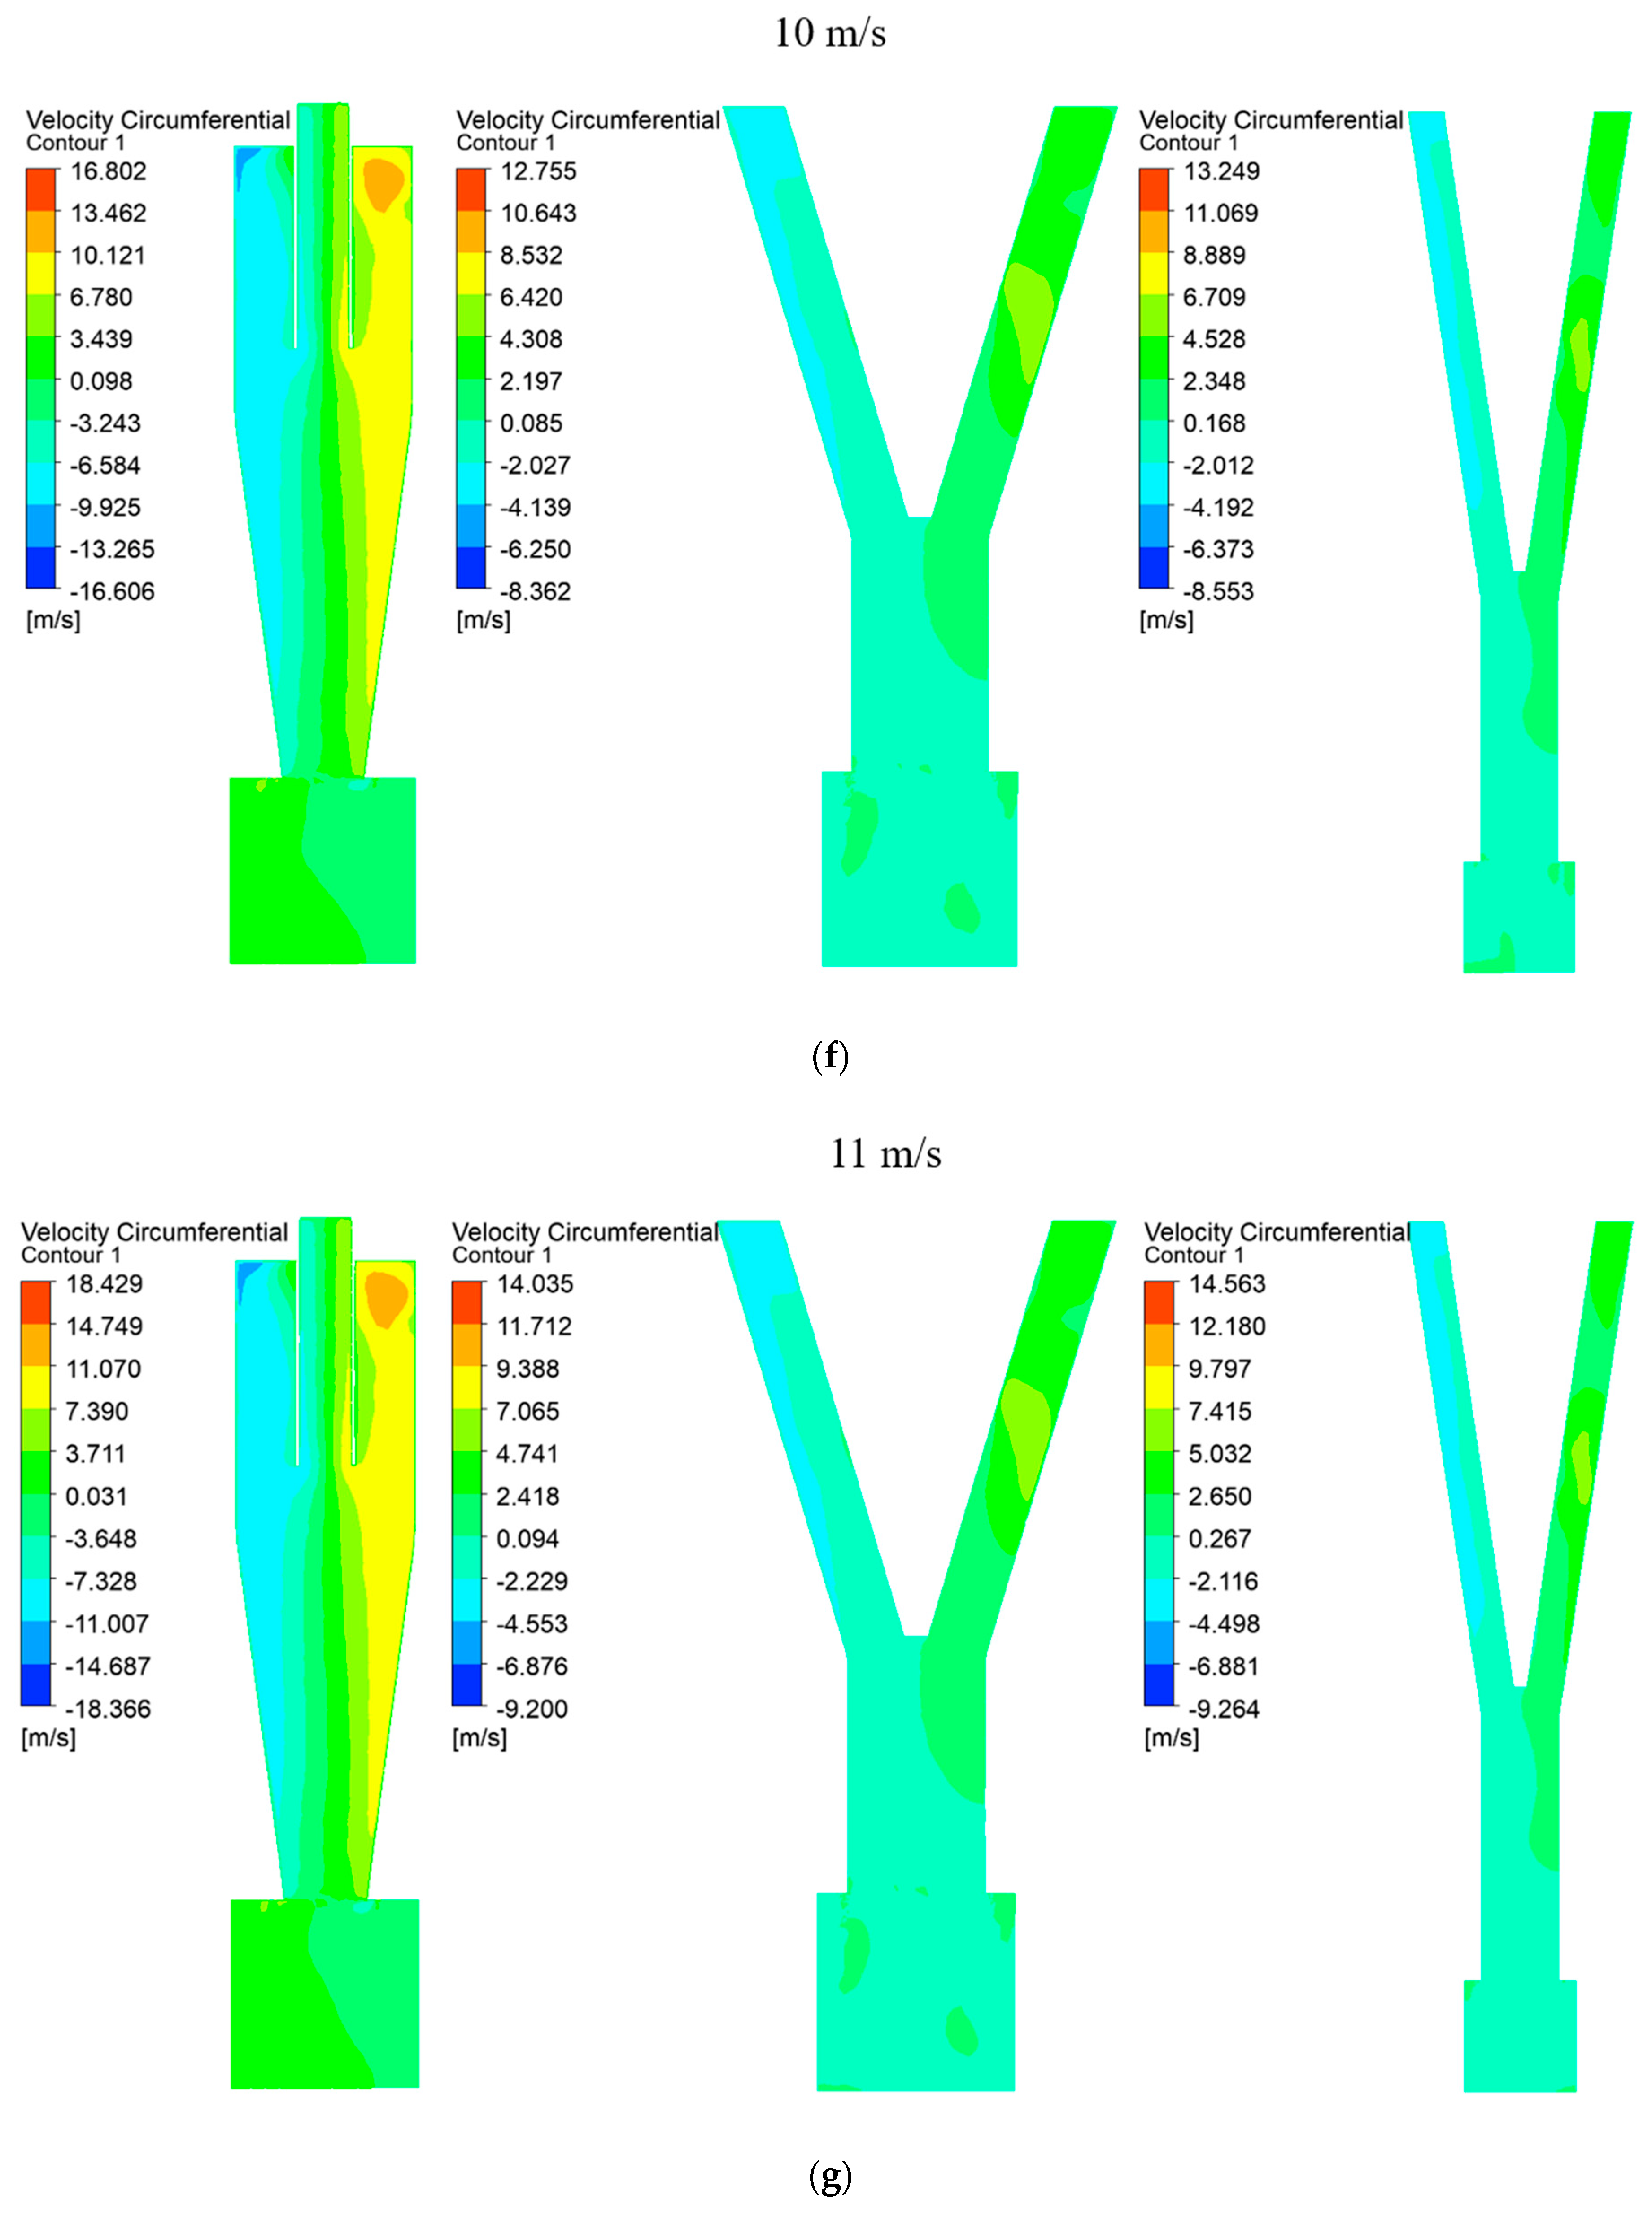
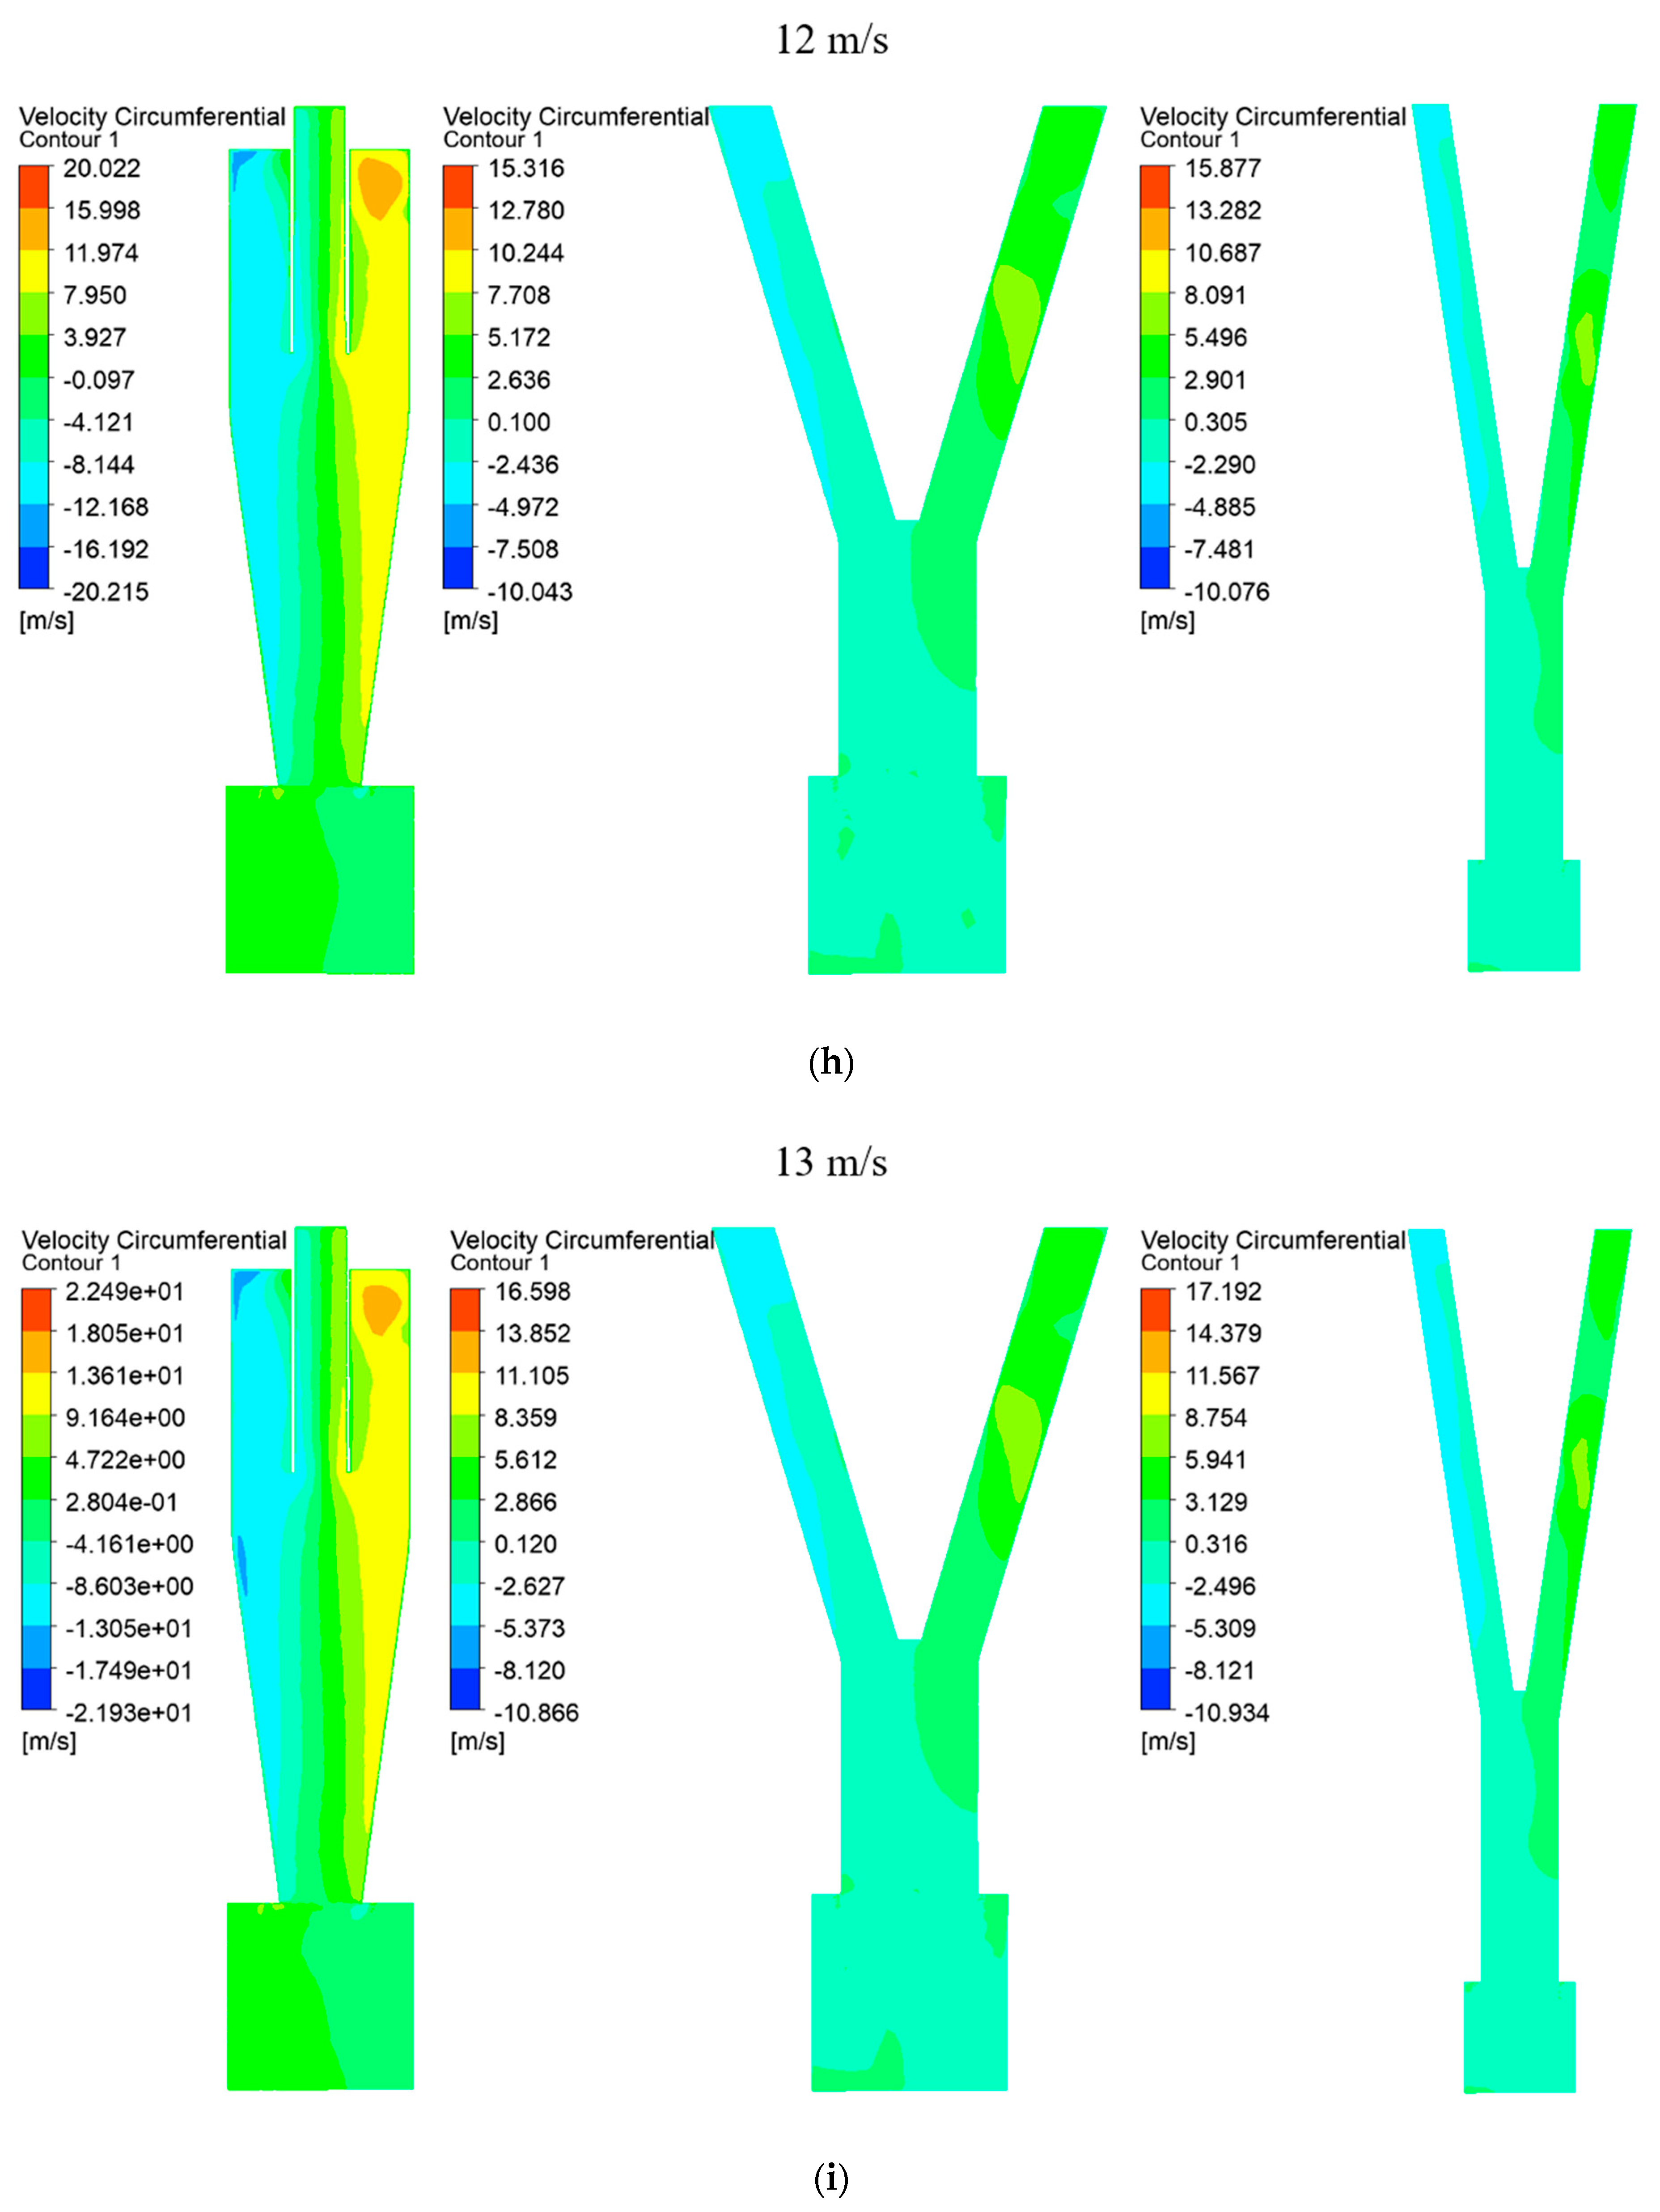
3.1. Tangential Velocity

Tangential velocity is crucial for understanding the development of rotational flow within a cyclone. Figure 3 displays a contour where the tangential velocity symmetrically extends left and right about the central axis across the entire range from 5 to 13 m/s for Type A, Type B, and Type C; this symmetry confirms well-developed rotational flow inside the cyclone. Generally, higher tangential velocities result in more particles flowing into the underflow and increased separation efficiency at the bottom [20]. However, in this study, where microplastics were separated through the upper outlet of the cyclone, slower tangential velocities were advantageous. Comparing Type A, Type B, and Type C at equivalent velocities revealed that Type B consistently exhibited the lowest tangential velocity. This characteristic of Type B promoted the increased inflow of particles into the overflow, thereby enhancing the separation performance significantly.

3.2. Pressure Drop

The pressure drop of the fluid in a cyclone is a critical factor in evaluating cyclone performance as it reflects the energy loss within the internal flow [21]. Figure 4 illustrates that the pressure drop increased with increasing outlet velocities for all three types of cyclones studied. In general cyclones, a higher pressure drop correlates with higher particle separation efficiency towards the underflow outlet, albeit at the expense of increased energy loss.
The objective of this study was to achieve separate particle outlets, specifically to discharge microplastics through the upper outlet. A lower pressure drop is advantageous for particle separation through the overflow outlet. Thus, Type B, which consistently exhibited the lowest pressure drop across all outlet speeds, offers advantages for microplastic separation. Moreover, from the perspective of microplastic separation, Type B can be considered an important design because it achieves both high separation efficiency and minimizes energy loss due to its low pressure drop in the cyclone.

3.3. Reynolds Number

Assuming the flow inside a cyclone resembles that of a flat plate, the heights of the hypotenuses of the cyclone cones for Type B and Type C were calculated. Figure 5 illustrates the Reynolds number corresponding to each cyclone shape. It was observed that the Reynolds number increased in the sequence of Type A, Type B, and Type C at equivalent speeds.
The critical Reynolds number for flow over a flat plate typically ranges from approximately 105 to 106. Consequently, for Type A, where the Reynolds number reached around 105 at 10 m/s, it was inferred that sand separation was effective. However, for Type B and Type C, as outlet velocity increased, the flow became increasingly unstable due to the higher Reynolds numbers, potentially leading to reduced separation efficiency.

3.4. Separation Efficiency

Figure 6 illustrates the separation efficiency of the cyclone separators at outlet velocities ranging from 5 to 13 m/s. In Type A, particles are not fully separated until 9 m/s, achieving a separation efficiency for sand of about 32–35% after 10 m/s.
For Type B, the separation efficiencies for Styrofoam and plastics (PET, PP, PU) reached peaks of 72.7% and 100%, respectively, at outlet velocities of 5 to 7 m/s. However, overall, efficiency declined as velocity increased, likely due to the increased sand flowing into the microplastic collection outlet via the overflow.
Type C showed improved separation performance for Styrofoam and plastics up to outlet velocities of 5 to 10 m/s, achieving maximum efficiencies of 70.8% for Styrofoam and 61% for PET at 10 m/s. Efficiency gradually decreased afterward. The maximum efficiencies of PP and PU were 95.5% and 73.4%, respectively, at 11 m/s, with efficiency declining as velocity further increased.
The separation efficiency of a cyclone is closely tied to the Reynolds number. Turbulence intensity increases with the Reynolds number, which aids in particle separation inside a cyclone. However, excessively high turbulence intensity can lead to flow instability, thereby reducing separation efficiency. When the cyclone diameter is fixed, increasing the length increases the Reynolds number. Thus, Type C, with the longest length, exhibited the highest Reynolds number at the same operating speed.
For Type B, a notable increase in the Reynolds number started at an outlet velocity of 8 m/s. This increase resulted in more sand particles flowing into the overflow, thereby decreasing the efficiency of microplastic separation. In Type C, the efficiencies for Styrofoam and PET decreased starting from outlet velocities of 11 m/s; for PP and PU, this decrease began at 12 m/s. This trend suggests that flow instability due to the Reynolds number begins to affect separation efficiency beyond these velocity thresholds.
Moreover, Type C demonstrated variations in separation efficiency depending on particle density.

4. Conclusions

Through this study of cyclone shape for separating sand and microplastics, as well as efficiency and Reynolds number relationships, the following conclusions were drawn:
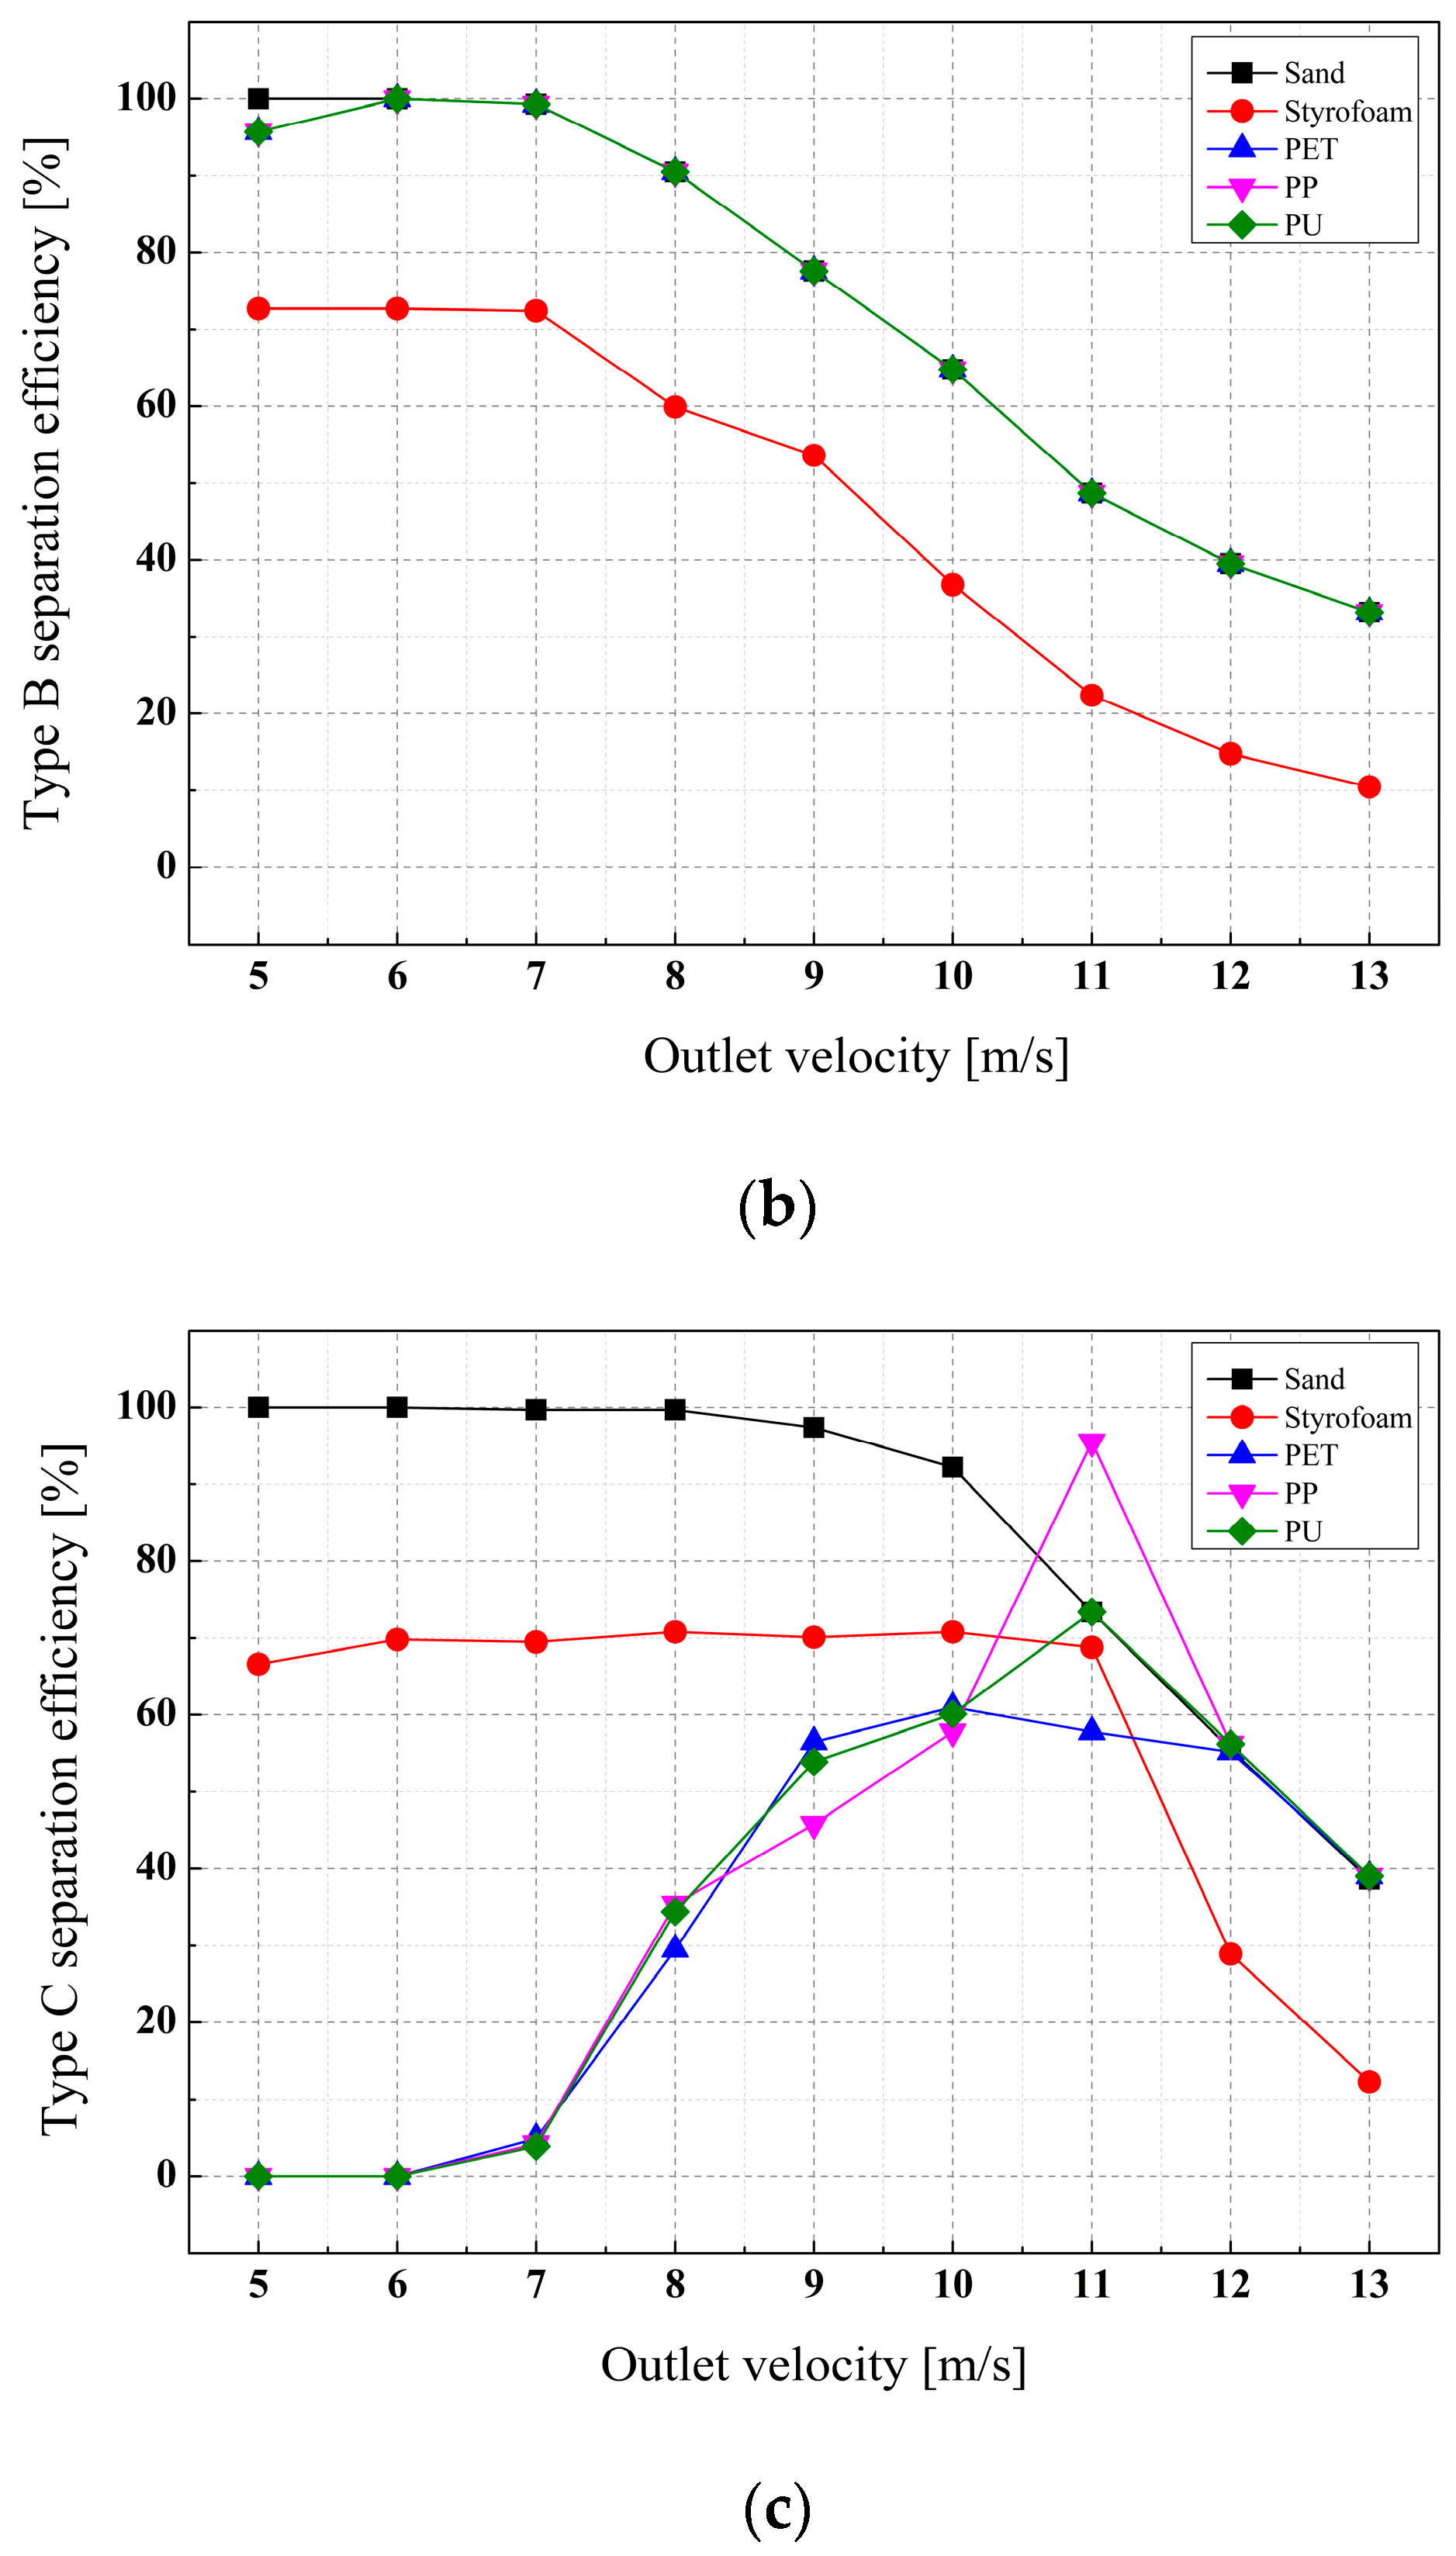
  • Type B demonstrated superior sand separation efficiency, reaching nearly 100%, and the effective separation of Styrofoam and other plastics (PET, PP, PU) at lower outlet velocities (5–7 m/s).
  • Type C showed higher sand separation efficiency, up to 100%, and effective separation of Styrofoam and plastics (PET, PP, PU) at moderate outlet velocities (5–10 m/s) but efficiency declined at higher speeds (10–11 m/s).
  • Increasing the outlet velocities beyond 8 m/s for Type B and 10–11 m/s for Type C led to reduced separation efficiency, which we attributed to increased sand particles flowing into the plastic outlet.
  • Each cyclone shape exhibited an optimal Reynolds number range for maximizing particle separation efficiency, underscoring the importance of matching operational speeds to these ranges.
  • Cone-shaped cyclone separators show potential for coastal applications, with Type B and Type C showing the ability to effectively collect Styrofoam and microplastics, suggesting further optimization through structural adjustments like cone angle and cyclone length.

Author Contributions

Analysis constructs and methods, W.S.; writing—original draft, I.K. and K.K.; writing—review and editing, S.I. and K.K. All authors have read and agreed to the published version of the manuscript.

Funding

This work was supported by a National Research Foundation of Korea (NRF) grant funded by the Korea government (MSIT) (No. NRF-2022R1G1A1004000) and the research fund of Chungnam National University.

Data Availability Statement

Data are available through request to the corresponding author.

Conflicts of Interest

The authors declare no conflicts of interest.

References

  1. Shen, Y.; Zhang, Y.; Zhang, X.; Zheng, H.; Wei, G.; Wang, M. A Fluid-Structure Interaction Method for the Elastohydrodynamic Lubrication Characteristics of Rubber-Plastic Double-Layer Water-Lubricated Journal Bearings. Lubricants 2023, 11, 240. [Google Scholar] [CrossRef]
  2. Moore, C.J. Synthetic Polymers in the Marine Environment: A Rapidly Increasing, Long-Term Threat. Environ. Res. 2008, 108, 131–139. [Google Scholar] [CrossRef] [PubMed]
  3. Derraik, J.G.B. The Pollution of the Marine Environment by Plastic Debris: A Review. Mar. Pollut. Bull. 2002, 44, 842–852. [Google Scholar] [CrossRef] [PubMed]
  4. Talukdar, A.; Kundu, P.; Bhattacharya, S.; Dutta, N. Microplastic Contamination in Wastewater: Sources, Distribution, Detection and Remediation through Physical and Chemical-Biological Methods. Sci. Total Environ. 2024, 916, 170254. [Google Scholar] [CrossRef] [PubMed]
  5. Yuan, F.; Li, X.; Yu, W.; Du, J.; Wang, D.; Yang, X.; Zhou, C.; Wang, J.; Yuan, H. A High-Efficiency Mini-Hydrocyclone for Microplastic Separation from Water via Air Flotation. J. Water Process Eng. 2022, 49, 103084. [Google Scholar] [CrossRef]
  6. He, L.; Ji, L.; Sun, X.; Chen, S.; Kuang, S. Investigation of Mini-Hydrocyclone Performance in Removing Small-Size Microplastics. Particuology 2022, 71, 1–10. [Google Scholar] [CrossRef]
  7. Fu, S.; Qian, Y.; Yuan, H.; Fang, Y. Effect of Cone Angles of a Hydrocyclone for the Separation of Waste Plastics with Low Value of Density Difference. Waste Manag. 2022, 140, 183–192. [Google Scholar] [CrossRef] [PubMed]
  8. Thiemsakul, D.; Piemjaiswang, R.; Sema, T.; Feng, Y.; Piumsomboon, P.; Chalermsinsuwan, B. Effect of Hydrocyclone Design in Microplastics-Water Separation by Using Computational Fluid Dynamics Simulations. Results Eng. 2024, 22, 102034. [Google Scholar] [CrossRef]
  9. Song, Y.K.; Hong, S.H.; Jang, M.; Han, G.M.; Shim, W.J. Occurrence and Distribution of Microplastics in the Sea Surface Microlayer in Jinhae Bay, South Korea. Arch. Environ. Contam. Toxicol. 2015, 69, 279–287. [Google Scholar] [CrossRef] [PubMed]
  10. Cho, Y.; Shim, W.J.; Jang, M.; Han, G.M.; Hong, S.H. Nationwide Monitoring of Microplastics in Bivalves from the Coastal Environment of Korea. Environ. Pollut. 2021, 270, 116175. [Google Scholar] [CrossRef] [PubMed]
  11. Kim, I.; Kim, S. Seasonal Distribution Characteristics of Microplastics in the Sand Beach of the Daebu Island, Gyeonggi-Do. J. Korean Soc. Environ. Anal. 2015, 18, 221–231. [Google Scholar]
  12. Lee, J.; Lee, J.S.; Jang, Y.C.; Hong, S.Y.; Shim, W.J.; Song, Y.K.; Hong, S.H.; Jang, M.; Han, G.M.; Kang, D.; et al. Distribution and Size Relationships of Plastic Marine Debris on Beaches in South Korea. Arch. Environ. Contam. Toxicol. 2015, 69, 288–298. [Google Scholar] [CrossRef] [PubMed]
  13. Ali, S.S.; Elsamahy, T.; Al-Tohamy, R.; Zhu, D.; Mahmoud, Y.A.G.; Koutra, E.; Metwally, M.A.; Kornaros, M.; Sun, J. Plastic Wastes Biodegradation: Mechanisms, Challenges and Future Prospects. Sci. Total Environ. 2021, 780, 146590. [Google Scholar] [CrossRef] [PubMed]
  14. Jang, M.; Shim, W.J.; Han, G.M.; Rani, M.; Song, Y.K.; Hong, S.H. Widespread Detection of a Brominated Flame Retardant, Hexabromocyclododecane, in Expanded Polystyrene Marine Debris and Microplastics from South Korea and the Asia-Pacific Coastal Region. Environ. Pollut. 2017, 231, 785–794. [Google Scholar] [CrossRef] [PubMed]
  15. Volume, Shape, and Roundness of Rock Particles on JSTOR. Available online: https://www.jstor.org/stable/30058012?seq=1 (accessed on 15 July 2024).
  16. Kamnis, S.; Gu, S. Study of In-Flight and Impact Dynamics of Nonspherical Particles from HVOF Guns. J. Therm. Spray Technol. 2010, 19, 31–41. [Google Scholar] [CrossRef]
  17. Haider, A.; Levenspiel, O. Drag Coefficient and Terminal Velocity of Spherical and Nonspherical Particles. Powder Technol. 1989, 58, 63–70. [Google Scholar] [CrossRef]
  18. Sonawane, C.R.; Dhanorkar, M.; Mishra, I.; Kirdat, A.; Bhatwadekar, S.; Sawant, R.; Pandey, A. Numerical Simulation of Hydro-Cyclone Separator Used for Separation of Highly Dense Suspended Particulate Matter. Mater. Today Proc. 2022, 59, 85–92. [Google Scholar] [CrossRef]
  19. El-Batsh, H.M. Improving Cyclone Performance by Proper Selection of the Exit Pipe. Appl. Math. Model. 2013, 37, 5286–5303. [Google Scholar] [CrossRef]
  20. Feng, M.; Gui, C.; Zhou, Y.; Lei, Z. Numerical Study on Performance Optimization and Flow Mechanism of a New Cyclone Separator. Green Chem. Eng. 2024. [Google Scholar] [CrossRef]
  21. Prasanna, N.; Subramanian, K.; Ajay, S.; Rajagopal, T.; Vigneshwaran, V. CFD Study on the Performance of Reducing Pressure Drop Holes in Cyclone Separator. Mater. Today Proc. 2021, 43, 1960–1968. [Google Scholar] [CrossRef]
Figure 1. Plastics and sand collection location in cyclone separators.
Separations 11 00222 g001
Figure 2. Cyclone separator mesh structures.
Separations 11 00222 g002
Figure 3. (a) Tangential velocity in cyclone separators at outlet velocity of 5 m/s. (b) Tangential velocity in cyclone separators at outlet velocity of 6 m/s. (c) Tangential velocity in cyclone separators at outlet velocity of 7 m/s. (d) Tangential velocity in cyclone separators at outlet velocity of 8 m/s. (e) Tangential velocity in cyclone separators at outlet velocity of 9 m/s. (f) Tangential velocity in cyclone separators at outlet velocity of 10 m/s. (g) Tangential velocity in cyclone separators at outlet velocity of 11 m/s. (h) Tangential velocity in cyclone separators at outlet velocity of 12 m/s. (i) Tangential velocity in cyclone separators at outlet velocity of 13 m/s.
Separations 11 00222 g003aSeparations 11 00222 g003bSeparations 11 00222 g003cSeparations 11 00222 g003dSeparations 11 00222 g003e
Figure 4. Pressure drop in cyclone separators.
Separations 11 00222 g004
Figure 5. (a) Reynolds number in Type A cyclone separator, (b) Reynolds number in Type B cyclone separator, (c) Reynolds number in Type C cyclone separator.
Separations 11 00222 g005
Figure 6. (a) Separation efficiency in Type A cyclone separator, (b) separation efficiency in Type B cyclone separator, (c) separation efficiency in Type C cyclone separator.
Separations 11 00222 g006aSeparations 11 00222 g006b
Table 1. Mesh properties in cyclone separators.
Cyclone Separator TypeType AType BType C
Node274,335413,289677,585
Minimum Orthogonal Quality0.2837970.2390260.201776
Mesh TypePolyhedraPolyhedraPolyhedra
Table 2. Properties of particles.
MaterialParticle Size (mm)Density (kg/m3)Shape Factor
Sand216501
Styrofoam3100.1
PET1340
PP900
PU1120
Disclaimer/Publisher’s Note: The statements, opinions and data contained in all publications are solely those of the individual author(s) and contributor(s) and not of MDPI and/or the editor(s). MDPI and/or the editor(s) disclaim responsibility for any injury to people or property resulting from any ideas, methods, instructions or products referred to in the content.

