Article

Separation and Biological Activities of the Main Compounds from the Bark of Myrica rubra Siebold & Zucc

Hunan Provincial Key Laboratory of Dong Medicine, Hunan Provincial Key Laboratory for Synthetic Biology of Traditional Chinese Medicine, School of Pharmaceutical Science, Hunan University of Medicine, Huaihua 418000, China
*
Author to whom correspondence should be addressed.
These authors contributed equally to this work.
Separations 2024, 11(1), 4; https://doi.org/10.3390/separations11010004
Submission received: 13 November 2023 / Revised: 14 December 2023 / Accepted: 18 December 2023 / Published: 20 December 2023
(This article belongs to the Section Chromatographic Separations)

Abstract

:
Myrica rubra (Lour.) Siebold & Zucc bark is a traditional natural medicine used by the people of the Dong minority in western Hunan in China. In this study, the main compounds in Myrica rubra bark including epigallocatechin gallate, myricetrin, myricetin, taraxerol, myricanol, and 11-O-acetylmyricanol were separated using both silica gel column chromatography and high-speed countercurrent chromatography (HSCCC). Notably, it is the first report of discovering 11-O-acetylmyricanol from Myrica rubra bark. The results of the bioactivity studies suggested that epigallocatechin gallate showed the highest α-glucosidase inhibitory activity, while myricetin exhibited the highest reactive oxygen species (ROS) scavenging ability in zebrafish embryos. Intriguingly, myricanol exhibited strong apoptosis-inducing activity on HepG2 cells, and further studies revealed that myricanol was capable of promoting the cleavage of caspase 3, 8, and 9, then resulting in the apoptosis in HepG2 cells. The findings of the present study have important implications for the separation of the main compounds in Myrica rubra and will provide credence to the ethnomedicinal application of the isolated compounds against cardiovascular disease and cancer.

1. Introduction

Myrica rubra (Lour.) Siebold & Zucc (MR) is a plant with high medicinal value because different parts of the tree have been historically used as folk medicines. For instance, Myrica rubra fruits are one of the most popular fruits in the world because of their pleasant sweetness and high levels of nutritional components including carbohydrates, sugars, organic acids, minerals, and vitamins [1]. The fruit can be eaten fresh, canned, or dried and is widely consumed, as well as being used in wine-making and juice-making [2]. Additionally, pharmacological studies have demonstrated that MR fruits exhibited antioxidant, anti-cancer [3], and antidiabetic [4] properties, while diarylheptanoid glycosides and phenolic compounds isolated from the bark of Myrica rubra were found to inhibit the induction of NO synthase and the overproduction of reactive oxygen species [5,6].
The bark of Myrica rubra has been historically applied to bruises, swelling, and stomach and duodenum ulcer treatment [7]. Modern pharmaceutical researches have revealed that the bark of MR contains numerous phytochemicals including flavonoids, tannins, and triterpenes [8,9]. Therefore, it is important to separate bio-active compounds from the bark of MR. Typically, these compounds were mainly purified using various solid support matrix chromatographies such as silica gel [10] and its modifications [11]. The main drawback of solid columns is irreversible adsorption, which is costly and time-consuming. In contrast to liquid–solid chromatography, high-speed countercurrent chromatography (HSCCC) is a liquid–liquid partition chromatographic technique that possesses greater advantages such as less solvent consumption, simpler separation conditions, no sample adsorption, and larger loading [12].
In this study, the main compounds from the bark of MR were first separated using a silica column (Figure 1), and then we investigated the more cost-effective method of HSCCC for the purification of these compounds. Importantly, the antioxidant, antidiabetic, and apoptosis-inducing activities of these compounds were evaluated to provide a basis for the further application of these active ingredients.

2. Materials and Methods

2.1. Plant Material, Reagents, and Chemicals

The bark of the Myrica rubra was collected from Jing-zhou county of Huaihua on 21 August 2021, in Hunan Province, China. The plant material was authenticated by Prof. LvJang Yuan at Southwest University. All solvents used for the preparation of the enriched extract and for separation were of analytical grade (Kelong Chemical Reagent Factory, Chengdu, China). The methanol and acetonitrile used for HPLC were of chromatographic grade (Honeywell Burdick & Jackson, Morristown, NJ, USA), and the used water was distilled water. Methylthiotetrazole (MTT) and 2,2′-Azino-bis (3-ethylben zothiazoline-6-sulfonic acid) diammonium salt (ABTS) were purchased from Beijing Dingguo Changsheng Biotechnology CO., LTD (Beijing, China). Dimethyl sulfoxide (DMSO) was purchased from Sigma Chemicals (St Louis, MO, USA). Acarbose tablets were purchased from Bayer HealthCare (Bayer Health Care Co., Leverkusen, Germany). Ascorbic acid (purity: 99.0%) was purchased from Beijing Bailingwei Technology Co., LTD (Beijing, China).

2.2. Preparation of Crude Extract

The bark of MR was air-dried and ground to pass through a 20-mesh screen. In total, 15 kg of the powder was extracted with 90% EtOH (1:3, v/v) at 35 °C for 12 h. After filtration, the filtrates were evaporated under the reduced pressure at 50 °C to afford ethanol extract. The ethanol residue was dissolved in distilled water and successively partitioned with petroleum ether, ethyl acetate, and n-butanol. Each fraction was evaporated under the reduced pressure, and the residues were stored at −4 °C until use. The precipitate of n-butanol fraction was dissolved with ethyl acetate at 65 °C, and the liquid was drained through filter paper; then the myricetrin could be obtained after recrystallization in ethyl acetate solution. The ethyl acetate fraction (40 g) was fractionated with a silica gel column (80.0 × 10.0 cm i.d.). The column was eluted with a mixture of petroleum ether and ethyl acetate at the ratio of 10:0 (4.0 L), 10:1 (4 L), 9:1 (4.0 L), 8:1 (4.0 L), 7:1 (4.0 L), 6:1 (8.0 L), 5:1 (4.0 L), 4:1 (3.0 L), 3:1 (2.0 L), 2:1 (8.0 L), 1:1 (8.0 L), and 1:2 (8.0 L) at a flow rate of 5.0 mL/min. Taraxerol was obtained from the 8:1 eluted fraction, while epigallocatechin gallate and myricanol were obtained from the 2:1 eluted fraction. The 1:1 and 1:2 eluted fractions were further subjected to a Sephadex LH 20 column (50.0 × 3.5 cm i.d.) and eluted with 50% methanol in water at a flow rate of 1.0 mL/min to yield myricetin.
For 11-O-acetylmyricanol separation, some of the above mentioned 6:1 and 5:1 eluted fractions that contained 11-O-acetylmyricanol (0.562 g) were further subjected to a silica gel column (20.0 × 2.5 cm i.d.) and eluted with a mixture of petroleum ether-ethyl acetate at the ratio of 10:0 (2.0 L), 10:1 (2.0 L), and 9:1 (2.0 L), at a flow rate of 1–2 mL/min. The white needle crystal weighing 0.012g was obtained from the 9:1 eluted fraction after recrystallization in ethyl acetate.

2.3. Partition Coefficients and HSSCC Separation

The HSCCC instrument employed in this study was a TBE-300 B high-speed countercurrent chromatography (Tauto Biotech, Shanghai, China) with three multilayer coil separation columns (total volume = 300 mL) and a 20 mL sample loop. The revolution radius was 5 cm, and the β values of the multilayer coil varied from 0.5 at the internal terminal to 0.8 at the external terminal. The revolution speed of this apparatus ranged from 0 to 1000 rpm. The separation temperature can be controlled by an HX-105 constant-temperature circulator (Beijing Changliu Instrument Company, Beijing, China). A model TBD 2000 UV detector was used for the continuous monitoring of the effluent. The HPLC system used for the analysis was an LC-20AD system equipped with a diode 126 array detector (Shimadzu, Japan) and a Welchrom-C18 column (4.6 mm × 250 mm, 5 µm particle size).
In a suitable solvent system for HSCCC separations, the K values for target compounds are 0.5 ≤ K ≤ 1.0. In this study, the K values of the main compound in MR ethyl acetate extract were determined by a thin layer chromatograph (TLC)-based or HPLC method [13]. The settling time of the two-phase solvent system was the time when the vigorously stirred mixture of the upper and lower phases (1:1, v/v) formed a clear layer. The solvent volume of each phase was measured using a 10 mL graduated cylinder.
The HSCCC experiments were performed using a chloroform-methanol-water solvent system and an n-hexane-ethyl acetate-methanol-water solvent system. Before use, the solvent mixtures were thoroughly equilibrated in a separatory funnel. In this study, the lower phase was used as the stationary phase, and the upper phase was used as the mobile phase. The rotation rate was set at 810 rpm, and the upper phase was pumped at a flow rate of 2.0 mL/min after the multilayer coil column was entirely filled with the lower phase. When the hydrodynamic equilibrium was reached, the sample solution was injected into the column, and the effluent was continuously monitored with a UV detector at 254 nm. The eluates were collected using test tubes and further analyzed by TLC and HPLC.

2.4. HPLC Analysis and Identification of Compounds

A quantity of 20 μL of each sample was analyzed by using the same HPLC system illustrated in Section 2.3. The gradient elution was employed in this study using water (solvent A) and methanol (solvent B) mixture. The gradient elute procedure was as follows: 0–20.0 min, B 5.0%; 20.0–35.0 min, B 5.0–30.0%; 35.0–55.0 min, B 30.0–90.0%; 55.0–60.0 min, B 90.0%; 60.0–80.0 min, B 90.0%; and 80.0–90.0 min, B 90.0–5.0%. The flow rate was 1.0 mL/min, and the selected detection wavelength was 254 nm. The HSCCC peak fractions were evaporated under reduced pressure. The 1H and 13C NMR spectra (Bruker GPX 500 spectrometer), mass spectrometry, COSY, HMBC, DEPT, HSQC, and NOESY spectra were used for structure identification, when appropriate (Supplementary Materials).

2.5. Assay for α-Glucosidase Inhibitory Activity

The α-glucosidase inhibitory assay was carried out according to the standard protocols in our lab [14]. Briefly, a volume of 20 μL compound solution (dissolved in 1% DMSO) was added to 158 μL of 67 mM phosphate buffer (pH 6.8) containing 60 μL α-glucosidase solution in a 96-well plate at 25 °C for 10 min. A quantity of 8 μL of 116 mM PNPG, which is the substrate of α-glucosidase, was added to each well at 5 s intervals. Then this reaction mixture was incubated at 35 °C for 10 min. Before and after incubation, the absorbance of the mixture was recorded at 405 nm using a microarray reader. In the control group, 20 μL buffer solution took the place of the same volume of the test compounds. The α-glucosidase inhibitory rate (IR) could be calculated as follows: IR (%) = [absorbance of the control − absorbance of the extract]/absorbance of the control.

2.6. Evaluation of LPS-Induced Reactive Oxygen Species Scavenging Activity in Zebrafish Embryos

Zebrafish embryos were obtained by natural spawning, and the collection of the embryos was completed within 30 min. Then embryos at 3–4 h post-fertilization (hpf) were transferred to a 24-well plate (25 embryos in each well). Oxidative stress was induced by co-culture of the embryos with 1 μg/mL LPS solvent for 14 h (in culture medium). After that, according to our preliminary results, the embryos were treated with 10 μg/mL of myricetrin, myricetin, epigallocatechin gallate, and taraxerol to evaluate their reactive oxygen species scavenging activity. A quantity of 50 μg/mL of Vc was used as a positive control. After 14 h of treatment, the culture medium was changed to fresh embryo medium, and the embryos were incubated with 10 μL (10 μg/mL) acridine orange for 0.5 h in the dark at 28.5 °C. After incubation, the embryos were rinsed by embryo medium three times and anaesthetized with 0.02% tricaine and photographed using the fluorescence microscope (Nikon eclipse Ci, Tokyo, Japan). For image analysis, the Nikon Elements-DR software was used for quantifying the fluorescent intensity of each embryo.

2.7. Apoptosis-Inducing Activities of Pure Myrica rubra Compounds

HepG2 cells were cultured in RPMI 1640 medium containing 10% fetal calf serum in a saturated humidified atmosphere of 5% CO2 at 37 °C. Pure Myrica rubra compounds were dissolved in distilled water containing 1% DMSO. After the cells formed a semi-confluent monolayer, the Myrica rubra compounds with a range of three concentrations (113, 226, and 339 µg/mL) were added to the corresponding wells. Each group had three repetitions. After 24 h incubation, the MTT solution was added to each well to reach a final concentration of 5 mg/mL. After incubation of the cells at 37 °C for 4 h, the culture medium was discarded, and 200 μL DMSO was added to each well to dissolve the formazan. After 20 min shaking, the optical density value of each well was recorded at a wavelength of 490 nm to calculate the inhibition rate.

2.8. Western Blot Analysis

HepG 2 cells were treated with myricanol (5.0, 10.0, and 15.0 µg/mL) for 20 h, then the cell was lysed using RIPA buffer containing 1 mM PMSF (Beijing Dingguo Changsheng Biotechnology CO., LTD, Beijing, China) on ice. Equal amounts of cellular protein (20 µg) were subjected to 10% sodium dodecyl sulfate-polyacrylamide gel electrophoresis and electrophoretically transferred to PVDF membranes. After blocking the membrane with 10% milk for 1 h at room temperature, the membranes were further incubated overnight at 4 °C with a primary antibody followed by a secondary antibody for 1 h at room temperature. The primary antibodies used in Western blot including caspase 3 (1:2000, 17 KD), caspase 8 (1:2000, 25–32 KD), caspase 9 (1:2000, 46 KD), and anti-rabbit β-actin (1:2000, 43 KD) were purchased from Proteintech group Inc. (Wuhan, China). The anti-rabbit secondary antibodies (1:4000) were purchased from Proteintech group Inc. (Wuhan, China). Notably, the antibodies of these caspase families can be used to detect their pro- and cleaved forms. The bands were visualized with a chemiluminescence reagent (LumiGLO, Cell Signaling, Danvers, MA, USA) and a ChemiDoc XRS imaging system (Bio-Rad, Ann Arbor, MI, USA). The results of the Western blot were analyzed by the Image J program (Version 1.51j8).

2.9. Statistical Analysis

Data were indicated as the mean ± standard deviation (SD). The statistical analysis was performed by the SPSS software for Windows (version 23.0). Comparisons between different groups were performed by using one-way analyses of variance (ANOVA) followed by a post hoc Bonferroni’s test. p < 0.05 were considered significant.

3. Results

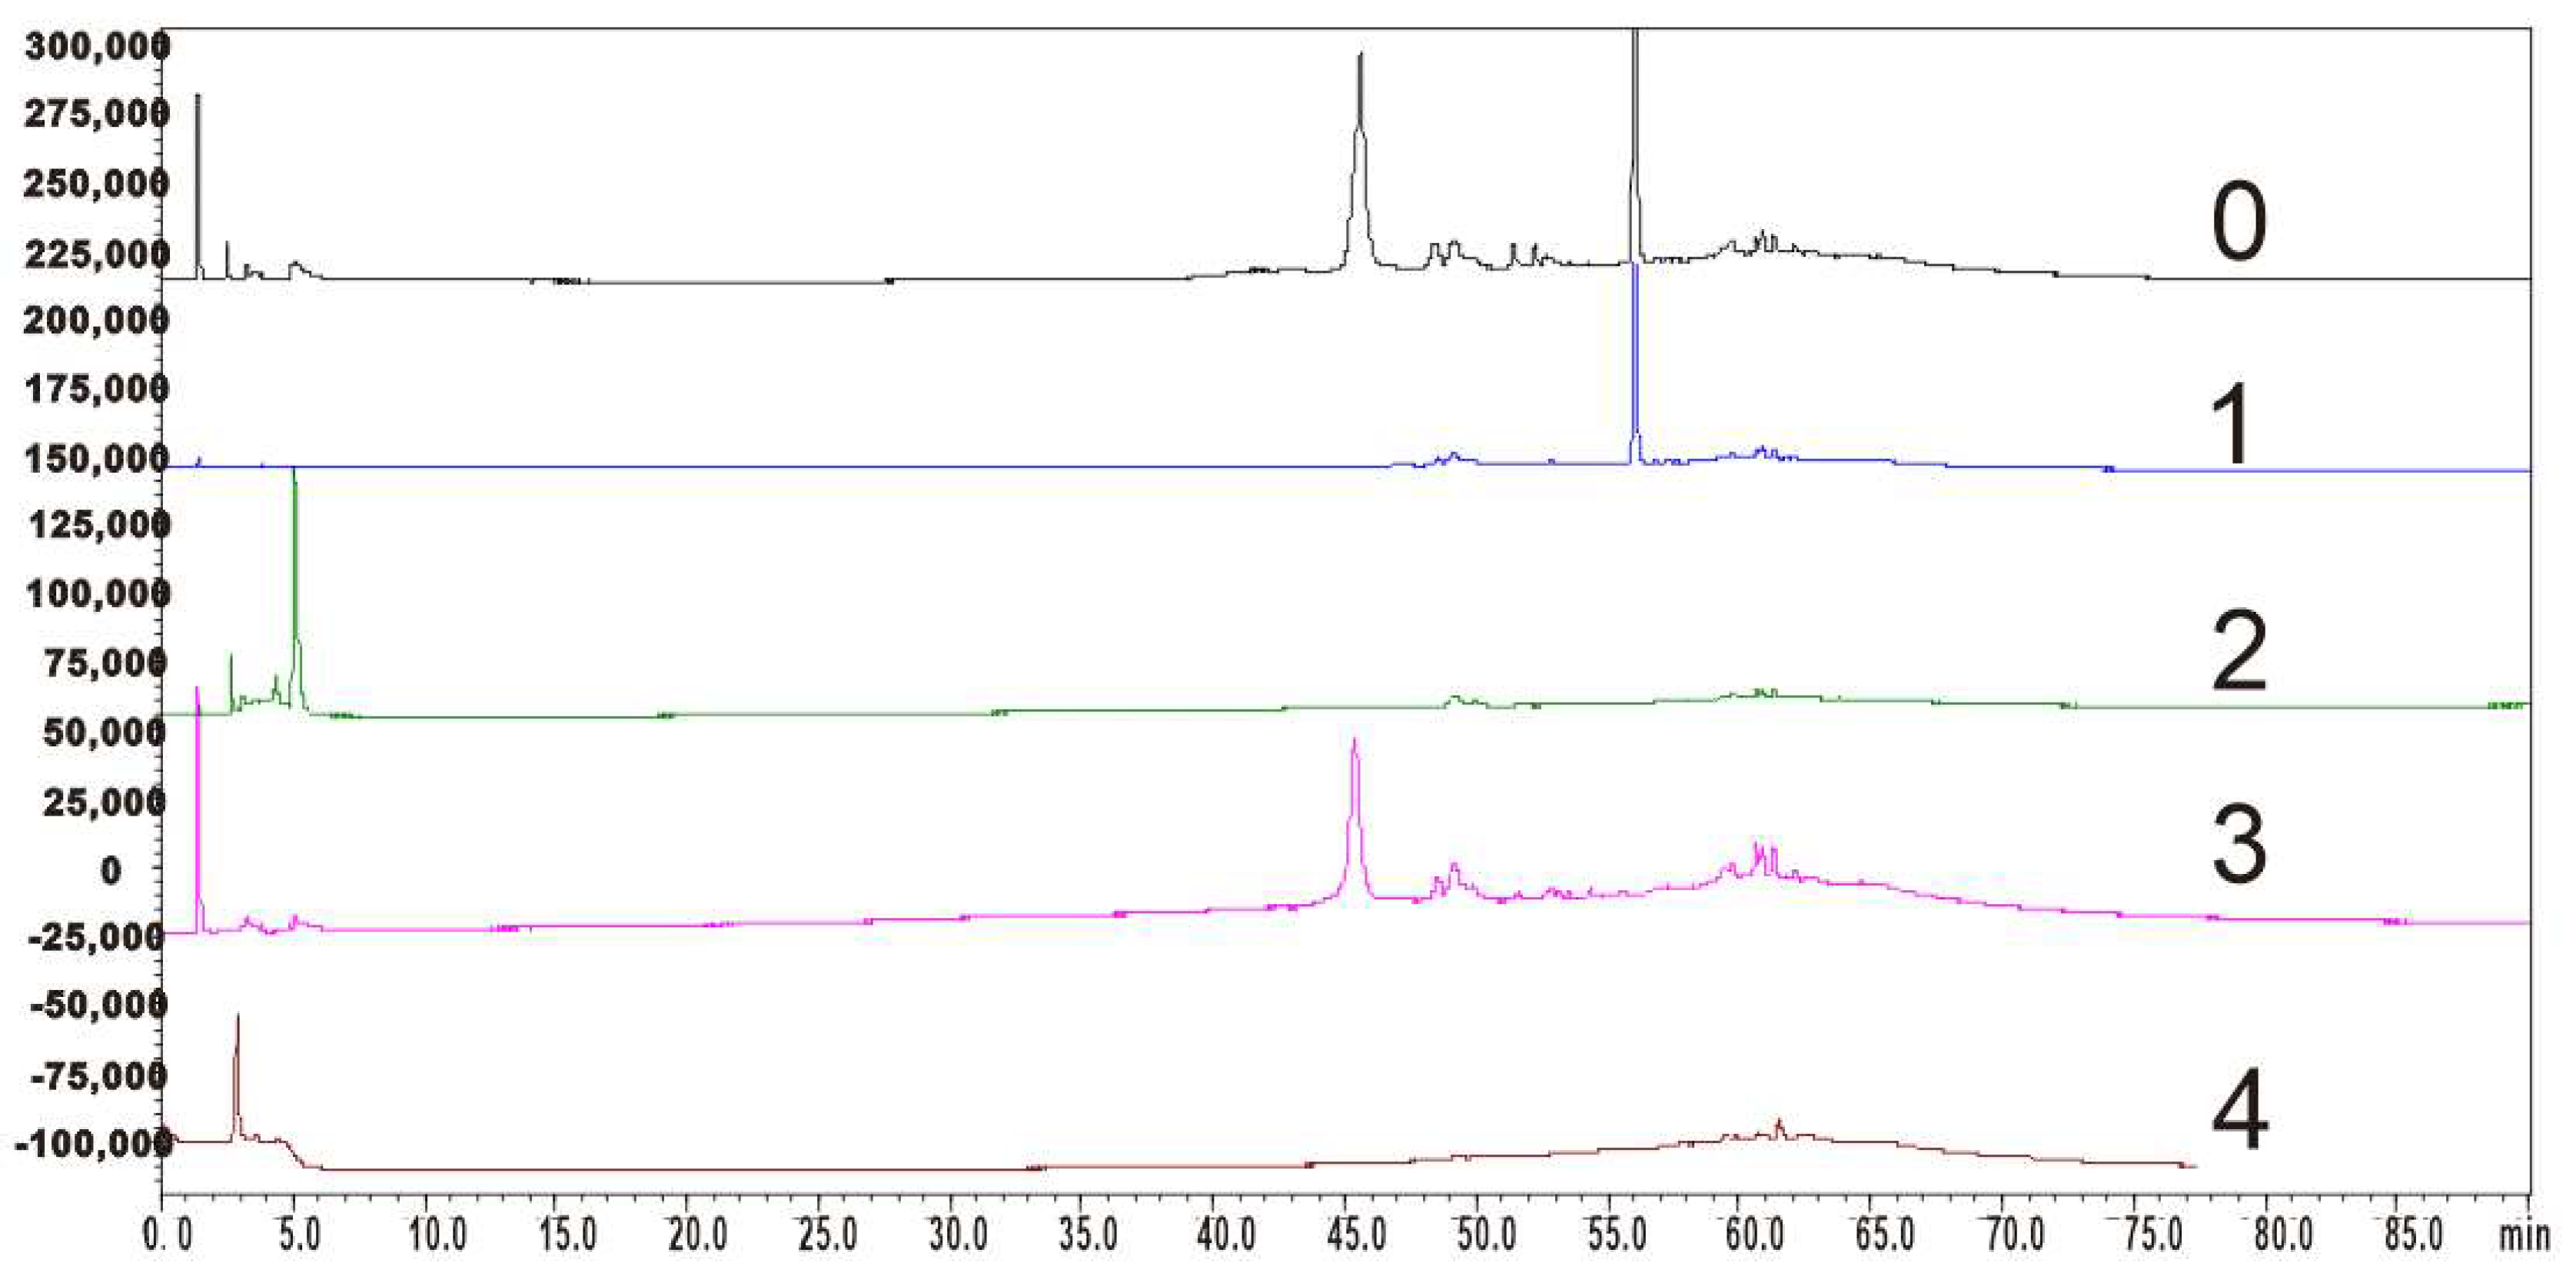
3.1. K Values in Solvent System and HSCCC Separation

Both the n-hexane-ethyl acetate-methanol-water and chloroform-methanol-water were solvent systems including a broad range of polarity solvents. The partition coefficients (K values) of the target compounds in these solvent systems were determined. The results indicated that the partition coefficient of epigallocatechin gallate (1.5) and myricetin (0.9) in the MR ethyl acetate extract was suitable in solvent systems comprising n-hexane-ethyl acetate-methanol-water (1:2.5:1:1, v/v/v/v), but these values for other compounds were not ideal.
The partition coefficients of the target compounds were further investigated in solvent systems comprising chloroform-methanol-water. As shown in Supplementary Table S1, chloroform-methanol-water (4:1:2, v/v/v) and (4:3:2, v/v/v) were not suitable for separation, because K values of myricetrin, myricetin and epigallocatechin gallate are too large, which will lead to a longer elution time. By increasing the methanol proportion, the distribution of these compounds in the upper and lower phase of the solvent systems was greatly improved. Thus, the solvent system comprising chloroform-methanol-water (10:8:3, v/v/v) was selected for separation. The HSCCC chromatogram is shown in Figure 2. Although baseline separation of compounds was not achieved, pure compounds could be obtained by collecting the eluate at the peak of the chromatogram. A quantity of 110 mg of crude extract was purified and then yielded myricetrin (collected during 115–128 min), myricetin (collected during 137–144 min), epigallocatechin gallate (collected during 193–200 min), myricanol (collected during 203–213 min), and taraxerol (collected during 246–255 min). It is worth noting that taraxerol exhibited little ultraviolet absorption due to the fact that taraxerol only contained one double bond. Therefore, no obvious resolved peak appeared during 241–250 min (Figure 2). This compound was obtained as a white amorphous powder by recrystallization and detected by using 10% alcoholic sulfuric acid after developing in toluene-ethyl acetate-formic acid (3:5:1, v/v/v, Supplementary Figure S1). In total, 52.5 mg myricetrin, 30.9 mg myricetin, 18.6 mg myricanol, 21.0 mg epigallocatechin gallate, and 17.4 mg taraxerol were obtained after repeating three times the HSCCC separation process.

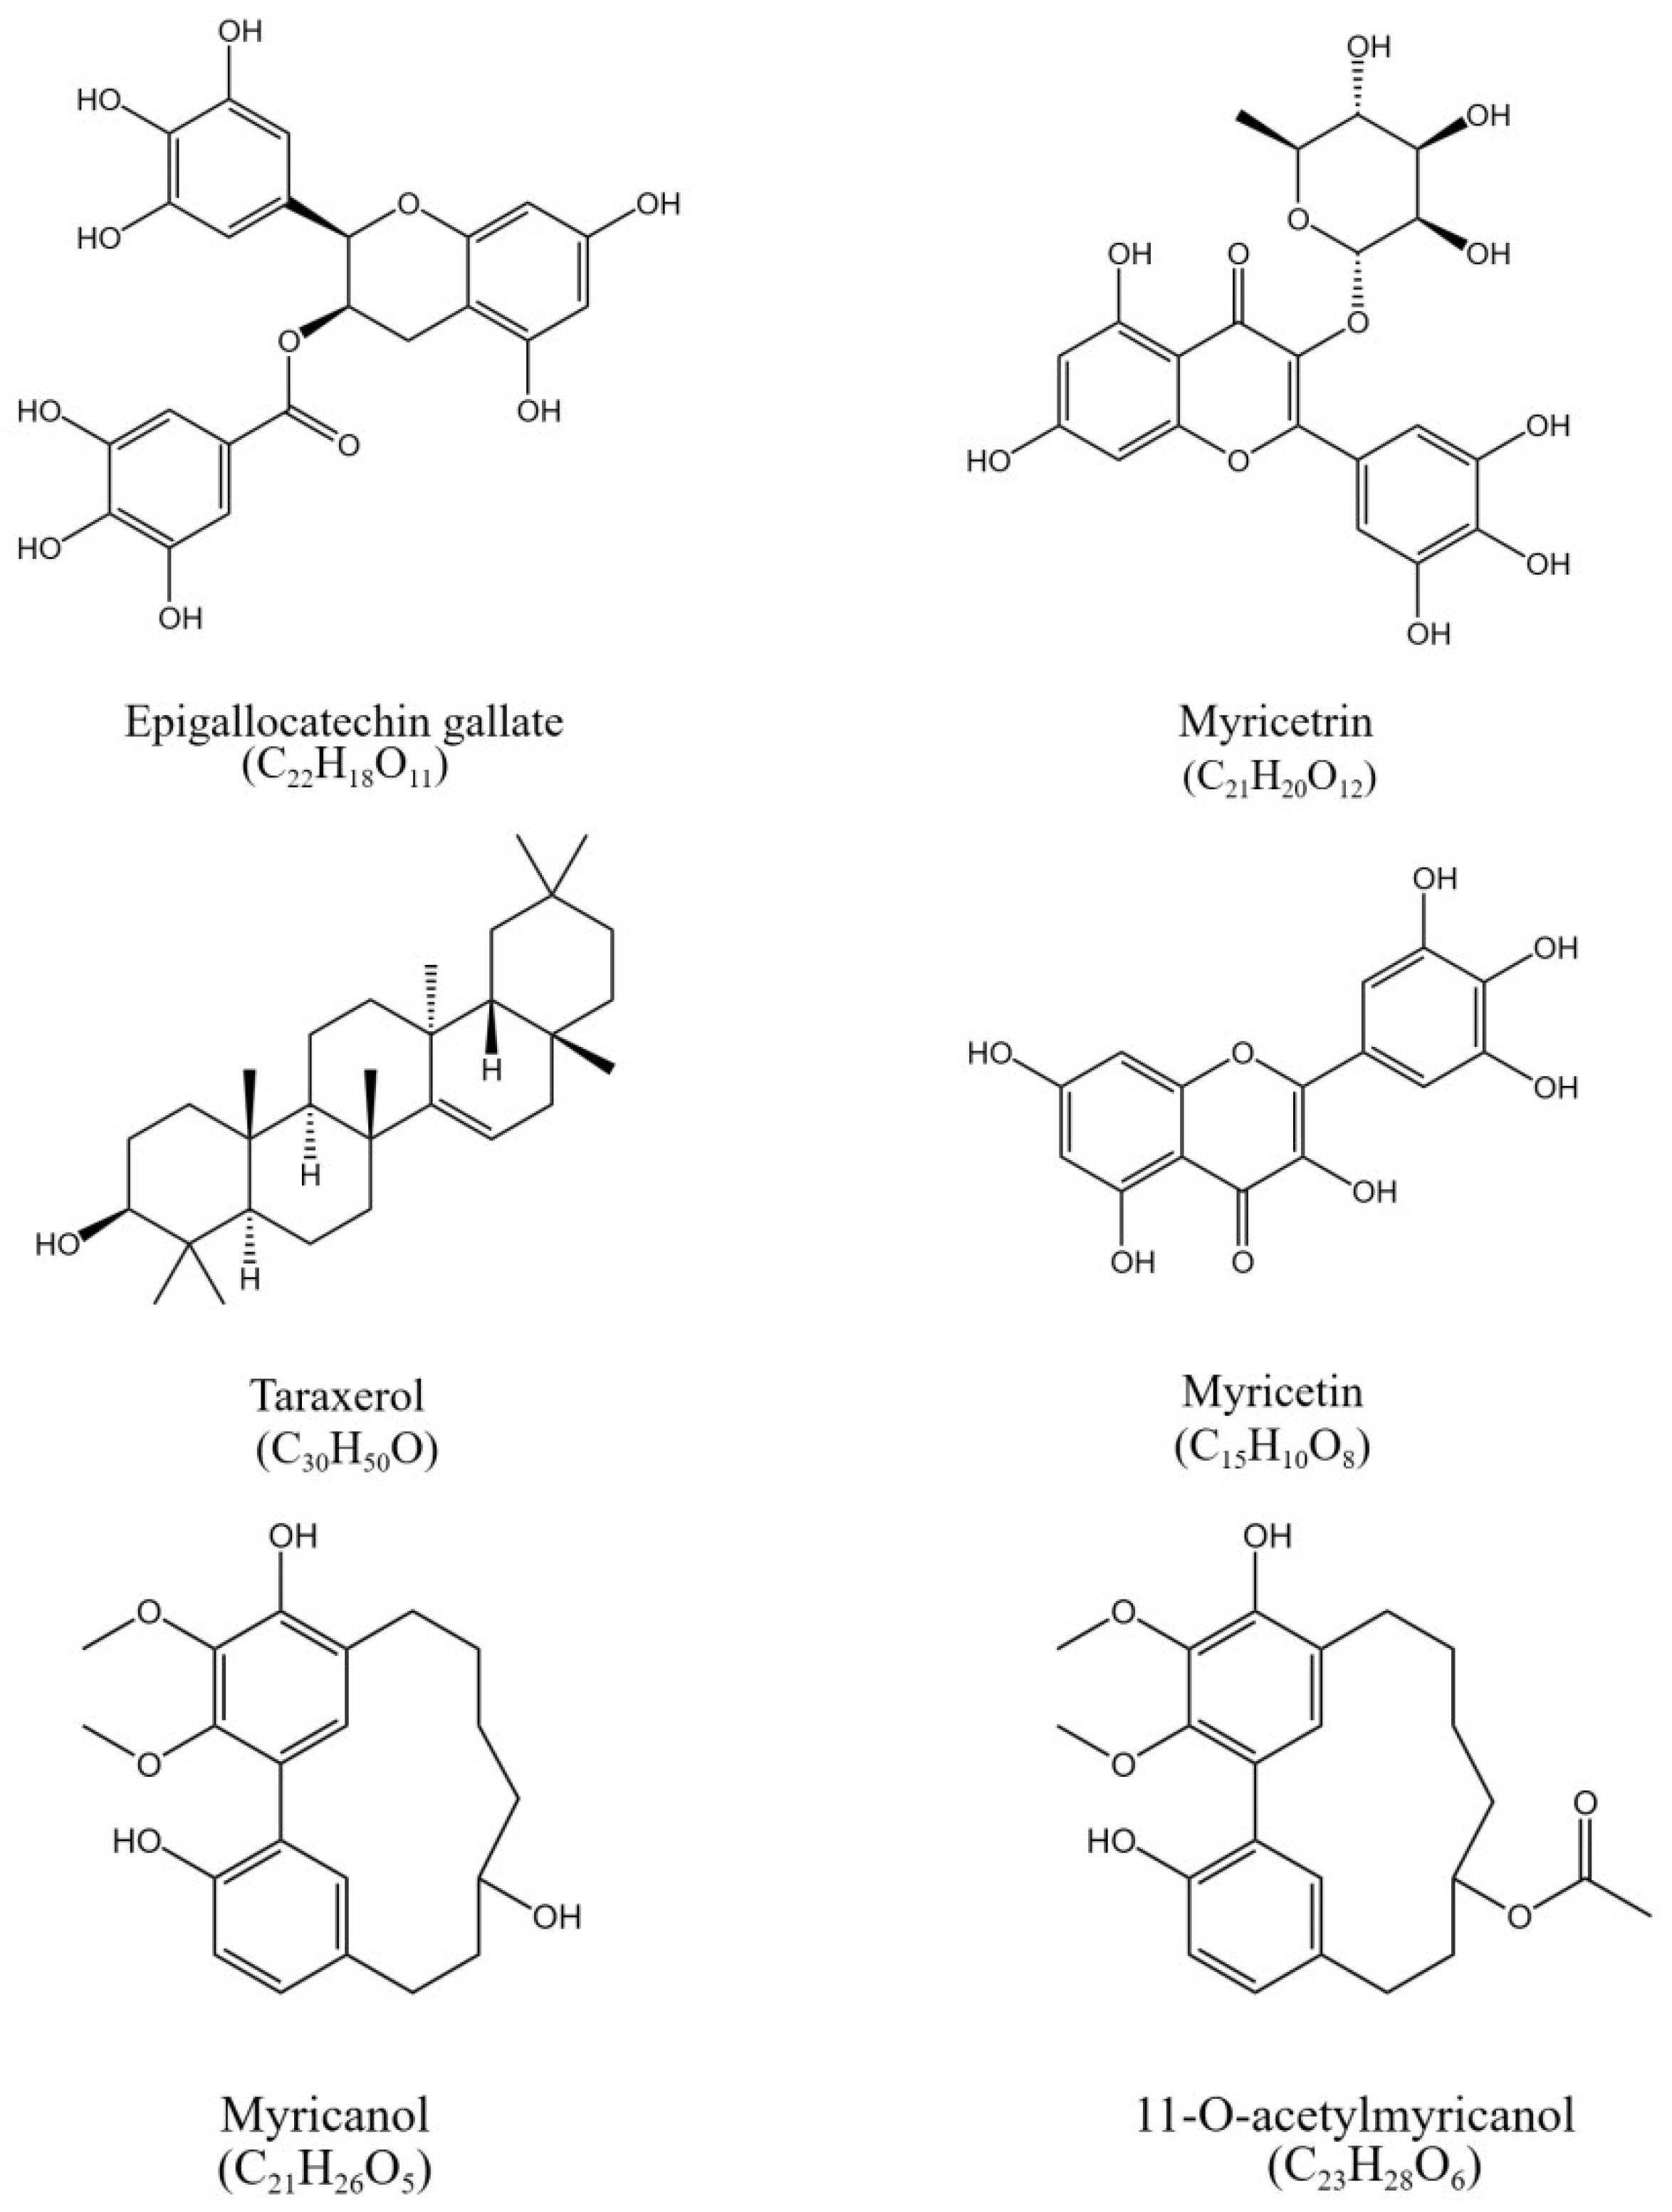
3.2. Purity and Structure Identification of HSCCC Peak Fractions

The HPLC analyses of the main compounds from MR ethyl acetate extract are shown in Figure 3. The purity of the isolated constituents was determined by calculating the peak area ratio of the corresponding compounds in all observed HPLC peak areas. The results indicated that the purities of myricanol, epigallocatechin gallate, myricetrin, and myricetin were 94.6%, 93.0%, 96.1%, and 95.3%, respectively.
The NMR data of each component are attached in the appendix. These known compounds (Figure 1) were identified as myricetrin [15], myricetin [16], myricanol [17], epigallocatechin gallate [18], and taraxerol [19] by comparison of the spectral data with the published literature. The structure of 11-O-acetylmyricanol was determined by mass spectrometry, carbon spectrum, hydrogen spectrum, COSY, HMBC, DEPT, HSQC, and NOESY (Supplementary materials). For LR-MS, m/z was 401.1[M+H]+ and m/z was 418.2[M+H3O]+, and for HR-MS, m/z was 399.1812[MH]+. The molecular formula was C23H28O6. For 1H-NMR(600 MHz, CDCL3), δppm values were 2.82 (m, 1H, C-7a), 2.58 (m, 1H, C-7b), 2.27 (m, 1H, C-8a), 1.89 (m, 1H, C-8b), 1.73 (m, 1H, C-9a), 1.56 (m, 1H, C-9b), 1.86 (m, 1H, C-10a), 1.65 (m, 1H, C-10b), 5.17 (t, J = 9.7 Hz, 1H, C-11), 2.27 (m, 1H, C-12a), 2.00 (m, 1H, C-12b), 2.89 (m, 1H, C-13a), 2.72 (m, 1H, C-13b), 7.06 (dd, J = 8.3, 2.3 Hz, 1H, C-15), 6.91 (d, J = 8.3 Hz, 1H, C-16), 7.19 (d, J = 2.3 Hz, 1H, C-18), 7.03 (s, 1H, C-19), 4.01 (s, 3H, C-20), 3.89 (s, 3H, C-21), 2.03 (s, 3H, C-23), 5.91 (s, 1H, 5-OH), and 7.69 (s, 1H, 17-OH). For 13C-NMR (150MHz, CDCL3), δppm values were 124.8 (C-1), 123.4 (C-2), 145.9 (C-3), 138.6 (C-4), 147.7 (C-5), 122.7 (C-6), 25.5 (C-7), 24.8 (C-8), 23.0 (C-9), 36.1 (C-10), 72.4 (C-11), 31.9 (C-12), 27.0 (C-13), 130.3 (C-14), 129.7 (C-15), 117.0 (C-16), 151.5 (C-17), 132.8 (C-18), 129.6 (C-19), 61.4 (C-20), 61.4 (C-21), 170.9 (C-22), and 21.4(C-23). The HMBC spectra showed 3JH-C coupling between 2.82–2.58 (m, 1H) and δ147.7 (C5), δ129.6 (C19), and δ23.0 (C9); δ2.27–1.89 (m, 1H) and δ122.7 (C6); δ5.17 (t, J = 9.7 Hz, 1H) and δ23.0 (C9), δ27.0 (C13), δ170.9 (C22); δ2.27–2.00 (m, 1H), and δ130.3 (C14); δ6.91(d, J = 8.3 Hz, 1H) and δ124.8 (C1); δ7.19 (d, J = 2.3 Hz, 1H) and δ129.7 (C15), δ123.4 (C2), and δ27.0 (C13); δ4.01 (s, 3H) and δ138.6 (C4); δ3.89 (s, 3H) and δ145.9 (C3); δ5.91 (s, 1H) and δ138.6 (C4) and δ122.7 (C6); and δ7.69 (s, 1H) and δ124.8 (C1) and δ117.0 (C16). There was 2JH-C coupling between δ5.17 (t, J = 9.7 Hz, 1H) and δ36.1 (C10); δ5.91 (s, 1H) and δ147.7 (C5); δ7.69 (s, 1H) and δ151.5 (C17); and δ2.03 (s, 3H) and δ170.9 (C22). In the HH-COSY spectrum, δ2.27–1.89 (m, 1H) and δ2.82–2.58 (m, 1H) and δ1.73–1.56 (m, 1H); δ5.17 (t, J = 9.7 Hz, 1H) and δ1.86–1.65 (m, 1H) and δ2.27–2.00 (m, 1H); δ2.89–2.72 (m, 1H) and δ2.27–2.00 (m, 1H); δ7.06 (dd, J = 8.3, 2.3 Hz, 1H) and δ6.91 (d, J = 8.3 Hz, 1H) were ortho-hydrogens of each other. In the NOESY spectrum, the spatial positions of the three hydrogens δ5.17 (t, J = 9.7 Hz, 1H), δ7.19 (d, J = 2.3 Hz, 1H), and δ7.03 (s, 1H) were close. The carbon spectrum and DEPT spectrum showed that there was one high field methyl group, two methoxy, six methylene CH2, one sp3-hybridized CH, four sp2-hybridized CH, and nine quaternary carbons containing one ester group and two benzene rings. Based on the above information, the structure of the 11-O-acetylmyricanol could be deduced.

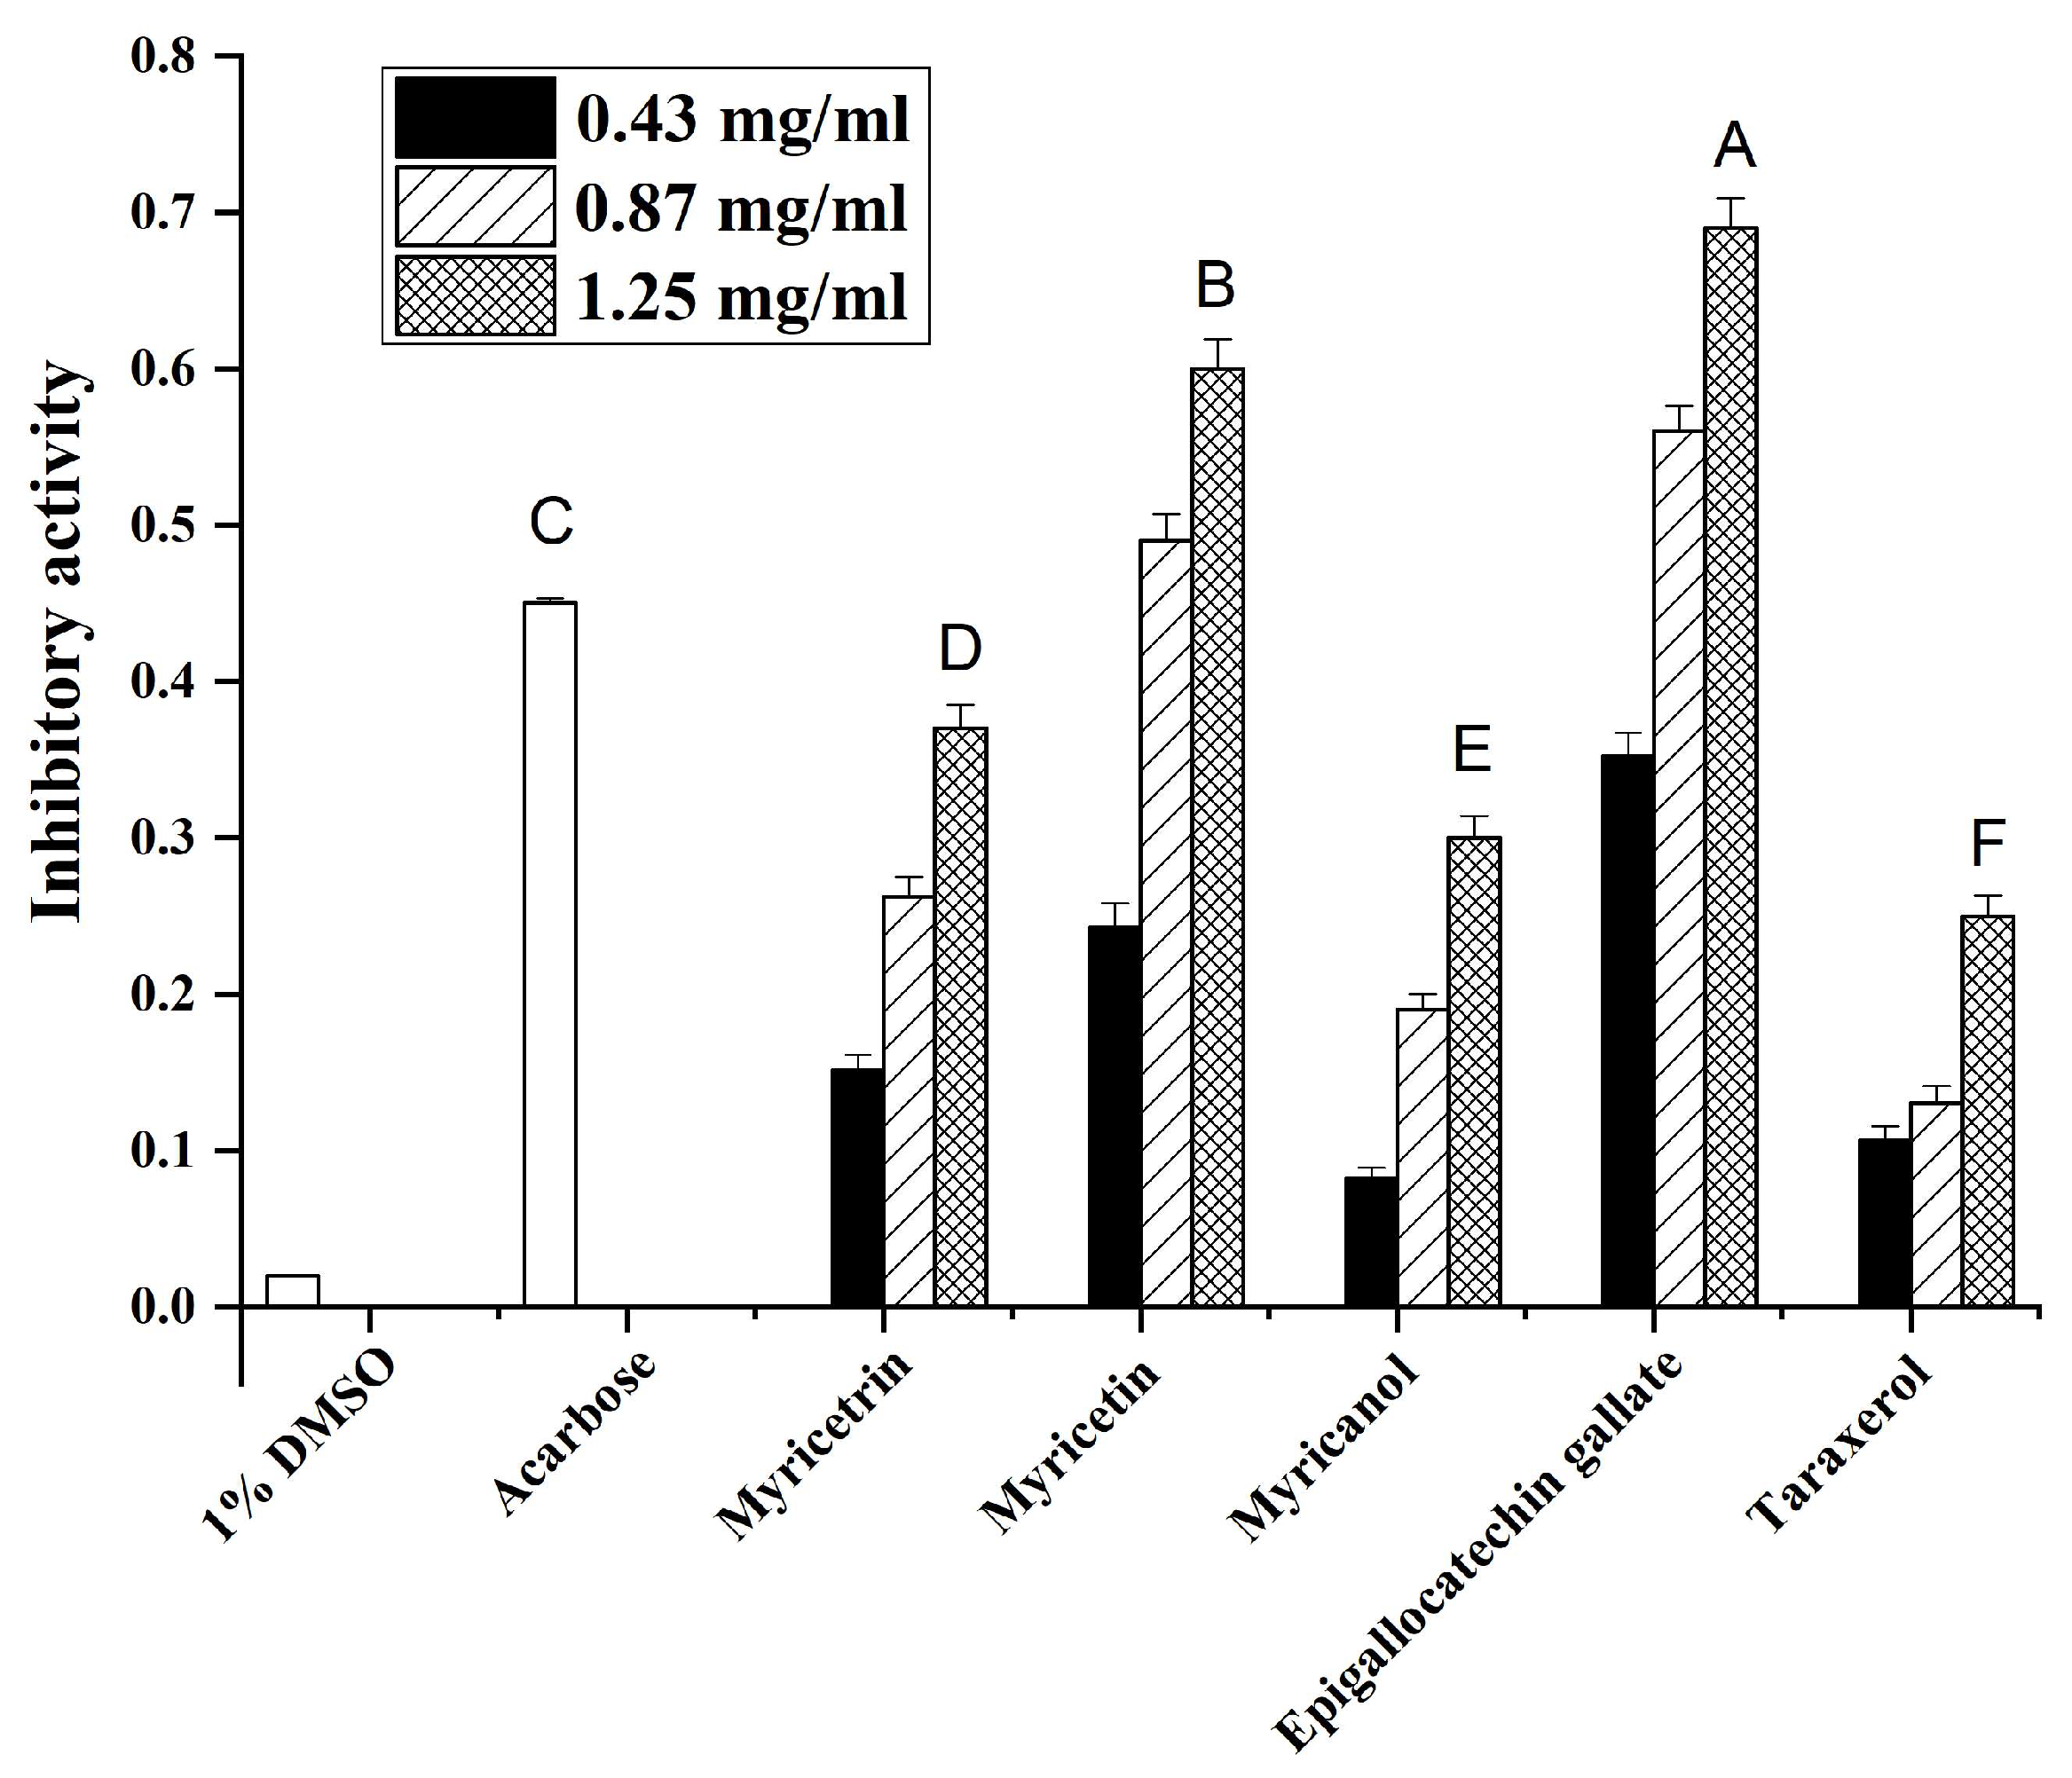
3.3. Effects of Main Compounds from Myrica rubra on α-Glucosidase Activity

It is well known that α-glucosidase inhibitors can reduce postprandial plasma glucose levels and suppress postprandial hyperglycemia [20]. To validate the antidiabetic potential of the main compounds from Myrica rubra, the impact of these compounds on α-glucosidase activity was assessed. Acarbose (0.04 mg/mL) was used as a positive control. As shown in Figure 4, 1% DMSO solution showed no inhibitory activity on α-glucosidase, while various extracts, with a final concentration ranging from 0.43–1.25 mg/mL, dose-dependently inhibited α-glucosidase activity to a different extent. Among the tested samples, epigallocatechin gallate showed the highest α-glucosidase inhibitory activity, followed by myricetin, myricetrin, myricanol, and taraxerol. These data indicated that the main compounds from Myrica rubra may exert beneficial effects on plasma glucose levels in diabetes patients.

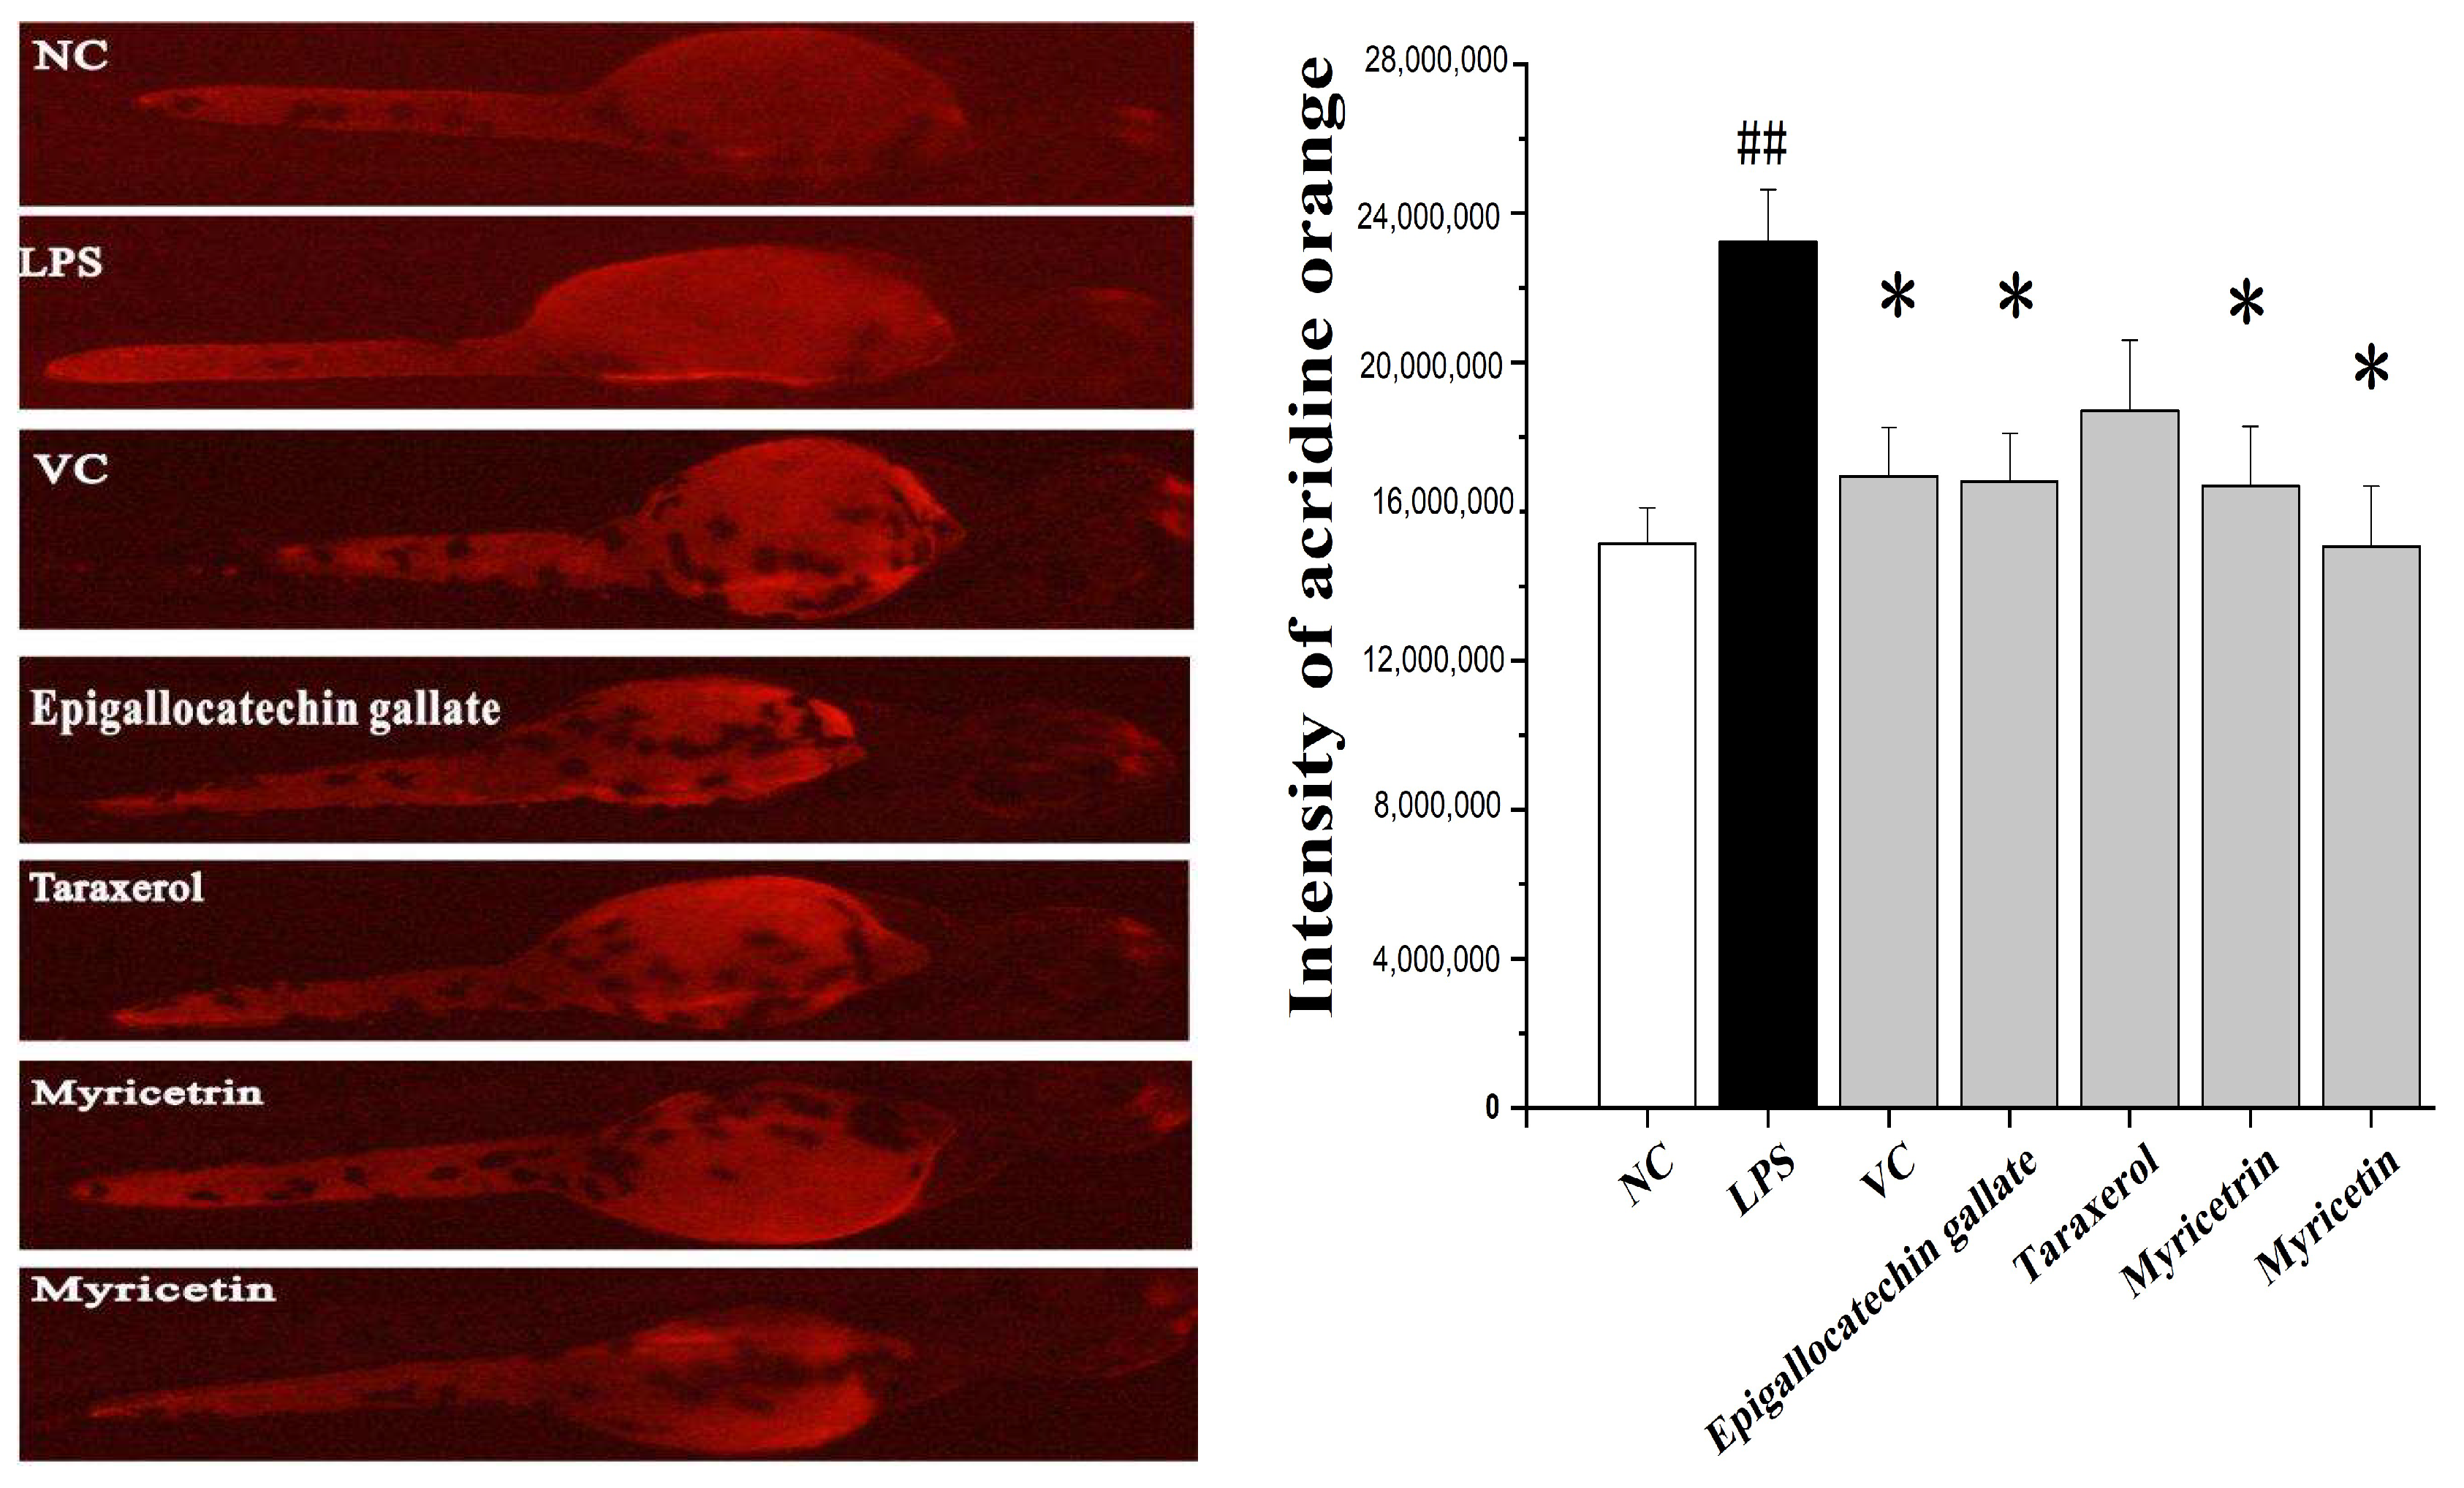
3.4. Reactive Oxygen Species Scavenging Activity in Zebrafish Embryos

Acridine orange is a nucleic acid-selective fluorescent cationic dye and can be used to identify engulfed apoptotic cells. The lipopolysaccharides (LPS) are endotoxins commonly found in the outer membrane of Gram-negative bacteria that cause metabolic endotoxemia. Systemic exposure to LPS produces a variety of effects, including the initiation of cellular reactive oxygen species stress response and the secretion of pro-inflammatory cytokines [21]. In this study, LPS-induced cell death was detected in live embryos using acridine orange staining. The scavenging efficacy of myricetrin, myricetin, epigallocatechin gallate, and taraxerol on ROS production in LPS-induced zebrafish embryos was measured. As shown in Figure 5, the treatment of the embryo with LPS increased ROS production and resulted in cell death in live embryos, and the fluorescence intensity of the LPS group was 53.5% higher than that in normal control (NC) group, whereas a dramatic reduction in the amount of ROS was observed in all therapy groups. Specifically, the addition of MR compounds to the embryo mixed with LPS reduced 27.7%, 29.9%, 38.7%, and 48.6% for epigallocatechin gallate, taraxerol, myricetrin, and myricetin, respectively. Therefore, these results demonstrated that MR compounds possessed efficient antioxidant properties.

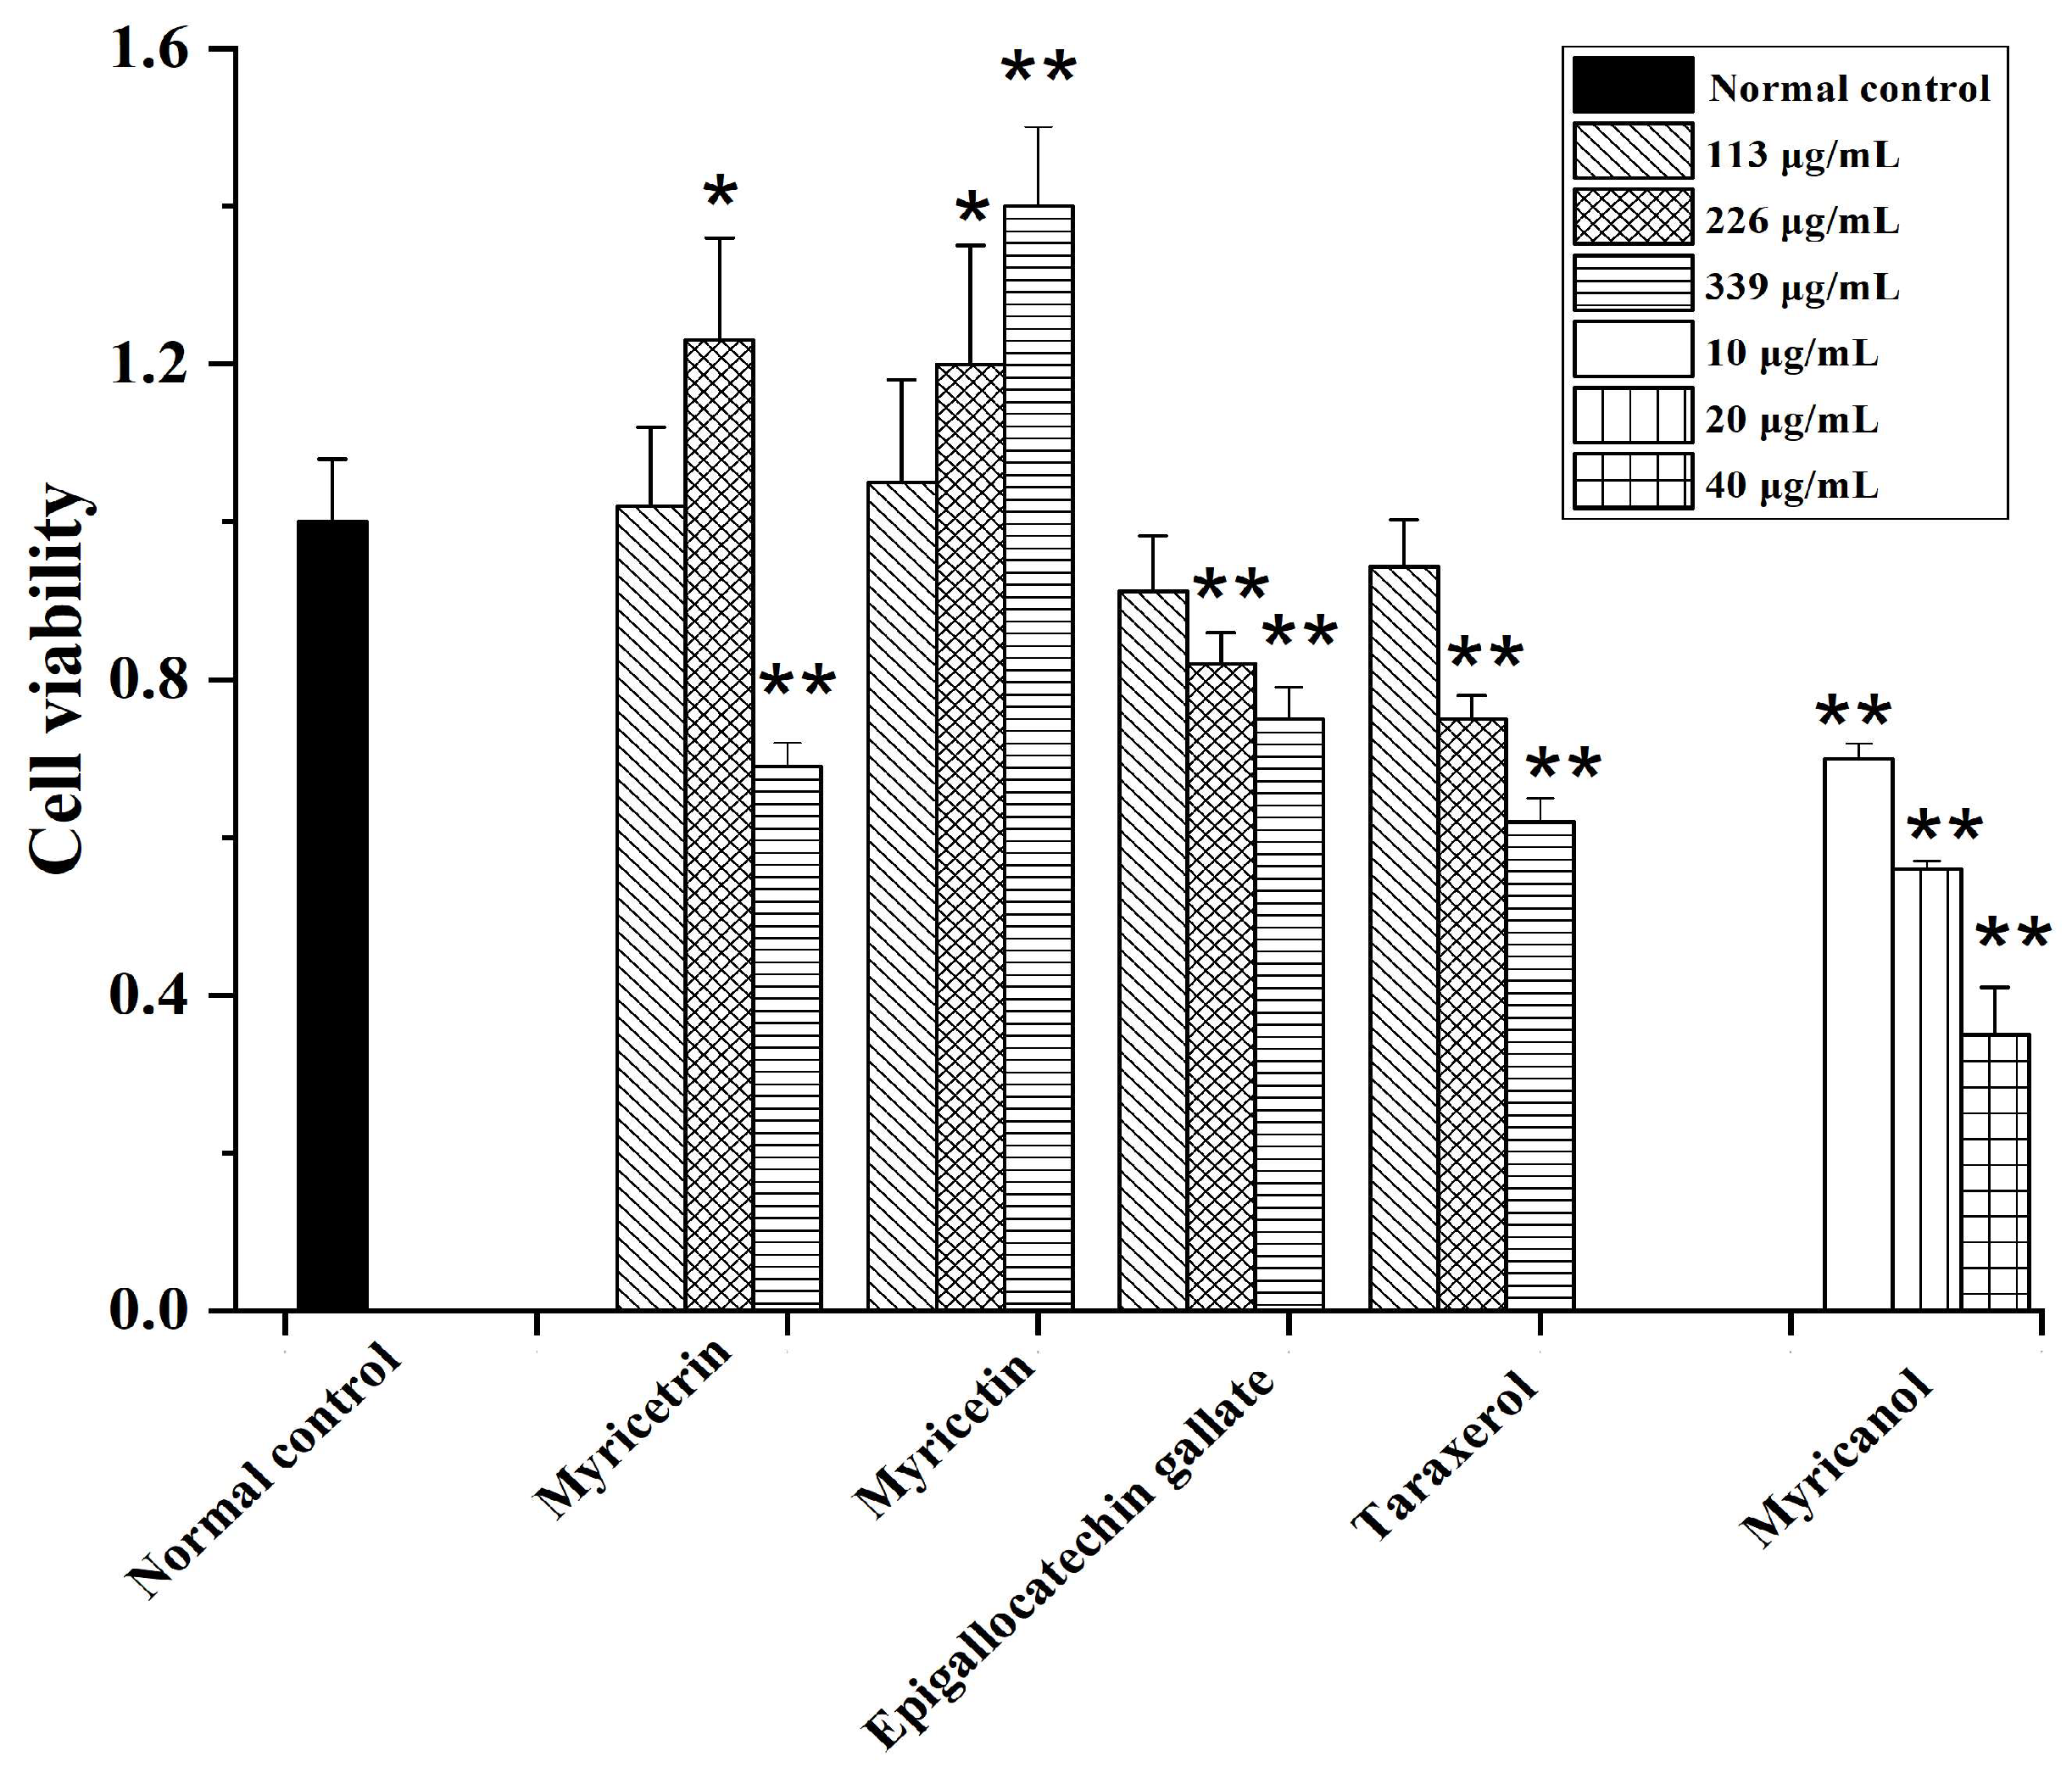
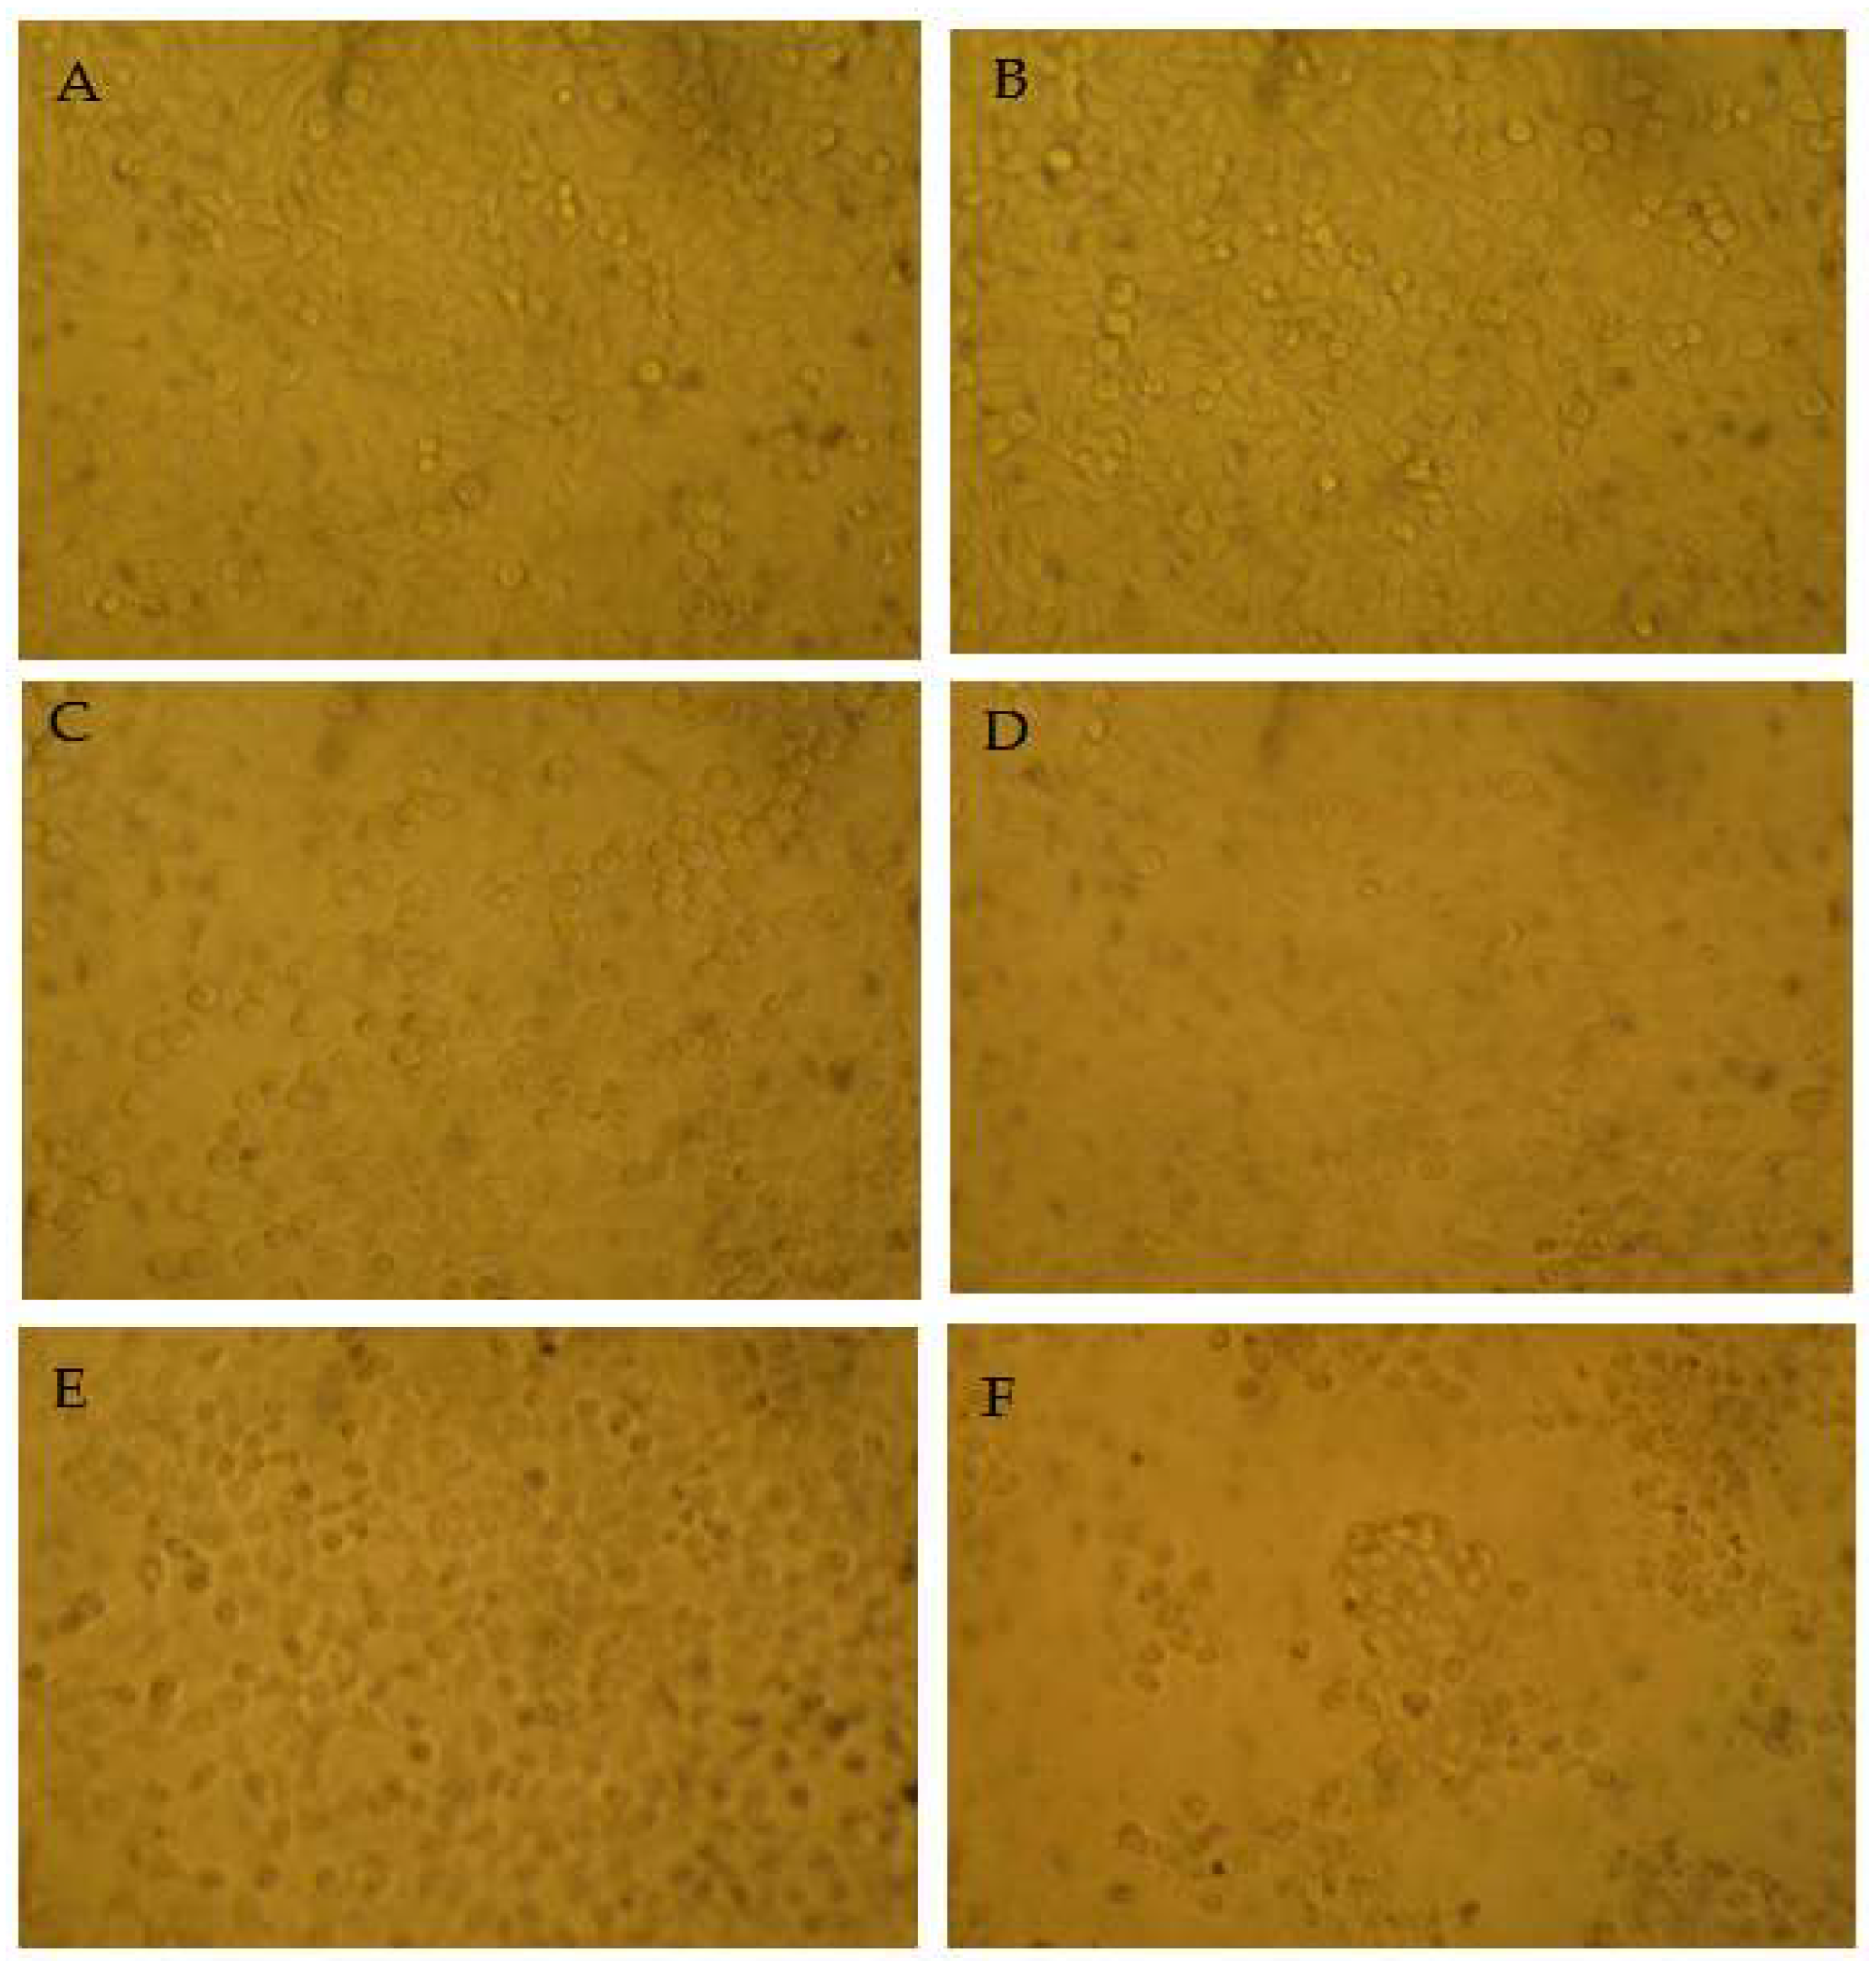
3.5. Apoptosis-Inducing Activities of Main Compounds from Myrica rubra on HepG2 Cells

The MTT results indicated that among the tested samples, myricetin showed no cytotoxicity against HepG2 cells. The cytotoxicity of epigallocatechin gallate and taraxerol was increased dose dependently. The cell viability only decreased after high-dose myricetrin treatment. Intriguingly, myricanol showed strong apoptosis-inducing activity on HepG2 cells, with an IC50 (half-maximal inhibitory concentration) of 28 µg/mL (Figure 6). Thus, the apoptosis-inducing activities of myricanol on HepG2 cells were also investigated using a microscope. As shown in Figure 7, most cells could maintain a spindle morphology in the normal and 1% DMSO group, which meant they had a good physiological state. After being treated with myricanol in the range of 10–30 µg/mL, the shape of the cells transformed from spindle to a spherical morphology, compared with the control sample. The increased detachment of cells was observed in Figure 7D (myricanol at 15 µg/mL). In Figure 7F (myricanol at 30 µg/ mL), one can see that the cells were aggregated, which was caused by the damage and then the death of cells. These results were consistent with the above-discussed cell viability measured by the MTT assay.

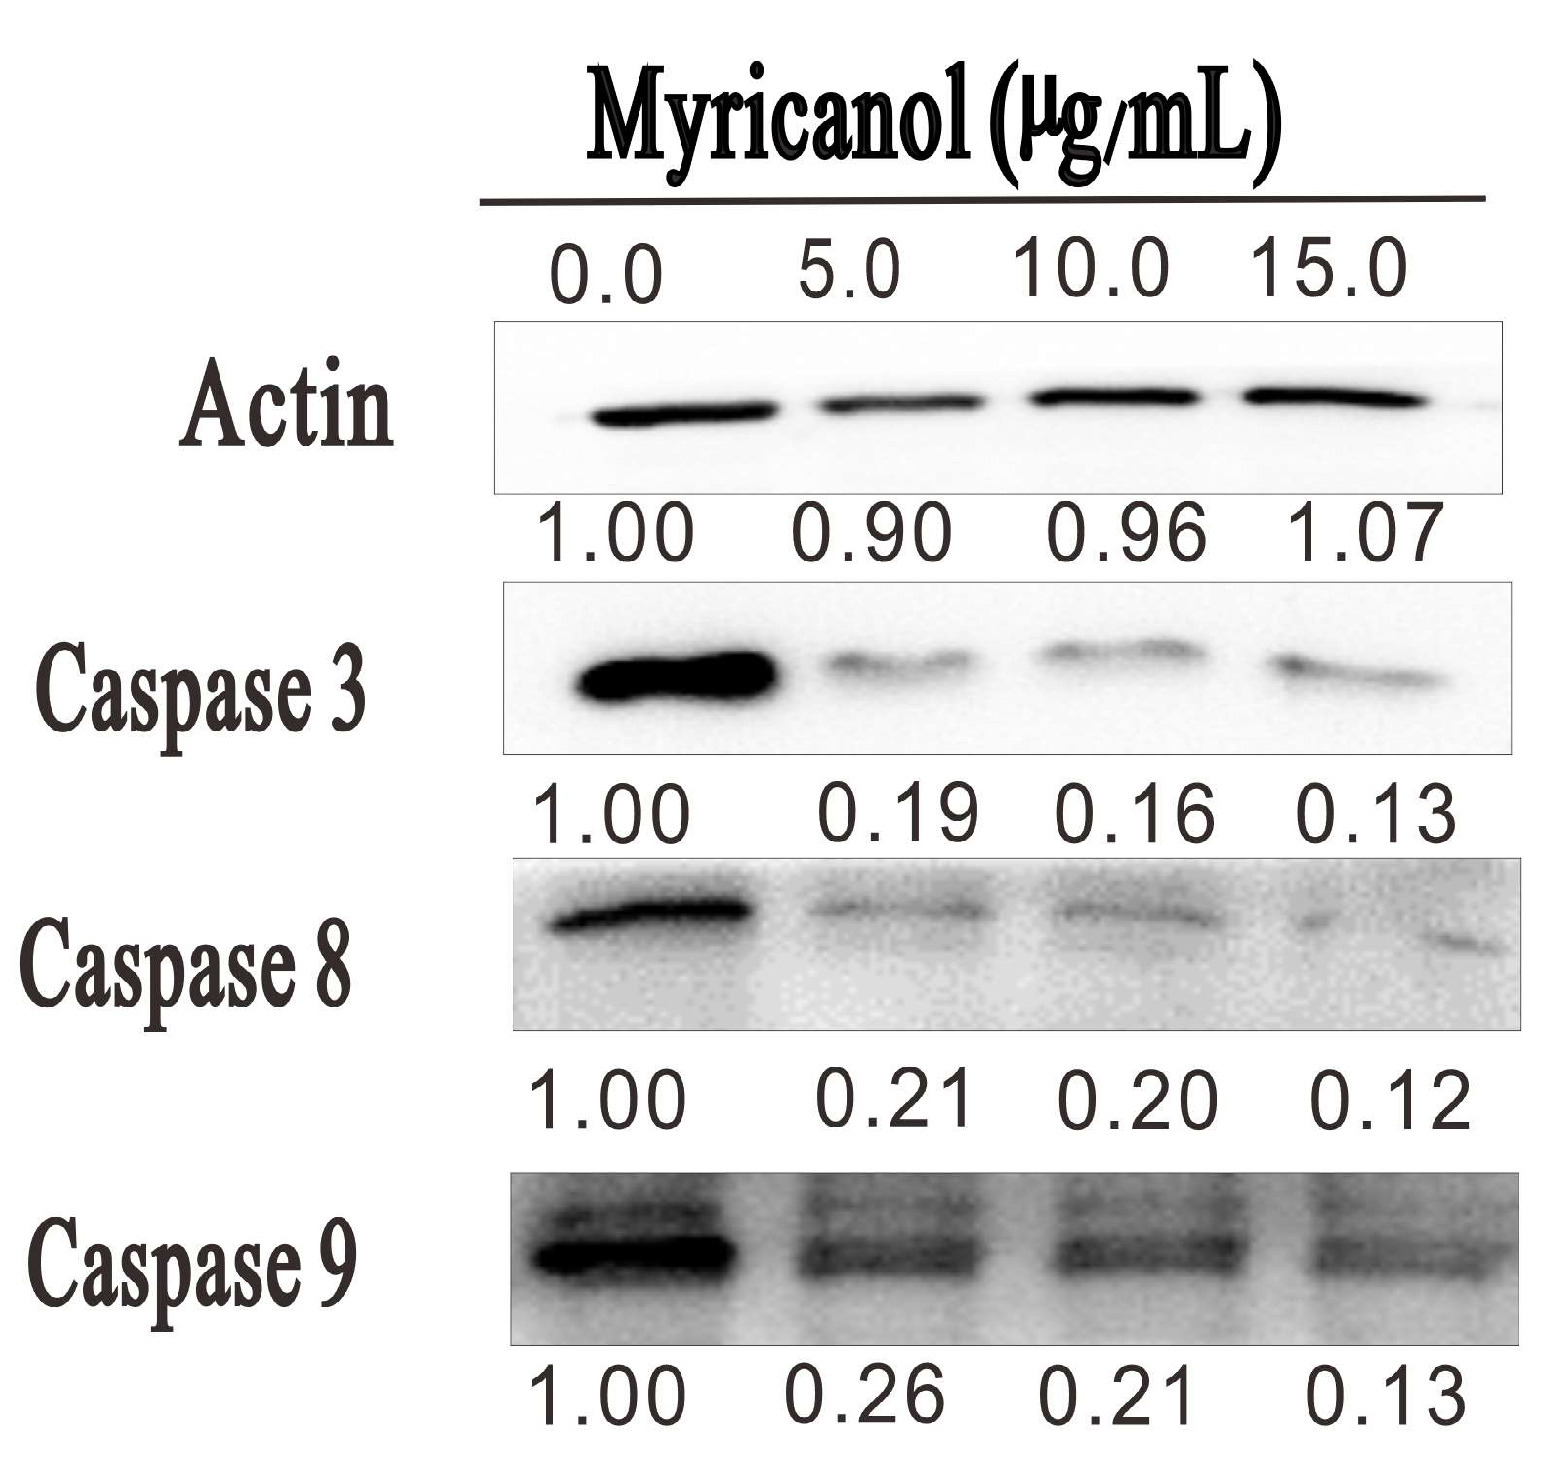
3.6. Myricanol Triggered Caspase-Dependent Apoptosis in HepG2 Cells

To elucidate the potential molecular mechanisms leading to the myricanol-induced apoptosis, we evaluated whether caspase families were involved in the apoptosis of HepG2 cells. As shown in Figure 8, myricanol treatment dose-dependently reduced the expression levels of caspase 3, caspase 8, and caspase 9. Among them, the expression of caspase 3 was dramatically reduced after myricanol treatment. In addition, caspase 8 and caspase 9 were also decreased after 20 h incubation. At the concentration of 15 µg/mL, the expression of caspase 3, caspase 8, and caspase 9 was decreased by 90%, 89%, and 83% after myricanol treatment, respectively. Even at the low concentration of 5 µg/mL, the myricanol treatment reduced caspase 3, caspase 8, and caspase 9 expression by 81%, 79%, and 74%, respectively. Previous study demonstrated that during apoptosis, the caspases cleave at the interdomain, and this cleavage allows the active-site loops to form a conformation favorable for enzymatic activity [22]. These results indicated that myricanol is capable of promoting the cleavage of caspase 3, caspase 8, and caspase 9, which results in the apoptosis of HepG2 cells.

4. Discussion

The Myrica rubra fruits’ unique sweet and sour taste, exquisite flavor, and attractive color make them one of the most popular fruits to the local people. Apart from the fruits, other parts of Myrica rubra have been historically used as folk medicines. Various purification technologies have also been applied to obtain the bioactive compounds from Myrica rubra. Currently, the compounds in Myrica rubra peel are mainly purified by solid support matrix chromatographies, which is time-consuming and has high costs [11]. Since the US Food and Drug Administration allowed for health claim labels on flavonoids including myricetin, quercetin, kaempferol, etc. [23], the demand for these compounds was substantially increased. In this study, HSCCC was applied for the separation of epigallocatechin gallate, myricetrin, myricetin, taraxerol, and myricanol in the bark of Myrica rubra. The antioxidant, antidiabetic, and apoptosis-inducing activities of these compounds were further investigated. The results suggested that epigallocatechin gallate showed the highest α-glucosidase inhibitory activity, while myricetin exhibited the highest ROS scavenging ability. α-glucosidase inhibitors play vital role in reducing postprandial plasma glucose levels and suppressing postprandial hyperglycemia [20]. In addition, there is a large body of evidence demonstrating the involvement of oxidant stress in the development of diabetes mellitus [24]. The neutralization of reactive molecules can significantly inhibit the development of endothelial dysfunction, retinopathy, cardiomyopathy, nephropathy, and neuropathy in diabetic patients [25]. It is demonstrated that epigallocatechin gallate can spontaneously interact with and then inhibit α-glucosidase via hydrogen bonding and hydrophobic interactions [26]. In this study, epigallocatechin gallate, myricetin, and myricitrin exhibited strong α-glucosidase inhibitory activity. Moreover, myricetrin and myricetin showed excellent ROS scavenging ability. Similarly, Chang et al. found that myricitrin, cyanidin-O-glucoside, hyperoside, and quercitrin in the pomace of Myrica rubra have good antioxidant and α-glucosidase inhibition abilities, and myricitrin showed the highest α-glucosidase inhibitory activity among the four compounds [27]. The phenolics of Myrica rubra exert anti-glycative actions by scavenging free radicals, trapping reactive α-dicarbonyls, inactivating transition metals, and interacting with glycation-related proteins [28]. Therefore, administration of epigallocatechin gallate, myricetin, and myricitrin can exert beneficial effects in diabetes patients.
The cell assay revealed that myricetin showed no cytotoxicity against HepG2 cells. It was demonstrated that administration of myricetin afforded remarkable protective effects against streptozotocin and cadmium-induced lipid metabolism alterations in diabetic nephrotoxic rats [29]. Moreover, myricetin might serve as a potential anti-angiogenic agent in the prevention of various cancers [30]. These studies revealed that myricetin can be used for the prevention of cardiovascular diseases and cancer. In contrast, myricanol showed the strongest apoptosis-inducing activity among the five pure compounds. Recent studies have revealed that myricanol has anti-tumor, anti-atherosclerosis, and lipids-lowering activities [31]. For instance, myricanol reduced lipid accumulation in high-fat diet-fed zebrafish via activating adenosine 5′-monophosphate-activated protein kinase and inhibiting peroxisome proliferation-activated receptor γ(PPARγ) [32]. In high-fat diet (HFD)-fed mice, myricanol enhanced lipid utilization, irisin production, and browning of inguinal fat [33]. Fan et al. have shown that myricanol inhibited the proliferation and migration of vascular smooth muscle cells by inducing the phosphorylation of platelet-derived growth factor receptor-β and its downstream Src and mitogen-activated protein kinases [31]. In this study, we noticed that myricanol was capable of promoting the cleavage of caspase 3, caspase 8, and caspase 9, then resulting in the apoptosis in HepG2 cells. The caspases have long been considered as the pivotal executioner of all programmed cell death [34]. Although the underlying mechanism of the activation of the caspase family remains to be investigated in further studies, the results of the present study provide fundamental information for using myricanol for various cancer therapies. The drawback of this study was that we failed to evaluate the pharmacological activities of 11-O-acetylmyricanol because of the limited amount of this compound. As myricanol analogues, the bio-activities of the discovered 11-O-acetylmyricanol in this study also deserve further investigation.

5. Conclusions

In this study, a silica column and HSCCC were used for the separation of the main compounds in the crude extract of Myrica rubra. Five main compounds including epigallocatechin gallate, myricetrin, myricetin, taraxerol, and myricanol were obtained by one-step HSCCC separation using chloroform-methanol-water (10:8:3, v/v/v) as the solvent system. Notably, for the first time, 11-O-acetylmyricanol was separated from Myrica rubra bark. The bioactivity studies suggested that epigallocatechin gallate showed the highest α-glucosidase inhibitory activity, while myricetin exhibited the highest ROS scavenging ability. Intriguingly, myricanol stimulated caspase 3, 8, and 9 cleavage and exhibited strong apoptosis-inducing activity. These results provide credence to the ethnomedicinal application of the isolated compounds against cardiovascular disease and cancer.

Supplementary Materials

The following supporting information can be downloaded at https://www.mdpi.com/article/10.3390/separations11010004/s1: Figure S1: Thin-layer chromatography detection of taraxerol; Figures S2–S10: Spectra of separated compounds in Myrica rubra bark; Table S1: The partition coefficient (K values) of Myrica rubra main compounds in chloroform-methanol-water solvent systems.

Author Contributions

Conceptualization, K.H.; data curation, L.F.; formal analysis, Y.C.; funding acquisition, K.H.; investigation, T.H., Y.C. and H.Y.; software, T.H.; supervision, K.H.; validation, L.F. and H.Y.; writing—original draft, K.H. All authors have read and agreed to the published version of the manuscript.

Funding

This work was financially supported by Scientific Research Fund of Hunan Provincial Health Commissions (D202302048376), Natural Science Foundation of Hunan Province (2023JJ50436).

Institutional Review Board Statement

Not applicable.

Informed Consent Statement

Not applicable.

Data Availability Statement

Data are contained within the article or Supplementary Materials.

Acknowledgments

The authors thank Xuegang Li of Southwest University for technical assistance.

Conflicts of Interest

The authors declare no conflict of interest.

References

  1. Ren, H.; He, Y.; Qi, X.; Zheng, X.; Zhang, S.; Yu, Z.; Hu, F. The bayberry database: A multiomic database for Myrica rubra, an important fruit tree with medicinal value. BMC Plant Biol. 2021, 21, 452. [Google Scholar] [CrossRef]
  2. Cheng, H.; Chen, Y.; Chen, Y.; Qin, D.; Ye, X.; Chen, J. Comparison and evaluation of aroma-active compounds for different squeezed Chinese bayberry (Myrica rubra) juices. J. Food Process. Preserv. 2021, 45, e15924. [Google Scholar] [CrossRef]
  3. Xia, W.; Gong, E.; Lin, Y.; Li, T.; Lian, F.; Zheng, B.; Liu, R.H. Comparison of phytochemical profiles, antioxidant and antiproliferative activities in Chinese bayberry (Myrica rubra Sieb. et Zucc.) fruits. J. Food Sci. 2021, 86, 4691–4703. [Google Scholar] [CrossRef]
  4. Liu, Z.; Zhang, J.; Lu, S.; Tang, W.; Zhou, Y.; Quek, S.Y. Effects of different drying methods on phenolic components and in vitro hypoglycemic activities of pulp extracts from two Chinese bayberry (Myrica rubra Sieb. et Zucc.) cultivars. Food Sci. Hum. Wellness 2022, 11, 366–373. [Google Scholar] [CrossRef]
  5. Tao, J.; Morikawa, T.; Toguchida, I.; Ando, S.; Matsuda, H.; Yoshikawa, M. Inhibitors of nitric oxide production from the bark of Myrica rubra: Structures of new biphenyl type diarylheptanoid glycosides and taraxerane type triterpene. Bioorgan. Med. Chem. 2002, 10, 4005–4012. [Google Scholar] [CrossRef]
  6. Wang, M.; Liu, Y.; Pan, R.L.; Wang, R.Y.; Ding, S.L.; Dong, W.R.; Sun, G.B.; Ye, J.X.; Sun, X.B. Protective effects of Myrica rubra flavonoids against hypoxia/reoxygenation-induced cardiomyocyte injury via the regulation of the PI3K/Akt/GSK3β pathway. Int. J. Mol. Med. 2019, 43, 2133–2143. [Google Scholar] [CrossRef]
  7. Yu, H.; Fan, Z.F.; Xu, J.N.; Lv, X.K. Anti-inflammatory and analgesic effect of Wujiapi and Yangmeishupi Compound Preparations on animals. J. North China Univ. Sci. Technol. 2021, 23, 444–449. [Google Scholar]
  8. Li, Z.; Shi, W.; Cheng, L.; Pan, S.; Wang, C. Screening of the phenolic profile and their antioxidative activities of methanol extracts of Myrica rubra fruits, leaves and bark. J. Food Meas. Charact. 2018, 12, 128–134. [Google Scholar] [CrossRef]
  9. Shen, S.; Zhao, M.; Li, C.; Chang, Q.; Liu, X.; Liao, Y.; Pan, R. Study on the material basis of neuroprotection of Myrica rubra bark. Molecules 2019, 24, 2993. [Google Scholar] [CrossRef]
  10. Wang, D.Y.; Liu, E.-G. A new diaryheptanoid from the bark of Myrica rubra. Nat. Prod. Res. 2008, 22, 292–295. [Google Scholar] [CrossRef]
  11. Wang, C.; Zhao, J.; Chen, F.; Cheng, Y.; Guo, A. Separation, Identification, and Quantitation of Phenolic Acids in Chinese Waxberry (Myrica rubra) Juice by HPLC-PDA-ESI-MS. J. Food Sci. 2012, 77, C272–C277. [Google Scholar] [CrossRef] [PubMed]
  12. Li, L.; Zhao, J.; Yang, T.; Sun, B. High-speed countercurrent chromatography as an efficient technique for large separation of plant polyphenols: A review. Food. Res. Int. 2022, 153, 110956. [Google Scholar] [CrossRef] [PubMed]
  13. He, K.; Ye, X.; Li, X.; Chen, H.; Yuan, L.; Deng, Y.; Chen, X.; Li, X. Separation of two constituents from purple sweet potato by combination of silica gel column and high-speed counter-current chromatography. J. Chromatogr. B 2012, 881, 49–54. [Google Scholar] [CrossRef] [PubMed]
  14. He, K.; Li, X.; Chen, X.; Ye, X.; Huang, J.; Jin, Y.; Li, P.; Deng, Y.; Jin, Q.; Shi, Q. Evaluation of antidiabetic potential of selected traditional Chinese medicines in STZ-induced diabetic mice. J. Ethnopharmacol. 2011, 137, 1135–1142. [Google Scholar] [CrossRef] [PubMed]
  15. Tao, H.; Zhou, Y.; Yin, X.; Wei, X.; Zhou, Y. Two New Phenolic Glycosides with Lactone Structural Units from Leaves of Ardisia crenata Sims with Antibacterial and Anti-Inflammatory Activities. Molecules 2022, 27, 4903. [Google Scholar] [CrossRef] [PubMed]
  16. Xin, M.; Ma, Y.; Lin, W.; Xu, K.; Chen, M. Study on the structure–activity of dihydromyricetin and its new production: Myricetin by using ESR and spectroscopic techniques. J. Therm. Anal. Calorim. 2014, 116, 241–248. [Google Scholar] [CrossRef]
  17. Kawai, S.; Nakata, K.; Ohashi, M.; Nishida, T. Myricanol and myricanone biosynthesis in Myrica rubra: Incorporation of two molecules of 4-coumaric acid. J. Wood Sci. 2008, 54, 256–260. [Google Scholar] [CrossRef]
  18. Peres, I.; Rocha, S.; do Carmo Pereira, M.; Coelho, M.; Rangel, M.; Ivanova, G. NMR structural analysis of epigallocatechin gallate loaded polysaccharide nanoparticles. Carbohyd. Polym. 2010, 82, 861–866. [Google Scholar] [CrossRef]
  19. Alamzeb, M.; Ali, S.; Khan, A.A.; Igoli, J.O.; Ferro, V.A.; Gray, A.I.; Khan, M.R. A new ceramide along with eight known compounds from the roots of Artemisia incisa Pamp. Rec. Nat. Prod. 2015, 9, 297–304. [Google Scholar]
  20. Xu, Y.; Rashwan, A.K.; Ge, Z.; Li, Y.; Ge, H.; Li, J.; Xie, J.; Liu, S.; Fang, J.; Cheng, K. Identification of a novel α-glucosidase inhibitor from Melastoma dodecandrum Lour. fruits and its effect on regulating postprandial blood glucose. Food Chem. 2023, 399, 133999. [Google Scholar] [CrossRef]
  21. Zhang, H.; Guo, Q.; Liang, Z.; Wang, M.; Wang, B.; Sun-Waterhouse, D.; Waterhouse, G.I.; Wang, J.; Ma, C.; Kang, W. Anti-inflammatory and antioxidant effects of Chaetoglobosin Vb in LPS-induced RAW264. 7 cells: Achieved via the MAPK and NF-κB signaling pathways. Food Chem. Toxicol. 2021, 147, 111915. [Google Scholar] [CrossRef] [PubMed]
  22. Riedl, S.J.; Shi, Y. Molecular mechanisms of caspase regulation during apoptosis. Nat. Rev. Mol. Cell Biol. 2004, 5, 897–907. [Google Scholar] [CrossRef] [PubMed]
  23. Tsao, R.; McCallum, J. Chemistry of flavonoids. Fruit Veg. Phytochem. 2010, 131, 357–367. [Google Scholar]
  24. Dludla, P.V.; Mabhida, S.E.; Ziqubu, K.; Nkambule, B.B.; Mazibuko-Mbeje, S.E.; Hanser, S.; Basson, A.K.; Pheiffer, C.; Kengne, A.P. Pancreatic β-cell dysfunction in type 2 diabetes: Implications of inflammation and oxidative stress. World J. Diabetes 2023, 14, 130. [Google Scholar] [CrossRef] [PubMed]
  25. Bhatti, J.S.; Sehrawat, A.; Mishra, J.; Sidhu, I.S.; Navik, U.; Khullar, N.; Kumar, S.; Bhatti, G.K.; Reddy, P.H. Oxidative stress in the pathophysiology of type 2 diabetes and related complications: Current therapeutics strategies and future perspectives. Free Radic. Biol. Med. 2022, 184, 114–134. [Google Scholar] [CrossRef] [PubMed]
  26. Dai, T.; Li, T.; He, X.; Li, X.; Liu, C.; Chen, J.; McClements, D.J. Analysis of inhibitory interaction between epigallocatechin gallate and alpha-glucosidase: A spectroscopy and molecular simulation study. Spectrochim. Acta A 2020, 230, 118023. [Google Scholar] [CrossRef]
  27. Chang, G.; Cai, C.; Xiang, Y.; Fang, X.; Yang, H. Extraction and study of hypoglycemic constituents from Myrica rubra pomace. Molecules 2022, 27, 846. [Google Scholar] [CrossRef]
  28. Zhang, Q.; Huang, Z.; Wang, Y.; Wang, Y.; Fu, L.; Su, L. Chinese bayberry (Myrica rubra) phenolics mitigated protein glycoxidation and formation of advanced glycation end-products: A mechanistic investigation. Food Chem. 2021, 361, 130102. [Google Scholar] [CrossRef]
  29. Kandasamy, N.; Ashokkumar, N. Renoprotective effect of myricetin restrains dyslipidemia and renal mesangial cell proliferation by the suppression of sterol regulatory element binding proteins in an experimental model of diabetic nephropathy. Eur. J. Pharmacol. 2014, 743, 53–62. [Google Scholar] [CrossRef]
  30. Xie, Y.; Wang, Y.; Xiang, W.; Wang, Q.; Cao, Y. Molecular mechanisms of the action of myricetin in cancer. Mini-Rev. Med. Chem. 2020, 20, 123–133. [Google Scholar] [CrossRef]
  31. Fan, S.; Wang, C.; Huang, K.; Liang, M. Myricanol Inhibits Platelet Derived Growth Factor-BB-Induced Vascular Smooth Muscle Cells Proliferation and Migration in vitro and Intimal Hyperplasia in vivo by Targeting the Platelet-Derived Growth Factor Receptor-β and NF-κB Signaling. Front. Physiol. 2022, 12, 2574. [Google Scholar] [CrossRef] [PubMed]
  32. Shen, S.; Liao, Q.; Feng, Y.; Liu, J.; Pan, R.; Lee, S.M.-Y.; Lin, L. Myricanol mitigates lipid accumulation in 3T3-L1 adipocytes and high fat diet-fed zebrafish via activating AMP-activated protein kinase. Food Chem. 2019, 270, 305–314. [Google Scholar] [CrossRef] [PubMed]
  33. Shen, S.; Liao, Q.; Zhang, T.; Pan, R.; Lin, L. Myricanol modulates skeletal muscle–adipose tissue crosstalk to alleviate high-fat diet-induced obesity and insulin resistance. Br. J. Pharmacol. 2019, 176, 3983–4001. [Google Scholar] [CrossRef] [PubMed]
  34. Kesavardhana, S.; Malireddi, R.S.; Kanneganti, T.D. Caspases in cell death, inflammation, and pyroptosis. Annu. Rev. Immunol. 2020, 38, 567–595. [Google Scholar] [CrossRef]
Figure 1. The chemical structure of epigallocatechin gallate, myricetrin, myricetin, taraxerol, myricanol, and 11-O-acetylmyricanol in the crude extract of the bark of Myrica rubra.
Separations 11 00004 g001
Figure 2. HSCCC chromatogram of ethyl acetate extract from Myrica rubra. Conditions: solvent system, chloroform-methanol-water (10:8:3, v/v/v); flow rate, 2.0 mL/min; rotational speed, 810 rpm; detection wavelength, 254 nm; separation temperature, 25 °C; sample size, 110 mg; retention of the stationary phase, 47%. 1, myricetrin (collected during 115–128 min); 2, myricetin (collected during 137–144 min); 3, epigallocatechin gallate (collected during 193–200 min); 4, myricanol (collected during 203–213 min); 5, taraxerol (collected during 246–255 min).
Separations 11 00004 g002
Figure 3. HPLC analyses of the main compounds separated from MR ethyl acetate extract. 0, ethyl acetate extract; 1, myricanol; 2, epigallocatechin gallate; 3, myricetrin; 4, myricetin.
Separations 11 00004 g003
Figure 4. The inhibition effects of the main compounds from Myrica rubra on α-glucosidase activities. A–F values are the means ± SD of α-glucosidase inhibitory activity of three replicated samples (at a concentration of 0.43 mg/mL). Bars with different letters indicate statistically significant differences among groups at p < 0.05.
Separations 11 00004 g004
Figure 5. Protective effect of the main compounds from Myrica rubra on LPS-induced cell death in live zebrafish embryos. The embryos were treated with 1 μg/mL LPS for 14 h. Then 10 μg/mL of myricetrin, myricetin, epigallocatechin gallate, and taraxerol were added to the culture medium for 14 h to evaluate their reactive oxygen species scavenging activity. A quantity of 50 μg/mL of Vc was used as a positive control. The cell death was detected by fluorescence spectrophotometry after acridine orange staining. ## p < 0.01 vs. NC group. * p < 0.05 vs. LPS group.
Separations 11 00004 g005
Figure 6. Cytotoxicity of myricetrin, myricetin, epigallocatechin gallate, taraxerol, and myricanol in HepG2 cells (mean ± SD, n = 3). * p < 0.05, ** p < 0.01 vs. NC group.
Separations 11 00004 g006
Figure 7. The morphology of the myricanol-treated HepG2 cells after 24 h treatment using bright field microscopy (25×). (A) Blank control. (B) Vehicle (1% DMSO) control. (C) Myricanol at 10 µg/mL. (D) Myricanol at 15 µg/mL. (E) Myricanol at 20 µg/mL. (F) Myricanol at 30 µg/mL.
Separations 11 00004 g007
Figure 8. HepG2 cells were treated with the indicated concentrations of myricanol for 20 h. The expression of caspase 3, 8, and 9 was determined by Western blotting. The expression levels of each target were indicated below the corresponding blots.
Separations 11 00004 g008
Disclaimer/Publisher’s Note: The statements, opinions and data contained in all publications are solely those of the individual author(s) and contributor(s) and not of MDPI and/or the editor(s). MDPI and/or the editor(s) disclaim responsibility for any injury to people or property resulting from any ideas, methods, instructions or products referred to in the content.

