Article

Tuning Nanopores in Tubular Ceramic Nanofiltration Membranes with Atmospheric-Pressure Atomic Layer Deposition: Prospects for Pressure-Based In-Line Monitoring of Pore Narrowing

1
Inorganic Membranes, Department of Chemical Engineering, MESA+ Institute for Nanotechnology, University of Twente, P.O. Box 217, 7500 AE Enschede, The Netherlands
2
Department of Sanitary Engineering, Faculty of Civil Engineering and Geosciences, Delft University of Technology, P.O. Box 5048, 2600 GA Delft, The Netherlands
3
Department of Chemical Engineering, Faculty of Applied Sciences, Delft University of Technology, Van der Maasweg 9, 2629 HZ Delft, The Netherlands
4
Integrated Devices and Systems, Faculty of Electrical Engineering, Mathematics and Computer Science, MESA+ Institute for Nanotechnology, University of Twente, P.O. Box 217, 7500 AE Enschede, The Netherlands
*
Author to whom correspondence should be addressed.
Separations 2024, 11(1), 24; https://doi.org/10.3390/separations11010024
Submission received: 20 November 2023 / Revised: 21 December 2023 / Accepted: 29 December 2023 / Published: 9 January 2024

Abstract

:
Atomic layer deposition (ALD) is known for its unparalleled control over layer thickness and 3D conformality and could be the future technique of choice to tailor the pore size of ceramic nanofiltration membranes. However, a major challenge in tuning and functionalizing a multichannel ceramic membrane is posed by its large internal pore volume, which needs to be evacuated during ALD cycling. This may require significant energy and processing time. This study presents a new reactor design, operating at atmospheric pressure, that is able to deposit thin layers in the pores of ceramic membranes. In this design, the reactor wall is formed by the industrial tubular ceramic membrane itself, and carrier gas flows are employed to transport the precursor and co-reactant vapors to the reactive surface groups present on the membrane surface. The layer growth for atmospheric-pressure ALD in this case proceeds similarly to that for state-of-the-art vacuum-based ALD. Moreover, for membrane preparation, this new reactor design has three advantages: (i) monolayers are deposited only at the outer pore mouths rather than in the entire bulk of the porous membrane substrate, resulting in reduced flow resistances for liquid permeation; (ii) an in-line gas permeation method was developed to follow the layer growth in the pores during the deposition process, allowing more precise control over the finished membrane; and (iii) expensive vacuum components and cleanroom environment are eliminated. This opens up a new avenue for ceramic membrane development with nano-scale precision using ALD at atmospheric pressure.

1. Introduction

Today, the separation of liquids and gases in the chemical industry is mostly performed based on conventional thermal processes. Membrane-based separations are powered electrically rather than thermally, which makes them attractive in the push for a carbon-neutral industry [1]. As an alternative to polymeric membranes, ceramic membranes are increasingly being applied in the chemical process industry due to their high durability, resistance to aggressive chemical conditions, and resistance to high temperatures [2]. The commercially available membranes in the tight ultrafiltration (UF) and nanofiltration (NF) range are typically fabricated using the conventional sol-gel route, which provides a facile, affordable, and flexible route to produce inorganic membranes [2]. However, with this technique, it is still difficult to produce these membranes with pore sizes of ~1 nm [3] and a narrow pore size distribution [4].
Atomic layer deposition (ALD) is a thin-layer deposition technique that is widely used in the semiconductor industry and has been applied to modify ceramic membranes [5,6,7,8,9]. For over three decades, ALD of several metallic oxides has been applied to various high-porosity substrates, among which anodic aluminum oxide has been prominent due to its regular pore structure [7]. More importantly, for the specific application of industrial separations, ALD has been applied to ceramic membranes to modify pore size, pore structure, or surface properties, among others [7,10]. Most depositions onto ceramics have been performed at low or near-vacuum pressures, increasing the processing cost of membranes, e.g., due to the expensive vacuum pumps. Atmospheric-pressure ALD (AP-ALD) could be a more economical and environmentally friendly concept [11,12]. This has been applied, for example, in the deposition of Al2O3 onto TiO2 nanoparticles in a fluidized bed reactor [13].
On a lab scale, flow-type AP-ALD has been applied to tubular ceramic membranes using a setup based on conventional temporal ALD (t-ALD) designs, operated under mostly the same conditions except for the operating pressure [14]. The ceramic membrane tubes are placed in a reaction chamber with a relatively large volume, where precursors are transported to the inside and outside of the membrane tubes using a nitrogen carrier gas flow, leading to parasitic deposition (onto reactor walls). Upscaling such a design would lead to highly inefficient usage of precursor material and less controlled process conditions. Hence, to achieve the viability required for the industrial acceptance of ALD for large-scale membrane applications, the development of new reactor designs is essential [7,15].
A novel, alternative approach based on ALD with atmospheric-pressure flow precursor supply to the inside of a tubular membrane will combine the advantages of both conventional systems. The concept of time-multiplexed reactant supply at atmospheric pressure allows for a highly efficient separation of precursors, much like in space-divided or spatial ALD (s-ALD), with precursor pulse and purge steps similar to how t-ALD operates. A system using this so-called spatio-temporal operation of ALD has been developed by Encapsulix, using highly laminar flows to efficiently separate the reactants [16]. In this configuration, precursor pulse times can be in the range of milliseconds. While the reactor pressures, in this case, are low (0.5 to 3 Torr), the concept could be suitable for application at atmospheric pressure as well. A similar mode of operation has been applied at atmospheric pressure by Patel et al. to conformally coat and functionalize the inside surface of a gas chromatography capillary column with a length of up to 12 m [17]. Recently, Toldra-Reig et al. introduced a 3D-printed spatial ALD head design to deposit zinc oxide layers onto the outside of tubular Al2O3 membranes and tubular copper foils [18]. Using a close-proximity approach, much like in spatial ALD applications to planar substrates, the precursors are continuously fed and pumped into and from the reaction zones, respectively. The method showed a significant chemical vapor deposition (CVD) component in the deposition onto the porous tubular sample. Unfortunately, tubular ceramic membranes mostly have their selective layer at the inside of a tube, while this reactor was designed only for coating the outside of a tube.
This research presents a new atmospheric-pressure atomic layer deposition (AP-ALD) reactor design for deposition in pores of a selective layer onto the inside perimeter of tubular ceramic (α-alumina) membranes. In atmospheric pressure ALD, the density of gas molecules during deposition is significantly higher than in the case of state-of-the-art t-ALD. Therefore, the transport mechanism of the precursor molecules in the bulk of the reactor is also different, being in the diffusion or viscous regime under near-vacuum conditions and at atmospheric pressure, respectively. This study aims to understand the growth characteristics of layers grown in AP-ALD and to compare them to state-of-the-art t-ALD under the aforementioned conditions. The operating window for homogeneous deposition along the length of the tube (100 mm) was studied by measuring the layer thickness of TiO2 during its deposition onto a strip of a planar reference silicon substrate, placed inside along the axis of the tubular sample. TiCl4 and H2O were chosen as the precursor and co-reactant chemicals for their well-known behavior in ALD processes [19] in order to form TiO2, after which the layer growth was compared to state-of-the-art vacuum-based ALD. TiO2 is widely used in ceramic membranes [7] and allows for good elemental contrast in material analyses (e.g., high-resolution and diffraction techniques) against alumina support layers that are often used to inspect the morphology and material properties of the deposited layer. Moreover, this reactor design allows for a convenient and non-destructive in-line measurement method to monitor deposition progress during the process.

2. Materials and Methods

2.1. Materials

Tubular membrane support tubes of 10 mm outside diameter, 7 mm inside diameter, and 100 mm length, made of α-alumina with nominally 20 nm pore width, were acquired from CoorsTek B.V., Uden, The Netherlands. To provide gas- and liquid-tight sealing, glass seals of about 1 cm were applied to both ends of the tube as follows. Specialized glass powder G018-267 K6 was acquired from Schott AG, Mainz, Germany. The powder was suspended in reaction-grade 2-propanol, acquired from Sigma-Aldrich, Zwijndrecht, The Netherlands, containing 46.5% glass powder by weight. Both ends of the tubes were dipped into the continuously stirred mixture for 1 s and turned by hand after removal from the suspension for a homogeneous thickness of the seal. The seals were sintered in air at 1050 °C for 6 min using heating and cooling rates of 2 °C min−1.
The inside surface of the tubular α-alumina supports was dip-coated with a boehmite sol using a Bungard RDC-15 dip-coater, dipping and removing rates of 11 mm s−1, and a holding time of 3 min. Calcination in air (650 °C for 3 h, 1 °C min−1 heating/cooling rates) of the boehmite layer resulted in a 1.5 µm γ-alumina layer with a nominal pore width of 5 nm. Further details about the properties of the γ-alumina layer can be found elsewhere [20].
Planar membrane supports (α-alumina, 2 mm thickness, average pore width of 80 nm), manufactured by Pervatech B.V., Rijssen, The Netherlands, were dip-coated using a rotary dip-coater setup with identical sol formulation and calcination procedures as the tubular membranes.
Titanium tetrachloride 99.995% (TiCl4) was delivered by Pegasus Chemicals, Sandycraft, United Kingdom, in a stainless-steel cylinder with manual valves and VCR couplings. DI-quality H2O purified using a Millipore Milli-Q lab water system was used to fill the water precursor flask.

2.2. AP-ALD Reactor

Atomic layer deposition of titanium dioxide (TiO2) was performed from TiCl4 and H2O in an in-house-built AP-ALD setup, in which the industrial tubular ceramic membrane is the core of the reactor and where gas flows are employed to transport the precursors to the inside of the tubular membrane. A schematic of the reactor design is presented in Figure 1. Precursors are dosed into the reactor by mass flow controllers (MFCs), providing a continuous flow of 5.0-grade N2 carrier gas. The carrier gas is sent through the temperature-controlled precursor flasks at pre-determined dosing times by the simultaneous opening of two 3-way ALD valves, V1 and V2. At all other times, the ALD valves are closed, allowing nitrogen to flow from the MFCs to the reactor, but not through the flasks. The vapor uptake in the flasks is not based on bubbling the carrier gas through the liquid precursor(s) but on so-called vapor draw by the carrier gas flow over the precursor meniscus. The flow through the flask is measured by a mass flow meter (MFM) and can be tuned by opening or closing a needle valve (NV) located in between the 3-way valves, to decreas or increas the flow through the precursor flask, respectively. The precursor flasks are temperature-controlled by a Peltier element beneath each flask and kept at 16 °C. Each precursor has its individual gas line and the separate precursor flows merge just before entering the reaction chamber containing the sample tube. The mixed precursor flows are fed into a tubular ceramic membrane, mounted in a tubular reaction chamber (Figure 1). The design of the module is such that a membrane with the above-mentioned tubular shape and dimensions is inherently rendered into the reaction chamber. The porosity of the membrane tube allows for the exchange of gaseous species between the retentate side to the permeate side of the membrane. ALD can therefore also take place inside the pores of the membrane. Alternatively, the porous tube can be replaced by stainless-steel tube of identical dimensions to convert the device into a traditional flow-type ALD reactor at atmospheric pressure. The seal between the inside and outside of the tube is provided by two FKM O-rings, which are pushed in place onto the glass seals of the membrane tube by screws on either side of the module. This entire reactor assembly is placed inside a furnace during operation.
To study the effect of different deposition parameters on the layer thickness growth at various places across the length of the tube, a silicon wafer strip was placed inside a dense stainless-steel tube, as shown in Figure 2. After the deposition, the layer thickness was determined with spectroscopic ellipsometry (SE) at 5 spots on a silicon strip. Details of the experiments can be found in Appendix A, Table A1.
Tubular ceramic samples, glass-sealed and with a ~1.5 µm γ-alumina layer atop, were mounted in the sample module and placed in the deposition furnace for 2 h at the intended deposition temperature, with N2 flowing through at 25 mL min−1 before each experiment to remove the possibly adsorbed water. The varied parameters for the set of experiments are listed in Appendix A, Table A2.
The Reynolds number and the entrance length for all used deposition parameters were calculated according to Equations (1) and (2), respectively. The entrance length is the characteristic distance for a flow to reach a fully developed flow profile in a pipe. The dimensionless Reynolds number is calculated [21] using Equation (1):
Re = ρ × v × L μ
where ρ is the density of nitrogen at the reactor temperature in kg m−3, v the flow velocity in m s−1, L the characteristic length in m, in the case of a tube its diameter, and μ the dynamic viscosity in Pa × s.
The entrance length L e is used to calculate the length needed for a fully developed flow profile. In the laminar flow regime, L e is calculated [22] using Equation (2):
L e = 0.575 × Re × L

2.3. Characterization

2.3.1. Material Characterization

To assess the thickness and homogeneity of ALD-grown TiO2 layers along the length of the reactor chamber, i.e., the membrane tube, silicon substrate strips of 5 mm by 100 mm were placed inside the reactor chamber and inspected ex situ using SE. SE is an optical characterization technique, where the change in polarization of a polarized light beam is measured after reflection on the sample [23]. The change in polarization is expressed by the change in amplitude (ψ) and phase (Δ), and this change is dependent on the optical properties and thickness of the sample for a specific wavelength. These parameters can be fitted using a model to estimate the layer thickness. The measurements were performed on a J.A. Woollam M-2000X setup with a multichromatic light source. For fitting the acquired data, a Tauc–Lorentz oscillator model was used. Two layers were described, the first being the native silicon oxide layer present on the silicon (100) strip and the second being the ALD-grown TiO2 layer. The native silicon oxide layer was measured separately once, after which this thickness was used as the native oxide thickness taken into account in the model.
X-ray photoelectron spectroscopy (XPS) measurements were performed using a PHI Quantes scanning XPS system (Nanolab, MESA+ institute, Enschede, The Netherlands) to determine the approximate atomic concentrations of the target material as well as contaminants in the deposited material. The system is equipped with a monochromatic Al Kα source (1486.6 eV, 2.6 mA, 25 W, 15 kV, base pressure < 7 × 10⁻⁷ Pa). Two types of samples were investigated. First, the layer deposited onto the Si strip was investigated, starting from the entrance side to the center of the strip, with assessment divided over 5 spots. Second, the inner surface of the center of a membrane tube was investigated. To obtain a good average measurement, 5 spots were probed in a small area (within 10 mm). Before analysis, the measurement spots were sputtered with Ar+ ions to remove contaminations present from storage or sample preparation. The survey spectra were collected at a pass energy of 280 eV and step size of 1 eV over an energy range between −5 eV and 1345 eV. Using a Shirley background, the atomic concentrations were calculated from the area under the peaks and analyzed for concentrations of carbon (C), oxygen (O), sodium (Na), chlorine (Cl), and titanium (Ti). The spectra were calibrated towards the C 1s peak of adventitious carbon at 284.4 eV [24]. Elemental depth profiles were constructed by cycles of sequential sputtering of Ar+ and XPS measurements. Sputtering was performed at a 2 by 2 mm2 raster size at 2 kV. These conditions correspond to a sputter rate of 6.3 ± 0.2 nm min−1, as calibrated using SiO2. Charge compensation was performed using a low-energy electron flood gun and low-energy argon ions at an operating pressure of 1.3 × 10⁻⁶ Pa.
High-resolution scanning electron microscopy (HR-SEM) was performed on a Zeiss Merlin high-resolution field-emission SEM system with a point resolution of 1.2 nm.

2.3.2. Membrane Characterization

Permporometry (PPM) measurements were used to determine the pore sizes of the tubular samples before and after ALD deposition. PPM differentiates itself from other pore size determination techniques like nitrogen sorption because it exclusively measures the active pores and can be performed on supported membrane layers [25].
The PPM setup used for this work operates by measuring the nitrogen flux through a membrane while increasing the water partial pressure from 0% to 90% relative humidity (RH) in steps of 10%. Over the course of the experiment, the permeate nitrogen flux decreases due to capillary condensation of the condensable liquid inside the pores, gradually filling the pores in order to increase pore width. The decrease in nitrogen flux at a certain humidity can be related to the corresponding pore size through the Kelvin equation with the assumption of a slit-shaped pore, following from the platelet-like structure of γ-alumina [24]. The pore width is then calculated as per Equation (3) [26]:
d pore = R Kelvin + 2 × t layer   thickness
Before measurement, membranes were heated to 200 °C overnight to eliminate any adsorbed water from the atmosphere. While still hot, the tubes were mounted in the stainless-steel sample holder and a dry nitrogen flow was applied, after which measurement was initialized.
Molecular weight cut-off (MWCO) was employed to measure the pore sizes of planar membranes. In this method, a mixture of polyethylene glycol (PEG) solution (1 g L−1) with mean molecular weights of 200, 400, 600, 1000, and 1500 g mol−1 was filtered by the membranes at 10 bar. Afterward, samples from the feed, permeate, and concentrate were measured via gel permeation chromatography (GPC, Agilent Technologies 1200/1260 Infinity GPC/SEC series). The MWCO of the membrane was then determined at the x axis intercept of 90% of the retention curve [22]. For samples with defects, the MWCO was corrected for a fair comparison based on the method developed by Kramer et al. [4].
An in-line gas permeation test was developed to follow the progress of the layer deposition in the pores until the closing of the pores. In between a pre-determined number of cycles, a test was performed using flows of 20 and 50 mL min−1. In such a test, the nitrogen flow was set to be constant, and the pressure drop over the membrane could be read from the digital backpressure regulator. The pressure drop value was converted into a nitrogen permeance value using Equation (4):
P = F 6 × 10 9 × a × Δ p × V m
where P is the permeance in [mol m−2 Pa−1 s−1], F the flow of nitrogen in ml min−1, a the tubular membrane surface area in m2, Δp the pressure difference in bar, and V m the molar volume of nitrogen at atmospheric pressure and room temperature, as these are the conditions they are measured at.

3. Results and Discussion

3.1. Effect of Deposition Parameters

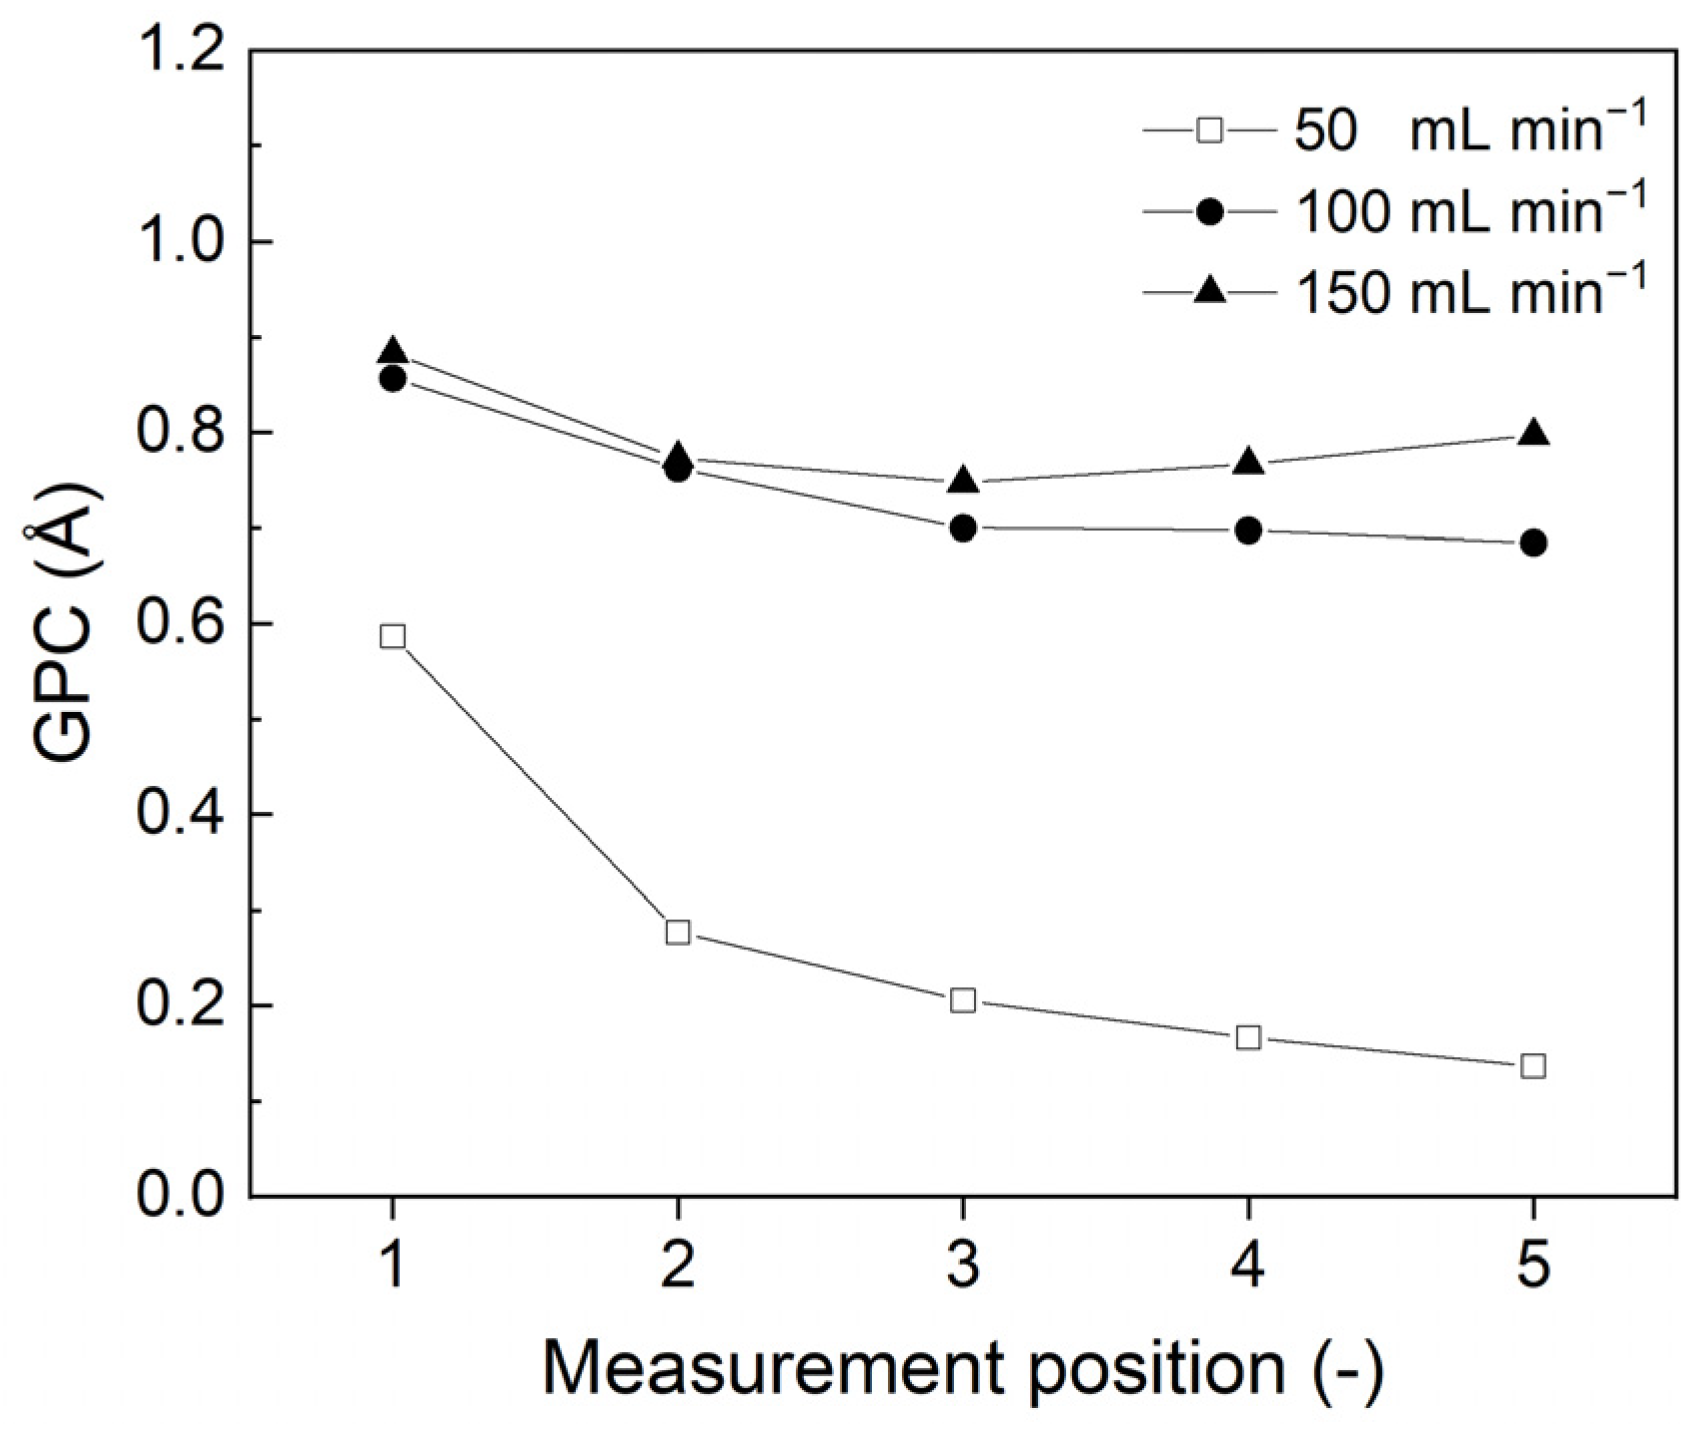
In the AP-ALD setup, the precursors flow through the membrane tube longitudinally. To confirm homogeneous deposition thickness over the length of the membrane tube, the layer thickness was measured by applying spectroscopic ellipsometry to a silicon wafer strip placed in the reactor during deposition. The growth rate of a deposited film is typically represented in terms of growth per cycle (GPC), which can be calculated by dividing the total layer thickness by the number of cycles [19]. Figure 3 shows the GPC as a function of the distance from the reactor inlet after 300 deposition cycles at three different carrier gas flow rates. Measurement position 1 represents the measurement point on the edge closest to the reactor inlet and position 5 is the point on the edge closest to the reactor exhaust.
A significant decrease in layer thickness was observed between positions 1 and 2 for all flow rates. The difference in layer growth near the entrance of the tube could be caused by two entrance effects: a temperature difference or a change in the gas flow pattern. As no temperature differences were measured, the Reynolds number Re and the entrance length Le were calculated according to Equations (1) and (2), respectively. The calculated Reynolds number values for all experiments were between 4 and 32, indicative of a laminar flow regime. The entrance lengths for carrier gas flows of 50, 100, and 150 mL min−1 were 5, 9, and 14 mm, respectively, corresponding to the position of the first measurement point on the silicon wafer strip. This could explain the higher layer thickness values measured for position 1, which we decided to disregard in this study. For future module designs, an inlet with the same diameter as the membrane (7 mm) and sufficient length should be incorporated to improve the homogeneity of deposition. Reynolds numbers and entrance lengths for all tested experimental conditions are given in Appendix A, Table A3.
At low carrier gas flows of 50 mL min−1, Figure 3 also reveals a decrease in layer thickness over the length of the reactor. To estimate the level of exposure of the substrate to the precursor, a widely used unit in vacuum-based ALD is the Langmuir (L), where 1 L is equal to 7500 Pa × s [27]. The value of exposure given in Pa × s is obtained by multiplying the vapor pressure of a precursor, given in Pascals, with the pulse time of that precursor, given in seconds. In AP-ALD, this calculation cannot be used, as the effective vapor pressure entering the reactor is lower due to only a fraction of the carrier gas being led through the precursor bottle. A better indicator of the amount of precursor supplied into the reactor is the dose, expressed in the number of moles per pulse. Assuming a saturated vapor pressure in the precursor bottles, the amounts of TiCl4 supplied to the reactor were 1.2 × 10⁻⁷, 2.4 × 10⁻⁷, and 3.6 × 10⁻⁷ moles per pulse for carrier gas flows of 50, 100, and 150 mL min−1, respectively.
Thus, decreasing the carrier gas flow to 50 mL min−1 will decrease the number of moles per pulse supplied into the reactor. Consequently, this will cause the depletion of precursors manifesting in a thinner layer grown at the downstream end of the reactor. A more complete list of input details and results of this calculation is given in Appendix A, Table A4. High carrier gas flows of 150 mL min−1 were chosen for the remainder of the experiments.
To verify that all unreacted precursor molecules are removed during the purge step, the purge times were increased from 29 s to 210 s and the layer thicknesses were determined with ellipsometry. The results again showed a higher GPC at the first measuring point on planar silicon substrates, and this point was disregarded. The averages of the four other measuring points are depicted in Figure 4, showing a decrease in GPC up to purge times of 120 s. Prolonging the purge time to 210 s did not result in a significant change in the GPC. A purge time of 150 s was used in the following experiments. The measured GPC values in the AP-ALD setup were in good agreement with GPC values obtained for vacuum-based t-ALD, and GPCs between 0.4 and 1 Å were reported for depositions using TiCl4 and H2O as precursors [28].
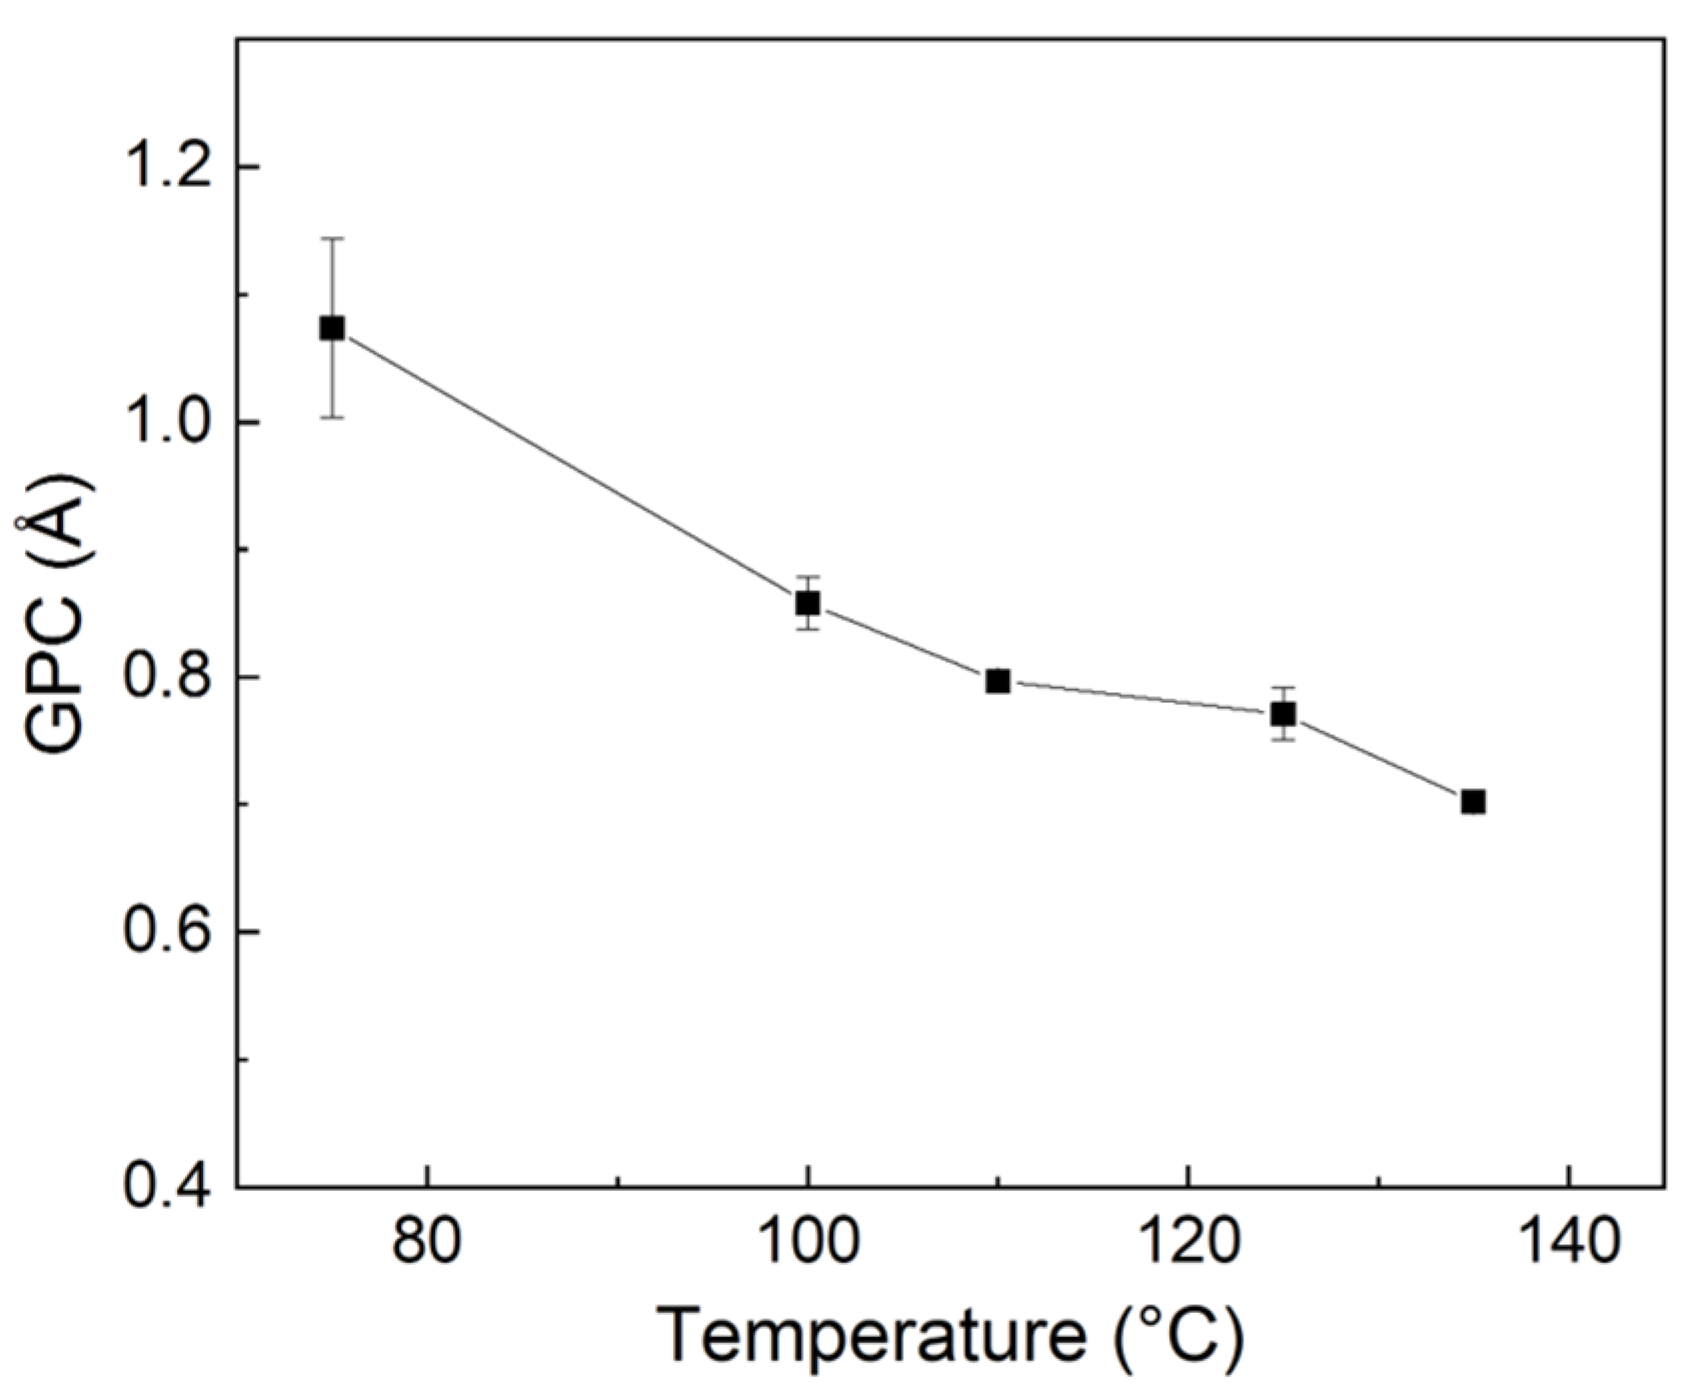
The effect of an increase in deposition temperature on the GPC of TiO2 deposition onto silicon substrates using AP-ALD is depicted in Figure 5, showing a decrease in GPC as a function of temperature. This behavior and GPC values are comparable to depositions in state-of-the-art vacuum-based ALD [29]. The increased GPC at low temperatures is ascribed to the ‘proliferation of active sites’ as a result of the condensation of hydrogen-bonded OH-groups. Jolivet et al. observed similar behavior at lower deposition temperatures [30]. They reported the presence of unreacted hydroxyl groups in the final layer for TD values of 100 °C and 140 °C, as measured using infrared spectroscopy. At higher temperatures, the groups disappear and the corresponding GPC value decreases.
An exemplary HR-SEM image of an ALD-deposited TiO2 layer is depicted in Appendix A, Figure A1. Seventeen measurements taken from a cross-sectional break of a silicon strip show a layer thickness of 22 ± 1 nm. Therefore, the layer thicknesses observed by HR-SEM correspond well to the values observed using SE, confirming that the model used for calculating the layer thickness from ellipsometry data is accurate.
XPS spectra of the TiO2 films deposited at 25 °C and 125 °C showed very low Cl-contents (1 ± 1 atomic %). These atomic concentrations are in the same range as compared to state-of-the-art t-ALD-deposited TiO2 films [31,32,33].

3.2. ALD on Ceramic Membranes

Commercial ceramic membranes are often layered systems manufactured in a tubular configuration, consisting of supporting material with larger pores and, usually on the inside of the tube, intermediate layers with smaller pores to decrease the total resistance. To be able to make a comparison of AP-ALD and the state-of-the-art ALD, a tubular membrane was placed in a vacuum-based system. The results showed no layer deposition, with standard pulse and purge times, in the middle of the tubular membrane. This could be optimized by increasing the pulse and purge times, although this would also result in a deeper penetration into the intermediate layers. Consequently, the flow resistance will increase, which affects the results of other characterization measurements. As planar porous membranes do not have this problem, state-of-the-art t-ALD was conducted onto these planar supports to compare AP-ALD to state-of-the-art ALD.
Layer growth on planar silicon substrates was studied using SE. However, for porous membrane structures, SE interpretation is complex, as the signal is a combination of reflections in the porous structure of the top layer and intermediate support layer. Other methods, such as permporometry, allow measurement of the pore width, which can be compared to the original substrate pore size. This way, the pore size reduction can be determined by comparing the initial versus the newly created pore width.
Figure 6a shows an SEM micrograph of a typical γ-alumina layer on an α-alumina support. Results of permporometry measurements of 5 batches of γ-alumina-coated planar supports, produced following the same method, are depicted in Figure 6b. The batches have mean pore widths ranging between 5.4 and 5.8 nm.
A layer of TiO2 was deposited (12 cycles) onto seven planar γ-alumina-coated membranes. In Figure 7, the pore size before and after ALD is depicted, showing a decrease in the pore widths by a mean value of 1.1 nm (±0.1 nm). This demonstrates that the ALD process in a porous system is highly reproducible. However, for the task of tuning the membrane pore size to the nanofiltration range, the pore size of the pristine substrate needs to be determined in order to know the exact number of deposition cycles needed to decrease the pore size to the desired value.
To further characterize the rejection capabilities of the developed membranes, MWCO measurements were performed. Figure 8 shows that samples after 25 cycles have a MWCO of 657 Da. After the deposition of 50 cycles, the samples were narrowed down to a MWCO of 288 Da.
Flow-based atmospheric-pressure ALD allows for an in-line pressure drop test, in which the pressure difference over the membrane is measured and the permeance through the membrane is calculated. Combined with knowledge of the pristine membrane, the progress of the ALD process can be monitored. Six γ-alumina-coated tubular membranes with very similar pore size and pore size distribution were selected. Note that a significantly lower average pore size (3 nm) was observed for tubular supports as compared to the planar supports (5–6 nm). This could be caused by the different porosity of the support materials, resulting in a change in the drying speeds during the gelation process after dip-coating with the boehmite sol (see Section 2.1). The pressure drop test was performed in-line between deposition cycles. Over the course of each experiment, an increase in pressure drop over the membrane was measured, and the corresponding permeance was calculated and plotted. The results are depicted in Figure 9. For all samples, there is a similar trend; in the first stage, there is a plateau, followed by an increasingly sharp decrease in permeance, starting at different numbers of cycles. Finally, a plateau is reached again when the pores are covered with a thin TiO2 layer. No trend is identifiable between the initial permeance and the pore sizes measured by PPM. For now, there are too many unknown parameters, like pore size distribution, tortuosity, and porosity of the γ-alumina-coated membranes, to understand the relations between permeance and the number of deposition cycles. On the other hand, flow-based atmospheric ALD allows us to determine the moment at which the pores are closed and a thin layer of TiO2 is formed on top of the membrane. This will allow us to develop membranes with a very thin selective layer. Further research is required to fully understand the decrease in permeance and relate it to the characteristics of the final membrane.
The chlorine content of these layers in tubular samples was probed using XPS, showing a chlorine content of 1.4 ± 0.2 atomic %, very close to the values obtained for the layers on the silicon reference strips.
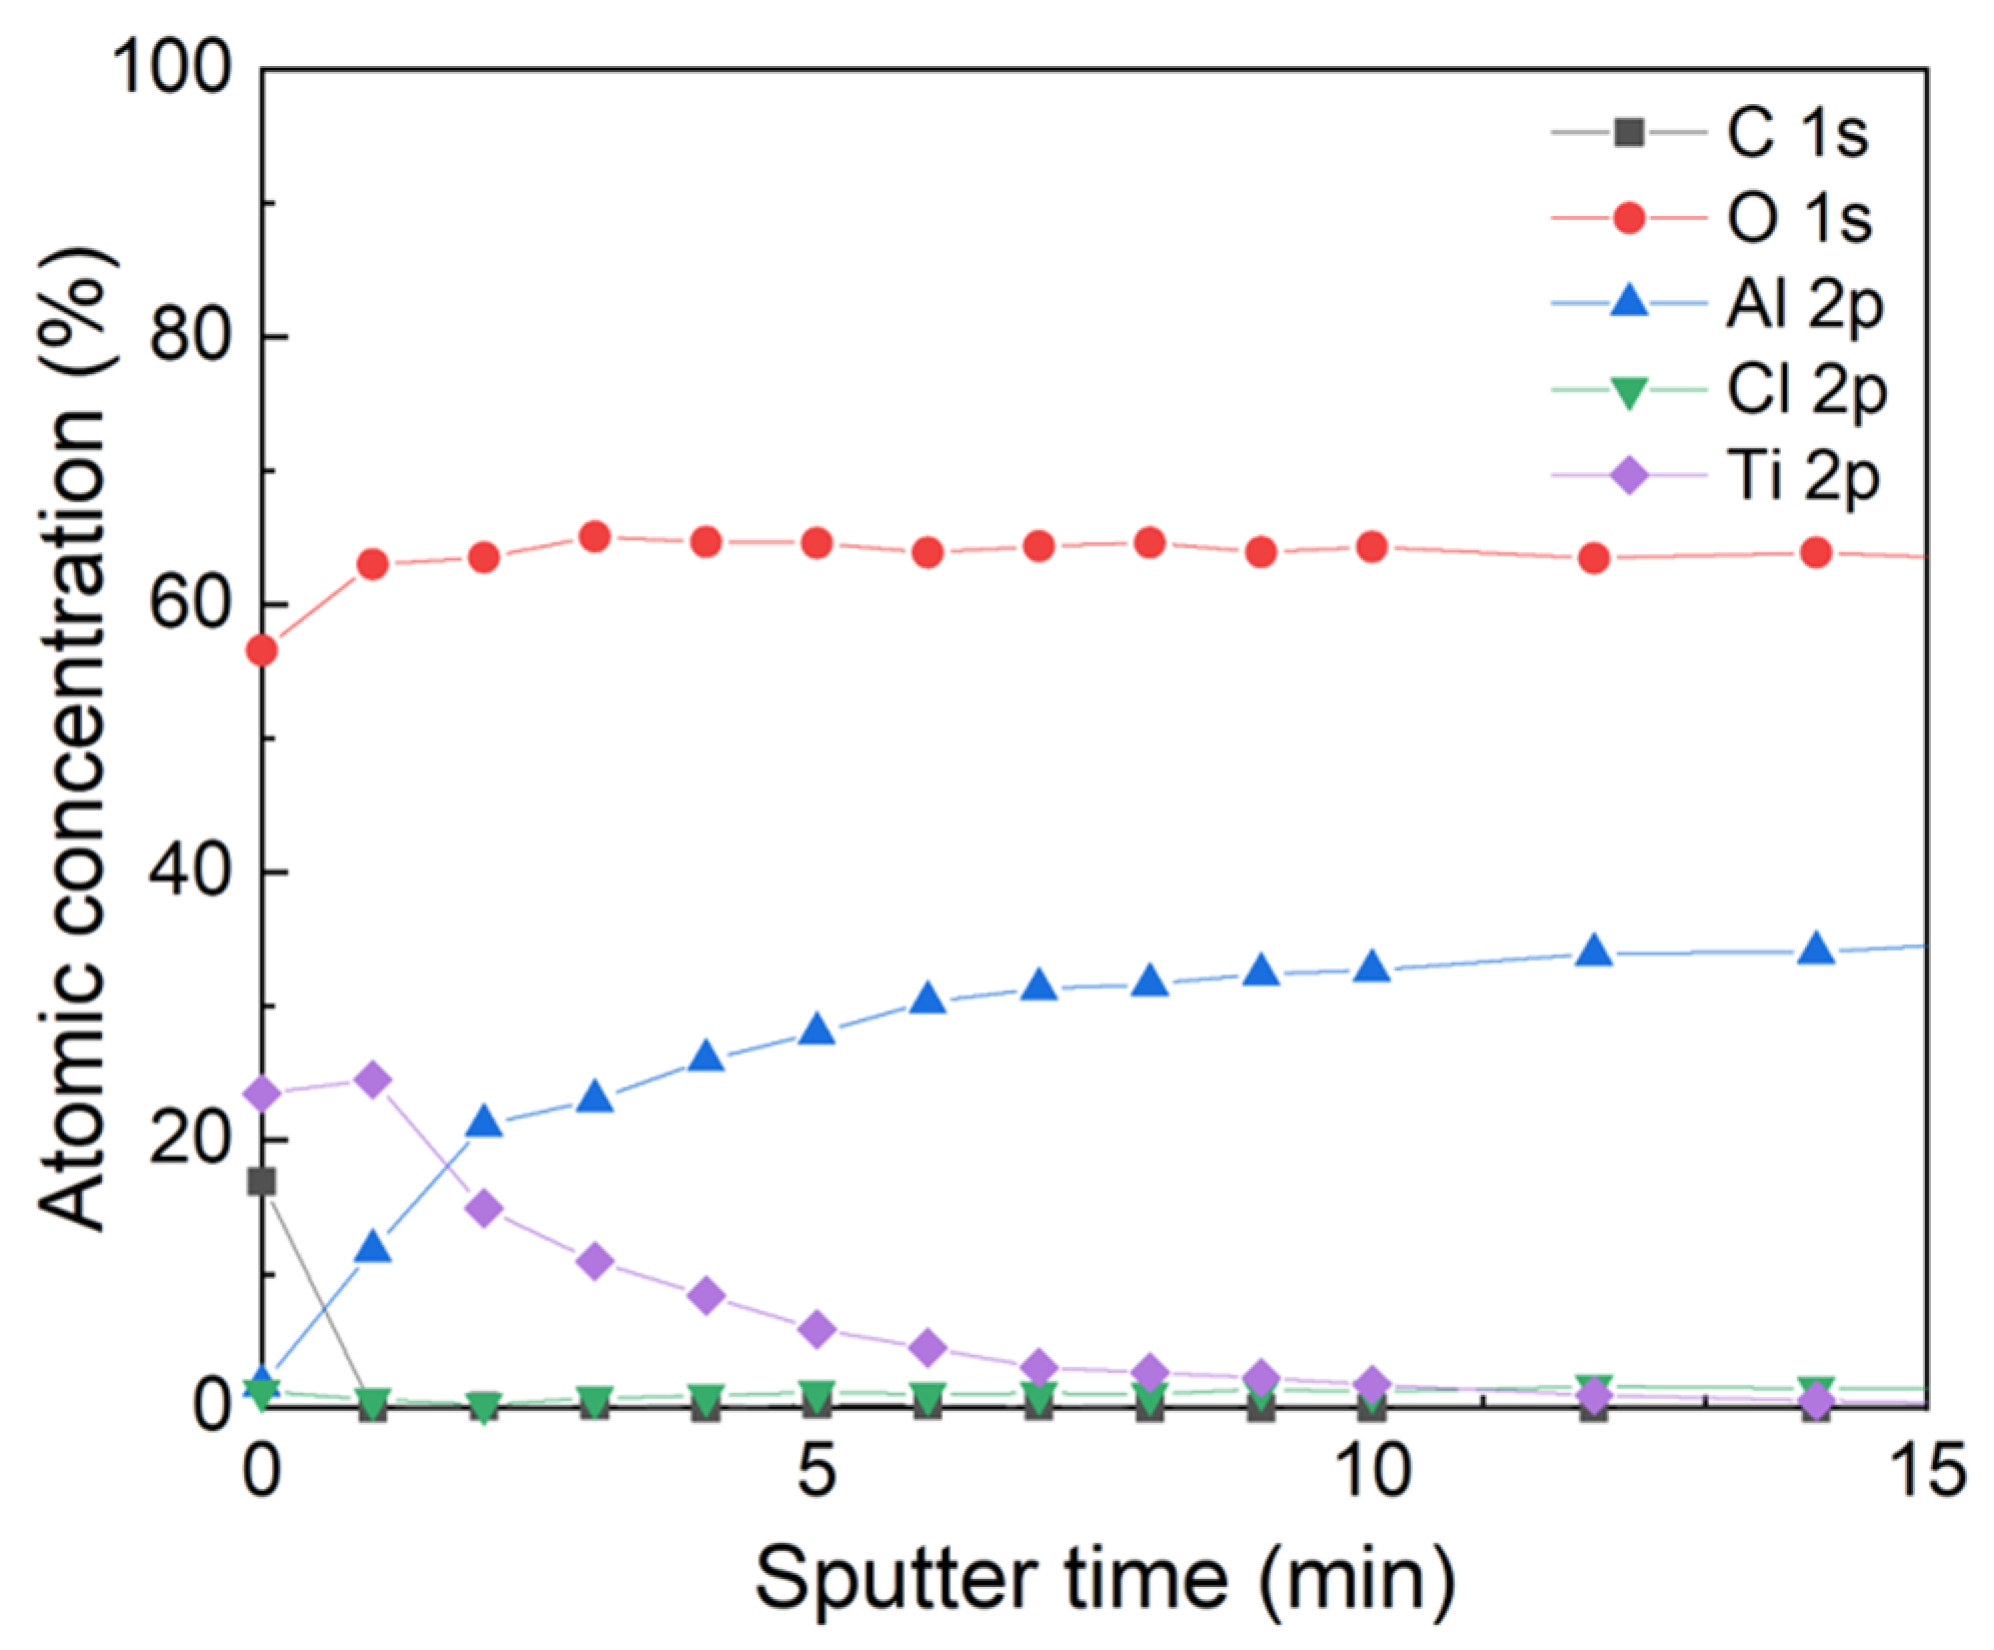
Additionally, an XPS depth profile was constructed via cycles of sequential sputtering of Ar+ and XPS measurements. The sputter rate under the used conditions was 6.3 nm min−1, calibrated on SiO2. The results in Figure 10 show that the surface of the sample contained some carbon, but predominantly consisted of stoichiometric TiO2. Also, the chlorine content in the sample was low throughout the analyzed volume. Titanium was detected until a sputtering time of 12 min, corresponding to an approximate depth of about 76 nm.
Although this observation deviates from ALD’s high conformality deeper in the membrane structure, it is not an undesired result for purposes of membrane improvement. Deposition can be conformal on the surfaces that interact with the feed, while the flux of permeate is not influenced in the bulk of the membrane support due to decreased or no deposition in the bulk. This diffusion-limited regime of ALD is clearly illustrated by Knoops et al., showing that the layer growth and conformality on the surface of a porous substrate are as expected, but that the layer thickness decreases with higher aspect ratios (i.e., pore depth) [34]. In future experiments, the effects of flow velocity and dose should be investigated to improve precursor efficiency.

4. Concluding Remarks

In this work, a novel tubular reactor design is introduced for atmospheric-pressure ALD of TiO2 inside tubular ceramic membranes, with the membranes’ inner surfaces serving as the reactor chamber walls. The deposition characteristics of the AP-ALD setup were assessed and a growth per cycle (GPC) comparable to that obtained using state-of-the-art t-ALD was observed. Apart from reactor entrance effects on precursor flow into the reactor, an ALD process window for homogeneous TiO2 layer thickness control was found for deposition onto planar Si substrates, using TiCl4 and water vapor as precursors. These deposition conditions were then applied to tubular ceramic samples with 3 nm pore size. The pore size of these membranes was decreased in a reproducible manner, as evidenced by in-line gas permeation measurements. Using this method, pore closure could be accurately and intermittently followed in between the deposition steps, without removing the sample from the setup.
To summarize, this paper shows that:
  • Comparable GPC values were obtained for AP-ALD and for state-of-the-art t-ALD.
  • The pore size of ceramic membranes could be reproducibly decreased to the nanofiltration range; a molecular weight cut-off lower than 300 Da was achieved.
  • A novel in-line gas permeation method was developed, allowing us to monitor the pore size decrease during deposition.
Taking into account that (AP-)ALD can be scaled up relatively easily, this new methodology can be qualified as an important step forward in the industrial finetuning of pore size and the functionalization of membrane surfaces.

Author Contributions

Conceptualization, M.N., A.J., J.P., T.A. and M.L.-O.; Formal analysis, M.N. and K.B.; Funding acquisition, M.L.-O.; Investigation, M.N., M.C. and J.P.; Methodology, M.N., A.J., M.C., K.B., T.A., F.R., A.K. and M.L.-O.; Project administration, M.L.-O.; Supervision, F.R., A.K., A.N. and M.L.-O.; Writing—original draft, M.N. and J.P.; Writing—review & editing, M.N., A.J., M.C., K.B., F.R., A.K., A.N. and M.L.-O. All authors have read and agreed to the published version of the manuscript.

Funding

This publication is part of the project “Waste to Feed; Sustainable treatment of challenging industrial (waste)streams with robust silicon carbide nano- or tight-ultrafiltration membranes (SUSSIC)” with project number 18474 of the Open Technology research program which is partly financed by the Dutch Research Council (NWO).

Institutional Review Board Statement

Not applicable.

Data Availability Statement

Data are contained within the article.

Acknowledgments

The authors gratefully acknowledge the help of Mark Smithers for operating the HR-SEM system, Bernhard van der Wel for performing the XPS measurements, Kees van der Zouw for his valuable help with the SE model, and Peter Scheeren for their design and construction work on the AP-ALD setup.

Conflicts of Interest

The authors declare no conflict of interest.

List of Abbreviations

AbbreviationMeaning
ALDAtomic layer deposition
AP-ALDAtmospheric pressure atomic layer deposition
CVDChemical vapor deposition
GPCGrowth per cycle
HR-SEMHigh-resolution scanning electron microscopy
MFCMass flow controller
MFMMass flow meter
MWCOMolecular weight cut-off
NFNanofiltration
NVNeedle valve
PEGPolyethylene glycol
PIPressure indicator
PPMPermporometry
RHRelative humidity
s-ALDSpatial ALD
SESpectroscopic ellipsometry
t-ALDTemporal ALD
UFUltrafiltration

Appendix A

Table A1. TiO2 layer thicknesses grown on planar Si as measured using spectroscopic ellipsometry at 5 positions divided over the total length of the strip to assess the layer homogeneity across the length of the reactor. Position 1 indicates the measurement point closest (5–10 mm) to the inlet of the precursors, while position 5 corresponds with the measurement spot at the exhaust side.
Inlet SideTiO2 Layer ThicknessExhaust Side
Deposition Temperature [°C]Precursor Line Flow [mL min−1]Position 1 [nm]Position 2 [nm]Position 3 [nm]Position 4 [nm]Position 5 [nm]
755022141185
1003433303030
1503632313031
12550188654
1002921202021
1502724232324
Table A2. TiO2 layer thicknesses after deposition using 200 cycles on a planar silicon wafer strip. Thicknesses were measured using spectroscopic ellipsometry at five positions divided over the length of the strip. Position 2 indicates the measurement point closest to the inlet of the precursors, about 2 cm from the end of the strip, while position 5 corresponds with the measurement spot at the exhaust side. The layers were deposited at temperatures from 25 °C to 150 °C at 150 mL min−1 carrier gas flows.
TiO2 Layer ThicknessExhaust Side
Deposition
Temperature [°C]
Position 2
[nm]
Position 3
[nm]
Position 4
[nm]
Position 5
[nm]
2581717874
5046464547
7533313030
10028302928
12520191920
15019181818
Table A3. Reynolds numbers and entrance lengths for the tested parameters and carrier gas flow combinations.
Deposition
Temperature
Kinematic Viscosity Reynolds Number [-]Entrance Length [mm]
[°C][K][10−5 m2 s−1]50
mL min−1
100
mL min−1
150
mL min−1
50
mL min−1
100
mL min−1
150
mL min−1
252981.5781623193958
503231.8171320173350
753482.0761218152944
1003732.3351016132639
1253982.615914122335
1504232.904813102131
1754483.21481191928
Table A4. Constants and variables used to calculate the exposure values and absolute amounts of precursor supplied during each pulse.
Constants
Precursor temperatures [K]289
TiCl4 vapor pressure @ 289 K [Pa]1041.162
H2O vapor pressure @ 289 K [Pa]2338
Pulse time each precursor [s]1
Variables and calculated values
Carrier gas flow each line [mL min−1]50100150
Pulse flow through precursor flask 1 [mL min−1]16.733.350
Pulse flow through precursor flask 2 [mL min−1]16.733.350
TiCl4 exposure [Pa ×  s]347347347
H2O exposure [Pa ×  s]779779779
Amount of TiCl4 per pulse [10−7 mol]1.22.43.6
Amount of H2O per pulse [10−7 mol]2.75.48.1
Residence time in the membrane tube [s]4.62.31.5
Figure A1. Exemplary HR-SEM image of a TiO2 layer deposited at 125 °C using 300 cycles. The layer thickness as measured by SE matches well with this observation in SEM (300 cycles, 1 s pulses, 150 mL min−1 carrier gas flows, 150 s purge times).
Separations 11 00024 g0a1

References

  1. Lively, R.P.; Sholl, D.S. From Water to Organics in Membrane Separations: Membrane Materials Provide Economical Means to Achieve Various Separation Processes—And Their Capabilities for Processing Organic Fluids Look Set to Expand Significantly. Nat. Mater. 2017, 16, 276–279. [Google Scholar] [CrossRef] [PubMed]
  2. Fard, A.K.; Mckay, G.; Buekenhoudt, A.; Al Sulaiti, H.; Motmans, F.; Khraisheh, M.; Atieh, M. Inorganic Membranes: Preparation and Application for Water Treatment and Desalination. Materials 2018, 11, 74. [Google Scholar] [CrossRef]
  3. Yang, Z.; Zhou, Y.; Feng, Z.; Rui, X.; Zhang, T.; Zhang, Z. A Review on Reverse Osmosis and Nanofiltration Membranes for Water Purification. Polymers 2019, 11, 1252. [Google Scholar] [CrossRef] [PubMed]
  4. Kramer, F.C.; Shang, R.; Scherrenberg, S.M.; Rietveld, L.C.; Heijman, S.J.G. Separation and Purification Technology Quantifying Defects in Ceramic Tight Ultra- and Nanofiltration Membranes and Investigating Their Robustness. Sep. Purif. Technol. 2019, 219, 159–168. [Google Scholar] [CrossRef]
  5. Puurunen, R.L. A Short History of Atomic Layer Deposition: Tuomo Suntola’s Atomic Layer Epitaxy. Chem. Vap. Depos. 2014, 20, 332–344. [Google Scholar] [CrossRef]
  6. Berland, B.S.; Gartland, I.P.; Ott, A.W.; George, S.M. In Situ Monitoring of Atomic Layer Controlled Pore Reduction in Alumina Tubular Membranes Using Sequential Surface Reactions. Chem. Mater. 1998, 10, 3941–3950. [Google Scholar] [CrossRef]
  7. Weber, M.; Julbe, A.; Ayral, A.; Miele, P.; Bechelany, M. Atomic Layer Deposition for Membranes: Basics, Challenges, and Opportunities. Chem. Mater. 2018, 30, 7368–7390. [Google Scholar] [CrossRef]
  8. Weber, M.; Julbe, A.; Kim, S.S.; Bechelany, M. Atomic Layer Deposition (ALD) on Inorganic or Polymeric Membranes. J. Appl. Phys. 2019, 126, 041101. [Google Scholar] [CrossRef]
  9. Xiong, S.; Qian, X.; Zhong, Z.; Wang, Y. Atomic Layer Deposition for Membrane Modification, Functionalization and Preparation: A Review. J. Memb. Sci. 2022, 658, 120740. [Google Scholar] [CrossRef]
  10. Detavernier, C.; Dendooven, J.; Pulinthanathu Sree, S.; Ludwig, K.F.; Martens, J.A. Tailoring Nanoporous Materials by Atomic Layer Deposition. Chem. Soc. Rev. 2011, 40, 5242–5253. [Google Scholar] [CrossRef]
  11. Chen, M.; Nijboer, M.P.; Kovalgin, A.Y.; Nijmeijer, A.; Roozeboom, F.; Luiten-Olieman, M.W.J. Atmospheric-Pressure Atomic Layer Deposition: Recent Applications and New Emerging Applications in High-Porosity/3D Materials. Dalton Trans. 2023, 52, 10254–10277. [Google Scholar] [CrossRef] [PubMed]
  12. Weber, M.; Boysen, N.; Graniel, O.; Sekkat, A.; Dussarrat, C.; Wiff, P.; Devi, A.; Muñoz-Rojas, D. Assessing the Environmental Impact of Atomic Layer Deposition (ALD) Processes and Pathways to Lower It. ACS Mater. Au 2023, 3, 274–298. [Google Scholar] [CrossRef] [PubMed]
  13. Valdesueiro, D.; Meesters, G.M.H.; Kreutzer, M.T.; van Ommen, J.R. Gas-Phase Deposition of Ultrathin Alumin-ium Oxide Films on Nanoparticles at Ambient Conditions. Materials 2015, 8, 1249–1263. [Google Scholar] [CrossRef]
  14. Shang, R.; Goulas, A.; Tang, C.Y.; de Frias Serra, X.; Rietveld, L.C.; Heijman, S.G.J. Atmospheric Pressure Atomic Layer Deposition for Tight Ceramic Nanofiltration Membranes: Synthesis and Application in Water Purification. J. Memb. Sci. 2017, 528, 163–170. [Google Scholar] [CrossRef]
  15. Van Bui, H.; Grillo, F.; van Ommen, J.R. Atomic and Molecular Layer Deposition: Off the Beaten Track. Chem. Commun. 2017, 53, 45–71. [Google Scholar] [CrossRef]
  16. Encapsulix. Available online: www.encapsulix.com (accessed on 4 April 2023).
  17. Patel, D.I.; Major, G.H.; Jacobsen, C.; Shah, D.; Strohmeier, B.R.; Shollenberger, D.; Bell, D.S.; Argyle, M.D.; Linford, M.R. Flow-Through Atmospheric Pressure-Atomic Layer Deposition Reactor for Thin-Film Deposition in Capillary Columns. Anal. Chem. 2022, 94, 7483–7491. [Google Scholar] [CrossRef] [PubMed]
  18. Toldra-Reig, F.; Weber, M.; Bechelany, M.; Muñoz-Rojas, D. Custom 3D Printed Spatial Atomic Layer Deposition Manifold for the Coating of Tubular Membranes. ACS Sustain. Chem. Eng. 2022, 10, 14112–14118. [Google Scholar] [CrossRef]
  19. George, S.M. Atomic Layer Deposition: An Overview. Chem. Rev. 2010, 110, 111–131. [Google Scholar] [CrossRef]
  20. Luiten, M.W.J.; Benes, N.E.; Huiskes, C.; Kruidhof, H.; Nijmeijer, A. Robust Method for Micro-Porous Silica Membrane Fabrication. J. Memb. Sci. 2010, 348, 1–5. [Google Scholar] [CrossRef]
  21. Bergman, T.L.; Lavine, A.S.; Incropera, F.P.; Dewitt, D.P. Fundamentals of Heat and Mass Transfer, 7th ed.; Wiley: Hoboken, NJ, USA, 2011; ISBN 9780470501979. [Google Scholar]
  22. Ogieglo, W. In-Situ Spectroscopic Ellipsometry for Studies of Thin Films and Membranes. Ph.D. Thesis, University of Twente, Enschede, The Netherlands, 2014. [Google Scholar]
  23. Barr, T.L.; Seal, S. Nature of the Use of Adventitious Carbon as a Binding Energy Standard. J. Vac. Sci. Technol. A Vac. Surf. Film. 1995, 13, 1239–1246. [Google Scholar] [CrossRef]
  24. van Gestel, T.; Sebold, D. Hydrothermally Stable Mesoporous ZrO2 Membranes Prepared by a Facile Nanoparticle Deposition Process. Sep. Purif. Technol. 2019, 221, 399–407. [Google Scholar] [CrossRef]
  25. Cao, G.Z.; Meijerink, J.; Brinkman, H.W.; Burggraaf, A.J. Permporometry Study on the Size Distribution of Active Pores in Porous Ceramic Membranes. J. Memb. Sci. 1993, 83, 221–235. [Google Scholar] [CrossRef]
  26. Elshof, M.G.; Maaskant, E.; Hempenius, M.A.; Benes, N.E. Poly(Aryl Cyanurate)-Based Thin-Film Composite Nanofiltration Membranes. ACS Appl. Polym. Mater. 2021, 3, 2385–2392. [Google Scholar] [CrossRef]
  27. Cremers, V.; Puurunen, R.L.; Dendooven, J. Conformality in Atomic Layer Deposition: Current Status Overview of Analysis and Modelling. Appl. Phys. Rev. 2019, 6, 021302. [Google Scholar] [CrossRef]
  28. Niemelä, J.; Marin, G.; Karppinen, M. Titanium Dioxide Thin Films by Atomic Layer Deposition: A Review. Semicond. Sci. Technol. 2017, 32, 093005. [Google Scholar] [CrossRef]
  29. Porro, S.; Jasmin, A.; Bejtka, K.; Conti, D.; Perrone, D.; Guastella, S.; Pirri, C.F.; Chiolerio, A.; Ricciardi, C. Low-Temperature Atomic Layer Deposition of TiO2 Thin Layers for the Processing of Memristive Devices. J. Vac. Sci. Technol. A Vac. Surf. Film. 2016, 34, 01A147. [Google Scholar] [CrossRef]
  30. Jolivet, A.; Labbé, C.; Frilay, C.; Debieu, O.; Marie, P.; Horcholle, B.; Lemarié, F.; Portier, X.; Grygiel, C.; Duprey, S.; et al. Structural, Optical, and Electrical Properties of TiO2 Thin Films Deposited by ALD: Impact of the Substrate, the Deposited Thickness and the Deposition Temperature. Appl. Surf. Sci. 2023, 608, 155214. [Google Scholar] [CrossRef]
  31. Aarik, J.; Aidla, A.; Mändar, H.; Uustare, T. Atomic Layer Deposition of Titanium Dioxide from TiCl4 and H2O: Investigation of Growth Mechanism. Appl. Surf. Sci. 2001, 172, 148–158. [Google Scholar] [CrossRef]
  32. Sammelselg, V.; Aarik, J.; Aidla, A.; Kasikov, A.; Heikinheimo, E.; Peussa, M.; Niinistö, L. Composition and Thickness Determination of Thin Oxide Films: Comparison of Different Programs and Methods. J. Anal. At. Spectrom. 1999, 14, 523–527. [Google Scholar] [CrossRef]
  33. Saric, I.; Peter, R.; Piltaver, I.K.; Badovinac, I.J.; Salamon, K.; Petravic, M. Residual Chlorine in TiO2 Films Grown at Low Temperatures by Plasma Enhanced Atomic Layer Deposition. Thin Solid Films 2017, 628, 142–147. [Google Scholar] [CrossRef]
  34. Knoops, H.C.M.; Langereis, E.; van de Sanden, M.C.M.; Kessels, W.M.M. Conformality of Plasma-Assisted ALD: Physical Processes and Modeling. J. Electrochem. Soc. 2010, 157, G241. [Google Scholar] [CrossRef]
Figure 1. Schematic drawing of gas lines in the atmospheric-pressure ALD reactor. The grey areas on the membrane tube indicate the approximate length of the glass seals on the inside and outside of the membrane tube. The black dots indicate the positioning of the O-rings providing the seal between the feed/permeate side of the membrane. The dotted area around the membrane tube represents the annular volume in the stainless-steel module, where a nitrogen flow takes away eventually permeated precursors and reaction products. The lengths of the membrane tube and reactor module are adaptable between 5 and 50 cm. In the lines behind the reactor, a pressure indicator (PI) and a valve (V5) are installed for the in-line permeance tests.
Separations 11 00024 g001
Figure 2. Schematic of a silicon strip that is located inside the ALD reactor during deposition and inspected ex situ at the five spots, indicated in yellow, to measure layer thicknesses.
Separations 11 00024 g002
Figure 3. GPC as a function of the tube length and nitrogen carrier gas flow on planar silicon substrates, measured using ex situ spectroscopic ellipsometry. (T = 125 °C, 300 cycles, 1 s pulse times, 29 s purge times). The connecting lines serve as a guide to the eye.
Separations 11 00024 g003
Figure 4. The GPC of measurement points 2–5 on the silicon wafer strips as a function of purge time. (T = 125 °C, 300 cycles, 150 mL min−1 carrier gas flows, 1 s pulses). Note that the error bar for the point at 150 s is present but falls within the square marker. The connecting line serves as a guide to the eye.
Separations 11 00024 g004
Figure 5. TiO2 GPC as a function of deposition temperature in the AP-ALD setup. The growth rate of this precursor and co-reactant decreases with increasing TD (300 cycles, 1 s pulses, 150 mL min−1 carrier gas flows, 150 s purge times). The connecting line serves as a guide to the eye.
Separations 11 00024 g005
Figure 6. (a) Tilted SEM image of a layer of γ-alumina coated onto α alumina support. The supports have a pore width of approximately 80 nm. (b) Pore width and respective standard deviation for five batches of planar dip-coated γ-alumina membranes.
Separations 11 00024 g006
Figure 7. Pore widths before and after 12 cycles of temporal ALD deposition as plotted for 7 planar membranes together with the difference in pore width.
Separations 11 00024 g007
Figure 8. Polyethylene glycol MWCO plots of planar membranes modified with 25 and 50 TiO2 temporal ALD cycles. (a) 25 cycles, (b) 50 cycles, and (c) the relationship of MWCO with deposition cycles. The results of panes (a,b) were corrected for defects using the method developed by Kramer [4] for a fair comparison.
Separations 11 00024 g008
Figure 9. In-line gas permeation test during ALD experiments. All samples show an initial plateau region, followed by an increasingly steep drop in permeance, after which the permeance sharply levels off into a new final plateau again. The process/analysis conditions and substrates for these six experiments were identical. The key properties of the membranes used here are also shown in Table 1.
Separations 11 00024 g009
Figure 10. Elemental depth profile made using XPS measurements and intermittent steps of Ar+ sputtering.
Separations 11 00024 g010
Table 1. Pore size, initial permeance, final permeance, and number of performed cycles.
Sample No. (-)Pore Width before ALD (nm)Initial Permeance
(*× 10−6 mol m−2 Pa−1 s−1)
Final Permeance
(×10−8 mol m−2 Pa−1 s−1)
Cycles
(-)
12.62.11527
22.92.23.223
32.82.25.623
42.82.31227
52.72.06.630
62.62.15.324
Disclaimer/Publisher’s Note: The statements, opinions and data contained in all publications are solely those of the individual author(s) and contributor(s) and not of MDPI and/or the editor(s). MDPI and/or the editor(s) disclaim responsibility for any injury to people or property resulting from any ideas, methods, instructions or products referred to in the content.