Abstract
Therapeutic antibodies are an area of major interest in treating infectious diseases, autoimmune diseases, and cancer. Efficient purification strategies are required to discover and produce antibodies, representing a significant cost driver. Miniaturization and automation of the chromatographic purification process may contribute to cost reduction. In this article, miniaturized chromatographic columns and 96-well filter plates are used to purify an IgG antibody from cell cultures and are compared in terms of quality, cost, and sustainability. The validation results of the two miniaturized chromatographic antibody purification methods indicate high efficacy and are comparable except for minor differences in yield. The lowest cost per sample can be obtained with the miniaturized chromatographic columns, as annual throughput can be maximized with the miniaturized plates. By evaluating sustainability, significant reductions in laboratory waste produced during antibody purification can be shown, along with an increase in employee safety by using the automation system. Overall, the comparison of results shows that, in the development of new purification strategies, the type of implementation has a decisive influence on the outcomes in terms of recovery, cost-effectiveness, and sustainability.
1. Introduction
In the treatment of cancer, autoimmune diseases, and infectious diseases, therapeutic antibodies play a crucial role [1,2,3,4,5]. Due to their high target tissue specificity, antibodies have fewer side effects than systemically acting small molecule drugs [6]. With the background of a growing pharmaceutical market, due to an aging world population and a rising living standard, a further increase in sales to USD 300 billion is expected by 2025 [7,8,9]. The most widely used antibody isotype is immunoglobulin G (IgG) due to its long bioavailability and stability [10]. Antibody engineering technologies include hybridoma technology [11], phage display technology [12], and single B cell technology [13].
Antibodies are produced in bioreactors with increasing yields resulting from better production strategies while maintaining high quality [14,15]. Typical antibody titers in cell culture reactors range from 1 mg/mL to 10 mg/mL [16,17]. At the same time, more and more efficient purification strategies are also needed [18].
A typical strategy for the purification of antibodies from a cell culture broth involves the rough removal of cell residues by centrifugation or filtration and a subsequent targeted chromatographic purification with one to three chromatographic steps. A particularly frequently used chromatographic variant is protein A chromatography due to its efficiency, also referred to as the capture step, after which antibodies can already be present with a purity of 90% [19,20,21,22,23,24]. Miniaturization of the chromatographic step and the specific use of an automation system can further increase efficiency in terms of throughput and consumption of sample material and solvents. Potential disadvantages of chromatographic miniaturization include lower loading capacities, a higher influence of wall effects, lower resolution due to a reduction in the number of theoretical plates, and a higher risk of clogging [25,26]. Several miniaturized chromatographic formats exist: miniaturized columns [25,27,28], 96-well filter plates [29,30] and miniaturized tips [31,32,33]. These miniaturized chromatographic formats have distinct advantages and disadvantages due to their physical form and processing options.
Miniaturized chromatographic columns are the format closest to packed chromatographic columns (manufacturing scale). Numerous application examples and comparisons with scale-up formats exist [18,34,35,36,37,38]. Differences arise due to a discontinuous flow during the dispensing of the buffer, sample, and elution solutions, as the syringe size limits the flow. Online analysis of all elution fractions is not possible. Nevertheless, Keller et al. showed that miniaturized chromatographic columns are suitable as scale-down models for packed chromatographic columns and for small-scale antibody purification [34] by using a simulation to predict chromatographic behavior. Miniaturized chromatographic tips enable bidirectional liquid flow through multiple aspiration and dispensing steps, resulting in high capacities and recovery rates [38,39]. However, the relative standard deviation (RSD) was found to be larger compared to packed columns [32,40].
Miniaturized chromatographic plates in the 96-well plate format are often the starting point for the development of new chromatographic purification processes, as they can be used to rapidly test different conditions (e.g., buffer, pH, resin) in parallel [41,42,43,44,45]. Flow is generated using vacuum filtration, centrifugation, or positive pressure [29,46,47]. Like the previously mentioned formats, the wells of the filter plate can be processed in parallel. The processing can be automated, which leads to a further increase in efficiency. Liquid-handling systems are used for automation [48,49,50].
Even though several automated antibody purification methods with liquid-handling systems have been developed [27,28,36,37], the demand for efficient antibody purification strategies is high in the growing therapeutic antibody market. Besides high-quality purification strategies to meet regulatory requirements and the minimization of costs as a requirement of healthcare systems, sustainability as a requirement of society for the pharmaceutical industry is increasingly gaining importance [51,52].
Optimal exploitation of the strengths of the different miniaturized chromatographic lab formats presented may assist in addressing the multi-layered requirements. For this reason, in this article, two different miniaturized chromatographic labware formats, RoboColumns and 96-Well Predictor Plates, are used to develop an automated purification strategy for the IgG antibody and compare the results in terms of quality, cost and sustainability. To assess the quality of the methods, validation experiments are performed to determine the trueness, precision, and sensitivity of the method [53]. To assess the economic efficiency of the methods, parameters such as cost per sample, net present value, throughput, or turnaround time can be used [54,55]. Here, the cost per sample is used as a decision criterion. To evaluate the sustainability, different approaches exist, such as the Green Analytical Procedure Index (GAPI) [56], the E-Factor [57], the National Environmental Methods Index (NEMI) [58], the Analytical GREEnness Metric approach (AGREE) [59] and the hexagon CALIFICAMET [60]. All approaches are based on the 12 principles of green analytical chemistry [61]. To assess sustainability, criteria related to the principles presented in the literature, such as miniaturization and automation, grade of reusability, waste volume and plastic waste reduction are used here. By evaluating the methods developed from three different perspectives, the generation of a comprehensive and holistic impression is intended, revealing further potential for improvement regarding method parameters or automation.
2. Materials and Methods
2.1. Chemicals and Reagents
The human IgG antibody (reagent-grade, salt-free, lyophilized powder), which was used as a sample for chromatographic purification, was prepared in the cell culture medium (Dulbecco’s Modified Eagle Medium (1X) + GlutaMax (DMEM; Fisher Scientific, Schwerte, Germany) containing HeLa cells cultured at the Center for Life Science Automation (University of Rostock, Rostock, Germany) at a concentration of 2 mg/mL. Reagents such as Dulbecco’s Phosphate Buffered Saline (PBS buffer), deionized water, sodium hydroxide pellets and the IgG antibody were obtained from Sigma Aldrich (Darmstadt, Germany). Sodium acetate anhydrous was obtained from Fisher Scientific (Schwerte, Germany). Acetic acid (Rotipuran 100%) and ethanol (Rotisolv HPLC Gradient Grade) were obtained from Carl Roth (Karlsruhe, Germany).
2.2. Antibody Purification Process
The general process for the purification of IgG antibodies from a cell culture broth using miniaturized chromatographic columns and plates consists of a coarse cleaning centrifugation step to remove cell debris and a subsequent affinity chromatographic separation. The initial parameters for centrifugation were 240 s at 3000× g. Subsequently, the chromatographic separation was started with the removal of the storage solution from the 96-well filter plates by pressurizing the plate for 60 s. The filter pressure pF of the used Positive Pressure Extractor (amplius, Rostock, Germany) was 500 mbar, and the clamp pressure pC was 4000 mbar. Droplets adhering to the bottom of the filter plate were removed in the blotting step, which was repeated after each Positive Pressure step. This was followed by the equilibration of the chromatographic material. The plates were equilibrated with 600 µL PBS buffer in 3 steps. After volume application, the plates were shaken for 60 s at 1100 rpm and transferred to the Positive Pressure device. A pF/pC 650/4000 mbar was applied for 20 s. Due to the higher column volume, the columns were equilibrated with 2400 µL PBS buffer in four steps. Following equilibration, the plates and columns were loaded with 200 µL and 600 µL of centrifuged IgG cell culture broth, respectively. Sample loading and all further solvent transfers using the fixed tips were performed very slowly to allow interaction of the analyte with the chromatographic material. In addition, an incubation time of 900 s was used after sample loading. The incubation time with the miniaturized plates was determined experimentally. For optimal yields, an incubation time of 7200 s was needed.
During incubation, constant shaking was applied at 1100 rpm. Afterward, un-bound matrix components were removed using two washing steps. In the first wash step, a volume of 330 µL PBS buffer was used for the plates, and 1000 µL of the same buffer was used for the columns. The second wash step consisted of 40 µL sodium acetate buffer at pH 6 for both chromatographic formats. The elution of the IgG antibody was performed with 600 µL sodium acetate buffer at pH 3.5 for the columns and a double elution of 200 µL sodium acetate buffer at pH 3.5 for the plates, since experiments revealed that one elution step was not sufficient to desorb the whole IgG content.
After elution, 100 µL of the purified sample was transferred to a UV-suitable microplate, and the IgG content was determined spectrophotometrically (see Section 2.3). In contrast to the single use of miniaturized plates, the miniaturized chromatographic columns can be used multiple times. Before reuse, the resin undergoes purification by the addition of 200 µL of acetic acid and 600 µL of 0.5 M sodium hydroxide. Between runs, a storage solution (20% ethanol in water) was transferred to the columns. The purification processes for the miniaturized columns and plates are shown in Figure 1.
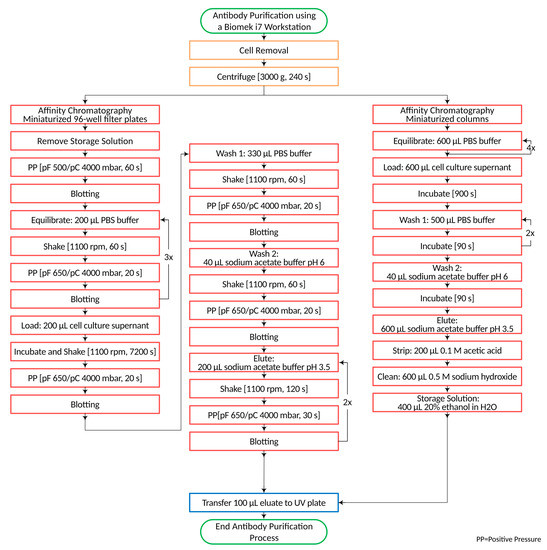
Figure 1.
Antibody purification process from cell cultures using predictor plates or RoboColumns.
2.3. Determination of Protein Concentration
Protein quantification was conducted using 384-well UV Star microtiter plates made of cycloolefine with a flat bottom and a total capacity of 110 µL (Greiner Bio-One, Frickenhausen, Germany). A fixed volume of 100 µL eluate was transferred into each well using the liquid-handling workstation to ensure consistency. A Pherastar Spectrophotometer (BMG Labtech, Ortenberg, Germany) was used to determine the absorbance of IgG at 280 nm. For calibration, IgG standard samples were dissolved in sodium acetate at pH 3.5 between 0.06 and 2 mg/mL.
2.4. Labware and Deck Layout
For the comparison of the two miniaturized chromatographic labware formats, the 96-well Predictor Plates Mab Select PrismA, 6 µL, and the Mab Select PrismA RoboColumns, 200 µL, (both: Cytiva Life Sciences, Uppsala, Germany) were used, arranged in SBS microtiter plate format. All RoboColumns were positioned on the RoboColumn Unit (amplius, Rostock, Germany) for automated processing by a liquid-handling robot (Biomek i7 Liquid-Handling Workstation, Beckman Coulter Life Sciences, Indianapolis, IN, USA).
Sample cell culture broth containing IgG antibodies was provided in 6 mL 12-well cell culture plates (Sarstedt, Nümbrecht, Germany) on the deck of the Liquid-Handling Workstation. Solvents were provided in 300 mL Nunc reservoirs (Thermo Fisher Scientific, Waltham, MA, USA) or in 40 mL reservoirs (Beckman Coulter Life Sciences, Indianapolis, IN, USA) inside a self-refilling quarter reservoir device.
Elution fractions were collected in 96-well Brand Deepwell plates (Sigma Aldrich, St. Louis, MO, USA). To reduce evaporation, cell culture plates and predictor plates were covered with lids during the incubation (Sigma-Aldrich, St. Louis, MO, USA). After solvent removal of the Predictor plates by pressurization, droplets may appear at the bottom of the filter plate, which should be removed by blotting the bottom. To realize the blotting in accordance with the manual procedure, the wipes, which absorb the droplets, were fixed on the deck with a specially designed blotting adapter. To avoid cross-contamination caused by solvent draining down the walls of the Deepwell plate due to direct contact between the two plates, a spacer adapter was used to increase the distance. The deck layouts for antibody purification using the RoboColumns and the Predictor Plates on the liquid-handling workstation are shown in Figure 2.
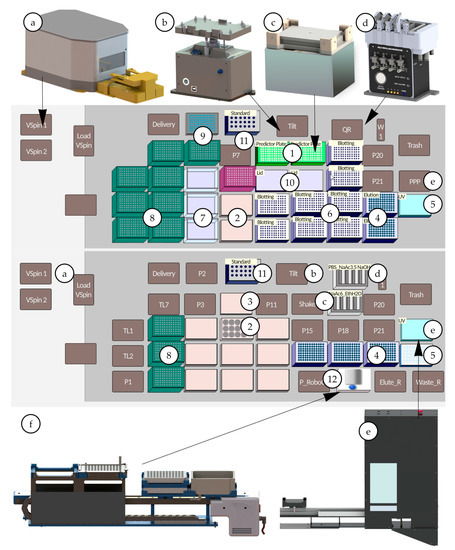
Figure 2.
Deck layout, special devices and adapter for IgG purification from cell culture media and cell culture supernatant—(a) VSpin centrifuge (Agilent technologies, Santa Clara, CA, USA), (b) 3D Tilting Unit (amplius GmbH, Rostock, Germany), (c) Shaking Peltier ALP (Inheco, Martinsried, Germany), (d) Self-Refilling Quarter Reservoir (amplius GmbH, Rostock, Germany) (e) Positive Pressure Extractor (amplius GmbH, Rostock, Germany), (f) RoboColumn Unit (amplius GmbH, Rostock, Germany) (1) Mab Select PrismA Predictor Plates (Cytiva Life Sciences, Uppsala, Germany), (2) IgG samples in cell culture broth in a 12-well cell culture plate, (3) lid, (4) 96-deep well plate (with Spacer Adapter) (5) 384-well UV detection plate and lid, (6) plate/adapter for blotting, (7) additional solvent reservoir for MC-Head, (8) 230 µL tips, (9) 96-well plate, (10) lid, (11) standard IgG samples in 1.5 mL standard vials stored in an adapter made of aluminum, (12) Mab Select PrismA RoboColumns (Cytiva Life Sciences, Uppsala, Germany).
2.5. Automation System
The antibody purification process was automated using a Biomek i7 Hybrid Liquid-Handling Workstation (Beckman Coulter Life Sciences, Indianapolis, IN, USA). The hybrid Liquid-Handling Workstation was equipped with one 300 µL 96 Multichannel Head and a Span-8 Pod. The Span-8 Pod was used with fixed tips and 1 mL syringes. The fixed tips were necessary to pierce the sealing rings of the RoboColumns. Processing the RoboColumns with disposable tips was tested and abandoned, due to an irregular volumetric flow. The RoboColumns were positioned on a device specially designed for automated processing of the RoboColumns. The RoboColumn Unit (amplius GmbH, Rostock, Germany) consists of a position for the placement of the columns in 12 columns and 8 rows. A sliding carriage underneath the columns allows the collection of elution fractions in standard microtiter plates up to Deepwell plates. In addition, a fixation board is installed above the columns to prevent the columns from being pulled out after volume delivery by the Span-8 Pod. For other labware movements, two grippers were integrated. To automate the entire antibody purification process, additional equipment was integrated into the automation system, including a centrifuge (VSpin Centrifuge, Agilent Technologies, Santa Clara, CA, USA), a thermoshaker (Inheco Industrial Heating and Cooling GmbH, Martinsried, Germany), a Self-Refilling Quarter Reservoir for precise delivery of high or volatile solvent amounts, a 3D Tilting Unit for complete removal of cell supernatant, and a Positive Pressure Extractor (all: amplius GmbH, Rostock, Germany) for filtration of Predictor Plates (refer to Figure 2 for an overview). Figure 3 shows the pipetting on the RoboColumn Unit and the aspiration of the cell culture supernatant on the 3D Tilting Unit, as well as a picture of the deck populated for the preparation of up to 192 samples.
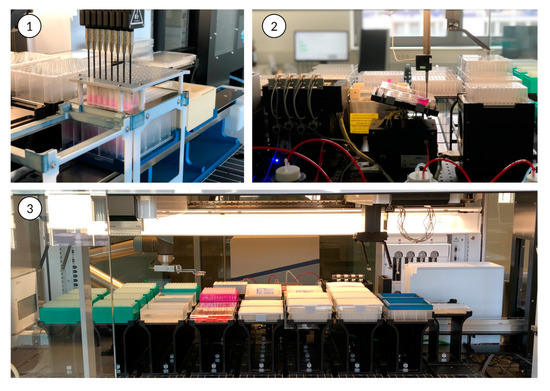
Figure 3.
Pictures of the automation system: (1) Pipetting on RoboColumns on RoboColumn Unit; (2) Transfer of cell culture supernatant/load sample onto 3D Tilting Unit; (3) Deck layout for IgG purification with Predictor Plates.
3. Results
3.1. Methodological Validation
Validation experiments were performed to evaluate the quality of the purification of IgG from a cell culture broth. The repeatability was determined by purifying and measuring 16 independent samples with the automation system to test the precision and reproducibility of sample preparation. Additionally, recovery rates were determined in this experiment. The expected concentration was 1 mg/mL. To verify the reproducibility and stability of these results in the longer term, the within-laboratory precision was determined by preparing and measuring eight independent samples on five days. The limits of detection (LOD) and quantification (LOQ) were determined by preparing and measuring eight blank samples without IgG, calculating the average, and adding the standard deviation (SD) three and ten times for LOD and LOQ, respectively. In the validation of IgG purification with the Predictor Plates, the methodological LOD and LOQ were calculated due to the dilution factor caused by the twofold elution. The precision of the spectrophotometer was determined by measuring one sample eight times [53]. To exclude interferences by cells or cell components from cell culture, the validation experiments were repeated for the purification of the antibody from a neat cell culture medium.
The recovery rates determined during validation ranged from 82% to 99% with an RSD of 5.28% for the RoboColumns (see Table 1). The recovery rates of the Predictor Plates were slightly lower, with an average of 85%. The range varied from 75% to 96%, with a correspondingly higher RSD of 6.24%. The higher recovery rates for the RoboColumns can result from the higher binding capacity of the larger resin volume of the RoboColumns of 200 µL compared to the 6 µL of the Predictor Plates.

Table 1.
Validation results for IgG from cell culture broth.
The repeatability of the RoboColumns from cell culture broth ranged from 0.82 mg/mL to 0.99 mg/mL, with an SD of 0.048 mg/mL. Contrary to expectation, the distribution of measurement values in the purification from cell culture broth with the RoboColumns was slightly reduced, as the SD for purification from neat cell culture medium was 0.073 mg/mL. Values ranged from 0.75 mg/mL to 1.04 mg/mL. Using the Predictor Plates, the distribution of measurement values for purification from neat cell culture broth was lower with 0.044 mg/mL and a result range of 0.72 mg/mL to 0.87 mg/mL. In comparison, the IgG purification from cell culture broth ranged from 0.74 mg/mL to 0.97 mg/mL with an SD of 0.053 mg/mL. The repeatability results are comparatively presented in a box plot diagram in Figure 4. Overall, the differences between the media are insignificant, and therefore interference from the cells with the purification were excluded. The recovery rates determined in the within-laboratory precision experiment ranged from 85% to 94%, with RSDs between 3.39% and 6.74% for the RoboColumns and from 81% to 90%, and RSDs between 5.24% and 6.19% for the Predictor Plates. Thus, the results of both labware formats are very similar and support the previously presented repeatability results. The analytical detection and quantitation limits of both labware formats are similar, with LODs and LOQs of 0.03 mg/mL and 0.07 mg/mL for the RoboColumns and 0.03 mg/mL and 0.08 mg/mL for the Predictor Plates. The twofold elution volume required with the Predictor Plates increased the methodological LOD and LOQ to 0.06 mg/mL and 0.17 mg/mL, respectively. Overall, the results of the validations indicate a high precision and robustness of both developed methods. Yields were within the expected range of an affinity chromatographic capture step of about 90% [19,22,23].
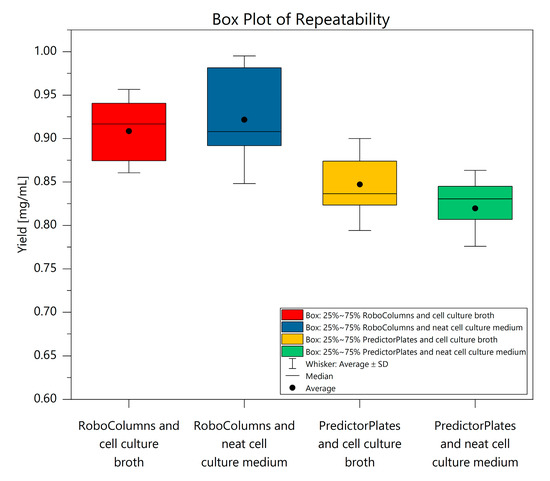
Figure 4.
Comparison of repeatability for IgG purification from cell culture medium and cell culture broth.
3.2. Economic Evaluation
A cost comparison calculation was carried out for the two labware formats for economic evaluation. The result was the costs per sample, resulting from the sum of the operating costs and capital expenses of the investment in the automation system, as well as the possible throughput. The payback period was used to evaluate the risk of the investment. The net present value (NPV) was formed as the sum of the discounted cash flows and the investment volume for the automation system. The interest rate chosen was 1% over a period of 10 years. This value, as well as all other numerical values given in the economic evaluation, were kept as close as possible to reality, but need to be adjusted for each company and its respective situation and were only used for the numerical comparison and illustration of the dimensions. A more detailed description of the profitability calculation can be found in [55].
The development of the automated method was carried out under the constraint of cost-per-sample optimization. With the Predictor Plates, a maximum of 192 samples can be purified in one run with a fully occupied deck (see Table 2). The cycle time was 4.42 h. This results in a maximum possible number of samples of 230.4 K per year, assuming an operating time of 120 continuous hours over 50 weeks annually. With the operating and capital costs, the total cost of the method is EUR 973,429, which is high compared to the RoboColumns due to a high annual throughput. The resulting cost per sample was, accordingly, EUR 4.22. Compared to a half-maximum deck utilization with 96 samples per run, the cost of EUR 5.10 can thus be decreased by 17.3%.
Table 2.
Results of an economic evaluation comparing RoboColumns and Predictor Plates.
When using the RoboColumns, the lowest cost per sample of EUR 2.46 was achieved with the purification of 288 samples in one run. However, up to 480 samples can be purified in one run with the automation system, thus increasing walk-away time (see Table 3). The walk-away time here refers to the turnaround time of the automation system for the preparation of x samples. Nevertheless, the highest sample rate per year of 33.6 K can be achieved with the preparation of 96 samples in one run, optimizing the net present value (NPV) at the same time and amounting to EUR 7.2 million after ten years with the preparation of 96 samples in one run.
Table 3.
Process comparison using different throughputs per run with RoboColumns.
With a smaller number of full possible runs per related work time unit with an increasing turnaround time of an increasing number of samples per deck, throughput decreases, also reducing the net present value. Although this may not seem obvious at first glance, in the case of the RoboColumns and the assumed working time of the liquid-handling workstation for economic evaluation, the ratio between the number of samples, working time and non-productive time can be optimized by lowering the throughput times, allowing for a more efficient use of gaps in the remaining working time. A particularly unfavorable variant from an economic perspective is the purification of 384 samples in one run. Here, due to the small number of full possible runs per related work time unit, the highest costs per sample of EUR 3.23 emerge. These are still lower in comparison with the Predictor Plates, but also the NPV of EUR 3.9 M is significantly lower than that of the Predictor Plates of EUR 49.32 M. The low purification cost when using RoboColumns is due to the possibility of re-purifying the columns, whereas the Predictor Plates were used as simple consumables. The lower NPV of the RoboColumns results in a reduced annual number of samples, which in turn depends on the turnaround time. The high turnaround time of the RoboColumns compared to the processing time of the Predictor Plates results from the slow flow rates to allow optimal interaction between chromatographic material, analyte, and buffer. Nevertheless, all NPVs are positive, which is why, ultimately, all the high throughput is economically feasible. The payback period is shorter than one year, indicating a low investment risk for the automation system.
3.3. Sustainability Assessment
To evaluate the sustainability of the methods presented here, the parameter miniaturization and automation, sample volume, reduction of employee presence in the laboratory, sample per hour, use of hazardous solvents, use of environmentally friendly/recyclable solvents, waste volume, plastic waste and grade of reusability, which refer to the principles of green analytical chemistry, were used according to the literature. Then, the results were normalized with the functions proposed by Pereira et al. between 0 (“not environmentally friendly”: color code red) and 1 (“environmentally friendly: color code green) to allow evaluability of the results without a comparative method [59]. For example, sample size was divided into four categories: ultramicroanalysis with a sample volume of < 1 µL, microanalysis with a sample volume of 1–10 µL, semimicroanalysis with a sample volume of 10–100, and macroanalysis with a sample volume > 100 µL. Samples with a volume of < 100 µL were rated as green by the authors, whereas sample volumes of 100 mL were red. The seventh principle of GAC is waste avoidance and is normalized similarly to the sample volume. Methods that produce less than 0.1 g (or mL) of waste were rated 1, 100 g (mL) 0.1. In between are the 10 g (mL) and 25 g (mL) levels, which were rated red with 0.4 and 0.25, respectively, as rather environmentally unfriendly. The sample throughput per hour was evaluated using the eighth principle. More than 70 samples per hour was rated by the authors as green, less than 15 samples per hour as yellow. One sample per hour and less was rated as red. Normalization of the use of hazardous solvents was performed similar to the second and seventh principles. The amounts of 44 mL (or g) and above of substances that cause harm by inhalation, ingestion or skin contact was categorized as environmentally unfriendly. Less than 1.8 mL was classed as little harmful and less than 70 µL as environmentally friendly, and therefore green (11th principle). To apply these principles, the respective volumes, weights, quantities and times of the purification processes were determined.
Both RoboColumns and Predictor Plates are miniaturized chromatographic formats that are processed in an automated way, which is why they were scored as 1. The RoboColumns have a larger sample volume (600 µL) than the Predictor Plates (200 µL), so the normalized result for the Predictor Plates is 0.88, which is more environmentally friendly than the 0.72 of the RoboColumns (see Table 4). Using the automation system can reduce the staff presence in the laboratory between 87% and 99% for the Predictor Plates and RoboColumns, respectively. Based on profitability assessment, the selected throughput of 288 samples of the RoboColumns leads to a higher reduction of staff presence in the laboratory. The lower throughput with the RoboColumns, six samples per hour, compared to 43 samples per hour with the Predictor Plates, leads to a normalized score of 0.39 and 0.86, respectively. Due to the clean-up process for the RoboColumns with sodium hydroxide and acetic acid, the percentage of hazardous solvents is increased by 7%. As a result of the higher resin volume, the amount of solvent used to process the RoboColumns is also increased, which is reflected in a Waste Volume of 7.42 mL per sample compared to the 2.57 mL with the Predictor Plates. In contrast, the reusability of the RoboColumns and the small labware consumption leads to a decrease in plastic waste generation of nearly 50%. Ultimately, the degree of reusability increases from 4% to 27% with the RoboColumns.
Table 4.
Results of sustainability assessment.
4. Discussion
IgG purification using Protein A chromatography is a resource-intensive process [19,21,22,23]. This is supported by the results of the economic analysis, as the purification of IgG samples requires a large amount of resources such as time, solvent, labware and personnel, or the automation system, compared to metrological determination with an optical reader. Therefore, the methods presented were optimized with the aim to achieve the highest possible quality and the lowest possible cost per sample. Additionally, special attention is necessary to develop sustainable solutions with minor environmental impacts to meet societal demands [51,52].
With the miniaturized plates, up to 192 samples can be prepared in one run. The cost per sample is EUR 4.22. With the miniaturized chromatographic columns, the throughput can be increased up to 480 samples in one run. The costs per sample are the lowest when processing 288 samples, at EUR 2.46. The results of the validations of the two miniaturized chromatographic purification processes of IgG from a cell culture supernatant show high precision and robustness, with RSDs ≤ 6.74%. The recoveries with the Predictor Plates average 85%, and with the RoboColumns 91%, and are within the range of comparable methods [37,48,50]. The cell culture samples used were prepared at concentrations of 1 mg/mL or 2 mg/mL. The target concentration was 1 mg/mL IgG for both laboratory formats. The analytical and methodological limit of quantification of the RoboColumn method is 0.07 mg/mL. The methodological limit of quantitation of the Predictor Plates is higher at 0.17 mg/mL, due to the twofold elution. Hence, the developed methods provide suitable sensitivity and yields for small-scale detection, determination and purification of IgG from cell cultures [16,17,34].
To further increase recovery rates, larger resin volumes could be tested (e.g., 50 µL for the Predictor Plates or 600 µL for the RoboColumns) [18,37,47]. However, this would likely also require higher wash and elution volumes, increasing the solvent waste volume and the waste weight. Another possibility for investigation would be to increase the flow rate in the RoboColumns to increase throughput. Any impairment of the quality of the method due to analyte losses would have to be excluded. The presented workflows represent a solid compromise between recovery rate and lower environmental impact. Subsequent chromatographic steps, such as ion exchange chromatography for further polishing, are possible.
The results of the comparison of the sustainability assessment reflect the expectations for the two labware formats. The smaller resin volume of the Predictor Plates reduces solvent requirements, waste volume and necessary sample volume, demonstrating that miniaturization positively impacts the environmental friendliness of a method, as derived from green chemistry principles. Furthermore, the higher throughput of Predictor Plates per hour is explained by the labware format (43 samples compared to 6 samples, see Table 4). The microplate format in combination with the automation system, especially the 96-MC Head, significantly increases the parallelism of sample processing. A strong improvement of up to 99% in staff safety due to the reduction of employee presence in the laboratory and the associated lower exposition to hazardous solvents, noise, or the handling of aggressive chemicals is achieved using the automation system. Overall, the sustainability evaluation shows that sustainable, environmentally friendly results can already be achieved with both labware formats in aspects such as miniaturization and automation, the low sample volume, the proportion of environmentally friendly solvents and employee safety. However, concerning the degree of reusability or the plastic waste generated, the sustainability assessment also reveals potential for improving the methods. For example, the amount of plastic waste generated could be further reduced by increasing the use of fixed tips instead of disposable tips in the Predictor Plates. However, this may lead to a limitation of parallel processing of samples as well as the necessary additional washing steps, which would increase the turnaround time of the method, and thus cause a reduction in throughput. Additionally, a risk of cross-contamination exists. Careful consideration and investigation are necessary.
The evaluation of the economic efficiency clearly shows the different strengths of the two labware formats. With the objective of the highest possible throughput, using the Predictor Plates is advantageous due to their fast-processing capabilities. The annual throughput with the Predictor plates was 230.4 K, whereas 28.8 K samples per year can be processed with the RoboColumns. Correspondingly, the NPV is also high with EUR 49.32 M compared to EUR 6.28 M for the RoboColumns. However, there also must be a matching demand. Alternatively, the RoboColumns can be used with lower throughput and lower cost per sample while achieving higher yields.
5. Conclusions
With the background of the growing therapeutic antibody market, efficient purification strategies are needed. Here, two automated miniaturized chromatographic purification processes were developed for IgG purification from cell culture broth. The two labware formats show comparable results, with recovery rates between 85% and 91%. The precision of the developed methods is high, with RSDs < 7%, and robust against matrix components, as shown by comparison with purification from neat cell culture medium. The lowest cost per sample can be achieved with the RoboColumns and amounts to EUR 2.46. In comparison, the cost of the method using Predictor Plates is almost twice as high. The economic advantage of the Predictor Plates is achieved by the low turnaround time, which is reflected in an eightfold annual throughput of 230.4 K samples compared to the RoboColumns. The sustainability evaluation showed an increase in employee safety over 99% using the automation system. The use of the miniaturized labware formats has a positive influence on the sample volume used, and the solvent waste generated. The solvent waste can be reduced by a further 65% with the Predictor Plates compared to the RoboColumns. In contrast, the use of RoboColumns reduces the plastic waste generated by 50%. Simultaneously, both methods have the potential for improvement regarding the degree of reusability. Overall, the evaluation of the processes from different perspectives supports the optimal leveraging of the strengths of the different miniaturized chromatographic labware formats. An efficient and customer-specific process design can lead to a reduction in the development and manufacturing costs of the therapeutic antibodies through the reduction of purification costs, and thus ideally contribute to the broader accessibility of the highly specific drugs.
Author Contributions
Concept and methodology were developed by A.B. and K.T. Validation of methods was performed by A.B. and H.F. The original draft was written by A.B. and K.T. The project was managed and supervised by K.T. and H.F. Funding was obtained by K.T. and H.F. All authors have read and agreed to the published version of the manuscript.
Funding
This work is based on a bilateral cooperation contract between the Center for Life Science Automation/University of Rostock (Germany) and Beckman Coulter Life Sciences (Indianapolis, IN, USA).
Data Availability Statement
Additional data is available from the authors on request.
Acknowledgments
The authors wish to thank Thomas Roddelkopf, Lars Woinar, Heiko Engelhardt, Jan Hinnerichs, Sybille Horn, and Anne Reichelt for valuable input, discussions and technical support.
Conflicts of Interest
The authors declare no conflict of interest.
References
- Du, F.H.; Mills, E.A.; Mao-Draayer, Y. Next-generation anti-CD20 monoclonal antibodies in autoimmune disease treatment. Autoimmun. Highlights 2017, 8, 12. [Google Scholar] [CrossRef] [PubMed]
- Zhao, Q. Bispecific Antibodies for Autoimmune and Inflammatory Diseases: Clinical Progress to Date. BioDrugs 2020, 34, 111–119. [Google Scholar] [CrossRef]
- Scott, A.M.; Wolchok, J.D.; Old, L.J. Antibody therapy of cancer. Nat. Rev. Cancer 2012, 12, 278–287. [Google Scholar] [CrossRef]
- Walker, L.M.; Burton, D.R. Passive immunotherapy of viral infections: ‘super-antibodies’ enter the fray. Nat. Rev. Immunol. 2018, 18, 297–308. [Google Scholar] [CrossRef] [PubMed]
- Salazar, G.; Zhang, N.; Fu, T.M.; An, Z. Antibody therapies for the prevention and treatment of viral infections. NPJ Vaccines 2017, 2, 19. [Google Scholar] [CrossRef]
- An, Z. Monoclonal antibodies—A proven and rapidly expanding therapeutic modality for human diseases. Protein Cell 2010, 1, 319–330. [Google Scholar] [CrossRef]
- World Population Prospects 2022; United Nations, Department of Economic and Social Affairs, Population Division: New York, NY, USA, 2022.
- Ecker, D.M.; Jones, S.D.; Levine, H.L. The therapeutic monoclonal antibody market. mAbs 2015, 7, 9–14. [Google Scholar] [CrossRef] [PubMed]
- Lu, R.M.; Hwang, Y.C.; Liu, I.J.; Lee, C.C.; Tsai, H.Z.; Li, H.J.; Wu, H.C. Development of therapeutic antibodies for the treatment of diseases. J. Biomed. Sci. 2020, 27, 1. [Google Scholar] [CrossRef]
- Carter, P.J.; Lazar, G.A. Next generation antibody drugs: Pursuit of the ‘high-hanging fruit’. Nat. Rev. Drug Discov. 2018, 17, 197–223. [Google Scholar] [CrossRef]
- Kohler, G.; Milstein, C. Continuous cultures of fused cells secreting antibody of predefined specificity. Nature 1975, 256, 495–497. [Google Scholar] [CrossRef]
- Frenzel, A.; Schirrmann, T.; Hust, M. Phage display-derived human antibodies in clinical development and therapy. mAbs 2016, 8, 1177–1194. [Google Scholar] [CrossRef]
- Pedrioli, A.; Oxenius, A. Single B cell technologies for monoclonal antibody discovery. Trends Immunol. 2021, 42, 1143–1158. [Google Scholar] [CrossRef]
- Xu, S.; Gavin, J.; Jiang, R.; Chen, H. Bioreactor productivity and media cost comparison for different intensified cell culture processes. Biotechnol. Prog. 2017, 33, 867–878. [Google Scholar] [CrossRef]
- Yang, W.C.; Lu, J.; Kwiatkowski, C.; Yuan, H.; Kshirsagar, R.; Ryll, T.; Huang, Y.M. Perfusion seed cultures improve biopharmaceutical fed-batch production capacity and product quality. Biotechnol. Prog. 2014, 30, 616–625. [Google Scholar] [CrossRef] [PubMed]
- Sommerfeld, S.; Strube, J. Challenges in biotechnology production—Generic processes and process optimization for monoclonal antibodies. Chem. Eng. Process.-Process. Intensif. 2005, 44, 1123–1137. [Google Scholar] [CrossRef]
- Li, F.; Vijayasankaran, N.; Shen, A.Y.; Kiss, R.; Amanullah, A. Cell culture processes for monoclonal antibody production. mAbs 2010, 2, 466–479. [Google Scholar] [CrossRef]
- Treier, K.; Hansen, S.; Richter, C.; Diederich, P.; Hubbuch, J.; Lester, P. High-throughput methods for miniaturization and automation of monoclonal antibody purification processes. Biotechnol. Prog. 2012, 28, 723–732. [Google Scholar] [CrossRef]
- Gagnon, P. Technology trends in antibody purification. J. Chromatogr. A 2012, 1221, 57–70. [Google Scholar] [CrossRef]
- Grodzki, A.C.; Berenstein, E. Antibody Purification: Ion-Exchange Chromatography. Methods Mol. Biol. 2010, 588, 27–32. [Google Scholar] [CrossRef]
- Becker, W.; Scherer, A.; Faust, C.; Bauer, D.K.; Scholtes, S.; Rao, E.; Hofmann, J.; Schauder, R.; Langer, T. A fully automated three-step protein purification procedure for up to five samples using the NGC chromatography system. Protein Expr. Purif. 2019, 153, 1–6. [Google Scholar] [CrossRef]
- Ayyar, B.V.; Arora, S.; Murphy, C.; O’Kennedy, R. Affinity chromatography as a tool for antibody purification. Methods 2012, 56, 116–129. [Google Scholar] [CrossRef]
- Zhang, Q.; Goetze, A.M.; Cui, H.; Wylie, J.; Tillotson, B.; Hewig, A.; Hall, M.P.; Flynn, G.C. Characterization of the co-elution of host cell proteins with monoclonal antibodies during protein A purification. Biotechnol. Prog. 2016, 32, 708–717. [Google Scholar] [CrossRef]
- Turner, R.; Joseph, A.; Titchener-Hooker, N.; Bender, J. Manufacturing of Proteins and Antibodies: Chapter Downstream Processing Technologies. Adv. Biochem. Eng. Biotechnol. 2018, 165, 95–114. [Google Scholar] [CrossRef] [PubMed]
- Welsh, J.P.; Petroff, M.G.; Rowicki, P.; Bao, H.; Linden, T.; Roush, D.J.; Pollard, J.M. A practical strategy for using miniature chromatography columns in a standardized high-throughput workflow for purification development of monoclonal antibodies. Biotechnol. Prog. 2014, 30, 626–635. [Google Scholar] [CrossRef]
- Lacki, K.M. High-throughput process development of chromatography steps: Advantages and limitations of different formats used. Biotechnol. J. 2012, 7, 1192–1202. [Google Scholar] [CrossRef] [PubMed]
- Wiendahl, M.; Schulze Wierling, P.; Nielsen, J.; Fomsgaard Christensen, D.; Krarup, J.; Staby, A.; Hubbuch, J. High Throughput Screening for the Design and Optimization of Chromatographic Processes—Miniaturization, Automation and Parallelization of Breakthrough and Elution Studies. Chem. Eng. Technol. 2008, 31, 893–903. [Google Scholar] [CrossRef]
- Wierling, P.S.; Bogumil, R.; Knieps-Grunhagen, E.; Hubbuch, J. High-throughput screening of packed-bed chromatography coupled with SELDI-TOF MS analysis: Monoclonal antibodies versus host cell protein. Biotechnol. Bioeng. 2007, 98, 440–450. [Google Scholar] [CrossRef]
- Susanto, A.; Treier, K.; Knieps-Grünhagen, E.; von Lieres, E.; Hubbuch, J. High Throughput Screening for the Design and Optimization of Chromatographic Processes: Automated Optimization of Chromatographic Phase Systems. Chem. Eng. Technol. 2009, 32, 140–154. [Google Scholar] [CrossRef]
- Hopp, J.; Pritchett, R.; Darlucio, M.; Ma, J.; Chou, J.H. Development of a high throughput protein a well-plate purification method for monoclonal antibodies. Biotechnol. Prog. 2009, 25, 1427–1432. [Google Scholar] [CrossRef] [PubMed]
- Chhatre, S.; Francis, R.; Bracewell, D.G.; Titchener-Hooker, N.J. An automated packed protein G micro-pipette tip assay for rapid quantification of polyclonal antibodies in ovine serum. J. Chromatogr. B 2010, 878, 3067–3075. [Google Scholar] [CrossRef] [PubMed]
- Balasundaram, B.; Chhatre, S.; Arora, D.; Titchener-Hooker, N.J.; Bracewell, D.G. Study of the conditions for multi-modal chromatographic capture of Fab′ from dual-salt precipitatedE. colihomogenate. J. Chem. Technol. Biotechnol. 2013, 88, 372–377. [Google Scholar] [CrossRef]
- Hopkins, R.; Esposito, D.; Gillette, W. Widening the bottleneck: Increasing success in protein expression and purification. J. Struct. Biol. 2010, 172, 14–20. [Google Scholar] [CrossRef]
- Keller, W.R.; Evans, S.T.; Ferreira, G.; Robbins, D.; Cramer, S.M. Use of MiniColumns for linear isotherm parameter estimation and prediction of benchtop column performance. J. Chromatogr. A 2015, 1418, 94–102. [Google Scholar] [CrossRef] [PubMed]
- Osberghaus, A.; Drechsel, K.; Hansen, S.; Hepbildikler, S.K.; Nath, S.; Haindl, M.; von Lieres, E.; Hubbuch, J. Model-integrated process development demonstrated on the optimization of a robotic cation exchange step. Chem. Eng. Sci. 2012, 76, 129–139. [Google Scholar] [CrossRef]
- Rezvani, K.; Smith, A.; Javed, J.; Keller, W.R.; Stewart, K.D.; Kim, L.; Newell, K.J. Demonstration of continuous gradient elution functionality with automated liquid handling systems for high-throughput purification process development. J. Chromatogr. A 2023, 1687, 463658. [Google Scholar] [CrossRef] [PubMed]
- Schmidt, P.M.; Abdo, M.; Butcher, R.E.; Yap, M.-Y.; Scotney, P.D.; Ramunno, M.L.; Martin-Roussety, G.; Owczarek, C.; Hardy, M.P.; Chen, C.-G.; et al. A robust robotic high-throughput antibody purification platform. J. Chromatogr. A 2016, 1455, 9–19. [Google Scholar] [CrossRef] [PubMed]
- Ogata, Y.; Quizon, P.M.; Nightlinger, N.S.; Sitasuwan, P.; Snodgrass, C.; Lee, L.A.; Meyer, J.D.; Rogers, R.S. Automated multi-attribute method sample preparation using high-throughput buffer exchange tips. Rapid Commun. Mass. Spectrom. 2022, 36, e9222. [Google Scholar] [CrossRef] [PubMed]
- Bos, A.B.; Luan, P.; Duque, J.N.; Reilly, D.; Harms, P.D.; Wong, A.W. Optimization and automation of an end-to-end high throughput microscale transient protein production process. Biotechnol. Bioeng. 2015, 112, 1832–1842. [Google Scholar] [CrossRef]
- Chhatre, S.; Bracewell, D.G.; Titchener-Hooker, N.J. A microscale approach for predicting the performance of chromatography columns used to recover therapeutic polyclonal antibodies. J. Chromatogr. A 2009, 1216, 7806–7815. [Google Scholar] [CrossRef] [PubMed]
- Bergander, T.; Nilsson-Välimaa, K.; Oberg, K.; Lacki, K.M. High-Throughput Process Development: Determination of Dynamic Binding Capacity Using Microtiter Filter Plates Filled with Chromatography Resin. Biotechnol. Prog. 2008, 24, 632–639. [Google Scholar] [CrossRef]
- Bhambure, R.; Kumar, K.; Rathore, A.S. High-throughput process development for biopharmaceutical drug substances. Trends Biotechnol. 2011, 29, 127–135. [Google Scholar] [CrossRef] [PubMed]
- Connell-Crowley, L.; Larimore, E.A.; Gillespie, R. Using high throughput screening to define virus clearance by chromatography resins. Biotechnol. Bioeng. 2013, 110, 1984–1994. [Google Scholar] [CrossRef]
- Kelley, B.D.; Switzer, M.; Bastek, P.; Kramarczyk, J.F.; Molnar, K.; Yu, T.; Coffman, J. High-throughput screening of chromatographic separations: IV. Ion-exchange. Biotechnol. Bioeng. 2008, 100, 950–963. [Google Scholar] [CrossRef] [PubMed]
- Kramarczyk, J.F.; Kelley, B.D.; Coffman, J.L. High-throughput screening of chromatographic separations: II. Hydrophobic interaction. Biotechnol. Bioeng. 2008, 100, 707–720. [Google Scholar] [CrossRef] [PubMed]
- Barnard, G.C.; Hougland, M.D.; Rajendra, Y. High-throughput mAb expression and purification platform based on transient CHO. Biotechnol. Prog. 2015, 31, 239–247. [Google Scholar] [CrossRef]
- Stein, A.; Kiesewetter, A. Cation exchange chromatography in antibody purification: pH screening for optimised binding and HCP removal. J. Chromatogr. B 2007, 848, 151–158. [Google Scholar] [CrossRef] [PubMed]
- Coffman, J.L.; Kramarczyk, J.F.; Kelley, B.D. High-throughput screening of chromatographic separations: I. Method development and column modeling. Biotechnol. Bioeng. 2008, 100, 605–618. [Google Scholar] [CrossRef] [PubMed]
- Dong, J.; Migliore, N.; Mehrman, S.J.; Cunningham, J.; Lewis, M.J.; Hu, P. High-Throughput, Automated Protein A Purification Platform with Multiattribute LC-MS Analysis for Advanced Cell Culture Process Monitoring. Anal. Chem. 2016, 88, 8673–8679. [Google Scholar] [CrossRef] [PubMed]
- Wensel, D.L.; Kelley, B.D.; Coffman, J.L. High-throughput screening of chromatographic separations: III. Monoclonal antibodies on ceramic hydroxyapatite. Biotechnol. Bioeng. 2008, 100, 839–854. [Google Scholar] [CrossRef]
- Schmidt, A.; Koster, D.; Strube, J. Climate Neutrality Concepts for the German Chemical-Pharmaceutical Industry. Processes 2022, 10, 467. [Google Scholar] [CrossRef]
- Greever, C.; Ramirez-Aguilar, K.; Connelly, J. Connections between laboratory research and climate change: What scientists and policy makers can do to reduce environmental impacts. FEBS Lett. 2020, 594, 3079–3085. [Google Scholar] [CrossRef]
- Kromidas, S. Handbuch Validierung in der Analytik; Wiley-VHC: Weinheim, Germany, 2000. [Google Scholar]
- Holman, J.W.; Mifflin, T.E.; Felder, R.A.; Demers, L.M. Evaluation of an Automated Preanalytical Robotic Workstation at Two Academic Health Centers. Clin. Chem. 2002, 48, 540–548. [Google Scholar] [CrossRef]
- Bach, A.; Fleischer, H.; Wijayawardena, B.; Thurow, K. Optimization of Automated Sample Preparation for Vitamin D Determination on a Biomek i7 Workstation. SLAS. Technol. Transl. Life Sci. Innov. 2021, 26, 615–629. [Google Scholar] [CrossRef]
- Plotka-Wasylka, J. A new tool for the evaluation of the analytical procedure: Green Analytical Procedure Index. Talanta 2018, 181, 204–209. [Google Scholar] [CrossRef] [PubMed]
- Sheldon, R.A. Metrics of Green Chemistry and Sustainability: Past, Present, and Future. ACS Sustain. Chem. Eng. 2017, 6, 32–48. [Google Scholar] [CrossRef]
- Keith, L.H.; Gron, L.U.; Young, J.L. Green Analytical Methodologies. Chem. Rev. 2007, 107, 2695–2708. [Google Scholar] [CrossRef] [PubMed]
- Pena-Pereira, F.; Wojnowski, W.; Tobiszewski, M. AGREE-Analytical GREEnness Metric Approach and Software. Anal. Chem. 2020, 92, 10076–10082. [Google Scholar] [CrossRef] [PubMed]
- Locatelli, M.; Kabir, A.; Perrucci, M.; Ulusoy, S.; Ulusoy, H.I.; Ali, I. Green profile tools: Current status and future perspectives. Adv. Sample Prep. 2023, 6, 100068. [Google Scholar] [CrossRef]
- Gałuszka, A.; Migaszewski, Z.; Namieśnik, J. The 12 principles of green analytical chemistry and the SIGNIFICANCE mnemonic of green analytical practices. TrAC Trends Anal. Chem. 2013, 50, 78–84. [Google Scholar] [CrossRef]


Disclaimer/Publisher’s Note: The statements, opinions and data contained in all publications are solely those of the individual author(s) and contributor(s) and not of MDPI and/or the editor(s). MDPI and/or the editor(s) disclaim responsibility for any injury to people or property resulting from any ideas, methods, instructions or products referred to in the content. |
© 2023 by the authors. Licensee MDPI, Basel, Switzerland. This article is an open access article distributed under the terms and conditions of the Creative Commons Attribution (CC BY) license (https://creativecommons.org/licenses/by/4.0/).