Abstract
Helichrysum italicum (Roth) G. Don is widely used as a liver stimulant and diuretic, as well as an antioxidant, antiallergenic, antimicrobial, antiviral, choleric, and antihypertensive agent. Therefore, the purpose of this study was to analyze the different extracts of H. italicum and to determine the relationship between total phenolic/flavonoid content and antioxidant activity. Plant material was pulverized to be 0.3 and 2 mm, and the extraction was obtained with 5 mL of different ethanol concentrations (30, 40, 50, 60, 96%, v/v) and water during different periods (10, 30, 60 min and 24 h) and with concentrated methanol (95%, v/v), dichloromethane, acetone, chloroform, ethyl acetate, and hexane during 10 and 30 min due to solvents volatility. Extracts were evaporated on the rotary evaporator. Total phenolic and flavonoid content were determined via spectrophotometric measurement, and antioxidant capacity was investigated by the inhibitory activity of DPPH radicals. The group of 92 extracts described through their TPC, flavonoids, yield, and IC50 values were subjected to PCA and HCA analysis. PCA and HCA were performed using Statistica v 10.0 software. The number of phenolic compounds ranged from 2.58 ± 0.1 to 43.60 ± 0.3 mg GAE/g of dry extract, and total flavonoids content ranged from 0.25 ± 0.01 to 23.96 ± 0.19 mg QE/g of dry extract. All extracts showed good antioxidant activity with an IC50 value in the range from 4.92 ± 0.2 to 231.12 ± 1.9 μg/mL. PCA and HCA analysis were performed on the whole data set comprising 92 extracts for both particle sizes (s0.3 and s2) as well as heat map analysis. It was found that the increased time of extraction, concentration of ethanol, and degree of fragmentation enhances the quality of the extracts in terms of phenolic component content and antioxidant effects. Applied chemometric analysis contributed to the extraction conditions grouping, overview, and selection in order to distinguish the extracts with the promising TPC, flavonoids, yield, and IC50 values.
1. Introduction
Helichrysum italicum (Roth) G. Don fil. (Asteraceae), also known by the name immortelle, is a plant that holds a significant place in traditional medicine. Due to certain pharmacological activities, H. italicum has become a subject of substantial contemporary research. Regardless of all the benefits recognized by the Committee for Herbal Medicinal Products (HMPC) and the European Medicines Agency (EMA), clinical research on new plant species is still not highly extensive [1]. H. italicum is used primarily along the Mediterranean region, in the areas of its natural habitat, in countries such as Bosnia and Herzegovina, Spain, Portugal, and Italy. The flowers and leaves of the plant are traditionally used in the treatment of various health problems, including allergies, skin damage, cold, inflammation, cough, liver and gallbladder disorders, infections, and insomnia. Also, it has been recognized that H. italicum is used in medicine and pharmaceuticals due to its proven anti-inflammatory, antioxidant, antimicrobial, antiviral, and anti-HIV properties [2]. Nowadays, essential oils of H. italicum are widely used in the perfume and cosmetics industry and have an extensive application for different skin conditions such as allergies, scars, and inflammation [3]. H. italicum extracts are the essential ingredients of anti-wrinkle creams, especially for the female population.
The pharmacological activity of H. italicum depends on the bioactive compounds in plants. Phenolic acids and flavonoids are dominant compounds in H. italicum, which are responsible for the strong antioxidant activity that can prevent oxidative stress and its consequences [4,5]. Oxidative stress occurs when there are not enough antioxidants that can neutralize free radicals. Free radicals are unstable, highly reactive, and independent molecular classes. They can be generated endogenously (inflammation, exercise, ischemic injuries) or exogenously (cigarette smoke, air pollutants, radiation, pesticides, industrial agents) and can lead to homeostatic imbalance and cell damage by attacking vital macromolecules. Oxidative stress is associated with many disorders and diseases such as atherosclerosis, certain cancers, inflammatory reactions (arthritis, lupus erythematosus, vasculitis), the aging process, ischemia (heart disease, stroke), emphysema, gastric ulcer, hypertension, neurological disorders, and alcoholism [5,6]. Antioxidants are highly stable molecules that can donate an electron and neutralize free radicals. They neutralize free radicals by donating a hydrogen atom or by a single electron transfer mechanism and, in that way, delay or inhibit cellular damage and reduce oxidative stress by interacting with free radicals and breaking the chain reaction before damaging important molecules [5,7,8]. The activity of antioxidant defense includes several levels. The first level is suppression of the formation of free radicals and suppression of the initiation or stopping of the propagation of chain reactions. The second level is recovery and emergence of “de novo” antioxidants that recognize, destroy, and remove oxidatively modified proteins and prevent the accumulation of oxidized proteins. And the final level is adaptation, where the signal for the production of free radicals induces the formation and transport of antioxidants to the appropriate place [6].
Extraction methods, conditions, and solvents have a great impact on yield, total phenolic compounds content, antioxidant capacity, bioavailability, and bioefficacy [9,10]. The influence of extraction conditions on the antioxidant activity of H. italicum has not yet been sufficiently investigated, although studies on this topic have taken place [11].
Nowadays, to process and present results of previously conducted research, chemometric tools are widely implemented and various regression and classification methods are applied in the pharmaceutical chemistry domain [12,13,14]. Classification tools such as principal component analysis (PCA) and hierarchical cluster analysis (HCA) have been mentioned in studies concerning different herbs: ashwagandha and rasayana [15], basil [10], epimedium [16], aromatic herbs [17], etc. Additionally, PCA and HCA, as well as heat map analysis, were applied to detect similarities and dissimilarities among the 92 observed extracts in the space of TPC (total phenols content), flavonoids, yield, and IC50.
2. Material and Methods
2.1. Chemicals
Aluminum chloride, gallic acid, dichloromethane, hexane, and chloroform were purchased from Sigma Aldrich (St. Louis, MO, USA); methanol, ethyl acetate, and sodium carbonate from POCH (Gliwice, Poland); and quercetin from Extrasynthese (Genay Cedex, France). Ethanol was obtained from J.T. Baker (Deventer, The Netherlands), and 2,2-diphenyl-1-picrilhydrazil (DPPH) reagent from Alfa Aesar (Karlsruhe, Germany). The Folin-Ciocalteu’s reagent was obtained from Merck (Darmstadt, Germany). All solutions were prepared with ultrapure water, and all solvents and reagents were of an analytical grade unless otherwise indicated.
2.2. Plant Material and Preparation
Identification of the voucher specimens (Helichrysum italicum (Roth) G. Don; Bosna and Hercegovina, Trebinje, Leutar; Branislava Teofilović; 2-0699) was confirmed, and the specimens were deposited at the Herbarium of the Department of Biology and Ecology (BUNS Herbarium), Faculty of Sciences, University of Novi Sad, Serbia. The plants were collected in the city of Trebinje (Bosna and Hercegovina). The total phenolic content, flavonoids, extraction yield, and inhibition of DPPH radicals were determined in 92 (8 water, 48 ethanolic, and 36 organic) obtained extracts. The plant material was air-dried and stored at room temperature in a dark and dry place until the moment of analysis. One gram of plant material was pulverized in a blender, and the mean particle size was determined by a sieve set (CISA Cedaceria Industrial, Barcelona, Spain) to be Ø 0.3 and Ø 2 mm (s0.3 and s2). The extraction was obtained with 5 mL of different ethanol concentrations (30, 40, 50, 60, 96%, v/v) and water during different periods (10, 30, 60 min and 24 h) and with concentrated methanol (95%, v/v), dichloromethane, acetone, chloroform, ethyl acetate, and hexane during 10 and 30 min due to solvents volatility. Samples were filtered and rinsed with another 5 mL of specific solvent and evaporated on the rotary evaporator.
2.3. Total Phenolic Content
The amount of total phenolic compounds in the extracts was determined colorimetrically with the Folin-Ciocalteu (FC) reagent [9,10]. In total, 0.5 mL of 0.2 M FC reagent (10 times diluted commercial FC reagent) was added to 0.1 mL of 0.1% methanolic dilution of a dry extract. After 5 min of shaking in a vortex mixer, 0.4 mL of the prepared sodium carbonate solution (7%, w/v) was added to the test tubes. The mixtures were incubated in a dark place at room temperature for 30 min, after which the absorbance was measured on a UV-Vis spectrophotometer at 760 nm. Distilled water was used as a blank. The concentration of the total phenolic compounds was expressed as a milligram of gallic acid equivalents (GAE) per gram of a dried extract (d.e.), using the standard curve of gallic acid (y = 0.2559x + 0.3345; R2 = 0.9963). All analyses were performed in triplicate.
2.4. Flavonoid Content
Flavonoid content in the investigated samples was measured spectrophotometrically, using a method based on the formation of the yellow-colored complex flavonoid–aluminum [18]. In total, 2 mL of methanolic diluted samples was separately mixed with 1 mL of 2% AlCl3 × 6 H2O. After incubation at room temperature for 15 min, the absorbance of the mixtures was measured at 430 nm. Distilled water was used as a blank. The flavonoid content was expressed as a milligram of quercetin equivalents (QE) per gram of dried extract (d.e.) by using the standard line (y = 0.0039x + 0.012; R2 = 0.999). All measurements were carried out in three repetitions.
2.5. Antioxidant Activity
Antioxidant capacity was determined using the DPPH method [19]. Different volumes (10–50 μL) of methanolic diluted dry extracts were mixed in the test tubes with 1 mL of DPPH solution (0.1 mM in methanol) and diluted to a final volume of 4 mL with methanol. Methanol (95% v/v) was used as a blank, and a mixture of 95% methanol (3 mL) and DPPH reagent (1 mL) was used as a control. After 30 min, the absorbance of the control, sample, and blank was determined by spectrophotometric measurement at a wavelength of λ = 515 nm. Sample and control absorbances were measured in triplicate. Radical scavenger capacity (%RSC) was calculated using the following equation:
%RSC = 100 × (Acontrol − Asample)/Acontrol
The IC50 (half maximal inhibitory concentration) value, defined as the concentration of the test sample leading to 50% reduction in the free radical concentration was calculated graphically and expressed in μg of the extract per mL of the final solution in the measuring cell.
2.6. Chemometric Analysis
The group of 92 extracts described through their TPC, flavonoid, yield, and IC50 values were subjected to PCA and HCA analysis. PCA and HCA were performed using Statistica v 10.0 software (StatSoft). If a certain correlation among the data is present, a data reduction technique named PCA can be applied [20]. PCA is used for the similarity and dissimilarity detection among the samples, as well as for grouping of the samples. As a result of PCA analysis scores and loadings plot arise scores as the new coordinates of the projected objects and loadings that reflect the direction with respect to the original variables. HCA analysis groups similar objects into the same clusters [21]. A result of HCA analysis is shown as a dendrogram where the horizontal axis is the distance or dissimilarity between the clusters. Clustering can be conducted based on Ward’s linkage method and Euclidean distance [22].
3. Results and Discussion
3.1. Extraction Yield
Table 1 shows the influence of solvent polarity, extraction time, and fragmentation level of the plant on the extraction yield of H. italicum. It can be seen that higher yields were obtained with a particle size of 0.3 mm, which is in agreement with a similar study in which the authors demonstrated that by increasing the fragmentation degree, the surface area of the plant grains (particles) increases, which enables better contact of the plant material with the solvent [10]. The impact of solvent polarity on the extraction yield was investigated, and better results were gained with ethanolic and water solvents in comparison with organic solvents. Teofilović et al. also obtained better extraction yield after using polar solvents [9]. This can be explained by the ability of polar solvents to extract polar components, among which are phenolic acid and flavonoids. Among all samples, the maximum extraction yield was achieved by using 60% ethanol (220.38 ± 1.4 mg/g of dry extract). In a similar study, Bojilov et al. also obtained the highest yield by using diluted ethanol (60% EtOH) [4]. The extraction time also has an influence on total yield. The longer period of extraction gave a better result due to the extension of the contact between the solvents and the plant material. Other authors who studied extraction conditions also confirmed this [19,23].

Table 1.
Extraction yields of H. italicum with different solvents.
3.2. Total Phenolic Content
Phenolic compounds are strong antioxidants, and they react with a variation of free radicals. The mechanism involves transfer of a single electron, hydrogen atom transfer, chelation of transition metals, and sequential proton loss electron transfer. The phenolic structure, especially the benzene ring and the number and position of the OH group, is associated with antiradical function. The benzene ring is responsible for the stabilization of antioxidant molecules upon reaction with free radicals [8].
In this research, the amount of total phenolic compounds ranged from 2.58 ± 0.1 to 43.60 ± 0.3 mg GAE/g of dry extract (Table 2). These results were lower in comparison with the similar study, in which the results obtained ranged from 49.70 ± 0.52 to 119.77 ± 2.33 [24]. This can be explained by using different types of extraction as well as the analysis of different parts of the plant. In our research, the total amount of phenols decreased in order: organic extracts > ethanolic extracts > water extracts. Phytochemicals are primarily isolated using organic solvent and its aqueous preparation, but there is no solvent frequently suitable as the best for extraction of polyphenols. Different solvents have shown different efficacy in isolating active compounds from various plants. Some studies have demonstrated that aqueous and organic solvents achieve better extraction efficiency compared to absolute organic solvents [25]. The highest level of total phenolics was obtained with organic solvents. In the study from Jarzycka et al., organic solvents were also more effective for TPC isolation [26]. Extracts treated with different concentrations of ethanol showed higher potential compared to maceration using distilled water, which is in accordance with previously obtained results [23]. Water, as a very polar solvent, and ethanol, as a less polar solvent, can be combined in any proportion. It is known that changes in the polarity of solvents modify their ability to dissolve a certain group of antiradical compounds. The maximum phenolic content was obtained by using organic solvents, especially after 60 min, with a fragmentation level of 0.3 mm. Consequently, if the extracted surface increases, the solvent is in better contact with the plant, which provides a better possibility of extraction and an increase in the yield of total phenols [27]. The extraction time also plays a very important role in the process itself, and with an increase in the extraction time, the transfer of total phenols improves.
Table 2.
Values of total phenolic content (mg GAE/g of dry extract) with different solvents.
3.3. Flavonoid Content
Flavonoids can induce phase II detoxification enzymes, which represent the main defense against electrophilic toxicants and oxidative stress. They enhanced the activity and expression of the antioxidant enzymes such as superoxide dismutase (SOD), catalase (CAT), glutathione peroxidase (GPO), and glutathione reductase (GR) [8].
The results presented in Table 3 indicate that extraction conditions have a great influence on flavonoid content. Solvents have a great impact on flavonoid yield and increase in order water extracts < organic extracts < ethanolic extracts. The lowest flavonoid content in aqueous extract was also verified in another study [10], and this phenomenon can be explained by the inability of water to extract the glycosides and aglycons of flavonoids, which are less polar compounds. The solubility of flavonoids in various solvents changes, so the solvents are chosen according to flavonoids’ polarity. For example, aglycones very alkylated are preferably extracted with ethyl acetate. In contrast, more polar aglycones such as hydroxylated ones and glycosides are rather extracted with water, alcohol, acetone, or mixtures of these solvents [28]. The highest values were achieved after maceration with ethanol. Water and ethanol can be mixed in any proportion. The extraction with different concentrations of ethanol showed that the flavonoid content increases by increasing the concentration of ethanol. The highest yield was obtained with the most concentrated solvent (96% EtOH), which corresponds to the results of similar studies, where the extraction of flavonoids was the most successful after maceration with absolute ethanol (100%), which represents a mono-component system [10,29]. In the examined extracts, flavonoid content ranged from 0.25 ± 0.01 to 23.96 ± 0.19 mg QE/g of dry extract (Table 3), which is comparable to a similar study, where the content was in a range from 2.92 ± 0.03 to 21.96 ± 0.46 mg QE/g of dry extract [11]. Evidently, the best extraction of flavonoids was achieved after 24 h maceration, which implies that time has a strong influence on the extraction. Kaurinovic et al. confirmed that the extraction duration plays a significant role in optimizing the best sample. A longer extraction period leads to the destruction of cell walls, and plant material was present in small particles [30]. The influence of plant fragmentation on flavonoid content was observed (s0.3 and s2), and samples with a higher disintegration level (s0.3) contained more flavonoids. In addition, smaller particles have better contact with the solvent, and flavonoids are therefore better extracted.
Table 3.
Values of total flavonoid content (mg QE/g of dry extract) with different solvents.
3.4. DPPH Test
The phenolic compounds from plants have a strong antioxidant activity, and it can be measured by the DPPH assay. The DPPH test is based on electron transfer and hydrogen atom transfer reactions, and it is a commercial, economic, and quick method to estimate the radical scavenging activity of nonenzymatic antioxidants. The neutralization of DPPH radicals by phenolic compounds can be explained by two mechanisms: 1. the phenolic compound donates a hydrogen atom to the DPPH radical, resulting in a reduced, neutral DPPH-H form and an aryloxy radical that is resonance stabilized; 2. the aryloxy radical can react with another DPPH radical, whereby they condense and turn into a neutral molecule. The mechanism of this activity includes the termination of radical chain reactions and stimulation of the activity of enzymes involved in antioxidant defense [31,32].
Table 4 shows the concentration of the extracts obtained by maceration with ethanolic, water, and organic solvents, which is required to inhibit 50% of DPPH radicals (IC50). Samples with a lower IC50 value have better antioxidant activity. Table 5 shows the antioxidant property equivalent to gallic acid, which was obtained by dividing IC50 of each treatment by IC50 of gallic acid. The IC50 of gallic acid was 1.52 μg/mL. The antiradical activity of extracts increased in order: water extracts < ethanolic extracts < organic extracts. Solvent polarity has a significant effect on antioxidant activity, and while changing the polarity of a solvent, an antiradical activity may be changed [9]. Maceration with organic, mono-component solvents gave extracts that are the most effective radical scavengers. The extract obtained with ethyl acetate for 60 min showed the best antioxidant activity. Talić et al. obtained the antioxidative potential of methanolic extracts from 23–34 μg/mL, and Albayrak et al. from 23.03–47.64 μg/mL, and those results are comparable to our values (12.08 ± 0.1–45.54 ± 0.5) [3,33]. However, Kladar et al. obtained lower antioxidant activity for methanolic extract (144.36 ± 7.01 μg/mL), but different parts of the plant were used [11]. Dissimilar results obtained with different parameters can be described by the fact that the antioxidant activity depends on the mutual ratio of phenolic components in the sample. The extraction time also has a great influence on antioxidant activity, which improves by increasing the duration of maceration, as in accordance with the available literature data [29].
Table 4.
Values of activity of DPPH radical (μg/mL) with different solvents (IC50).
Table 5.
Equivalent IC50 of each extract obtained by different solvents compared to IC50 of gallic acid.
The effects of the solvent, particle size, and extraction time on the extraction yield, total phenolic content, total flavonoid content, DPPH, and IC50 are presented in Supplementary Tables S1–S5. Table 6 shows the correlation matrices for the extraction experiments of the samples with a particle size of 0.3 and 2 mm and the level of significance of each correlation. The highest correlation coefficient while observing both particle sizes can be found between IC50 and extraction yield (0.5713 and 0.4625) as well as between TPC and IC50 (−0.4524 and −0.4521).
Table 6.
Correlation matrices for the extraction experiments of the samples with particle size 0.3 and 2 mm.
3.5. Chemometric Analysis
PCA and HCA analysis were performed on the whole data set comprising 46 extracts for both particle sizes (0.3 and 2 mm) as well as heat map analysis. The results of PCA analysis for a particle size of 0.3 mm are presented in Figure 1 through loading (a) and score (b) plot. PCA resulted in a two-component model that covers 74.16% of total variance (PC1 contributing with 48.12% and PC2 with 26.04%, both with eigenvalues higher than 1). It can be concluded from the loading plot (Figure 1a) that on the distribution of examined extracts along the PC1 axis the most dominant influence is IC50 and yield, which both have a very similar influence regarding the positioning of these extracts on the score plot. Both IC50 and yield have a negative coefficient of latent variables regarding the PC1 axis. The score plot presented in Figure 1b indicates that extracts with more volatile solvents (marked blue) are positioned toward the positive end of the PC1 axis and generally have lower values of IC50 and yield, while extracts with less volatile solvents (marked red) are placed toward the negative end of the PC1 axis and generally have higher values of IC50 and yield. Along the PC2 axis, from the loading plot (Figure 1a) it is observed that in the distribution of the extracts the most dominant influence is flavonoid value with a negative coefficient of latent variables regarding the PC2 axis. That explains why all extracts are placed in the central plot area on the score plot (Figure 1b) except extracts labeled 96% EtOH 60 min and 96% EtOH 24 h, which have far greater flavonoid values determined (20.20 and 23.96 mg QE/g d.e.).
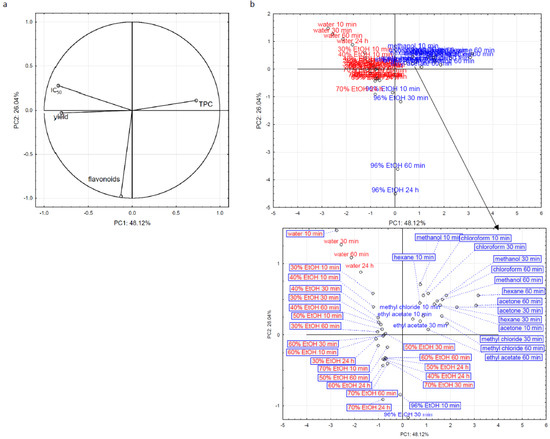
Figure 1.
The results of PCA analysis (loading (a) and score (b) plot) of the extraction experiments of the samples with particle size 0.3 mm.
Referring to the particle size of 2 mm, loading and score plots are presented in Figure 2. Two principal components with an eigenvalue higher than 1 were PC1 that covers 44.50% and PC2 that covers 27.06% of total variance (71.56%). According to the loading plot (Figure 2a), along the PC1 axis the most dominant influence regarding examined extracts positioning is IC50 with a negative coefficient of latent variables. From the score plot (Figure 2b), it can be concluded that extracts with more volatile solvents (marked blue) are placed toward the positive end of the PC1 axis, and they generally have lower values of IC50. Extracts with less volatile solvents (marked red) are placed toward the negative end of the PC1 axis, and they generally have higher values of IC50. If we focus on the PC2 axis, it shows the same condition as with the result regarding a particle size of 0.3 mm. In the distribution of the extracts along the PC2 (Figure 2a), the most dominant influence is flavonoids value with a positive coefficient of latent variables. That explains why all extracts are placed in the central plot area on the score plot (Figure 2b) except extracts labeled 96% EtOH 60 min and 96% EtOH 24 h, which have far greater flavonoids values determined (20.20 and 23.96 mg QE/g d.e.).
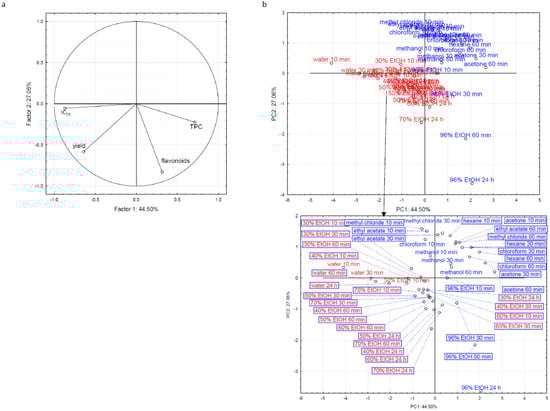
Figure 2.
The results of PCA analysis (loading (a) and score (b) plot) of the extraction experiments of the samples with particle size 2 mm.
HCA analysis results correspond to those obtained through PCA analysis for both particle sizes. In Figure 3, a particle size of 0.3 mm is presented and a dendrogram shows two well-separated clusters at the linkage distance between 300 and 600. The two main clusters are divided into a few sub-clusters at the linkage distance below 200. Extracts with fewer volatile solvents are placed in the first cluster, while the extracts with more volatile solvents are in the second cluster. In Figure 4, a clustering heat map is presented, and it gives more detailed insight into separation. Extracts labeled 96% EtOH 60 min and 96% EtOH 24 h are distinguished from others, and they are placed in a separated cluster. These two extracts possess far greater flavonoids values (20.20 and 23.96 mg QE/g d.e.) than other extracts.
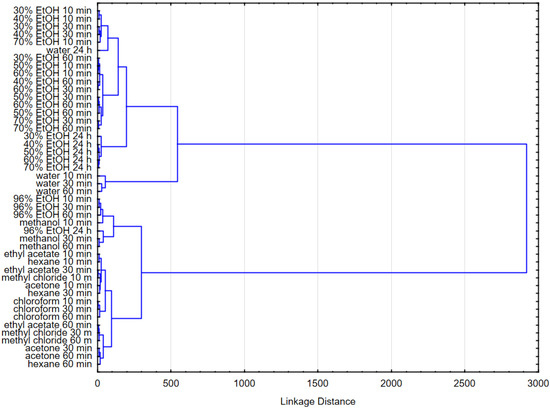
Figure 3.
The dendrogram of extraction experiments of the samples with particle size 0.3 mm.
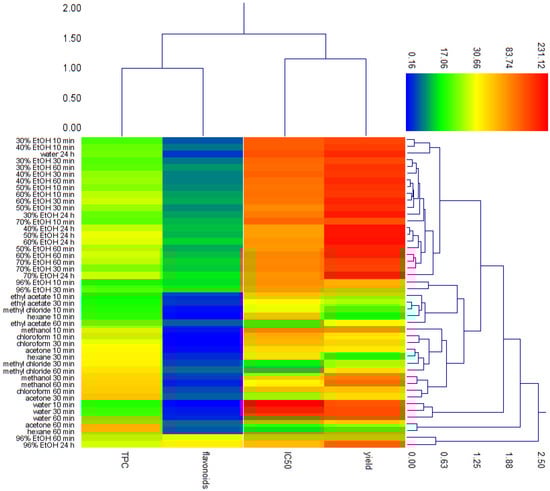
Figure 4.
The heat map of extraction experiments of the samples with particle size 0.3 mm.
Results obtained applying HCA analysis with a particle size of 2 mm are presented in Figure 5. This dendrogram also consists of two well-separated clusters at the linkage distance between 200 and 400. Both main clusters contain a few sub-clusters at the linkage distance below 300. The extracts with fewer volatile solvents are positioned in the first cluster, and extracts with more volatile solvents are placed in the second one. Analyzing the clustering heat map (Figure 6), it can be noticed that the extract labeled “water 10 min” is an outlier, while other extracts are placed in two clusters. An extract labeled “water 10 min” has the highest IC50 and the lowest TPC values. Again, extracts labeled “96% EtOH 60 min” and “96% EtOH 24 h” are placed together in one cluster because of their higher flavonoid values (20.20 and 23.96 mg QE/g d.e.).
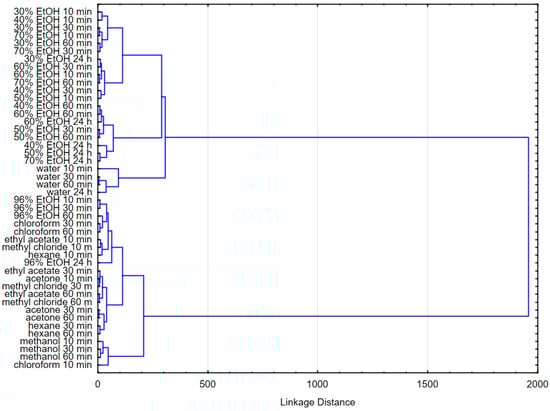
Figure 5.
The dendrogram of extraction experiments of the samples with particle size 2 mm.
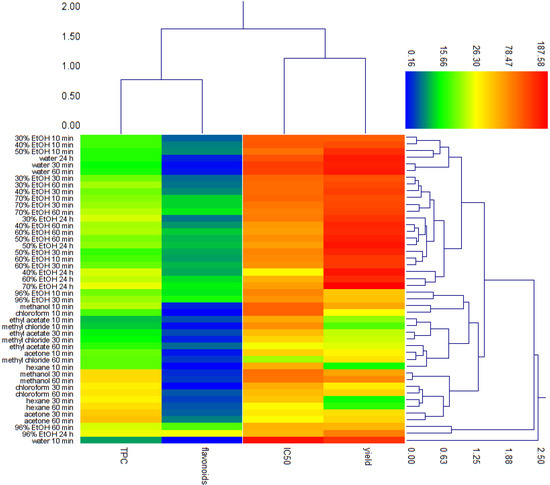
Figure 6.
The heat map of extraction experiments of the samples with particle size 2 mm.
4. Conclusions
The obtained results showed that H. italicum possesses antioxidant activity, which is associated with significant content of phenolic compounds. Ethanolic extracts (96%) contained the greatest flavonoid content and have optimal antioxidant activity. Ethyl acetate extract showed the best scavenging potential after 60 min. All extracts with higher fragmentation level gave better results in terms of yield and flavonoid content. A longer time of extraction showed greater results for yield, total phenolic and flavonoid content, and DPPH test. Applied chemometric analysis contributed to the extraction conditions grouping, overview, and selection to distinguish the extracts with promising TPC, flavonoid, yield, and IC50 values. It can be concluded that fragmentation of the plant and extraction time have a significant impact on producing extracts with optimal antioxidant activity.
Supplementary Materials
The following supporting information can be downloaded at: https://www.mdpi.com/article/10.3390/separations10080436/s1, Table S1: The effects of the solvent, particle size and extraction time on the extraction yield; Table S2: The effects of the solvent, particle size and extraction time on the total phenolic content; Table S3: The effects of the solvent, particle size and extraction time on the total flavonoid content; Table S4: The effects of the solvent, particle size and extraction time on the DPPH; Table S5: The effects of the solvent, particle size and extraction time on the IC50.
Author Contributions
Conceptualization, B.T. and F.B.; methodology, B.T. and F.B.; software, M.K.B.; validation, S.K., M.K.B. and S.P.-K.; formal analysis, B.T.; investigation, B.T.; resources, B.T.; data curation, M.K.B. and B.T.; writing—original draft preparation, B.T., F.B. and M.K.B.; writing—review and editing, B.T., M.K.B. and E.G.; visualization, N.G.-L.; supervision, N.G.-L.; project administration, N.G.-L. and S.S.; funding acquisition, B.T. All authors have read and agreed to the published version of the manuscript.
Funding
This work is supported by Provincial Secretariat for Higher Education and Scientific Research, Province of Vojvodina (Grant No. 142-451-2545/2021).
Data Availability Statement
Data will be made available upon request.
Conflicts of Interest
The authors declare no conflict of interest.
Abbreviations
| DPPH | 2,2-diphenyl-1-picrylhydrazyl radical |
| HCA | hierarchical cluster analysis |
| PCA | principal component analysis |
| FC | Folin–Ciocalteu |
| GAE | gallic acid equivalents |
| d.e. | dried extract |
| QE | quercetin equivalents |
| RSC | radical scavenger capacity |
| IC50 | inhibitory concentration |
| TPC | total phenolic compound |
| FLV | flavonoid compound |
| Et | ethanol |
| meth | methanol |
| et-ac | ethyl acetate |
| chlorof | chloroform |
| acet | acetone |
| met-chl | methyl chloride |
| hex | hexane |
References
- Kramberger, K.; Kenig, S.; Jenko Pražnikar, Z.; Kočevar Glavač, N.; Barlič-Maganja, D. A review and evaluation of the data supporting internal use of Helichrysum italicum. Plants 2021, 10, 1738. [Google Scholar] [CrossRef] [PubMed]
- Mollova, S.; Fidan, H.; Antonova, D.; Bozhilov, D.; Stanev, S.; Kostova, I.; Stoyanova, A. Chemical composition and antimicrobial and antioxidant activity of Helichrysum italicum (Roth) G. Don subspecies essential oils. Turk. J. Agric. For. 2020, 44, 371–378. [Google Scholar] [CrossRef]
- Talić, S.; Odak, I.; Martinović Bevanda, A.; Crnjac, N.; Paštar, M. Helichrysum italicum (Roth) G. Don subsp. italicum from Herzegovina: Volatile Composition, Variations during Seasons, Total Polyphenols, Acetylcho-linesterase Inhibition and Antioxidant Activity. Croat. Chem. Acta 2019, 92, 69–77. [Google Scholar] [CrossRef]
- Bojilov, D.G.; Manolov, S.P.; Ivanov, I.I.; Mollova, S.L. Investigation of antioxidant activity of different extracts of Helichrysum italicum from Bulgaria. J. Int. Sci. Publ. Mater. Methods Technol. 2019, 13, 241–249. [Google Scholar]
- Teofilović, B.; Grujić-Letić, N.; Karadžić, M.; Kovačević, S.; Podunavac-Kuzmanović, S.; Gligorić, E.; Gadžurić, S. Analysis of functional ingredients and composition of Ocimum basilicum. S. Afr. J. Bot. 2021, 141, 227–234. [Google Scholar] [CrossRef]
- Lobo, V.; Patil, A.; Phatak, A.; Chandra, N. Free radicals, antioxidants and functional foods: Impact on human health. Pharmacogn. Rev. 2010, 4, 118. [Google Scholar] [CrossRef] [PubMed]
- Cartea, M.E.; Francisco, M.; Soengas, P.; Velasco, P. Phenolic compounds in Brassica vegetables. Molecules 2010, 16, 251–280. [Google Scholar] [CrossRef]
- Zeb, A. Concept, mechanism, and applications of phenolic antioxidants in foods. J. Food Biochem. 2020, 44, 13394. [Google Scholar] [CrossRef] [PubMed]
- Teofilović, B.; Grujić-Letić, N.; Goločorbin-Kon, S.; Stojanović, S.; Vastag, G.; Gadžurić, S. Experimental and chemometric study of antioxidant capacity of basil (Ocimum basilicum) extracts. Ind. Crops Prod. 2017, 100, 176–182. [Google Scholar] [CrossRef]
- Teofilović, B.; Grujić-Letić, N.; Gligorić, E.; Rašković, A.; Igić, R.; Vastag, G.; Gadžurić, S. Experimental and computational evaluation of extraction procedure and scavenging capacity of sweet basil extracts (Ocimum basilicum L.). Plant Foods Hum. Nutr. 2021, 76, 240–247. [Google Scholar] [CrossRef]
- Kladar, N.V.; Anačkov, G.T.; Rat, M.M.; Srđenović, B.U.; Grujić, N.N.; Šefer, E.I.; Božin, B.N. Biochemical characterization of Helichrysum italicum (Roth) G. Don subsp. italicum (Asteraceae) from Montenegro: Phytochemical screening, chemotaxonomy, and antioxidant properties. Chem. Biodivers. 2015, 12, 419–431. [Google Scholar] [CrossRef] [PubMed]
- Monakhova, Y.B.; Holzgrabe, U.; Diehl, B.W. Current role and future perspectives of multivariate (chemometric) methods in NMR spectroscopic analysis of pharmaceutical products. J. Pharm. Biomed. Anal. 2018, 147, 580–589. [Google Scholar] [CrossRef] [PubMed]
- Leigh-de Rapper, S.; Tankeu, S.Y.; Kamatou, G.; Viljoen, A.; van Vuuren, S. The use of chemometric modelling to determine chemical composition-antimicrobial activity relationships of essential oils used in respiratory tract infections. Fitoterapia 2021, 154, 105024. [Google Scholar] [CrossRef] [PubMed]
- Nonato, C.D.F.A.; Camilo, C.J.; Leite, D.O.D.; da Nobrega, M.G.L.A.; Ribeiro-Filho, J.; de Menezes, I.R.A.; Tavares, J.F.; da Costa, J.G.M. Comparative analysis of chemical profiles and antioxidant activities of essential oils obtained from species of Lippia L. by chemometrics. Food Chem. 2022, 384, 132614. [Google Scholar] [CrossRef] [PubMed]
- Bhargavi, S.; Shankar, S.M. Dual herbal combination of Withania somnifera and five Rasayana herbs: A phytochemical, antioxidant, and chemometric profiling. J. Ayurveda Integr. Med. 2021, 12, 283–293. [Google Scholar] [CrossRef] [PubMed]
- Zhou, M.; Zheng, W.; Sun, X.; Yuan, M.; Zhang, J.; Chen, X.; Yu, K.; Guo, B.; Ma, B. Comparative analysis of chemical components in different parts of Epimedium Herb. J. Pharm. Biomed. Anal. 2021, 198, 113984. [Google Scholar] [CrossRef]
- Potortì, A.G.; Bua, G.D.; Turco, V.L.; Tekaya, A.B.; Beltifa, A.; Mansour, H.B.; Dugo, G.; Di Bella, G. Major, minor and trace element concentrations in spices and aromatic herbs from Sicily (Italy) and Mahdia (Tunisia) by ICP-MS and multivariate analysis. Food Chem. 2020, 313, 126094. [Google Scholar] [CrossRef]
- Bozin, B.; Mimica-Dukic, N.; Samojlik, I.; Goran, A.; Igic, R. Phenolics as antioxidants in garlic (Allium sativum L., Alliaceae). Food Chem. 2008, 111, 925–929. [Google Scholar] [CrossRef]
- Grujic, N.; Lepojevic, Z.; Srdjenovic, B.; Vladic, J.; Sudji, J. Effects of different extraction methods and conditions on the phenolic composition of mate tea extracts. Molecules 2012, 17, 2518–2528. [Google Scholar] [CrossRef]
- Miller, J.; Miller, J.C. Statistics and Chemometrics for Analytical Chemistry; Pearson Education: London, UK, 2018. [Google Scholar]
- Jin, J.; Li, M.; Jin, L. Data normalization to accelerate training for linear neural net to predict tropical cyclone tracks. Math. Probl. Eng. 2015, 2015, 931629. [Google Scholar] [CrossRef]
- Ward, J.H., Jr. Hierarchical grouping to optimize an objective function. J. Am. Stat. Assoc. 1963, 58, 236–244. [Google Scholar] [CrossRef]
- Spigno, G.; Tramelli, L.; De Faveri, D.M. Effects of extraction time, temperature and solvent on concentration and antioxidant activity of grape marc phenolics. J. Food Eng. 2007, 81, 200–208. [Google Scholar] [CrossRef]
- Nebrigić, V.; Kljakić, A.C.; Zengin, G.; Terzić, M.; Mašković, P.; Radojković, M. Effects of extraction and drying techniques on the chemical composition and biological activities of Helichrysum italicum. Process Biochem. 2023, 130, 96–104. [Google Scholar] [CrossRef]
- Alara, O.R.; Abdurahman, N.H.; Ukaegbu, C.I. Extraction of phenolic compounds: A review. Curr. Res. Food Sci. 2021, 4, 200–214. [Google Scholar] [CrossRef] [PubMed]
- Jarzycka, A.; Lewińska, A.; Gancarz, R.; Wilk, K.A. Assessment of extracts of Helichrysum arenarium, Crataegus monogyna, Sambucus nigra in photoprotective UVA and UVB; photostability in cosmetic emulsions. J. Photochem. Photobiol. B Biol. 2013, 128, 50–57. [Google Scholar] [CrossRef] [PubMed]
- Lapornik, B.; Prošek, M.; Wondra, A.G. Comparison of extracts prepared from plant by-products using different solvents and extraction time. J. Food Eng. 2005, 71, 214–222. [Google Scholar] [CrossRef]
- Dias, M.C.; Pinto, D.C.; Silva, A.M. Plant flavonoids: Chemical characteristics and biological activity. Molecules 2021, 26, 5377. [Google Scholar] [CrossRef]
- Chew, K.; Khoo, M.; Ng, S.; Thoo, Y.Y.; Aida, W.W.; Ho, C.W. Effect of ethanol concentration, extraction time and extraction temperature on the recovery of phenolic compounds and antioxidant capacity of Orthosiphon stamineus extracts. Int. Food Res. J. 2011, 18, 1427. [Google Scholar]
- Kaurinovic, B.; Popovic, M.; Vlaisavljevic, S.; Trivic, S. Antioxidant capacity of Ocimum basilicum L. and Origanum vulgare L. extracts. Molecules 2011, 16, 7401–7414. [Google Scholar] [CrossRef]
- Liang, N.; Kitts, D.D. Antioxidant property of coffee components: Assessment of methods that define mechanisms of action. Molecules 2014, 19, 19180–19208. [Google Scholar] [CrossRef]
- Santos-Sánchez, N.F.; Salas-Coronado, R.; Villanueva-Cañongo, C.; Hernández-Carlos, B. Antioxidant compounds and their antioxidant mechanism. Antioxidants 2019, 10, 1–29. [Google Scholar]
- Albayrak, S.; Aksoy, A.; Sağdiç, O.; Budak, Ü. Phenolic compounds and antioxidant and antimicrobial properties of Helichrysum species collected from eastern Anatolia, Turkey. Turk. J. Biol. 2010, 34, 463–473. [Google Scholar] [CrossRef]


Disclaimer/Publisher’s Note: The statements, opinions and data contained in all publications are solely those of the individual author(s) and contributor(s) and not of MDPI and/or the editor(s). MDPI and/or the editor(s) disclaim responsibility for any injury to people or property resulting from any ideas, methods, instructions or products referred to in the content. |
© 2023 by the authors. Licensee MDPI, Basel, Switzerland. This article is an open access article distributed under the terms and conditions of the Creative Commons Attribution (CC BY) license (https://creativecommons.org/licenses/by/4.0/).