Article

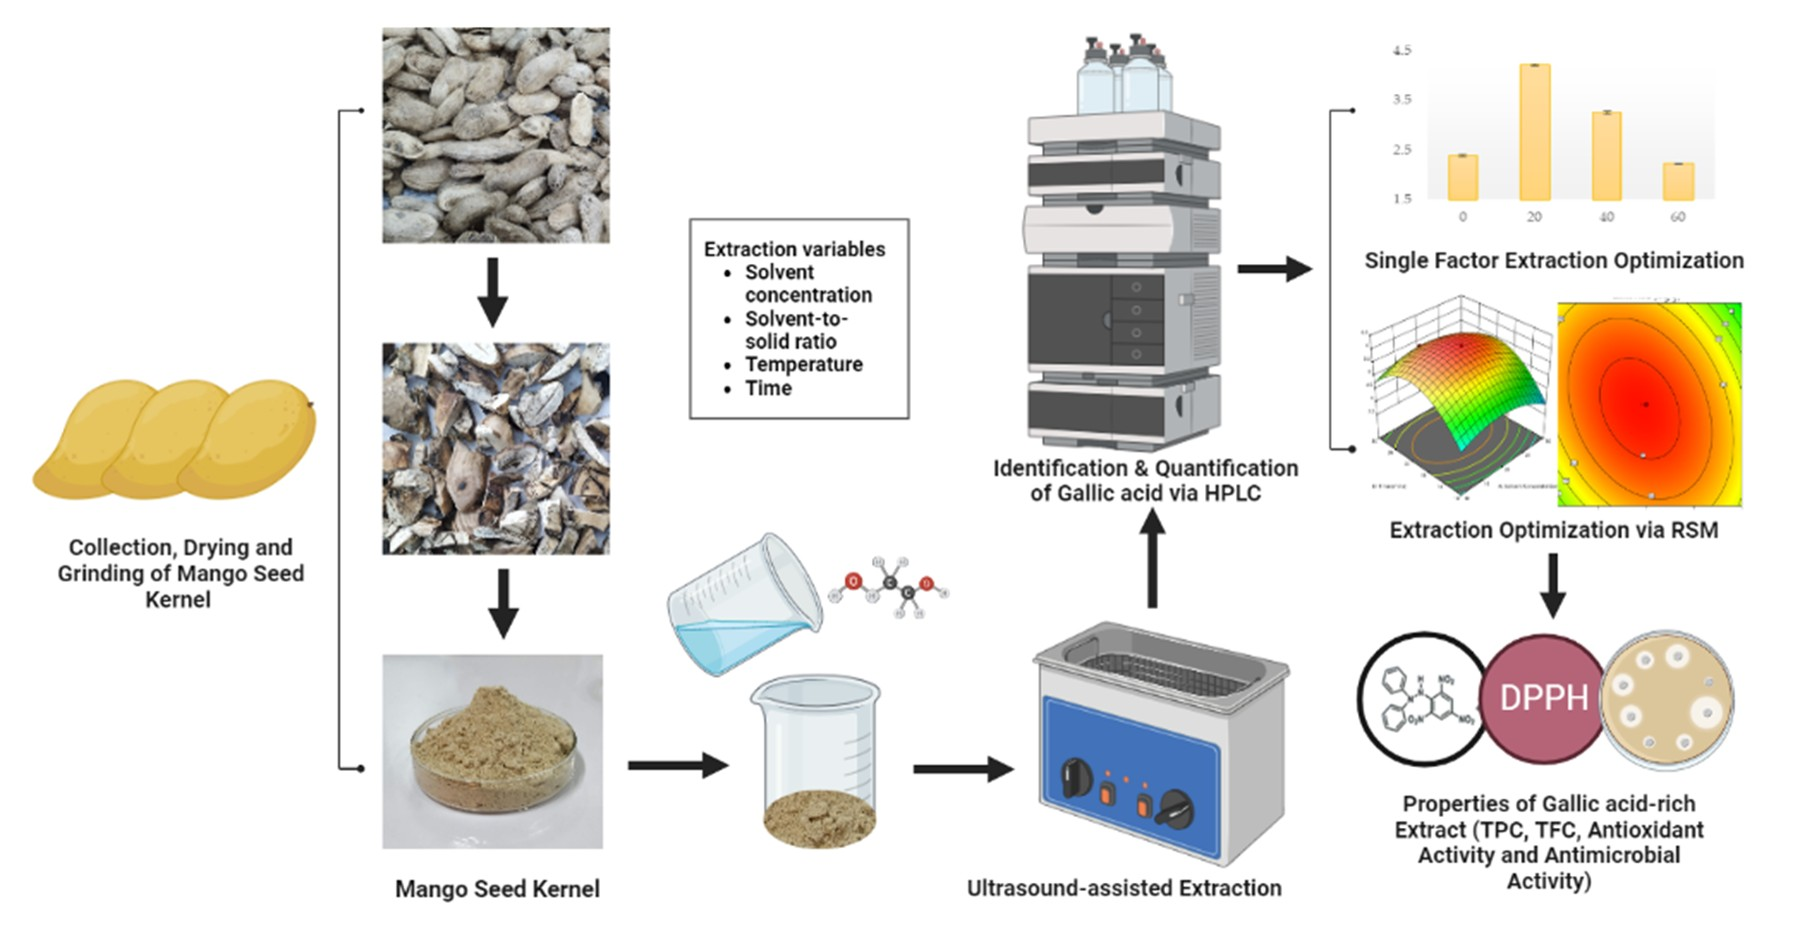
Optimization of Gallic Acid-Rich Extract from Mango (Mangifera indica) Seed Kernels through Ultrasound-Assisted Extraction

1
IDRC Project Laboratory, University of Veterinary and Animal Sciences, Lahore 54000, Pakistan
2
Department of Animal Sciences, College of Agriculture, University of Sargodha, Sargodha 40100, Pakistan
3
Department of Food Sciences, Cholistan University of Veterinary and Animal Sciences, Bahawalpur 63100, Pakistan
4
Institute of Food Science and Nutrition, University of Sargodha, Sargodha 40100, Pakistan
*
Author to whom correspondence should be addressed.
Separations 2023, 10(7), 376; https://doi.org/10.3390/separations10070376
Submission received: 29 April 2023 / Revised: 6 June 2023 / Accepted: 20 June 2023 / Published: 26 June 2023
(This article belongs to the Special Issue Extraction and Analysis of Active Ingredients from Natural Products)

Abstract

:
Different types of agro-waste provide potential substrates for the extraction of bioactive compounds. Mango waste (e.g., peels and seeds) is one such example and may serve as a source of gallic acid, a well-known bioactive compound classified as a secondary polyphenolic metabolite. Here, we explored the efficacy of ultrasound-assisted extraction (UAE) in extracting gallic acid from mango seed kernels using different solvent concentrations (0–60%), solvent-to-sample ratios (10–50 mL/g), temperatures (30–60 °C), and times (10–30 min). The maximum yield of gallic acid (6.1 ± 0.09 mg/g) was obtained when using a 19.4% solvent concentration, a 29.32 mL/g solvent-to-sample ratio, and the extraction was conducted at 38.47 °C for 21.4 min, similar to the values predicted by the model equation. As compared to the conventional extraction procedure, the extract obtained by the optimized method was found to be significantly different in total phenolic content, total flavonoid content, and radical scavenging activity. Non-significant differences were observed in antimicrobial activity. The results indicate that mango seed kernels may be a good source of phenolics, and those phenolics can be effectively obtained through an optimized UAE method. Hence, mango seed kernels may be utilized as a suitable source of extracting phenolics in nutraceutical and food applications.

Graphical Abstract

1. Introduction

Mangoes (Mangifera indica) belong to the family Anarcadiaceae and comprise almost 1000 varieties and 70 genera [1]. Mangoes are thought to have been consumed in South East Asia for over 4000 years; however, the fruit is currently cultivated in more than 90 countries worldwide [2]. The fruit is approximately 50% pulp, which is directly consumed, and the remaining peels and seed kernels are largely discarded as waste during processing [3]. As proper disposal of mango waste significantly increases production costs, the waste is often improperly disposed of or burnt, which represents an environmental challenge. Mango seed kernels (MSK) are the primary waste component, but a prime source of bioactive compounds [4].
MSK can be a valuable source of nutraceuticals [5]. A 100-g sample of MSK is 20 to 21% tannins and can contain 0.50 µg/g of β-carotenes, 12 to 13 mg of coumarin, 7 to 8 mg of caffeic acid, 20 to 21 mg of vanillin, 4 to 5 mg of mangiferin, 10 to 11 mg of ferulic acid, 11 to 12 mg of cinnamic acid and around 7 to 8 mg of unknown compounds [6,7]. Additionally, MSK can contain 156 ± 7.8 mg of gallic acid/100 g when treated with overnight agitation in 80% methanol as reported by Abdel-Aty et al. [8]. Gallic acid (3,4,5-trihydroxybenzoic acid) is also found in large quantities in other vegetables and fruits and their waste products. It is an important part of hydrolyzable tannins and is found mostly in its free form [9,10]. The compound is reported to have antioxidant, antibacterial, antiviral, anti-inflammatory, anti-allergic, anti-carcinogenic, and anti-mutagenic properties [9,10,11,12]. As mango processing produces a large volume of waste, optimizing gallic acid extraction methods from MSK could produce large quantities of gallic acid. Additionally, the valorization of mango waste can be helpful in achieving low-cost and sustainable yields of gallic acid-rich extracts as it is an abundantly found phenolic group in MSK [13].
Currently, there exist numerous methods for extracting bioactive compounds from different resources. These methods utilize different types of organic solvents combined with different sample preparation methods as well as different temperatures and extraction times. Conventional methods include maceration and extraction via soxhlet apparatus. These methods, however, require significant quantities of solvents and extraction time which often leads to degradation of or inactivation of extracts of bioactive compounds itself [14]. Additionally, the presence and potential toxicity of organic solvents pose a challenge to the safe utilization of the extracts. As such, there is growing interest in the development of “clean” and “green” extraction methods to lessen the environmental impact of the extraction process and to produce safer products. Many of these extraction methods are also referred to as “cold” extraction methods as they do not require higher energy inputs and the stability of bioactive compounds is not compromised [15]. Thus, green extraction methods can be utilized to maximize the yield of desired polyphenols from plant materials while minimizing hazardous health impacts and reducing energy needs [16].
Several groups have shown that the efficiency of traditional extraction methods can be improved by utilizing emerging techniques and employing mechanical and physical disruption of the materials [17]. Such techniques include microwave-assisted extraction (MAE), ultrasound-assisted extraction (UAE), and high hydrostatic pressure (HHP). These methods, often referred to as unconventional methods, can provide effective extraction of polyphenols from plant matrices [18,19,20]. UAE has additional benefits in terms of affordability and accessibility as the method requires minimal setup and materials with fewer costs. It also permits the extraction of multiple samples simultaneously [21]. In this technique, ultrasound waves mechanically disrupt matrices of the substrate, allowing better solvent penetration into the tissue and increasing the overall surface area between liquid and solid phases. Ultimately, the solute can diffuse speedily from the solid phase to the solvent phase. Therefore, for natural products, UAE can be efficiently utilized to optimize the extraction of phenols from agro-waste [22].
Extraction methods require optimization in order to maximize the recovery of bioactive compounds and an accurate analysis to improve the overall performance of independent extraction variables [23]. Response surface methodology (RSM) is a widely used technique to optimize the extraction of bioactive compounds from plants. RSM utilizes statistical and mathematical techniques to develop, improve, and optimize a process in which the response factor is controlled by several independent variables where the ultimate objective is to optimize the responses. One advantage of RSM is that multiple variables are evaluated simultaneously, requiring fewer iterations in the optimization process [24]. By using the RSM approach, a broad image of the effects of various factors can be studied along with identifying the most optimized region [25].
Several groups have developed UAE-based extraction methods of polyphenols from MSK but none focused on optimizing the yield of gallic acid. Castañeda-Valbuena et al. [26] studied the effect of UAE to optimize total phenolic extraction from mango by-products by using a central composite design and reported the highest concentration of phenolic compounds (121.66 mg GAE/g dry material) obtained by extraction with <80% ethanol. Another study utilized UAE to extract potential antioxidants from MSK with a central composite design. Gallic acid and its derivatives were the most abundant extracted phenols from MSK by using 49% ethanol [27]. Similarly, Borrás-Enríquez et al. reported the extraction of 672 mg GAE/100 g of total polyphenols in MSK within 20 min using 50% ethanol via UAE [28]. The difference in reported phenolic contents could be due to the difference in mango variety, the origin of cultivation, the method of extraction, and the solvent during its extraction [6,14,29].
Considering the above, the goal of this study was to evaluate the efficacy of UAE with varying levels of ethanol to extract gallic acid from MSK. The effects of factors such as solvent concentration, solvent-to-sample ratio, temperature, and time of extraction were optimized via RSM by utilizing a central composite design (CCD) with gallic acid contents in the extracted fractions as a response variable. The gallic acid was quantified through high-pressure liquid chromatography (HPLC) and conditions optimized to obtain the maximum gallic acid yield were derived. The bioactive properties of the extract obtained from the optimized extraction method were measured and compared with extracts obtained using the conventional extraction method in terms of total phenolic content (TPC), total flavonoid content (TFC), radical scavenging activity (DPPH), and antimicrobial activity.

2. Materials and Methods

2.1. Chemicals

Chemicals The gallic acid standard was purchased from Sigma Aldrich. HPLC-grade ethanol, methanol acetonitrile, and formic acid were bought from Merck. DPPH (Alfa Aesar, Ward Hill, MA, USA), Folin-Ciocalteu (Scharlau, Barcelona, Spain), bu-tylated hydroxytoluene (BHT), sodium nitrite, aluminum chloride, and sodium hy-droxide (Daejung, Republic of Korea) were also procured. Mueller Hinton agar (CM0337) and brain heart infusion broth (CM1136) were purchased from Oxoid (Hampshire, UK).

2.2. Sample Material

Mango seed kernels (MSK; Chaunsa variety) were collected from a commercial fruit processor unit, the Iftekhar Ahmed & Co. Mango Plant, located in Chak 74 SB (Geographic coordinates: latitude 32°25′29.8′′ N; longitude 72°53′28.8′′ E) in Sargodha, Punjab, Pakistan. The collection was conducted in June 2020, as June is the mango production and processing season in Pakistan. The seeds were dried, and the kernels were removed manually by cutting the seed coat using a sharp knife. The kernels were cut into parts and sun-dried to reach a 10% moisture level. The samples were then ground and screened through a 40 mesh sieve with a flour sieve strainer to attain a pre-tested particle size of 0.4 mm and stored at 4 °C in plastic sealable bags until further use.

2.3. Sample Preparation via UAE

UAE was conducted in an ultrasonic bath (Easy 30H, Elma Ultrasonic; Elma, Singen, Germany) at a frequency of 37 kHz and power of 80 W. MSK powder (1 g) was weighed precisely with weighing balance (ATX224, Shimadzu, Kyoto, Japan) and mixed in the different concentrations of aqueous ethanol for different experiments. After proper mixing, samples were placed in the ultrasonic bath and irradiated under the pre-established conditions for single-factor experiments described in Section 2.4.1. After ultrasonication, the samples were filtered through filter paper (No. 1 Whatmann Schleicher & Schuell, Maidstone, England). The filtrates were concentrated in a water bath (Memmert, Schwabach, Germany) at 50 °C until they reached one-third of the actual volume of solvent and used for further analysis.

2.4. Experimental Design

2.4.1. Single-Factor Experiments

Several initial experiments were conducted to select the working ranges for RSM independent variables i.e., solvent-to-sample ratio, time, temperature, and solvent concentration on the basis of the gallic acid content of the extracts of MSK. The extracts were prepared using UAE under different temperatures (30, 40, 50, and 60 °C), extraction times (10, 15, 20, 25, and 30 min), solvent-to-sample ratios (10, 20, 30 40, and 50 mL/g), and solvent concentrations (0, 20, 40 and 60%). All of the extractions variables were kept constant at 40 °C, 10 mL/g, and 10 min when not evaluated. The prepared extracts were analyzed for quantification of gallic acid content via HPLC. The working ranges (maximum and minimum values) on the basis of single-factor experiments were recorded for each factor.

2.4.2. Multiple-Factor Experiment

For the optimization of the extraction parameters and conditions, 4 independent variables and 3 CCD levels were used. The 4 independent variables chosen for extraction were solvent concentration (%, X1), solvent-to-sample ratio (mL/g, X2), temperature (°C, X3), and time (min, X4) with a response variable of gallic acid content. Three levels, upper, middle, and lower, were selected for each variable depending on the single-factor experiment results. Uncoded and coded levels were the base for optimization. Two levels (maximum and minimum) were selected based on a preliminary study against each independent variable and are presented in Table 1. This generated 27 experimental runs with 3 replications at center points to determine the method repeatability index. A polynomial regression model of second order was used to express the yield of gallic acid.

2.5. HPLC Analysis

After extraction, the samples were partitioned with n-hexane (3 times, 5 mL each) to remove lipids and waxes. The extracts were filtered through a 0.45 μm syringe filter for analysis [30]. The phenolic profiles were achieved by an Agilent HPLC (1260 Infinity II, Agilent Technologies, Inc., Santa Clara, California, USA) equipped with a VWD-UV Visible detector. Utilizing a Zorbax Eclipse plus C18 analytical 4.6 × 150 mm 5 µm; Agilent, USA, an analysis was carried out. The mobile phase was a combination of solvent A (distilled water: formic acid, 99:1, v/v) and solvent B (acetonitrile: formic acid, 99:1, v/v). Flow rates of 0.6 mL/min were (t in min: %B): (1) 0:0%; (2) 5:20%; (3) 10:50%; (4) 15:100% and (5) 20:0%. Chromatograms were recorded at 280 nm wavelength, 25 °C temperature, and 20 µL injection volume. On the basis of peak area and standard curve comparisons, gallic acid in extracts was quantified to determine the optimal extraction parameters (Figure S1). Experiments were conducted in triplicate and reported as mean values ± SD across the triplicates.

2.6. Characterization of Optimized MSK Extract in Comparison with Conventional Extraction Method

Extracts were also prepared using the conventional extraction method of decoction as previously reported [31]. Briefly, MSK powder was incubated in boiling water for 30 min. After decoction, the extracts were filtered and concentrated to one-third of the total volume of solvent. Extracts were freeze-dried (−50 °C, 24 h) for determination of TPC and TFC. Both UAE and conventionally obtained extracts were then analyzed for TPC, TFC, radical scavenging activity, and antimicrobial activity according to previously described methods reported by [32,33], [34,35] and [36,37,38], respectively.

2.6.1. Determination of TPC

A Folin-Ciocalteu reagent was used for the determination of TPC as previously described [32,33]. Briefly, 0.5 mL of Folin reagent was combined with 1 mL (0.01 g/1 mL) of extract followed by the addition of 7.5 mL of distilled water. The resulting solution was mixed and incubated at room temperature for 10 min. Sodium carbonate (10%; 1.5 mL) was added and the solution was incubated by a water bath at 40 °C for 20 min and cooled to room temperature. The absorbance was recorded at 755 nm by spectrophotometry (UV-Vis. Spectrophotometer, A&E Lab, London, UK). The test was performed in triplicates and TPC was calculated as gallic acid equivalent per gram of dried extract and expressed as GAE (mg/g) by using a gallic acid calibration curve as previously described [39].

2.6.2. Determination of TFC

TFC was determined as previously described [32,33]. Briefly, 1 mL extracts (0.01 g/1 mL) were mixed with 5 mL distilled water. After mixing, 0.3 mL of 5% sodium nitrite was added followed by the addition of 0.6 mL of 10% aluminum chloride, 2 mL of 1M sodium hydroxide (2 mL), and 2.4 mL of distilled water with 5 min intervals in between the addition of each reagent. The absorbance was recorded at 510 nm by spectrophotometry (UV-Vis. Spectrophotometer, A&E Lab, London, UK). The analysis was performed in triplicate and the results were calculated as catechin equivalent per gram of dried extract and expressed as CE (mg/g) by using a catechin calibration curve as previously described [39].

2.6.3. Determination of Radical Scavenging Activity

The stable free radical 2,2-diphenyl-1-picrylhydrazyl (DPPH) was used for the determination of the radical scavenging activity of the extracts as previously described [34,35]. Butylated hydroxytoluene (BHT), a phenol derivative known for its antioxidant properties was used as a control. Extracts (1 µL) were thoroughly mixed in 3.995 mL of DPPH solution (2.4 mg of DPPH dissolved in 100 mL methanol). The mixture was incubated at room temperature in the dark, protected from UV light for 30 min before analysis. Absorbance of the DPPH solution (as blank) and extract reaction mixture solutions were recorded at 515 nm by spectrophotometry (UV-Vis. Spectrophotometer, A&E Lab, London, UK). The equation used for the calculation of radical scavenging activity is given below:
Free radical (DPPH) scavenged% = (AB − AA)/AB × 100
AB refers to the absorbance of the blank solution at 0 min while the absorbance of BHT or extract is represented by AA at 30 min.

2.6.4. Determination of Antimicrobial Activity

Antimicrobial activity of both extracts was measured against a strain of gram-positive bacteria, Clostridium perfringens, using an agar well diffusion assay as previously described [36,37,38,40]. Bacterial samples were cultivated using sterile brain heart infusion (BHI) broth and incubated at 37 °C for 24 h to reach a concentration of 108 CFU/mL bacterial specie. The bacterial inoculum was swabbed aseptically onto a Mueller Hinton (MH) agar plate. Wells (5 mm) were made with the help of a cork borer no. 4 in the MH agar plates and 100 µL of the extract was filled in the labeled wells for each extract with a micropipette [36,37,38]. An aqueous solution (100 µL) of ciprofloxacin (15 µg/mL) was used as the control positive whereas 19.4% ethanol was used as the control negative. The plates were covered and left for 2 h at room temperature to facilitate diffusion and placed in an incubator at 37 °C for 18 h. After incubation, the plates were examined for antimicrobial activity as measured by the zones of inhibition (mm).

2.7. Statistical Analysis

Data were analyzed by using Design Expert Software (Version 12, Stat-Ease, Inc., Minneapolis, MN, USA) for model building, predicted values calculations, and depicting the independent variables impact. Three-dimensional graphs were plotted on the response variables. The regression equation was calculated for the best model, having a non-significant lack of fit with pure error. By the Fisher Value Test (F-value), lack of fit, and coefficient of determination R2, the quality and adequacy of the model were determined. All the data generated was assessed in the statistical software SPSS (version 25, IBM Corp., San Jose, CA, USA) to compare means and significance (p < 0.05) levels of the 2 extraction methods (UAE and conventional decoction) through an independent t-test.

3. Results and Discussion

3.1. Single-Factor Experiments

3.1.1. Effect of Solvent Concentration

Commonly used solvents used in the extraction of phytochemicals include methanol, acetone, ethanol, hexane, and water. However, ethanol is considered safer in comparison to methanol due to less toxicity [22]. Water has been extensively used in extraction because it is easily available, nontoxic, and inexpensive as compared to other solvents. Extraction with water, however, is less efficient in comparison to a combination of water and ethanol [22]. Therefore, in the research described here, aqueous ethanol was utilized. The efficacy of aqueous ethanol on extraction yields of gallic acid was assessed for different ethanol concentrations using a solvent-to-sample ratio of 10 mL/g, 40 °C temperature, and extraction time of 10 min (Figure 1a). As the ethanol concentration rose from 0 to 20%, a significant increase in gallic acid concentration was observed. These concentrations, however, decreased as the concentration of ethanol increased from 20% (4.21 ± 0.04 mg/g) to 40% (3.25 ± 0.03 mg/g) and further decreased as ethanol concentration increased to 60% (2.23 ± 0.01 mg/g). These results were similar to previous research findings that when ethanol is used in combination with water, it shows remarkable results as it was reported that the maximum phenolic content was observed at a 50% level when the ethanol-water binary system was evaluated [39]. As extraction with 20% ethanol showed the greatest efficiency in the research described, 20% ethanol was used in the successive experiments.

3.1.2. Effect of Solvent-to-Sample Ratio

Extraction efficiencies of different solvent-to-sample ratios (10, 20, 30, 40, and 50 mL/g) were measured using 20% ethanol at 40 °C and an extraction time of 10 min (Figure 1b). Extraction efficiencies increased as the solvent-to-sample ratio increased from 10 (4.04 ± 0.01 mg/g) to 30 mL/g (5.43 ± 0.06 mg/g) but decreased as the ratio increased to 40 (4.52 ± 0.02 mg/g) or 50 mL/g (3.24 ± 0.01 mg/g). As solvent-to-sample ratios rise, the solvent is able to adequately dissolve the constituents present in plant samples leading to an improved extraction yield [41]. A small ratio, on the other hand, results in a lower yield. So, it is necessary to choose solvent volume wisely. As seen here, increasing the solvent-to-sample ratio beyond an optimal level leads to solvent wastage and inefficiency. There is a consistency between the mass transfer principle and the increase in gallic acid yield. Throughout the mass transfer, the sample and solvent concentration gradient is the main driving force, which increases when the solvent-to-sample ratio is high. As highest gallic acid yields were seen with a solvent-to-sample ratio of 30 mL/g. This ratio was used in subsequent experiments.

3.1.3. Effect of Temperature

The effect of temperature (30, 40, 50, and 60 °C) on extraction efficiency was evaluated using a solvent concentration of 20%, a solvent-to-sample ratio of 30 mL/g, and an extraction time of 10 min (Figure 1c). An increase in yield of gallic acid was seen when the temperature increased from 30 (4.67 ± 0.01 mg/g) to 40 °C (5.30 ± 0.01 mg/g) and decreased further as the temperature raised from 50 (4.77 ± 0.02 mg/g) to 60 °C (4.39 ± 0.00 mg/g). Across temperatures, the highest yield of gallic acid was obtained at 40 °C, which was 5.30 ± 0.02 mg/g. Generally, the diffusion capacity of solvent into the cells increases as the temperature of the extraction process increases, likely leading to increased desorption and solubility of compounds resulting in the disaggregation of components. Additionally, heat increases the permeability of plant cell walls and decreases solvent viscosity. However, some bioactive compounds may become denatured at high temperatures, as indicated by the decreased recovery of gallic acid from MSK as the extraction temperature increased [42] from 50 to 60 °C. Gallic acid extraction attained maximum solubility and desorption equilibrium at 40 °C [43]. As gallic acid content was highest when extracted at 40 °C, further extraction experiments were performed at 40 °C.

3.1.4. Effect of Time

The effect of extraction time (10, 15, 20, 25, and 30 min) was assessed using a solvent concentration of 20%, a solvent-to-sample ratio of 30 mL/g, and an extraction temperature of 40 °C (Figure 1d). An increase in gallic acid yield was observed when extraction times increased from 10 (0.5 ± 0.02 mg/g) to 20 min (5.50 ± 0.02 mg/g) but decreased when extraction time reached 25 min (4.84 ± 0.05 mg/g) and beyond (30 min: 4.07 ± 0.03 mg/g). The results specify that the acceleration in the equilibrium coefficient between solvent and cell walls of plants for extraction is due to ultrasound waves for target compounds dissolution in a shorter time period. Shorter extraction times are considered an advantage of ultra-sonication in comparison to conventional extraction methods [44]. When plant material gets exposed to ultrasonic waves for a longer period of time, the potential degradation of bioactive compounds increases [23]. As the highest gallic acid yields were observed with a 20-min extraction time, further experiments utilized a 20-min extraction time.

3.2. Optimization via Response Surface Methodology (RSM)

All the response values obtained after performing 27 run experiments are presented in Table 2. The gallic acid yield ranged from 3.51 ± 0.10 mg/g to 6.13 ± 0.06 mg/g. Maximum yield of gallic acid was attained against the experimental conditions of X1 = 20%, X2 = 30 mL/g, X3 = 40 °C, and X4 = 20 min.
Test and response variables were checked by applying multiple regression analysis to experimental data by following Equation (1) where Y is the response (yield of gallic acid) and X1, X2, X3, and X4 are the factors.
Y = 6.09 − 0.0808X1 − 0.0467X2 − 0.1033X3 + 0.1658X4 − 0.2563X1X2 + 0.1250X1X3 + 0.0287X1X4 − 0.0713X2X3 − 0.0900X2X4 + 0.1587X3X4 − 0.5508X12 − 0.3933X22 − 0.5771X32 − 0.2896X42
Table 3 shows an ANOVA for the regression equation. To verify the adequacy of the model, lack of fit was used. A non-significant (p ˃ 0.05) lack of fit indicates that the model fits the optimization experiment appropriately. The signal-to-noise ratio should be measured precisely. A ratio of more than 4 is considered preferable. In our study, the ratio was observed to be 29.246 indicating a definite design space, determining that this model can help out. Plotted points finely clustered around the diagonal line showed the experimental and predicted values relationship, indicating better fitness of the model because the R-squared predicted value of 0.9337 is in reasonable agreement with the R-squared adjusted value of 0.9748.
The three-dimensional surface plots produced by the model were used to predict the associations between the variables processed. If the plot appears circular, it means that variable interaction is non-significant. Conversely, if the plot appears elliptical, it indicates significant interaction between variables. Figure 2 illustrates the impact of independent factors on the yield of gallic acid. The results showed that the UAE treatment was effective in extracting gallic acid from MSK by using lower amounts of ethanol. When the samples were exposed to the UAE frequency for a prolonged time and temperature, the plant cells ruptured due to acoustic cavitation, and bioactive compounds were released into the respective solvent levels e.g., solvent: water ratios. The highest gallic acid yields were observed within the optimal ranges of temperature and time of extraction. However, when the temperature exceeded this level, a reduction in the yield was seen, which could be due to the heat-sensitive nature of some bioactive compounds [42].
By solving the regression equation, optimal values of extraction variables were achieved as shown in Table 4 with the corresponding Y = 6.1 ± 0.11 mg/g. Tests were performed in triplicate under optimized conditions to verify the predicted results. The yield of gallic acid obtained was 6.1 ± 0.09 mg/g, showing that the model fit the experimental data and the extraction procedure was optimized to obtain gallic acid-rich extracts of MSK.
High yields of gallic acid were obtained with the lowest concentration of ethanol tested, indicating UAE can be a greener extraction method that also requires less energy input than other extraction methods. In other studies, 6 mg/100 g of gallic acid was extracted with 95% of cold methanol [6], which was lower than what was observed here using only 20% ethanol. Another study compared the efficiencies of different extraction methods (hydrolysis and agitation) with 50% ethanol and observed gallic acid yields ranging from 20 to 833 mg/100 g of MSK [29]. Nithitanakool et al. [45] studied the MSK extracts obtained via homogenization by using ethanol. The reported gallic acid content was 4.40 ± 0.05 mg/g. Hence, the optimized method is helpful in obtaining gallic acid-rich extracts through the optimal extraction conditions as well as extraction of other valuable bioactive compounds from mango waste, particularly MSK.

3.3. Characterization of Optimized MSK Extract in Comparison with Conventional Extraction Method

MSK extract obtained through UAE by the optimized conditions of extraction (MSK-UAE) was compared with the extracts prepared by the conventional extraction method of decoction (MSK-Dec.). The bioactive compound profiles of MSK-UAE were significantly higher in all the tested parameters than in the control treatment except antimicrobial activity (Table 5). It was observed that the TPC of MSK-UAE was in agreement with the study reported TPC of 63.89 and 69.24 mg/g of GAE, which was obtained through 80% methanol by agitation for 24 h [46]. Another study obtained a comparable TPC of 67.2 mg GAE/g of MSK when extracted with 50% ethanol via UAE for 20 min [28]. TFC in MSK has been reported from 10 to 1100 mg/100 g CE [47,48] in different studies, which is lower compared to the results presented here. However, the TFC of MSK-Dec. extracts were observed to be significantly (p < 0.05) lower than MSK-UAE.
The results of DPPH showed that gallic acid-rich extract obtained through UAE had significantly higher radical scavenging activity than MSK-Dec. Gallic acid has been reported as the most important phenolic compound, which is highly correlated with higher antioxidant activity [49]. Several studies reported the antioxidant potential of MSK could be due to the presence of the abundantly found phenolic compound, gallic acid [13,14,26]. A study reported the antioxidant potential of MSK extracted through 1 h shaking followed by centrifugation with varying levels of ethanol and observed non-significant differences among 25% and 75% of ethanol having 73.1% and 72.78% of DPPH radical scavenging activities, respectively [39]. In our study, the DPPH radical scavenging activity of MSK-UAE with 19.4% ethanol was 73.50%, which depicts the efficacy of gallic acid-rich extracts obtained via UAE as an antioxidant.
Furthermore, antimicrobial activity was observed for both extracts against Clostridium perfringens (Figure 3). Clostridium perfringens is a gram-positive, spore-forming bacteria known to cause food poisoning along with other health issues. MSK-UAE and MSK-Dec. showed antimicrobial potential against it when tested. The non-significant (p > 0.05) differences were observed in the zones of inhibition; however, the largest zone of inhibition was of ciprofloxacin used as a control. MSK extracts have been reported to be more effective against gram-positive than gram-negative bacteria. Mirghani et al. [50] studied the antibacterial activity of MSK extracts against strains of gram-positive bacteria, Staphylococcus aureus, Bacillus subtilis, gram-negative bacteria, Escherichia coli, and Pseudomonas aeruginosa. They reported significant activities against gram-positive bacterial strains. It has been reported that the phenolic compounds from mango extracts can harm microbial cell membranes by interacting with microbial enzymes. It involves the absorption of phytochemicals into cell membranes which alters the pH and electrical potential of the membrane, which damages the membrane and leads to leakage of cytoplasmic material and eventually cell death [51].
Conclusively, observed results of characterization confirm that MSK-UAE performed better compared to the extract prepared through the conventional method, having a significantly higher polyphenolic profile, including gallic acid content, TPC, TFC, and antioxidant potential. It confirms the potential of the optimized extraction procedure in obtaining gallic acid-rich extracts that can be used for the nutraceutical, food, and feed industry.

4. Conclusions

Mango waste containing seeds and peels is a source of valuable bioactive compounds. The current study was conducted to investigate the potential of ultrasound-assisted extraction (UAE) to obtain gallic acid-rich extract from MSK. The extraction variables were optimized based on the results of single-factor experiments. UAE was found to be an efficient method to obtain gallic acid-rich extracts from MSK. The optimized conditions utilized a 19.4% solvent concentration, a 29.3 mL/g solvent-to-sample ratio, 38.47 °C temperature, and an extraction time of 21.4 min. Under these conditions, the yield of gallic acid in the extract was found to be 6.1 ± 0.09 mg/g. The extract also showed significantly higher TPC, TFC, and radical scavenging activity when compared with decoction extracts. However, antimicrobial activity was non-significant. In conclusion, the extraction of bioactive compounds from MSK through this optimized method is useful for food and nutraceutical applications thus enabling the utilization of this agro-waste. Further research may be employed for the upscaling of this technology at the industrial level.

Supplementary Materials

The following are available online at https://www.mdpi.com/article/10.3390/separations10070376/s1, Figure S1: Chromatograms showing peaks of (a) Gallic acid standard (b) Gallic acid-rich extract of mango seed kernel.

Author Contributions

Conceptualization, Z.H., T.R. and K.A.; Formal analysis, T.R., K.S. and M.A.; Investigation, Z.H.; Methodology, Z.H., T.R., K.S. and K.A.; Project administration, Z.H.; Software, T.R., H.U.R. and K.A.; Supervision, Z.H.; Validation, Z.H., T.R., H.U.R. and K.A.; Writing—original draft, T.R. and K.S.; Writing—review and editing, Z.H., T.R., K.S., H.U.R. and K.A. All authors have read and agreed to the published version of the manuscript.

Funding

This work was carried out with financial support from the UK government Department of Health and Social Care (DHSC), Global AMR Innovation Fund (GAMRIF), and the International Development Research Centre Ottawa, Canada, (Grant No. 109051–003). The views expressed herein do not necessarily represent those of IDRC or its Board of Governors.

Data Availability Statement

Data is contained within the research article.

Conflicts of Interest

The authors declare no conflict of interest.

References

  1. Kobayashi, M.; Matsui-Yuasa, I.; Fukuda-Shimizu, M.; Mandai, Y.; Tabuchi, M.; Munakata, H.; Kojima-Yuasa, A. Effect of mango seed kernel extract on the adipogenesis in 3T3-L1 adipocytes and in rats fed a high fat diet. Health 2013, 5, 9–15. [Google Scholar] [CrossRef] [Green Version]
  2. Diarra, S.S. Potential of mango (Mangifera indica L.) seed kernel as a feed ingredient for poultry: A review. World’s Poult. Sci. J. 2014, 70, 279–288. [Google Scholar] [CrossRef] [Green Version]
  3. Masibo, M.; He, Q. Major mango polyphenols and their potential significance to human health. Compr. Rev. Food Sci. Food Saf. 2008, 7, 309–319. [Google Scholar] [CrossRef] [PubMed]
  4. Castro-Vargas, H.I.; Ballesteros Vivas, D.; Ortega Barbosa, J.; Morantes Medina, S.J.; Aristizabal Gutiérrez, F.; Parada-Alfonso, F. Bioactive phenolic compounds from the agroindustrial waste of Colombian mango cultivars ‘Sugar Mango’and ‘Tommy Atkins’—An alternative for their use and valorization. Antioxidants 2019, 8, 41. [Google Scholar] [CrossRef] [PubMed] [Green Version]
  5. Masibo, M.; He, Q. Mango bioactive compounds and related nutraceutical properties—A review. Food Rev. Int. 2009, 25, 346–370. [Google Scholar] [CrossRef]
  6. Abdalla, A.E.; Darwish, S.M.; Ayad, E.H.; El-Hamahmy, R.M. Egyptian mango by-product 1. Compositional quality of mango seed kernel. Food Chem. 2007, 103, 1134–1140. [Google Scholar] [CrossRef]
  7. Ruales, J.; Baenas, N.; Moreno, D.A.; Stinco, C.M.; Meléndez-Martínez, A.J.; García-Ruiz, A. Biological active ecuadorian mango ‘tommy atkins’ ingredients—An opportunity to reduce agrowaste. Nutrients 2018, 10, 1138. [Google Scholar] [CrossRef] [PubMed] [Green Version]
  8. Abdel-Aty, A.M.; Salama, W.H.; Hamed, M.B.; Fahmy, A.S.; Mohamed, S.A. Phenolic-antioxidant capacity of mango seed kernels: Therapeutic effect against viper venoms. Rev. Bras. Farmacogn. 2018, 28, 594–601. [Google Scholar] [CrossRef]
  9. Jung, S.; Choe, J.H.; Kim, B.; Yun, H.; Kruk, Z.A.; Jo, C. Effect of dietary mixture of gallic acid and linoleic acid on antioxidative potential and quality of breast meat from broilers. Meat Sci. 2010, 86, 520–526. [Google Scholar] [CrossRef]
  10. Lee, K.H.; Jung, S.; Kim, H.J.; Kim, I.S.; Lee, J.H.; Jo, C. Effect of dietary supplementation of the combination of gallic and linoleic acid in thigh meat of broilers. Asian-Australas. J. Anim. Sci. 2012, 25, 1641. [Google Scholar] [CrossRef]
  11. Kim, D.-O.; Lee, K.W.; Lee, H.J.; Lee, C.Y. Vitamin C equivalent antioxidant capacity (VCEAC) of phenolic phytochemicals. J. Agric. Food Chem. 2002, 50, 3713–3717. [Google Scholar] [CrossRef]
  12. Özçelik, B.; Kartal, M.; Orhan, I. Cytotoxicity, antiviral and antimicrobial activities of alkaloids, flavonoids, and phenolic acids. Pharm. Biol. 2011, 49, 396–402. [Google Scholar] [CrossRef]
  13. Rawdkuen, S.; Sai-Ut, S.; Benjakul, S. Optimizing the tyrosinase inhibitory and antioxidant activity of mango seed kernels with a response surface methodology. Food Anal. Methods 2016, 9, 3032–3043. [Google Scholar] [CrossRef]
  14. Dorta, E.; Lobo, M.G.; González, M. Optimization of factors affecting extraction of antioxidants from mango seed. Food Bioprocess Technol. 2013, 6, 1067–1081. [Google Scholar] [CrossRef] [Green Version]
  15. Tiwari, B.K. Ultrasound: A clean, green extraction technology. TrAC Trends Anal. Chem. 2015, 71, 100–109. [Google Scholar] [CrossRef]
  16. Chemat, F.; Vian, M.A.; Cravotto, G. Green extraction of natural products: Concept and principles. Int. J. Mol. Sci. 2012, 13, 8615–8627. [Google Scholar] [CrossRef] [PubMed] [Green Version]
  17. Gao, Y.; Wang, Z.; Luo, L.; Dai, J.; Li, D. Optimization of ultrasound-assisted aqueous two-phase extraction of polyphenols from mango seed kernel. Trans. Chin. Soc. Agric. Eng. 2012, 28, 255–261. [Google Scholar]
  18. Ávila, N.S.; Capote, F.P.; De Castro, M.L. Ultrasound-assisted extraction and silylation prior to gas chromatography–mass spectrometry for the characterization of the triterpenic fraction in olive leaves. J. Chromatogr. A 2007, 1165, 158–165. [Google Scholar] [CrossRef] [PubMed]
  19. Liu, W.; Yu, Y.; Yang, R.; Wan, C.; Xu, B.; Cao, S. Optimization of total flavonoid compound extraction from Gynura medica leaf using response surface methodology and chemical composition analysis. Int. J. Mol. Sci. 2010, 11, 4750–4763. [Google Scholar] [CrossRef] [PubMed] [Green Version]
  20. Pan, X.; Niu, G.; Liu, H. Microwave-assisted extraction of tea polyphenols and tea caffeine from green tea leaves. Chem. Eng. Process. Process Intensif. 2003, 42, 129–133. [Google Scholar] [CrossRef]
  21. Aznar-Ramos, M.J.; Razola-Díaz, M.D.C.; Verardo, V.; Gómez-Caravaca, A.M. Comparison between Ultrasonic Bath and Sonotrode Extraction of Phenolic Compounds from Mango Peel By-Products. Horticulturae 2022, 8, 1014. [Google Scholar] [CrossRef]
  22. Zou, T.-B.; Xia, E.-Q.; He, T.-P.; Huang, M.-Y.; Jia, Q.; Li, H.-W. Ultrasound-assisted extraction of mangiferin from mango (Mangifera indica L.) leaves using response surface methodology. Molecules 2014, 19, 1411–1421. [Google Scholar] [CrossRef]
  23. Yang, J.; Yan, Z.; Li, L.; Zhang, L.; Zhao, M.; Yi, H.; Wang, Z.; Li, G.; Wang, Z.; Li, M. Green Extraction of Phenolic Compounds from Lotus (Nelumbo nucifera Gaertn) Leaf Using Deep Eutectic Solvents: Process Optimization and Antioxidant Activity. Separations 2023, 10, 272. [Google Scholar] [CrossRef]
  24. Liyana-Pathirana, C.; Shahidi, F. Optimization of extraction of phenolic compounds from wheat using response surface methodology. Food Chem. 2005, 93, 47–56. [Google Scholar] [CrossRef]
  25. Jang, S.; Lee, A.Y.; Lee, A.R.; Choi, G.; Kim, H.K. Optimization of ultrasound-assisted extraction of glycyrrhizic acid from licorice using response surface methodology. Integr. Med. Res. 2017, 6, 388–394. [Google Scholar] [CrossRef]
  26. Castañeda-Valbuena, D.; Ayora-Talavera, T.; Luján-Hidalgo, C.; Álvarez-Gutiérrez, P.; Martínez-Galero, N.; Meza-Gordillo, R. Ultrasound extraction conditions effect on antioxidant capacity of mango by-product extracts. Food Bioprod. Process. 2021, 127, 212–224. [Google Scholar] [CrossRef]
  27. Ojeda, G.A.; Sgroppo, S.C.; Sánchez-Moreno, C.; de Ancos, B. Mango ‘criollo’ by-products as a source of polyphenols with antioxidant capacity. Ultrasound assisted extraction evaluated by response surface methodology and HPLC-ESI-QTOF-MS/MS characterization. Food Chem. 2022, 396, 133738. [Google Scholar] [CrossRef] [PubMed]
  28. Borrás-Enríquez, A.J.; Reyes-Ventura, E.; Villanueva-Rodríguez, S.J.; Moreno-Vilet, L. Effect of ultrasound-assisted extraction parameters on total polyphenols and its antioxidant activity from mango residues (Mangifera indica L. var. Manililla). Separations 2021, 8, 94. [Google Scholar] [CrossRef]
  29. Soong, Y.-Y.; Barlow, P.J. Quantification of gallic acid and ellagic acid from longan (Dimocarpus longan Lour.) seed and mango (Mangifera indica L.) kernel and their effects on antioxidant activity. Food Chem. 2006, 97, 524–530. [Google Scholar] [CrossRef]
  30. Ramirez, J.E.; Zambrano, R.; Sepúlveda, B.; Simirgiotis, M.J. Antioxidant properties and hyphenated HPLC-PDA-MS profiling of Chilean Pica mango fruits (Mangifera indica L. Cv. piqueño). Molecules 2014, 19, 438–458. [Google Scholar] [CrossRef] [Green Version]
  31. Chanda, S.; Amrutiya, N.; Rakholiya, K. Evaluation of antioxidant properties of some Indian vegetable and fruit peels by decoction extraction method. Am. J. Food Technol. 2013, 8, 173–182. [Google Scholar] [CrossRef] [Green Version]
  32. Hussain, A.I.; Chatha, S.A.; Noor, S.; Khan, Z.A.; Arshad, M.U.; Rathore, H.A.; Sattar, M.Z. Effect of extraction techniques and solvent systems on the extraction of antioxidant components from peanut (Arachis hypogaea L.) hulls. Food Anal. Methods 2012, 5, 890–896. [Google Scholar] [CrossRef]
  33. Sultana, B.; Anwar, F.; Ashraf, M. Effect of extraction solvent/technique on the antioxidant activity of selected medicinal plant extracts. Molecules 2009, 14, 2167–2180. [Google Scholar] [CrossRef] [PubMed] [Green Version]
  34. Dewanto, V.; Wu, X.; Adom, K.K.; Liu, R.H. Thermal processing enhances the nutritional value of tomatoes by increasing total antioxidant activity. J. Agric. Food Chem. 2002, 50, 3010–3014. [Google Scholar] [CrossRef] [PubMed]
  35. Sogi, D.S.; Siddiq, M.; Greiby, I.; Dolan, K.D. Total phenolics, antioxidant activity, and functional properties of ‘Tommy Atkins’ mango peel and kernel as affected by drying methods. Food Chem. 2013, 141, 2649–2655. [Google Scholar] [CrossRef]
  36. Bagamboula, C.; Uyttendaele, M.; Debevere, J. Inhibitory effect of thyme and basil essential oils, carvacrol, thymol, estragol, linalool and p-cymene towards Shigella sonnei and S. flexneri. Food Microbiol. 2004, 21, 33–42. [Google Scholar] [CrossRef]
  37. Du Toit, E.; Rautenbach, M. A sensitive standardised micro-gel well diffusion assay for the determination of antimicrobial activity. J. Microbiol. Methods 2000, 42, 159–165. [Google Scholar] [CrossRef]
  38. Raju, B.; Ballal, M.; Bairy, I. A novel treatment approach towards emerging multidrug resistant Enteroaggregative Escherichia coli (EAEC) causing acute/persistent diarrhea using medicinal plant extracts. Res. J. Pharm. Biol. Chem. Sci. 2011, 2, 15–23. [Google Scholar]
  39. Lim, K.J.A.; Cabajar, A.A.; Lobarbio, C.F.Y.; Taboada, E.B.; Lacks, D.J. Extraction of bioactive compounds from mango (Mangifera indica L. var. Carabao) seed kernel with ethanol–water binary solvent systems. J. Food Sci. Technol. 2019, 56, 2536–2544. [Google Scholar] [CrossRef]
  40. Wayne, P. National committee for clinical laboratory standards. Perform. Stand. Antimicrob. Disc Susceptibility Test. 2002, 12, 1–53. [Google Scholar]
  41. Li, H.; Chen, B.; Yao, S. Application of ultrasonic technique for extracting chlorogenic acid from Eucommia ulmodies Oliv. (E. ulmodies). Ultrason. Sonochem. 2005, 12, 295–300. [Google Scholar] [CrossRef] [PubMed]
  42. Zou, T.-B.; Jia, Q.; Li, H.-W.; Wang, C.-X.; Wu, H.-F. Response surface methodology for ultrasound-assisted extraction of astaxanthin from Haematococcus pluvialis. Mar. Drugs 2013, 11, 1644–1655. [Google Scholar] [CrossRef] [PubMed] [Green Version]
  43. Setyaningsih, W.; Saputro, I.E.; Palma, M.; Barroso, C.G. Stability of 40 phenolic compounds during ultrasound-assisted extractions (UAE). AIP Conf. Proc. 2016, 1755, 080009. [Google Scholar]
  44. Tabaraki, R.; Nateghi, A. Optimization of ultrasonic-assisted extraction of natural antioxidants from rice bran using response surface methodology. Ultrason. Sonochem. 2011, 18, 1279–1286. [Google Scholar] [CrossRef] [PubMed]
  45. Nithitanakool, S.; Pithayanukul, P.; Bavovada, R. Antioxidant and hepatoprotective activities of Thai mango seed kernel extract. Planta Med. 2009, 75, 1118–1123. [Google Scholar] [CrossRef] [Green Version]
  46. Sultana, B.; Hussain, Z.; Asif, M.; Munir, A. Investigation on the antioxidant activity of leaves, peels, stems bark, and kernel of mango (Mangifera indica L.). J. Food Sci. 2012, 77, C849–C852. [Google Scholar] [CrossRef]
  47. Dorta, E.; González, M.; Lobo, M.G.; Sánchez-Moreno, C.; de Ancos, B. Screening of phenolic compounds in by-product extracts from mangoes (Mangifera indica L.) by HPLC-ESI-QTOF-MS and multivariate analysis for use as a food ingredient. Food Res. Int. 2014, 57, 51–60. [Google Scholar] [CrossRef] [Green Version]
  48. Ribeiro, S.M.R.; Schieber, A. Bioactive compounds in mango (Mangifera indica L.). In Bioactive Foods in Promoting Health; Elsevier: London, UK, 2010; pp. 507–523. [Google Scholar]
  49. Polewski, K.; Kniat, S.; Slawinska, D. Gallic acid, a natural antioxidant, in aqueous and micellar environment: Spectroscopic studies. Curr. Top. Biophys. 2002, 26, 217–227. [Google Scholar]
  50. Mirghani, M.E.; Yosuf, F.; Kabbashi, N.; Vejayan, J.; Yosuf, Z. Antibacterial activity of mango kernel extracts. J. Appl. Sci. 2009, 9, 3013–3019. [Google Scholar] [CrossRef]
  51. Alaiya, M.A.; Odeniyi, M.A. Utilisation of Mangifera indica plant extracts and parts in antimicrobial formulations and as a pharmaceutical excipient: A review. Future J. Pharm. Sci. 2023, 9, 29. [Google Scholar] [CrossRef]
Figure 1. Effect of independent extraction variables on the yield of gallic acid from MSK (a) Solvent concentration (%); (b) Solvent-to-sample ratio (mL/g); (c) Temperature (°C); (d) Time (min). Letters (a–e) present significance (p < 0.05) among levels.
Separations 10 00376 g001aSeparations 10 00376 g001b
Figure 2. Response surface plots of gallic acid yield from MSK as affected by solvent concentration, solvent-to-sample ratio, temperature, and time using UAE: (a) solvent concentration and solvent-to-sample ratio; (b) solvent concentration and temperature; (c) solvent concentration and time; (d) temperature and solvent-to-sample ratio; (e) time and solvent-to-sample ratio; (f) time and temperature.
Separations 10 00376 g002
Figure 3. Antimicrobial activity of extracts (a) MSK-UAE and (b) MSK-Dec. against Clostridium perfringens.
Separations 10 00376 g003
Table 1. Coded and uncoded levels of extraction obtained by preliminary experiments.
Factors−2−10+1+2
Solvent concentration (%)010203040
Solvent-to-sample ratio (mL/g)1020304050
Temperature (°C)2030405060
Time (min)1015202530
Table 2. Experimental design using CCD on gallic acid yield of mango seed kernels.
Run OrderX1
Solvent Concentration (%)
X2
Solvent-to-Sample Ratio (mL/g)
X3
Temperature
(°C)
X4
Time
(min)
Y
Gallic Acid
(mg/g) *
110 (−1)20 (−1)30 (−1)15 (−1)4.33 ± 0.04
230 (1)40 (1)30 (−1)25 (1)3.85 ± 0.07
320 (0)30 (0)60 (2)20 (0)3.51 ± 0.10
410 (−1)40 (1)50 (1)25 (1)4.57 ± 0.04
510 (−1)20 (−1)50 (1)25 (1)4.45 ± 0.05
60 (−2)30 (0)40 (0)20 (0)3.86 ± 0.04
730 (1)40 (1)50 (1)25 (1)4.09 ± 0.10
820 (0)30 (0)40 (0)20 (0)6.06 ± 0.12
920 (0)30 (0)40 (0)20 (0)6.13 ± 0.06
1030 (1)20 (−1)50 (1)25 (1)4.90 ± 0.08
1140 (2)30 (0)40 (0)20 (0)3.86 ± 0.07
1230 (1)20 (−1)30 (−1)15 (−1)4.15 ± 0.02
1330 (1)40 (1)50 (1)15 (−1)3.56 ± 0.06
1410 (−1)20 (−1)50 (1)15 (−1)3.61 ± 0.10
1520 (0)30 (0)40 (0)30 (2)5.30 ± 0.36
1630 (1)20 (−1)50 (1)15 (−1)4.24 ± 0.23
1710 (−1)40 (1)30 (−1)15 (−1)5.08 ± 0.08
1830 (1)40 (1)30 (−1)15 (−1)4.00 ± 0.10
1930 (1)20 (−1)30 (−1)25 (1)4.54 ± 0.25
2010 (−1)40 (1)50 (1)15 (−1)4.13 ± 0.31
2120 (0)10 (−2)40 (0)20 (0)4.63 ± 0.23
2220 (0)30 (0)20 (−2)20 (0)4.00 ± 0.05
2320 (0)50 (2)40 (0)20 (0)4.35 ± 0.18
2410 (−1)20 (−1)30 (−1)25 (1)4.36 ± 0.11
2510 (−1)40 (1)30 (−1)25 (1)4.74 ± 0.07
2620 (0)30 (0)40 (0)20 (0)6.07 ± 0.19
2720 (0)30 (0)40 (0)10 (−2)4.51 ± 0.20
* (n = 3), Data are the mean ± SD.
Table 3. ANOVA for the fitted quadratic model.
SourceSum of SquareMean SquareF-Valuep-Value
Model13.570.968972.79˂0.0001
Solvent Concentration0.15680.156811.780.0050
Solvent-to-sample ratio0.05230.05233.930.0709
Temperature0.25630.256319.250.0009
Time0.66000.660049.58<0.0001
Solvent Concentration × Solvent-to-sample ratio1.051.0578.93<0.0001
Solvent Concentration × Temperature0.25000.250018.780.0010
Solvent Concentration × Time0.01320.01320.99350.3386
Solvent-to-sample ratio × Temperature0.08120.08126.100.0295
Solvent-to-sample ratio × Time0.12960.12969.740.0089
Temperature × Time0.40320.403230.290.0001
Solvent Concentration26.476.47486.28<0.0001
Solvent-to-sample ratio23.303.30247.95<0.0001
Temperature27.107.10533.73<0.0001
Time21.791.79134.40<0.0001
Lack-of-fit0.15690.015710.940.0866
Table 4. Optimum conditions with experimental and predicted values of gallic acid yield (mean ± SD).
Optimum ConditionsExtraction Yield
Solvent concentration (%)Solvent-to-sample ratio (mL/g)Temperature (°C)Time
(min)
Experimental
(mg/g)
Predicted
(mg/g)
19.429.3238.4721.46.1 ± 0.096.1 ± 0.11
Table 5. Characterization of gallic acid-rich MSK extract in comparison with conventional extraction method.
ExtractsGallic Acid (mg/g)TPC as GAE, (mg/g)TFC as CE, (mg/g)Radical Scavenging Activity %Zone of Inhibition (mm)
MSK-UAE *6.11 ± 0.11 a64.30 ± 1.48 a4.99 ± 0.14 a73.50 ± 0.06 a18 ± 1
MSK-Dec.**2.03 ± 0.01 b13.11 ± 0.21 b2.97 ± 0.07 b53.66 ± 0.14 b16 ± 1
p-value0.0000.0000.0000.0000.070
Values are presented as (n = 3): means ± SD, superscripts present significance (p < 0.05). * MSK-UAE: optimized MSK extract, ** MSK-Dec.: conventional decoction MSK extract.
Disclaimer/Publisher’s Note: The statements, opinions and data contained in all publications are solely those of the individual author(s) and contributor(s) and not of MDPI and/or the editor(s). MDPI and/or the editor(s) disclaim responsibility for any injury to people or property resulting from any ideas, methods, instructions or products referred to in the content.

