Abstract
The aim of this study was to evaluate the performance of a reverse osmosis (RO) membrane in surfactant removal using various surfactant model aqueous solutions. The separation tests were performed with laboratory scale units in a dead-end configuration. Cellulose Acetate (CA) and Polyamide (PA) RO membranes were used with nonionic, anionic, or cationic surfactants at a wide range of concentrations. Membrane performance was evaluated using permeate flux and total organic carbon (TOC) rejection. The effects of surfactant type and concentration on RO membranes were assessed. Permeate flux of the PA membrane depended on the surfactant type and concentration. The separation of cationic surfactant aqueous solutions yielded the lowest permeate flux, followed by nonionic and anionic surfactant aqueous solutions, respectively. Surfactant adsorption on the membrane surface occurred at very low concentration of cationic and nonionic surfactants due to electrostatic and hydrophobic interactions, respectively, which affected permeate flux, and micelles did not affect the permeate flux of PA membrane. However, for CA membrane the permeate flux was not affected by the feed solution. Both membranes exhibited satisfactory TOC rejection (92–99%). This study highlights the importance of assessing interactions between membrane material and surfactant molecules to mitigate membrane fouling and guarantee a better performance of the RO membrane.
1. Introduction
Surfactants (surface active agents) are amphiphilic molecules containing two opposing parts: one part is hydrophilic (head) and the other is hydrophobic (tail). Based on the charge of the polar head, surfactants can be classified as anionic, cationic, nonionic or zwitterionic when the charge is negative, positive, non-charged or negative and negative, respectively [1]. When dissolved in water, surfactants exist as monomers or micelle, when their concentration is below or above the critical micelle concentration (CMC), respectively [2]. In addition to their ability to reduce surface and interfacial tension, surfactants may have emulsifying, wetting or foaming properties. They are widely applied from primary production processes, such as recovery of raw materials and their purification in mining, oil and gas industries, to the formulation of many products such as pharmaceuticals, cosmetics, foods and paints [3]. Surfactant use has been growing since the 1990s from 1.8 million ton in 1987, 9.3 million ton in 1995 [4] to 24.2 million tons in 2022 [5]. Among the different types, anionic surfactants account for more than 60% of the overall use, whilst nonionic and cationic surfactants represent 30% and 10%, respectively [6]. Due to their wide usage range, surfactants are encountered in sewage and industrial wastewater at different concentrations. Table 1 summarizes some examples of surfactant contaminated wastewater of different effluents.

Table 1.
Surfactant concentration in wastewater.
With the growing of the surfactant market and the wide range of surfactants encountered in wastewater, concerns of the impact of surfactants on the environment and treatment plants have been increasing [14,15]. Surfactants are considered as emerging contaminants [5]. Numerous research reported the negative impact of surfactants on environment and humans [16]. It was reported that surfactant can increase the solubility of organic hydrocarbon compounds in water, and their sorption into soils and sediments, which could be harmful to crops [16]. It has been reported that exposure to benzalkonium chlorides can foster resistance of microbes to antibiotic [17]. Due to their properties and structure, surfactants could solubilize harmful substances, such as heavy metals [13].
Concerns about the environmental impact of surfactants led to more restrict regulations regarding their biodegradability and maximum allowable concentration for different water matrices [18,19,20]. Conventional methods for the removal of surfactants from wastewater are biological [21,22], chemical by coagulation-flocculation or adsorption [4,23], or combined chemical and biological treatments using advanced oxidation processes as pre-treatment methods [24]. Due to the wide range of surfactants discharged in wastewater and their physico-chemical properties, it is difficult to develop an efficient single treatment method.
Membrane technology is gaining the interest of researchers as contenders for surfactant removal. Many studies reported promising results regarding surfactant removal. It has been reported that ultrafiltration (UF) and microfiltration (MF) are effective for the removal of surfactant micelles. However, nanofiltration (NF) and reverse osmosis (RO) are suggested for the recovery of surfactant monomers [25,26].
The separation of model cationic surfactant solution (TEAQ) using UF and MF membranes was studied by Kliomada and Kowalska [13]. Both processes yielded relatively high rejection values (94–97%) for 1000 mg/L feed concentration. However, it was reported that the permeate flux decreased by 60% compared to the pure water flux.
Separation of anionic surfactant sodium lauryl-ether-sulfate using NF membranes with different selective layers was reported [27]. In their study, permeate flux of strong hydrophilic negatively charged NF membrane depended on physical-chemical properties of the anionic surfactant and the electrostatic interactions between the membrane and the surfactant.
Treatment of laundry wastewater effluent with thin-film composite (TFC) polyamide RO membrane (PA) was investigated, in which 99.8% anionic surfactant rejection and 72% flux decline were reported for feed concentration of 83 mg/L [28]. In our previous study, separation by means of PA and CA reverse osmosis membranes of oil-in-water (O/W) emulsions stabilized by nonionic, anionic, or cationic surfactants was investigated. At high surfactant concentration (2000–10,000 mg/L), permeate flux of the PA membrane depended on the surfactant type. Whilst for the CA membrane, surfactant types and oil concentration in the O/W emulsions did not affect permeate flux. There have been fewer studies at low surfactant concentrations, therefore, further investigation of interactions between surfactants and RO membrane surface is needed.
Because PA membrane is most common commercial RO membranes, and CA membrane is still used widely, and compared as control [29], both PA and CA membranes are also used in the present study.
The effect of different types of surfactants at a wide range of concentration (below and above CMC) on the performance of RO membranes with different membrane materials was investigated. The aim of this work was to characterize the separation of three types (nonionic, anionic, or cationic) of surfactant in water solutions at different concentrations using PA and CA RO membranes.
2. Materials and Methods
2.1. Feed Solution:
Polyoxymethylene (20) sorbitan monolaurate (Tw 20, Fujifilm Wako Pure Chem. Ind., Osaka, Japan), cetrimonium bromide (CTAB, Fujifilm Wako Pure Chem. Ind., Osaka, Japan) and sodium oleate (SO, Fujifilm Wako Pure Chem. Ind., Osaka, Japan) were used as nonionic, cationic, and anionic model surfactants, respectively. The surfactant aqueous solutions were prepared by dissolving different surfactant in pure water (18 MΩ cm) produced by an Ultrapure water system (Sartorius, Arium® pro comfort II, Goettingen, Germany). Surfactant concentration of the feed solution ranged from 10 mg/L to 10,000 mg/L. This wide range allowed us to study the separation below and above CMC of each surfactant. All experiments were conducted at 25 °C. The zeta potential of the surfactant aqueous solution was measured using a zeta potential analyzer (Zetasizer, Nano ZS, Malvern Instruments Ltd., Worcestershire, UK). Conductivity and pH of feed solution were monitored. Table 2 summarizes the characteristics of different surfactants used in this study.
Table 2.
Characteristics of surfactants used in this study.
2.2. Separation Using RO Membrane:
Two types of flat sheet RO membranes manufactured by Toray Industries, Inc., Japan, were used in this study. Polyamide (PA) and Cellulose Acetate (CA) RO membranes were selected in this study as they are the most commonly used in water purification and industrial processes today. The same types of RO membranes were used in our previous work for the separation of oil-in-water emulsions stabilized by different types of surfactant [33].
- -
- “UTC-73” as PA thin film composite (TFC) membrane.
The PA membrane is composed of a cross-linked aromatic polyamide layer (Thickness = 200 μm), a polysulfone support layer (Thickness = 45 μm) and a polyester non-woven fabric (Thickness = 100 μm). This type of membrane is widely used for desalination of high salinity brackish water, because of its capability to achieve higher water flux and salt rejection [6]. At 25 °C, NaCl concentration of 1500 mg/L and applied pressure of 1.5 MPa, PA membrane performance reported by the manufacturer are: NaCl rejection = 99.8%; permeate flux = 46.3 L m−2 h−1
- -
- “SC-3000” as CA membrane.
The asymmetric CA membrane, composed of a dense barrier layer, a support layer, and a non-woven fabric. At 25 °C, NaCl concentration of 1500 mg/L and applied pressure of 3 MPa NaCl rejection = 98.0%; permeate flux = 29.6 L m−2 h−1. Loeb-Sourirajan invented the CA membrane 60 years ago. This membrane was widely used until 1980. Despite its relatively low permeate flux, CA membrane is still used today because of its high chlorine resistance and good mechanical stability [34].
Following the recommendation of the manufacturer, the RO membranes were kept at 5 °C and washed with Ultrapure water before every experiment to remove any preservative agents. Surface morphology (SEM) of fresh PA and CA membranes was characterized using SEM imaging (TM-1000 Miniscope, Hitachi High Technologies, Tokyo, Japan), at an accelerating voltage of 15 kV. Samples of the fresh flat sheet RO membranes were manually cross-sectioned using clean scissors and the edges of the cut section were attached perpendicularly to metal stubs using double-sided adhesive tape.
Separation tests were performed using a flat sheet membrane test cell (Nitto Denko Co., Kusatsu, Japan) operated in dead-end configuration at room temperature (~25 °C). The effective membrane surface was 33.3 cm2. Experiments were conducted under operating pressure of 1.5 MPa delivered by a nitrogen gas cylinder. Membrane test cell was placed on a magnetic stirring of 500 rpm. The membrane test cell was filled with 300 g of feed (surfactant aqueous solution). The permeate flux was recorded continuously using an electronic balance (model UX620H, Shimadzu, Japan) connected to a personal computer. For each feed solution a new piece of RO membrane was used. The pure water flux was measured before (J0) and after (Ja) each separation test. Experiments were performed up to a recovery ratio of 10% (Collected permeate represent 10% of the initial feed solution). After each test, sample of feed, retentate and permeate was collected for Total Organic Carbon (TOC) analysis using the Total Organic Carbon Analyzer (SHIMADZU TOC- LCPH/CPN, Japan). Due to the wide range of surfactant concentration, separation experiments were performed once. Figure 1 shows the separation setup of this study.
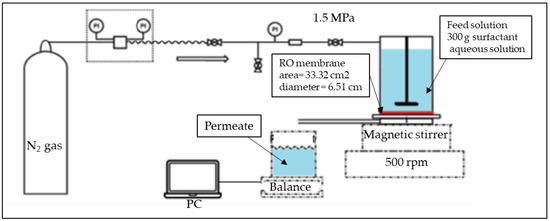
Figure 1.
Schematic representation of the RO separation setup.
The performance of both RO membranes used in this study during the separation of different surfactant aqueous solutions was evaluated using their permeate flux and TOC rejection.
The permeate flux (J) (L m−2 h−1) was calculated using Equation (1), as follows [35]:
where m (kg) is the permeate mass, ρ (kg/L) is the density of the feed, t (h) is the test time, and A (m2) is the effective membrane surface area.
J = m/(ρ · t · A)
The relative flux (RF) of membrane was determined using Equation (2), as follows [13]:
where J0 (L m−2 h−1) is the pure water flux of fresh membrane before operation. After surfactant aqueous solution experiments, the membrane was washed gently with MQ-water and the pure water flux (Ja) (L m−2 h−1) was measured again. The relative pure water flux (RPWF) of the membrane was calculated using Equation (3), as follows:
RF = (J/J0) × 100
RPWF = (Ja/J0) × 100
Membrane rejection was assessed using total organic carbon (TOC) rejection, calculated using Equation (4), as follows [7]:
where R is TOC rejection (%); Cp and Cf (mg/L) are permeate and feed concentrations, respectively and Y is permeate recovery (Y = permeate volume (V)/feed volume (Vf)).
R = (1 − ln (1 − YCp/Cf)/ln (1 − Y)) × 100
3. Results and Discussion
3.1. Surfactant Aqueous Solution Separation
The zeta potentials of surfactants aqueous solutions are shown in Table 3. The zeta potential depended on the charge of the hydrophilic groups of different surfactants. The negative zeta potential for Tw 20 is due to the association of hydroxide ions with the hydrophilic head of the surfactant [36]. Zeta potential slightly changed with the surfactant concentration. The zeta potential of the SO + CTAB mixture was −16.7 ± 1.8 mV. The mixture of anionic and cationic surfactants results the formation of aggregates. The negative zeta potential of this mixture indicated that the formed aggregates are negatively charged.
Table 3.
Zeta potential of different feed solutions.
3.1.1. Membranes Fluxes as Function of Test Time
For a recovery ratio of 10%, the changes in permeate fluxes over time for different feed concentrations of PA and CA RO membranes are shown in Figure 2 and Figure 3, respectively. The required time depended on the membrane material (CA or PA), surfactant types and concentrations. As shown in Figure 2a–h, more separation time was needed to collect 10% permeate during separation of cationic surfactant. The permeate flux of PA membrane dropped instantaneously at the beginning of separation, except for the SO surfactant case. After the initial sharp decrease in the permeate flux, it continued to decrease gradually over time depending on the feed composition. For all surfactant concentration, the lowest permeate flux was obtained with cationic surfactant. Permeate flux behavior of PA membrane was decided by the interaction between surfactant and the membrane surface which is in accordance with previous study [33].
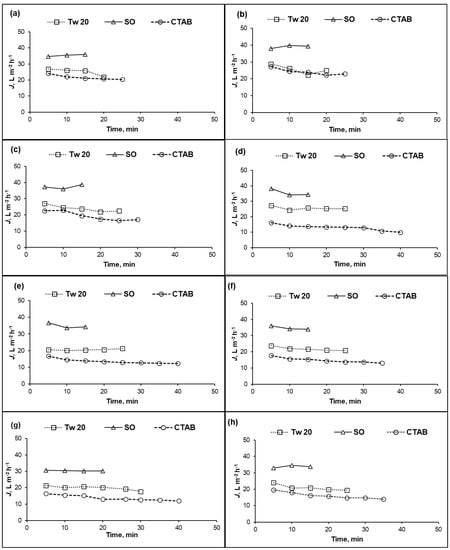
Figure 2.
Permeate flux (J) of PA membrane versus time at different surfactant concentrations: (a) 10 mg/L; (b) 25 mg/L; (c) 50 mg/L; (d) 100 mg/L; (e) 250 mg/L; (f) 500 mg/L; (g) 1000 mg/L; and (h) 10,000 mg/L; (10% recovery ratio, operating pressure = 1.5 MPa, temperature = 25 °C).
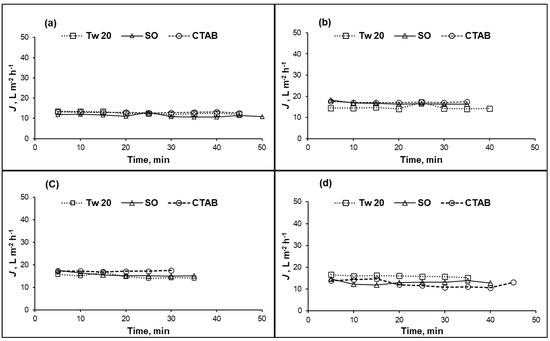
Figure 3.
Permeate flux (J) of CA membrane versus time at different surfactant concentrations: (a) 100 mg/L; (b) 500 mg/L; (c) 1000 mg/L; and (d) 10,000 mg/L; (10% recovery ratio, operating pressure = 1.5 MPa, temperature = 25 °C).
For the case of CA membrane, permeate fluxes were almost constant for all feed compositions (surfactant type and concentration) as summarized in Figure 3a–d. The permeate flux of CA membrane did not change with time confirming that the steady state was reached from the beginning of the separation test. For concentration range 100–10,000 mg/L, different surfactants did not affect the permeate flux of CA membrane contrarily to the case of PA membrane. We assume that interactions between surfactant and CA membrane surface did not take place.
Further discussions of interaction between RO membranes and different surfactants will be discussed in the following part.
3.1.2. Membranes Fluxes as Function of Surfactant Concentration
Figure 4 presents relative flux (J/J0) versus initial surfactant concentration in the feed solution for both RO membranes at 10% recovery ratio. It was observed that the relative flux of PA membrane (Figure 4a) was affected by surfactant type and their concentration. For the entire range of surfactant concentration, the relative flux was higher during separation of SO, followed by Tw 20 and CTAB solutions, respectively. At surfactant concentration in the range 10–100 mg/L, relative fluxes were in the range 87–99%, 54–88%, and 42–65% for SO, Tw 20, and CTAB, respectively. While increasing the surfactant concentration, a slight decline in relative flux was observed. At high surfactant concentration 250–10,000 mg/L, relative fluxes varied from 91 to 99%, 57 to 60%, and 34 to 47% for SO, Tw 20, and CTAB, respectively. From the point of the ratio of feed concentration to CMC, relative fluxes were 91%, 88%, and 45% for SO, Tw 20, and CTAB, respectively, at surfactant concentration equivalent to around 0.1 CMC, where surfactants are in monomer form. At surfactant concentrations of SO (≈5.5 CMC), Tw 20 (≈4 CMC), and CTAB (≈3 CMC), relative fluxes were 91%, 56%, and 38%, respectively. For all the surfactants, PA membrane permeate flux was not affected by their CMC, which suggests that micelle did not affect membrane performance, but free surfactant molecules affected PA membrane performance. Previous researchers studied the effect of foulant containing textile effluent on RO flux [37]. Contrarily to our study, it was reported that at surfactant concentration below CMC, severe deterioration of RO membrane permeate flux was observed, and at concentration above CMC an increase of membrane productivity was noticed. These results may be because surfactant adsorption on the PA membrane surface may reach almost equilibrium at lower concentrations than CMC, and stable flux was observed in a wide range of surfactant concentrations.
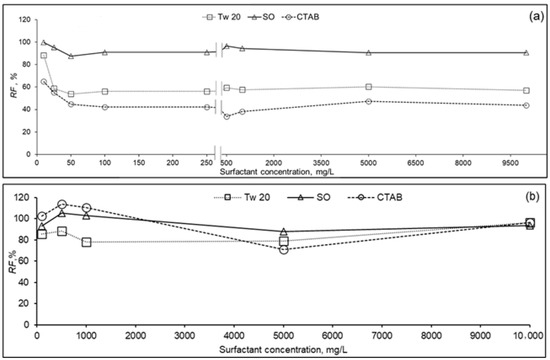
Figure 4.
Relative flux (RF) of RO membrane as function of surfactant concentration of PA (a) and CA (b) membranes (10% recovery ratio, TMP = 1.5 MPa, T = 25 °C).
Relative flux of CA membrane versus surfactant concentration is plotted in Figure 4b. For different surfactants and at concentration range 100–10,000 mg/L, relative fluxes varied from 78 to 110% compared to the initial pure water flux. CA membrane exhibited less permeate flux decline compared to PA membrane during the removal of the three types of surfactants, separately. We assume that there is less apparent interaction between the surfactant and the membrane surface. Similar behavior of permeate flux decline of CA and PA RO membranes was reported elsewhere [38]. In this study, the higher fouling rate of PA compared to CA membranes was attributed to its inherent surface roughness which could increase the surfactant adsorption onto the membrane surface in our study.
The relative fluxes (RF) and relative pure water fluxes (RPWF) at different surfactant concentrations for both RO membranes are shown in Figure 5. The RF of the PA membrane obtained with SO surfactant was higher than those obtained by Tw 20 and CTAB surfactants. For this membrane, the treatment of SO (Figure 5b) at various concentrations brought the RPWF into the range 90–117%. However, RPWF after the separation of Tw 20 (Figure 4a) and CTAB (Figure 5c) were almost the same as relative flux of the surfactant and were not recovered to the pure water flux of the fresh membrane. The highest deterioration was exhibited by the CTAB surfactant followed by Tw 20 and less for SO. Results were different with the CA membrane as shown in Figure 5d–f. The relative pure water flux after separation was higher than the relative flux and it was fully recovered to the initial pure water flux for different surfactants used in this study. Flux decline at 1000 mg/L CTAB surfactant for PA membrane was 60% which is similar to results reported in previous studies [13]. Whilst a small flux decline was observed for CA membrane.
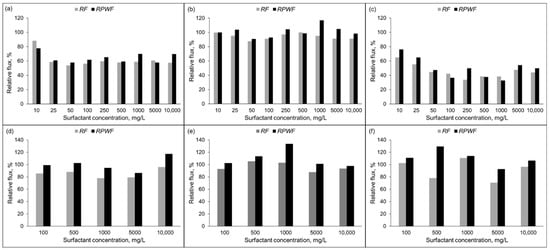
Figure 5.
Relative flux (RF) and Relative pure flux (RPWF) of RO membrane; PA membrane: (a) Tw 20; (b) SO; and (c) CTAB and CA membrane: (d) Tw 20; (e) SO; and (f) CTAB (10% recovery ratio, TMP = 1.5 MPa, T = 25 °C).
These results suggests that relative flux decline was due to surfactant adsorption to the PA membrane surface. Both RO membranes used in this study were hydrophilic as their contact angles θ < 90° (PA = 15°; CA = 43°) [33]. PA membrane is more hydrophilic than CA membrane which explain its higher flux reported by the membrane manufacturer Zeta potential and surface morphology of TFC polyamide and asymmetric cellulose RO membranes are reported elsewhere [38]. The pH of different surfactant aqueous solution was in the range 5–9. At this pH, both PA membranes are negatively charged, whilst the CA is weakly charged. TFC polyamide membrane surface exhibits protuberance structure implying a rough surface of this membrane contrarily to the relatively smooth membrane of the CA membrane as shown in the cross section SEM images of the RO membranes reported in Figure 6 [34,38,39,40].
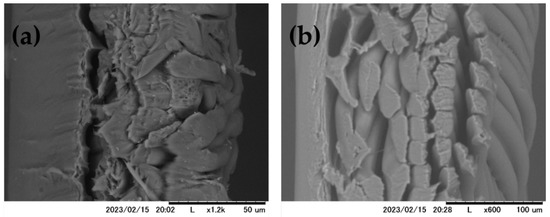
Figure 6.
SEM images of cross section of PA (a) and CA (b) membranes.
Permeate flux of PA membrane during separation of different surfactant aqueous solutions decreased mainly due to surfactant adsorption on membrane surface. Surfactant adsorption onto membrane surface was governed by electrostatic and hydrophobic interactions between the surfactant molecule and the membrane surface. Adsorption did not occur during the separation of anionic surfactant. SO surfactant was repelled from the negatively charged PA membrane. Whilst severe flux decline during separation of CTAB was caused by the adsorption of positively charged head of surfactant monomers and micelles on the negative charged PA membrane. Our results agree well with previous reports [39,41]. In the case of Tw 20, a decrease in membrane permeate flux could be attributed to hydrophobic interactions between the surfactant and the membrane surface [42]. It is important to report that the permeate flux of PA during separation of cationic or anionic surfactants decreased at very low concentrations (below CMC). CTAB and Tw 20 molecules quickly adsorbed onto the PA membrane surface and adsorption saturation was reached at a very low concentration at the beginning of the separation test.
The slight decline in relative flux during the separation of different surfactants could be a result of accumulation of surfactant near the CA membrane surface without interaction. A gentle cleaning of the membrane with pure water allowed a recuperation of the pure water flux. This implies that surfactant adsorption at the membrane surface did not occur due to the absence of interaction between the surfactant and the membrane surface. The CA membrane used in this research is hydrophilic, weakly charged with a relatively smooth surface which prevented the membrane fouling by adsorption. A schematic representation of interaction between the RO membrane surfaces and the surfactants is presented in Figure 7.
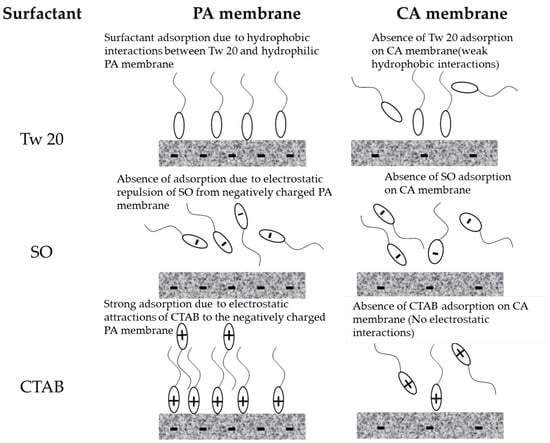
Figure 7.
Schematic representation of interaction between RO membranes and surfactants.
Membrane surface morphology can also affect membrane performance during surfactant removal. The rough surface of the PA membrane may encourage the adsorption of surfactant resulting in a flux decline which was not observed for the CA membrane with relatively smooth surface [34,38,43]. The adsorption of surfactant to the RO membrane was enhanced by its surface charge, hydrophilicity, and roughness. To mitigate surfactant adsorption, it is recommended to develop hydrophilic, neutrally charged with a smooth surface membrane. This will promote further widespread applications of RO membranes in treating all types of surfactant which is in accordance with other studies [44].
3.1.3. Separation of Surfactant Mixture
The separation of a mixture of SO + Tw 20 or SO + CTAB at 50 mg/L with PA membrane was also investigated. Figure 8 shows the relative flux and pure water relative flux of the two mixtures.
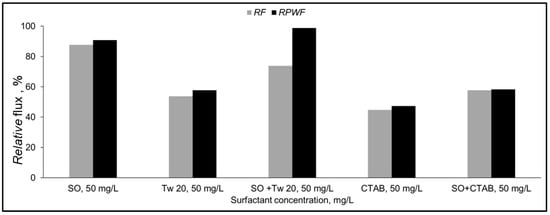
Figure 8.
Relative flux (RF) and Relative pure water flux (RPWF) of PA membrane for 50 mg/L surfactant mixture (10% recovery ratio, TMP = 1.5 MPa, T = 25 °C).
For the SO and Tw 20 mixture, an improvement by 20% and 40% for RF and RPWF, respectively compared to permeate flux with Tw 20 only was obtained. Additionally, the relative pure water flux was recovered to the initial pure water flux. The addition of SO may prevent Tw 20 from adsorption at the membrane surface. The deterioration of the permeate flux during this mixture separation might be due to the accumulation of surfactant aggregate near the membrane surface. The recovery of relative pure water flux implies that adsorption did not occur.
For the SO + CTAB mixture, a slight improvement by 10% of the relative flux of the mixture and the pure water after the separation compared to CTAB only was observed. The addition of SO allows to reduce the zeta potential of the CTAB aqueous solution as shown in Table 3. The pure water flux after mixture separation was not recovered which confirms that decrease of membrane permeate flux by CTAB is mainly caused by surfactant adsorption on the membrane surface. In this case, electrostatic attractions between hydrophilic groups of SO and CTAB occurred, and surfactant aggregate was formed. Our findings agree well with previous study [41].
3.2. Membrane Rejection
The performance of RO membranes used in the separation of different surfactants was evaluated by TOC rejection. Results are presented in Figure 9. At surfactant concentrations of 10–10,000 mg/L, TOC rejection varied from 96 to 99% and 92 to 99% for PA and CA membranes, respectively. TOC rejection of two surfactant mixtures at 50 mg/L each was also assessed. TOC rejections were 98.0% and 97.4% for SO + Tw 20 and SO + CTAB, respectively. Both RO membranes have high rejection rates at single surfactant solution or two surfactant mixture and could produce a very high quality of permeate.
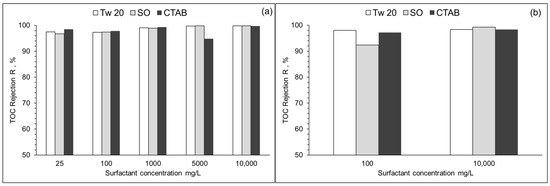
Figure 9.
TOC rejection (R) of PA (a) and CA (b) membrane at different surfactant concentrations. (10% recovery ratio, TMP = 1.5 MPa, T = 25 °C).
3.3. Process Implementation and Scalability
At present, the RO membrane process for the removal of surfactants from wastewater are in the basic study stage and the economics of the RO membrane process has not been studied well. Most common conventional methods for the removal of surfactants from wastewater are biological and chemical by coagulation-flocculation or adsorption, or combined chemical and biological treatments using advanced oxidation processes as pre-treatment methods. Compared to the conventional methods, membrane processes, especially RO membrane processes, provide high-quality treated water with low surfactant concentrations as presented in this study; RO membrane processes are simple and require less treatment energy, so the process is expected to be economically viable.
With the scarcity of water resources in arid and semi-arid regions and competition between water usages (drinking, agriculture, industry, tourism,), it is necessary to find alternative water sources. Reuse of the treated wastewater could be a promising alternative. This process is much cheaper than seawater desalination as sewage and industrial wastewater contain lower concentrations of salt which requires a lower operating pressure. Bai et al. economically evaluated the full-scale MF and RO process for wastewater treatment at the Changi NEWater Project in Singapore with a production capacity of 228,000 m3/d [45]. They reported treatment cost between 0.08 and 0.15 $/m3. On the other hand, seawater desalination cost of the Shuqaiq 3 desalination plant in Saudi Arabia was around $ 0.51/m3 at a capacity of 380,000 m3/d [46].
With a proper choice of membrane material, membrane fouling could be mitigated leading to better control of energy consumption and extending the life of membrane. To cover membrane and energy cost, due to its good quality, treated wastewater can be reused in many industrial processes with high added value such superconductors and chemical industries [47].
Regarding the scalability of RO process in the removal of surfactant from wastewater, due to promising surfactant removal results we assume that the RO process for surfactant treatment is scalable. However, further investigation in laboratory scale crossflow configuration should be performed. Moreover, membrane cleaning tests should be studied beforehand. As reported in our study, the characterization of surfactant contaminated wastewater, interactions with the RO membrane material are with high importance to guarantee good performance of the process and treatment cost.
4. Conclusions
Effects of nonionic, anionic, and cationic surfactants at wide concentrations on the performance of PA and CA RO membranes in dead-end separation configuration were investigated. Less effect on CA membrane performance was observed. Whilst PA membrane permeate flux depended on surfactant type and concentration.
Permeate flux decreased with cationic and nonionic surfactants at very low concentration at the beginning of the test due to surfactant adsorption on the PA membrane surface. CTAB and Tw 20 molecules adsorb quickly to the polyamide surface, in which adsorption may reach saturation at lower concentrations than their CMC. Adsorption on the membrane surface occurs mainly due to electrostatic and hydrophobic interactions between surfactant monomers and the membrane surface. Less flux decline was observed for the anionic surfactant which was repelled from the negatively charged PA membrane. Important findings were that permeate flux of PA membrane was determined by free surfactants molecules adsorption in their low concentration, not by their micelles. The addition of anionic surfactant to nonionic surfactant aqueous solution improved the productivity of PA membrane. However, a slight improvement was observed when it was added to cationic surfactant aqueous solution. CA membrane showed stable permeate flux during the separation of different surfactants at different concentration. We assume that no apparent interactions between surfactant and membrane surface took place. Membrane surface morphology can also influence surfactant adsorption. Adsorption was more important at the rough surface of the PA membrane compared to the relatively smooth surface of the CA membrane.
Through this research, better understanding of interactions between surfactant monomers and membrane surface was provided. Despite the attractive water permeability of fresh PA membrane, permeate flux was deteriorated during the separation of nonionic and cationic surfactants aqueous solutions. Satisfying results of permeate flux was observed with anionic surfactant. CA membrane, despite their relatively low flux, could be a better choice of membrane material during the treatment of different types of surfactant contaminated wastewaters. The high surfactant rejections gave RO membranes used in this research a promising potential in the treatment of surfactants contaminated wastewater compared to conventional methods of surfactant removal from wastewater. However, permeate flux decline due to surfactant adsorption can be a major drawback for scaling up this process. Thus, a proper choice of membrane material, depending on the type of surfactant discharged in the wastewater, is recommended in order to mitigate membrane fouling by surfactant adsorption. PA membrane is more effective in treating wastewater containing anionic surfactant. This type of membrane should be avoided while treating wastewater with cationic surfactant. CA membrane is efficient in treating wastewater containing different types of surfactants. Hydrophilic, weak-charged with smooth surface RO membrane is suitable for treating surfactant-contaminated wastewater.
Author Contributions
A.H.: Conceptualization, methodology, data curation, formal analysis, validation, writing—original draft, editing. F.Y.: Methodology, data curation, writing—review and editing. M.N. and M.A.N.: Supervision, project administration, funding acquisition, data curation, formal analysis, writing—review and editing, resources. All authors have read and agreed to the published version of the manuscript.
Funding
This research was partly funded by Japan Science and Technology Agency and the University of Tsukuba, Grant Number: JPMJSP2124 (JST Support for Pioneering Research Initiated by the Next Generation).
Informed Consent Statement
Not applicable.
Data Availability Statement
Data is contained within the article. Further requests can made to the corresponding author.
Acknowledgments
The authors are thankful to Toray Industries, Inc., Tokyo, Japan, for donating the RO flat sheet membranes.
Conflicts of Interest
The authors declare no conflict of interest. The funders had no role in the design of the study; in the collection, analyses, or interpretation of data; in the writing of the manuscript; nor in the decision to publish the results.
References
- Jönsson, A.S.; Jönsson, B. The Influence of Nonionic and Ionic Surfactants on Hydrophobic and Hydrophilic Ultrafiltration Membranes. J. Membr. Sci. 1991, 56, 49–76. [Google Scholar] [CrossRef]
- Kowalska, I.; Kabsch-Korbutowicz, M.; Majewska-Nowak, K.; Winnicki, T. Separation of Anionic Surfactants on Ultrafiltration Membranes. Desalination 2004, 162, 33–40. [Google Scholar] [CrossRef]
- Myers, D. Surfactant Science and Technology, 3rd ed.; J. Wiley: Hoboken, NJ, USA, 2006; ISBN 978-0-471-68024-6. [Google Scholar]
- Aboulhassan, M.A.; Souabi, S.; Yaacoubi, A.; Baudu, M. Removal of Surfactant from Industrial Wastewaters by Coagulation Flocculation Process. Int. J. Environ. Sci. Technol. 2006, 3, 327–332. [Google Scholar] [CrossRef]
- Palmer, M.; Hatley, H. The Role of Surfactants in Wastewater Treatment: Impact, Removal and Future Techniques: A Critical Review. Water Res. 2018, 147, 60–72. [Google Scholar] [CrossRef]
- Aloui, F.; Kchaou, S.; Sayadi, S. Physicochemical Treatments of Anionic Surfactants Wastewater: Effect on Aerobic Biodegradability. J. Hazard. Mater. 2009, 164, 353–359. [Google Scholar] [CrossRef]
- Orlandi, M.; Filosa, N.; Bettonte, M.; Fendrich, M.; Girardini, M.; Battistini, T.; Miotello, A. Treatment of Surfactant-Rich Industrial Wastewaters with Concentrated Sunlight: Toward Solar Wastewater Remediation. Int. J. Environ. Sci. Technol. 2019, 16, 2109–2114. [Google Scholar] [CrossRef]
- González, S.; Petrović, M.; Radetic, M.; Jovancic, P.; Ilic, V.; Barceló, D. Characterization and Quantitative Analysis of Surfactants in Textile Wastewater by Liquid Chromatography/Quadrupole-time-of-flight Mass Spectrometry. Rapid Commun. Mass Spectrom. 2008, 22, 1445–1454. [Google Scholar] [CrossRef] [PubMed]
- Lara-Martín, P.A.; González-Mazo, E.; Petrovic, M.; Barceló, D.; Brownawell, B.J. Occurrence, Distribution and Partitioning of Nonionic Surfactants and Pharmaceuticals in the Urbanized Long Island Sound Estuary (NY). Mar. Pollut. Bull. 2014, 85, 710–719. [Google Scholar] [CrossRef]
- Kowalska, I.; Kabsch-Korbutowicz, M.; Majewska-Nowak, K.; Pietraszek, M. Removal of Detergents from Industrial Wastewater in Ultrafiltration Process. Environ. Prot. Eng. 2005, 31, 207–219. [Google Scholar]
- Mondal, B.; Adak, A.; Datta, P. Degradation of Anionic Surfactant in Municipal Wastewater by UV-H2O2: Process Optimization Using Response Surface Methodology. J. Photochem. Photobiol. A Chem. 2019, 375, 237–243. [Google Scholar] [CrossRef]
- Mondal, B.; Adak, A.; Datta, P. Integrated UV–H2O2 and Biological Treatment Processes for the Removal of Cationic Surfactant. J. Environ. Eng. Sci. 2021, 16, 85–93. [Google Scholar] [CrossRef]
- Klimonda, A.; Kowalska, I. Membrane Technology for the Treatment of Industrial Wastewater Containing Cationic Surfactants. Water Resour. Ind. 2021, 26, 100157. [Google Scholar] [CrossRef]
- Ivanković, T.; Hrenović, J. Surfactants in the Environment. Arch. Ind. Hyg. Toxicol. 2010, 61, 95–110. [Google Scholar] [CrossRef] [PubMed]
- Zhu, F.-J.; Ma, W.-L.; Xu, T.-F.; Ding, Y.; Zhao, X.; Li, W.-L.; Liu, L.-Y.; Song, W.-W.; Li, Y.-F.; Zhang, Z.-F. Removal Characteristic of Surfactants in Typical Industrial and Domestic Wastewater Treatment Plants in Northeast China. Ecotoxicol. Environ. Saf. 2018, 153, 84–90. [Google Scholar] [CrossRef]
- Venhuis, S.H.; Mehrvar, M. Health Effects, Environmental Impacts, and Photochemical Degradation of Selected Surfactants in Water. Int. J. Photoenergy 1900, 6, 631840. [Google Scholar] [CrossRef]
- Tandukar, M.; Oh, S.; Tezel, U.; Konstantinidis, K.T.; Pavlostathis, S.G. Long-Term Exposure to Benzalkonium Chloride Disinfectants Results in Change of Microbial Community Structure and Increased Antimicrobial Resistance. Environ. Sci. Technol. 2013, 47, 9730–9738. [Google Scholar] [CrossRef] [PubMed]
- Nunes, R.F.; Teixeira, A.C.S.C. An Overview on Surfactants as Pollutants of Concern: Occurrence, Impacts and Persulfate-Based Remediation Technologies. Chemosphere 2022, 300, 134507. [Google Scholar] [CrossRef]
- United States Environmental Protection Agency. Safer Choice Criteria for Surfactants. Available online: https://www.epa.gov/saferchoice/safer-choice-criteria-surfactants (accessed on 6 January 2023).
- Regulation (EC) No 648/2004 of the European Parliament and of the Council of 31 March 2004 on Detergents (Text with EEA Relevance). 2004. Available online: https://www.ecolex.org/details/legislation/regulation-ec-no-6482004-of-the-european-parliament-and-of-the-council-on-detergents-lex-faoc042319/ (accessed on 2 February 2023).
- Dhouib, A.; Hamad, N.; Hassaїri, I.; Sayadi, S. Degradation of Anionic Surfactants by Citrobacter Braakii. Process Biochem. 2003, 38, 1245–1250. [Google Scholar] [CrossRef]
- Mungray, A.K.; Kumar, P. Anionic Surfactants in Treated Sewage and Sludges: Risk Assessment to Aquatic and Terrestrial Environments. Bioresour. Technol. 2008, 99, 2919–2929. [Google Scholar] [CrossRef]
- Kaleta, J.; Elektorowicz, M. The Removal of Anionic Surfactants from Water in Coagulation Process. Environ. Technol. 2013, 34, 999–1005. [Google Scholar] [CrossRef]
- Amat, A.M.; Arques, A.; Miranda, M.A.; Seguí, S. Photo-Fenton Reaction for the Abatement of Commercial Surfactants in a Solar Pilot Plant. Sol. Energy 2004, 77, 559–566. [Google Scholar] [CrossRef]
- Suárez, L.; Díez, M.A.; García, R.; Riera, F.A. Membrane Technology for the Recovery of Detergent Compounds: A Review. J. Ind. Eng. Chem. 2012, 18, 1859–1873. [Google Scholar] [CrossRef]
- Kowalska, I.; Majewska-Nowak, K.; Kabsch-Korbutowicz, M. Influence of Temperature on Anionic Surface Active Agent Removal from a Water Solution by Ultrafiltration. Desalination 2006, 198, 124–131. [Google Scholar] [CrossRef]
- Archer, A.C.; Mendes, A.M.; Boaventura, R.A.R. Separation of an Anionic Surfactant by Nanofiltration. Environ. Sci. Technol. 1999, 33, 2758–2764. [Google Scholar] [CrossRef]
- Morris, B.G.; Aziz, M.; Kasongo, G. Remediation of Laundry Wastewater with a Low-Pressure Aromatic Polyamide Thin-Film Composite Reverse Osmosis Membrane for Membrane Fouling Minimisation and Reuse Application. Environ. Protect. Eng. 2022, 48, 43–57. [Google Scholar] [CrossRef]
- Kurihara, M. Current Status and Future Trend of Dominant Commercial Reverse Osmosis Membranes. Membranes 2021, 11, 906. [Google Scholar] [CrossRef] [PubMed]
- Sekikawa, T.; Toshiki, K. A New Method for Efficient Detection of Cryptosporidium RNA by Real-Time Reverse Transcription-PCR with Surfactants. Water Sci. Technol. Water Supply 2015, 15, 1061–1068. [Google Scholar] [CrossRef]
- Akhter, M.S. Effect of N-Methyl Acetamide on the Critical Micelle Concentration of Aqueous Solutions of Some Surfactants. Colloids Surf. 1997, 121, 103–109. [Google Scholar] [CrossRef]
- Virga, E.; Bos, B.; Biesheuvel, P.M.; Nijmeijer, A.; de Vos, W.M. Surfactant-Dependent Critical Interfacial Tension in Silicon Carbide Membranes for Produced Water Treatment. J. Colloid Interface Sci. 2020, 571, 222–231. [Google Scholar] [CrossRef]
- Halleb, A.; Yokoyama, F.; das Neves, M.A.; Nakajima, M. Effects of Surfactants and Oil-in-Water Emulsions on Reverse Osmosis Membrane Performance. Euro-Mediterr. J. Environ. Integr. 2021, 6, 44. [Google Scholar] [CrossRef]
- Kurihara, M.; Sasaki, T. The Pursuits of Ultimate Membrane Technology Including Low Pressure Seawater Reverse Osmosis Membrane Developed by Mega-Ton Water System Project. J. Membr. Sci. Res. 2017, 3, 157–173. [Google Scholar]
- Dammak, I.; Neves, M.A.; Nabetani, H.; Isoda, H. Food and Bioproducts Processing Transport Properties of Oleuropein through Nanofiltration Membranes. Food Bioprod. Process. 2015, 94, 342–353. [Google Scholar] [CrossRef]
- Dickhout, J.M.; Moreno, J.; Biesheuvel, P.M.; Boels, L.; Lammertink, R.G.H.; de Vos, W.M. Produced Water Treatment by Membranes: A Review from a Colloidal Perspective. J. Colloid Interface Sci. 2017, 487, 523–534. [Google Scholar] [CrossRef] [PubMed]
- Srisukphun, T.; Chiemchaisri, C.; Urase, T.; Yamamoto, K. Experimentation and Modeling of Foulant Interaction and Reverse Osmosis Membrane Fouling during Textile Wastewater Reclamation. Sep. Purif. Technol. 2009, 68, 37–49. [Google Scholar] [CrossRef]
- Elimelech, M.; Zhu, X.; Childress, A.E.; Hong, S.; Shi, L.; Huang, J.; Zeng, G.; Zhu, L.; Gu, Y.; Shi, Y.; et al. Role of Membrane Surface Morphology in Colloidal Fouling of Cellulose Acetate and Composite Aromatic Polyamide Reverse Osmosis Membranes. J. Membr. Sci. 1997, 127, 101–109. [Google Scholar] [CrossRef]
- Childress, A.E.; Elimelech, M. Effect of Solution Chemistry on the Surface Charge of Polymeric Reverse Osmosis and Nanofiltration Membranes. J. Membr. Sci. 1996, 119, 253–268. [Google Scholar] [CrossRef]
- Asaka, K. Dielectric Properties of Cellulose Acetate Reverse Osmosis Membranes in Aqueous Salt Solutions. J. Membr. Sci. 1990, 50, 71–84. [Google Scholar] [CrossRef]
- Kishimoto, N.; Kimura, H. Fouling Behaviour of a Reverse Osmosis Membrane by Three Types of Surfactants. J. Water Reuse Desalination 2012, 2, 40–46. [Google Scholar] [CrossRef]
- Childress, A.E.; Elimelech, M. Relating Nanofiltration Membrane Performance to Membrane Charge (Electrokinetic) Characteristics. Environ. Sci. Technol. 2000, 34, 3710–3716. [Google Scholar] [CrossRef]
- Vrijenhoek, E.M.; Hong, S.; Elimelech, M. Influence of Membrane Surface Properties on Initial Rate of Colloidal Fouling of Reverse Osmosis and Nanofiltration Membranes. J. Membr. Sci. 2001, 188, 115–128. [Google Scholar] [CrossRef]
- Chen, B.; Yu, S.; Zhao, X. The Influence of RO Membrane Surface Properties on Surfactant Fouling in Radioactive Wastewater Treatment. Process Saf. Environ. Prot. 2021, 149, 858–865. [Google Scholar] [CrossRef]
- Bai, Y.; Shan, F.; Zhu, Y.; Xu, J.; Wu, Y.; Luo, X.; Wu, Y.; Hu, H.-Y.; Zhang, B. Long-Term Performance and Economic Evaluation of Full-Scale MF and RO Process–A Case Study of the Changi NEWater Project Phase 2 in Singapore. Water Cycle 2020, 1, 128–135. [Google Scholar] [CrossRef]
- Kurihara, M. Sustainable Seawater Reverse Osmosis Desalination as Green Desalination in the 21st Century. J. Membr. Sci. Res. 2020, 6, 20–29. [Google Scholar]
- Aleisa, E.; Alshayji, K. Analysis on Reclamation and Reuse of Wastewater in Kuwait. J. Eng. Res. 2019, 7, 1–13. [Google Scholar]


Disclaimer/Publisher’s Note: The statements, opinions and data contained in all publications are solely those of the individual author(s) and contributor(s) and not of MDPI and/or the editor(s). MDPI and/or the editor(s) disclaim responsibility for any injury to people or property resulting from any ideas, methods, instructions or products referred to in the content. |
© 2023 by the authors. Licensee MDPI, Basel, Switzerland. This article is an open access article distributed under the terms and conditions of the Creative Commons Attribution (CC BY) license (https://creativecommons.org/licenses/by/4.0/).