Article

Development and Validation for Quantitative Determination of Genotoxic Impurity in Gemfibrozil by Gas Chromatography with Mass Spectrometry

by
Hari Naga Prasada Reddy Chittireddy
1,
J. V. Shanmukha Kumar
1,*,
Anuradha Bhimireddy
1,
Mohammed Rafi Shaik
2,*,
Mohammad Rafe Hatshan
2,
Mujeeb Khan
2,
Abdulrahman Alwarthan
2 and
Baji Shaik
3
1
Department of Engineering Chemistry, College of Engineering, Koneru Lakshmaiah Education Foundation, Vaddeswaram, Guntur 522 502, Andhra Pradesh, India
2
Department of Chemistry, College of Science, King Saud University, Riyadh 11451, Saudi Arabia
3
School of Chemical Engineering, Yeungnam University, Gyeongsan 38541, Republic of Korea
*
Authors to whom correspondence should be addressed.
Separations 2023, 10(3), 145; https://doi.org/10.3390/separations10030145
Submission received: 22 January 2023 / Revised: 13 February 2023 / Accepted: 20 February 2023 / Published: 21 February 2023
(This article belongs to the Special Issue Advances in Chromatographic Analysis of Bioactive Compounds)

Abstract

:
All regulatory organizations are paying close attention to the identification and measurement of genotoxic contaminants. Using conventional analytical techniques like high-performance liquid chromatography (HPLC) and gas chromatography to quantify probable genotoxic substances (PGIs) at the trace level is difficult (GC). Therefore, there is a necessity for advanced analytical techniques for the development of highly sensitive analytical procedures for the determination of trace-level PGIs in drug products and drug substances. This study’s goal is to develop and evaluate an analytical technique for measuring allyl chloride, a possible genotoxic contaminant in gemfibrozil. For the detection of very low and trace levels of impurities, a gas chromatography with a triple quadrupole mass spectrometry detector (GC-MS/MS) approach was developed and validated. Using a column USP phase G27, a nonpolar and low bleed 5% diphenyl, 95% dimethylpolysiloxane, with dimensions of 30 m in length, 0.32 mm internal diameters, and 1.5 m film thickness, along with a flow rate of 2.0 mL/min and Helium (He) as a carrier gas, this method uses a thermal gradient elution program. The method was calibrated with a linearity range from 30% to 150% concentration with respect to the specification level and achieved a limit of detection (LOD) and limit of quantification (LOQ) were 0.005 ppm and 0.01 ppm, respectively, for allyl chloride. According to current ICH requirements, the method was validated, and it was discovered to be specific, exact, accurate, linear, sensitive, tough, robust, and stable. This method is suitable for determining allyl chloride in the regular analysis of Gemfibrozil.

Graphical Abstract

1. Introduction

In the manufacture of pharmaceutical products for commercial use or clinical research, it is a primary responsibility of chemists, engineers, and formulators to ensure the safety of their production. The quality and purity of the raw materials utilized in the formulation, particularly the active pharmaceutical ingredient(s), are given considerable consideration while focusing on safety [1]. A drug substance will often contain a variety of low-level impurities originating from the initial ingredients, reagents, intermediates, or by-products of the synthesis or degradation processes; these must be studied and controlled to permitted parts per million (ppm) limits. A certain amount of patient risk can be tolerated when weighed against the anticipated health benefits, even though the pharmaceutical substance itself is unlikely to be fully safe. This trade-off between risk and return must be carefully considered by pharmaceutical firms and regulatory organizations on a case-by-case basis. Impurities, however, are thought to solely cause harm and offer no benefits. Therefore, manufacturers must develop and implement their own analytical approach to get rid of them (or at least, reduce the level of these impurities to the greatest extent possible) [2].
Human cancer may be brought on by pharmaceutical genotoxic impurities (GTIs) that cause genetic mutations, chromosomal breakage, or chromosomal rearrangements [3]. Therefore, exposure to even minute quantities of these contaminants in the finished active pharmaceutical ingredient may result in significant toxicological problems [4]. Hence, chemical scientists should consider strategies to lower the synthesis and consumption of these genotoxic substances during the manufacturing process. However, completely ceasing the use of such substances or ceasing the manufacture of pollutants that are DNA reactive is not always feasible. GTIs can be crucial in drug development even though they are present in trace amounts [5] and, if properly addressed, could result in clinical holds or a delay in regulatory authorities’ clearance. In order to precisely assess and regulate the quantities of GTIs in medications, analytical scientists must develop the necessary analytical procedures. For the creation of a reliable manufacturing process, as well as for assuring patient safety, adequate analytical methods are crucial. Some medications may produce GTIs through degradation during formulation or storage in addition to process impurities. For instance, hydrolytic compounds like anilines and oxidative degradation products like hydroperoxides or epoxides could be genotoxic. Additionally, excipient components may interact with API or its counter ion to create a new impurity that is potentially genotoxic, such as halogenated furanone [6]. This includes many challenges to the drug development process.
Genotoxicity is characterized as a corrosive effect on a cell’s genetic material (DNA and RNA) that compromises the integrity of the cell. Mutagens include genotoxins (radiation, chemical, or physical agents). A genotoxin is a substance that exhibits genotoxicity. Genotoxins can be teratogens, which can cause birth defects, and mutagens, which can cause mutations, carcinogens, or which can cause cancer [7].
Impurities that are specified by the Food and Drug Administration (FDA), the International Council for Harmonization (ICH), and the USP can be divided into four categories: drug-related impurities, process-related impurities (PRIs), residual solvents, and heavy metals. The first category of impurities related to active pharmaceutical ingredients (APIs) is further divided into two types as a result of specific reactions, such as oxidation, dehydration, and carbon dioxide removal. The second type results from a reaction between the API and the excipients, container, or any lingering contaminants in the excipients, reagents, or solvents. Due to their link between structure and action, contaminants connected to API may pose a risk for genotoxicity, mutagenicity, and cancer [8].
Genotoxic impurities can be introduced from a variety of sources, most commonly from the starting materials used to synthesize drugs and their impurities in the form of genotoxic intermediates or process-related by-products. Additionally, genotoxic impurities are present in drug substances because of synthesis components such as solvents, catalysts, and reagents that are involved to create drugs. Furthermore, drug impurities are produced because of drug degradation during storage, exposure to light, air oxidation, or hydrolysis. The formation of chiral impurities in pharmacological substances occurs at several phases of drug production from stereoisomers of raw materials and intermediates during the synthesis of stereoselective drugs [9].
Genotoxicity statistics are useful for assessing the risks of chemicals, as well as those of food and feed, consumer goods, human and veterinary pharmaceuticals, and industrial items. Genotoxicity information is fundamental for assessing the dangers of naturally occurring environmental toxins in chemicals, food, and feed. Numerous regulatory authorities and advisory groups have suggested methods for genotoxicity testing based on this. Even at low exposure levels, genetic modifications in genetic materials, such as somatic and germ cells, have substantial negative effects on health. Several genetic illnesses are caused by mutations in proto-oncogenes, tumor suppressor genes, or DNA damage response genes by different carriers like physical and chemical. Degenerative disorders include accelerated aging, impaired immunity, cardiovascular, and neurological diseases are also caused by somatic cells with damaged DNA. The evaluation of mutagenic potential is a fundamental part of chemical risk assessment in order to prevent such negative effects of genetic damage to human health [10].
In order to assess the product and method for safety, regulatory authorities from all over the world demand regulatory data on the genotoxic potential of pharmaceutical products. Pre-clinical studies are therefore typically carried out to evaluate fundamental toxicological information of new chemical entities (NCE). Based on toxicological information, the safety and effectiveness of NCE will aid in analyzing and determining whether the drug will likely have a risk or benefit assessment during the new drug application (NDA) process. It will also aid in identifying genotoxicity risks that could result in DNA damage and its fixation [11].
Gemfibrozil (Figure 1) belongs to the class of fibric acid derivatives and has the chemical name of 5-(2,5-dimethylphenoxy)-2,2-dimethylpentanoic acid. It is mainly indicated for the treatment of hyperlipidemia [12,13]. The first synthetic route was developed by Creger et al. [14], and screened for the treatment of abnormal blood lipid levels in the year 1976 [15]. It has been marketed since 1982 due to its overwhelming ability to reduce plasma triglyceride levels [16]. Later, clinical studies proved that gemfibrozil can be used to prevent cardiovascular events by increasing HDL cholesterol and it can also be useful to control various types of signaling pathways responsible for switching of T-helper cells, inflammation, migration, cell-to-cell contact, and oxidative stress [17]. As per the FDA label, Gemfibrozil is available in the dosage form of a Tablet, which contains 600 mg Gemfibrozil free base and other excipients. Gemfibrozil has an empirical formula of C15H22O3 and a molecular weight 250.35 g/mol. It is soluble in water and acid (0.0019%), and in dilute base (>1%). Under ordinary conditions, Gemfibrozil is stable and has a melting point at 58–61 °C.
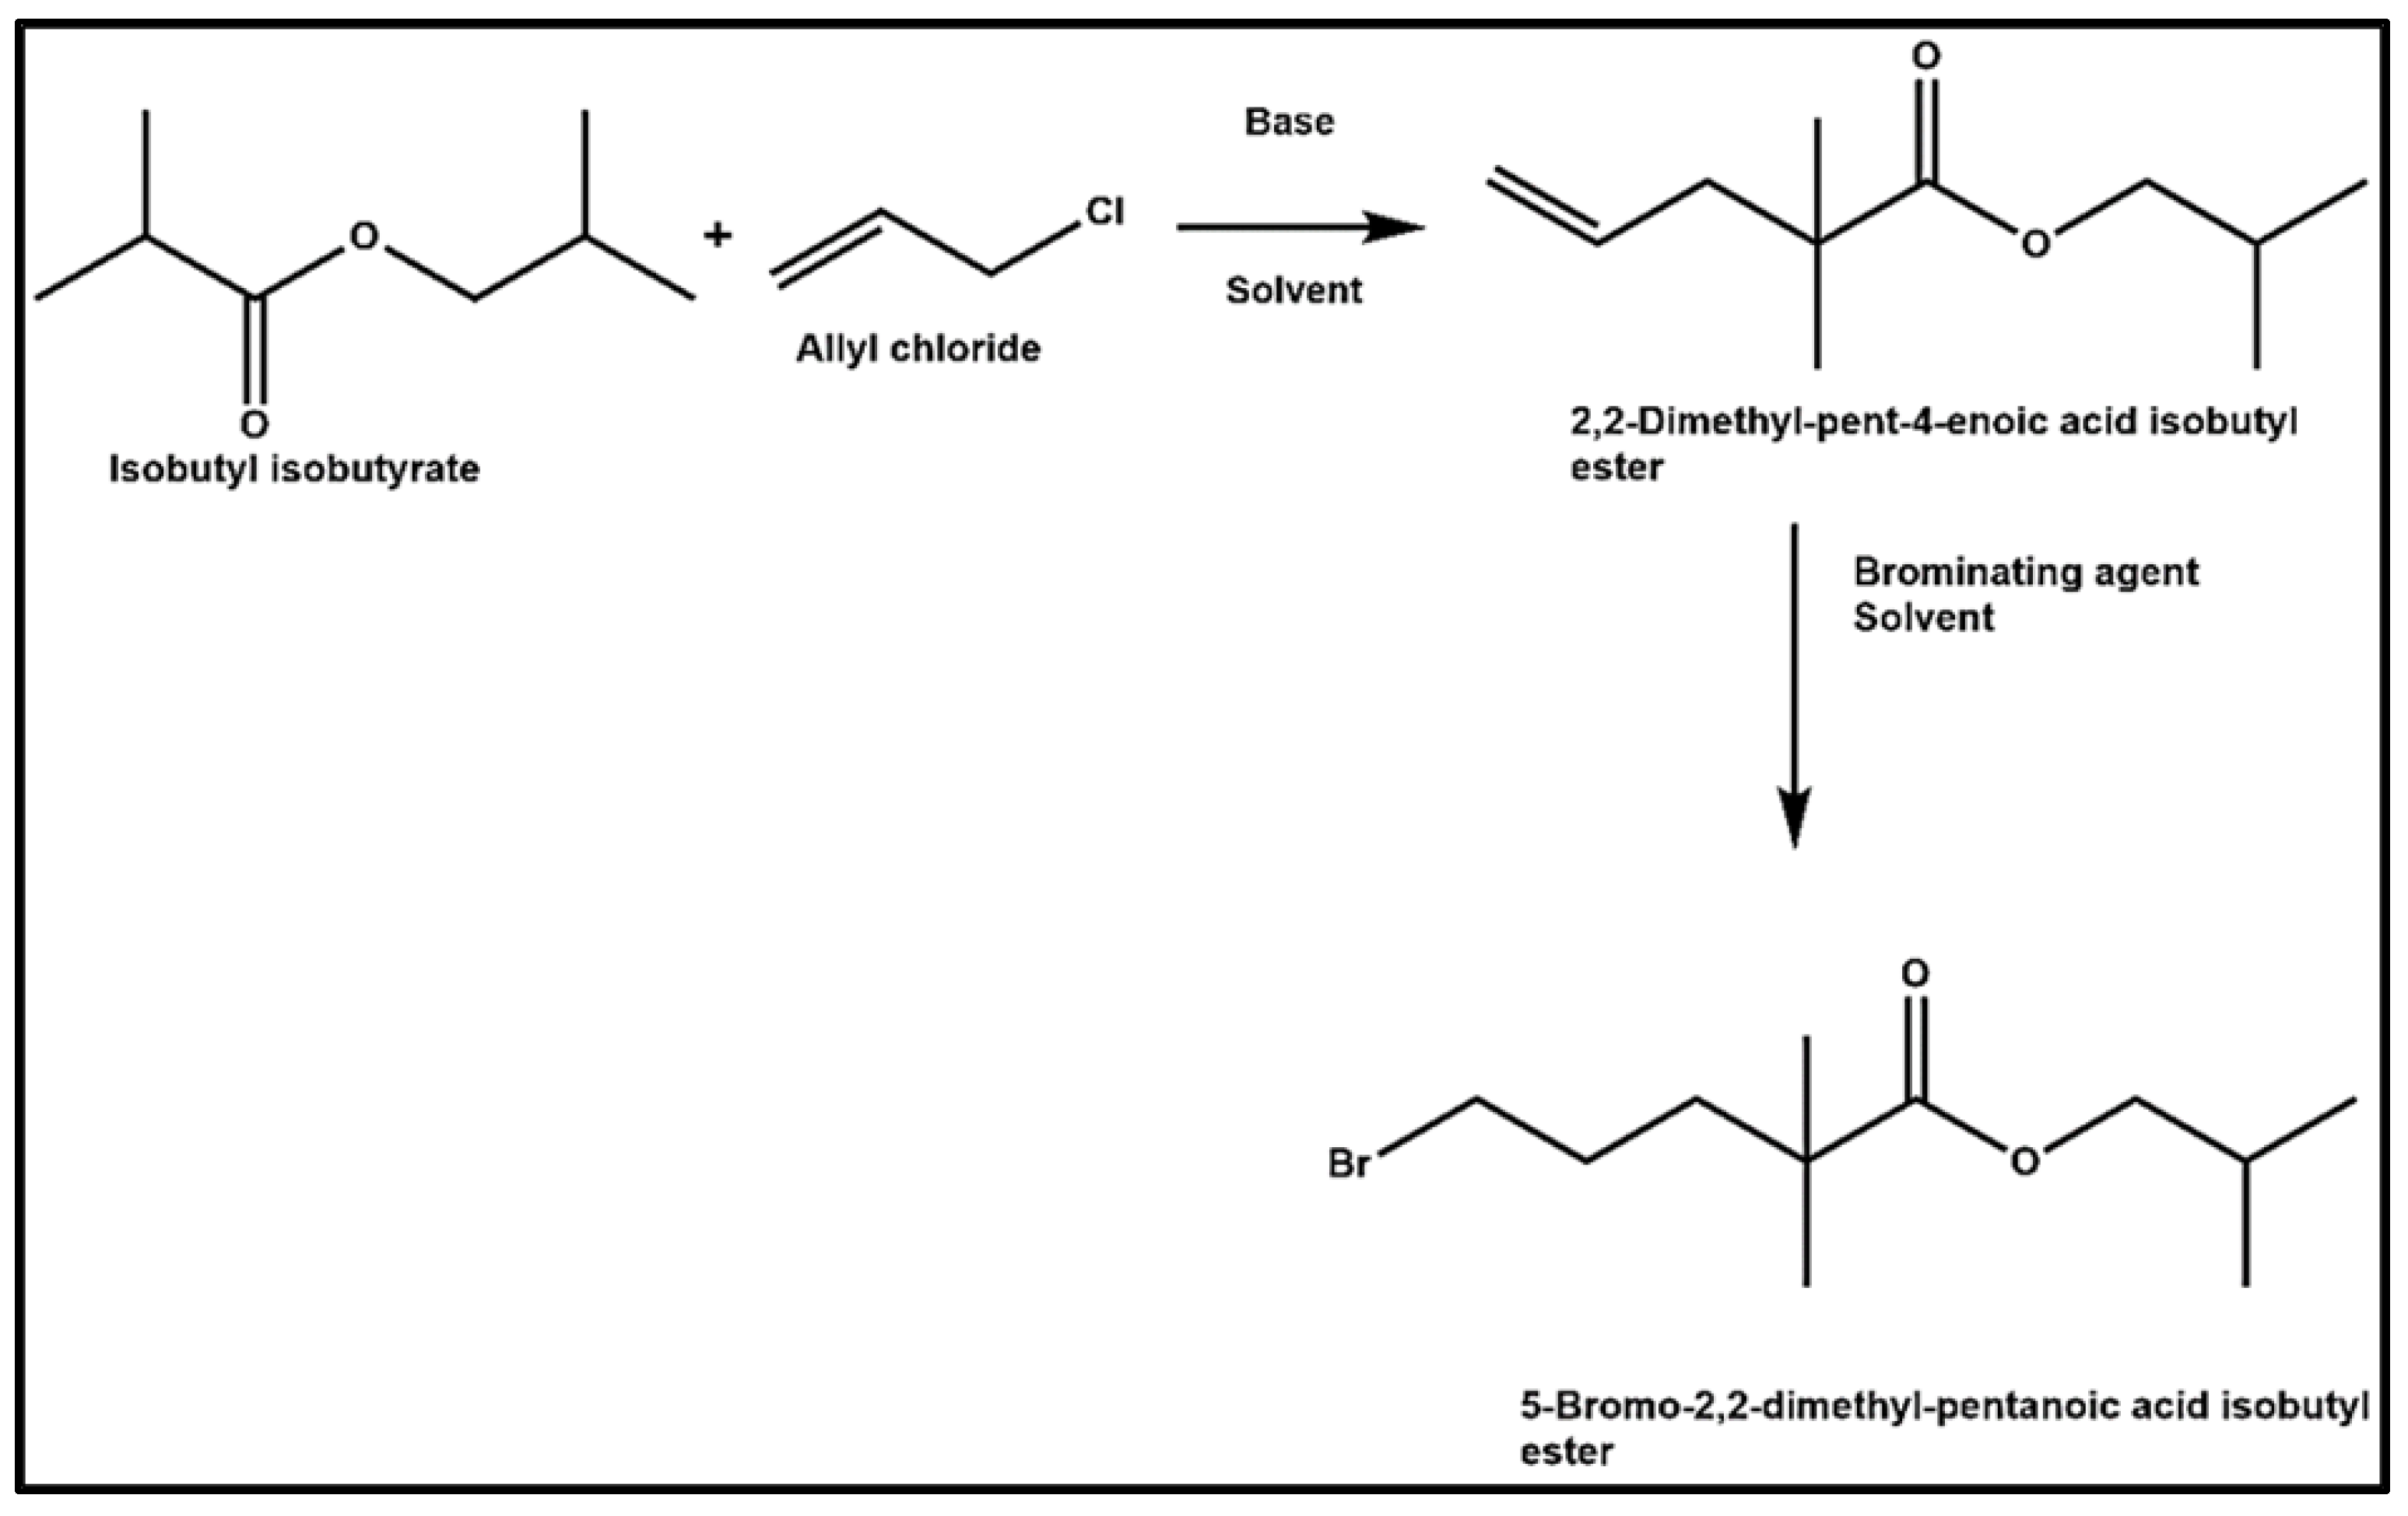
Gemfibrozil can be prepared by a variety of synthetic routes involving several purification processes to obtain high-quality drug that can fulfill all of the stringent regulatory requirements. According to ICH guidelines, the reported maximum daily dosage of gemfibrozil should not be more than 1.2 g, while impurities in the drug substance should be not exceed 0.15% [18]. Korupolu et al. have reported an efficient method for the synthesis of gemfibrozil with high purity, the process involves the O-alkylation using 2,5-dimethylphenol and isobutyl 5-chloro-2,2-dimethylpentanoate [19]. Apart from this, Gemfibrozil synthesis also involves a variety of other intermediates that can induce unwanted impurities [20]. For example, Ramachandran et al. have reported the preparation of Gemfibrozil in a multistep process involving different types of intermediates including allyl butyrate, 5-bromo-2,2-dimethylpentanoic acid methyl ester etc. [21]. This crucial intermediate of gemfibrozil is prepared by involving the reaction of isobutyl isobutyrate with allyl chloride to form allyl intermediate and then subjected to bromination with hydrogen bromide to obtain the 5-bromo-2,2-dimethylpentanoic acid isobutyl ester (Figure 2). Notably, some of the intermediates or their synthetic processes involve allylic derivatives that may remain present as impurities in the final product.
According to the summary basis of approval by the FDA, the definite mechanism of action with Gemfibrozil was unknown. It has been demonstrated in man that it inhibits peripheral lipolysis and lowers hepatic extraction of free fatty acids, which lowers hepatic triglyceride production. Gemfibrozil mainly metabolizes through the oxidation of a ring methyl group to form a hydroxymethyl and a carboxyl metabolite [22]. Gemfibrozil is a hyperlipidemia lowering drug, which is known to adjust the level of lipid in the blood stream in patients. However, prolonged use of Gemfibrozil may cause acute liver injury, and thus it is crucial to remove the possibilities of toxic action [23]. The organ-related toxicity of Gemfibrozil can possibly be attributed to the formation of highly reactive metabolites and subsequent covalent binding of protein [24]. In the case of Gemfibrozil, it is reported to be metabolized to oxidative and glucuronide metabolites by the catalytic activity of enzyme-based catalysts in humans and animals [25]. It has been previously reported in many studies that Gemfibrozil 1-O-β-acyl glucuronide, which is one of the major metabolites, typically undergoes transacylation reactions, wherein the glucuronic acid is substituted by nucleophile, or in other cases intramolecular rearrangement, hydrolysis, and covalent binding of the α-OH aldehyde moiety to the protein occur through glycation mechanism [26]. Additionally, various sulfate metabolites of Gemfibrozil are often toxic when they are attached to the benzylic or allylic sites due to their high chemical reactivity (electrophilicity). These metabolic processes often promote the toxicity processes.
Given the importance of Gemfibrozil as adjunctive therapy to diet, there is a need to control impurities, particularly genotoxic impurities, i.e., allyl chloride (Figure 1), with robust analytical technique. Allyl chloride is generally used as an intermediate in organic chemistry to develop the drug substances. It is a chlorinated hydrocarbon that is liquid at room temperature, colorless, flammable, and volatile. The unreacted reagents sometimes cause serious health issues. In a diet, a small quantity of allyl chloride substances also causes injury to the liver and kidneys and the onset of pulmonary edema (fluid in the lungs) [27]. There is no evidence of allyl chloride causing human cancer, but in a study involving the injection of the chemical into mice’s stomachs has revealed an increase in the frequency of forestomach tumors which is linked to gavage exposure to allyl chloride [28]. According to the EPA, allyl chloride is a Group C chemical that may cause cancer in people [29]. As of today, various analytical methods like HPLC, RP-HPLC, and LC determination [29,30,31,32] are known for the estimation and determination of Gemfibrozil.
However, the prior methods neither disclose the detection of allyl chloride nor the quantification thereof in Gemfibrozil. Furthermore, these methods could not be used to detect the lowest concentration of allyl chloride and are not sophisticated for trace level analysis, whereas the method developed in the current work involves the use of a more accurate analytical technique for detecting traces of allyl chloride by using mass spectroscopy. Furthermore, this method has an advantage in the minimization of solvent and time period for quantification with respect to run time. Furthermore, this method is simple, sensitive, and reproducible GC-MS/MS and validated it as per ICH guidelines [33].

2. Materials and Methods

2.1. Materials and Reagents

Allylchloride was procured from HTS Biopharma Ltd., ALEAP Industrial Area, Hyderabad (India), and GC HS grade Methanol from Fischer Chemicals (India). Gemfibrozil was gifted by Jisai Pharma Pvt Ltd. Plot No-12, Phase (4), IDA-Cherlapally, Hyderabad-500051, India.

2.2. Equipment

Mass tuning of allyl chloride impurity, method development, and validation was performed on Agilent 7890B GC system (Make: Agilent, Santa Clara, CA, USA) is connected with Agilent 7010B GC/TQ triple quadrupole equipped with electron impact ionization (EI) as MSD ion source and MRM mode. The data were collected using Mass Hunter software. Weighing of the standards and sample was done using an analytical balance (Make: Mettler Toledo; Model: ME204E, Im Langacher 44, 8606 Greifensee, Switzerland). The sample and standards were blended using a Remi vortex mixer (Make: Remi, Maharashtra, India).

2.3. Chromatographic Conditions

Chromatographic conditions of the GC-MS/MS system were optimized by using USP phase G27, a nonpolar and low bleed 5% Diphenyl, 95% Dimethylpolysiloxan, having dimensions 30 m length, 0.32 mm internal diameters,1.5 µm film thickness GC column. The oven temperature of the column was set to 40 °C as initially and held for 0 min. The temperature was raised gradually, ramping up to 250 °C at a rate of 15 °C/min, and held for 6 min. Helium was used as the carrier gas, flowing at a rate of 2.0 mL/min. The injector heater’s temperature was 200 °C, and the injection volume was 2 µL.

2.4. Mass Spectrometer Conditions

MRM mode was used in GC-MS/MS system by considering precursor ion (Q1) 76 m/z and product ion (Q3) 41 m/z, MRM-1:76 amu → 41 amu were used for quantitation. The temperature of the mass source was 230 °C. The collision energy (CE) was 8 v (Table 1).

2.5. Impurity Standard and Test Sample Solution Preparation

The concentration of the allyl chloride impurity standard (0.03 ppm) was prepared in methanol (diluent). The test sample of Gemfibrozil (150 mg/mL) was prepared in the diluent. The solutions were subjected to a vortex for 5 min and mixed well. The diluent was injected as a blank.
The specification limit of allyl chloride was 0.03 ppm with respect to sample concentration. Hence, the sample concentration was optimized based on the accuracy results obtained during method development. The different sample concentrations were used for spiking of impurity and achieved recovery with the sample concentration of 150 mg/mL.

3. Results

3.1. Optimization of Mass Spectrometric Parameters

For both analytes, mass tuning was performed to determine the Q1 and Q3 values. The solubility of Gemfibrozil and allyl chloride was determined in order to identify and measure the impurity in gemfibrozil. Gemfibrozil and the allyl chloride impurity are soluble in alcohol.
By introducing a diluted solution of allyl chloride into the mass spectroscopy, mass parameters were tuned. EI was used as an ion source for establishing mass detection and finalizing Q1 and Q3 values. The MRM fragments MRM-1 is 76 amu → 41 amu and MRM-2 is 76 amu → 39 amu. Although the response rate of MRM-2 was low when compared with MRM-1, both values can be used for identification, and MRM-1 was used for quantitation of the impurity (Figure 3).

3.2. Optimization of Chromatographic Conditions

Various solvents were used to establish suitable diluents. The diluent compatibility study was performed by considering low and high boiler, polar and non-polar solvents such as N-methyl-2-pyrrolidone (NMP), methanol (MeOH), dichloromethane (DCM), dimethyl sulfoxide (DMSO) and hexane. During the development, we observed that there was some solvent interference, broad peak shape, and poor response of the impurity with many diluents (the data are given in the Supplementary Materials, Figures S12–S17). However, there was no interference with the methanol, and observed that there was a very good response in ppm level concentrations, with a sharp peak and good ionization for the impurity.
The selection of columns can play a very important role during the method development. During development, different column chemistries, column lengths, diameters, and film thicknesses of columns like DB-1, DB-wax, DB-5, and DB-624 were used for the optimization. From these column chemistries, we observed that DB- 5 was more suitable with very sharp and good ionization of the impurity peak.
The final method was optimized by using helium as a carrier gas. The retention time of the impurity was about 2 min. To protect the ion source from the high concentration of gemfibrozil, applied for the detector off (MS-off) program after the impurity peak elution.

3.3. Method Validation

The validation of an analytical procedure is the process by which it is established through laboratory experiments (for the developed method) that the performance characteristics of the method meet the requirements for the intended analytical applications. The process of validation of any analytical method entails a series of studies.
The GC-MS/MS method was validated and performed as per the international conference on harmonization (ICH) guidelines in the present study. Method validation conditions are system suitability, specificity, the limit of detection, Limit of quantification, Precision for Limit of quantification, linearity, range, method precision, accuracy, robustness, intermediate precision, and solution stability.

3.4. Specificity and System Suitability

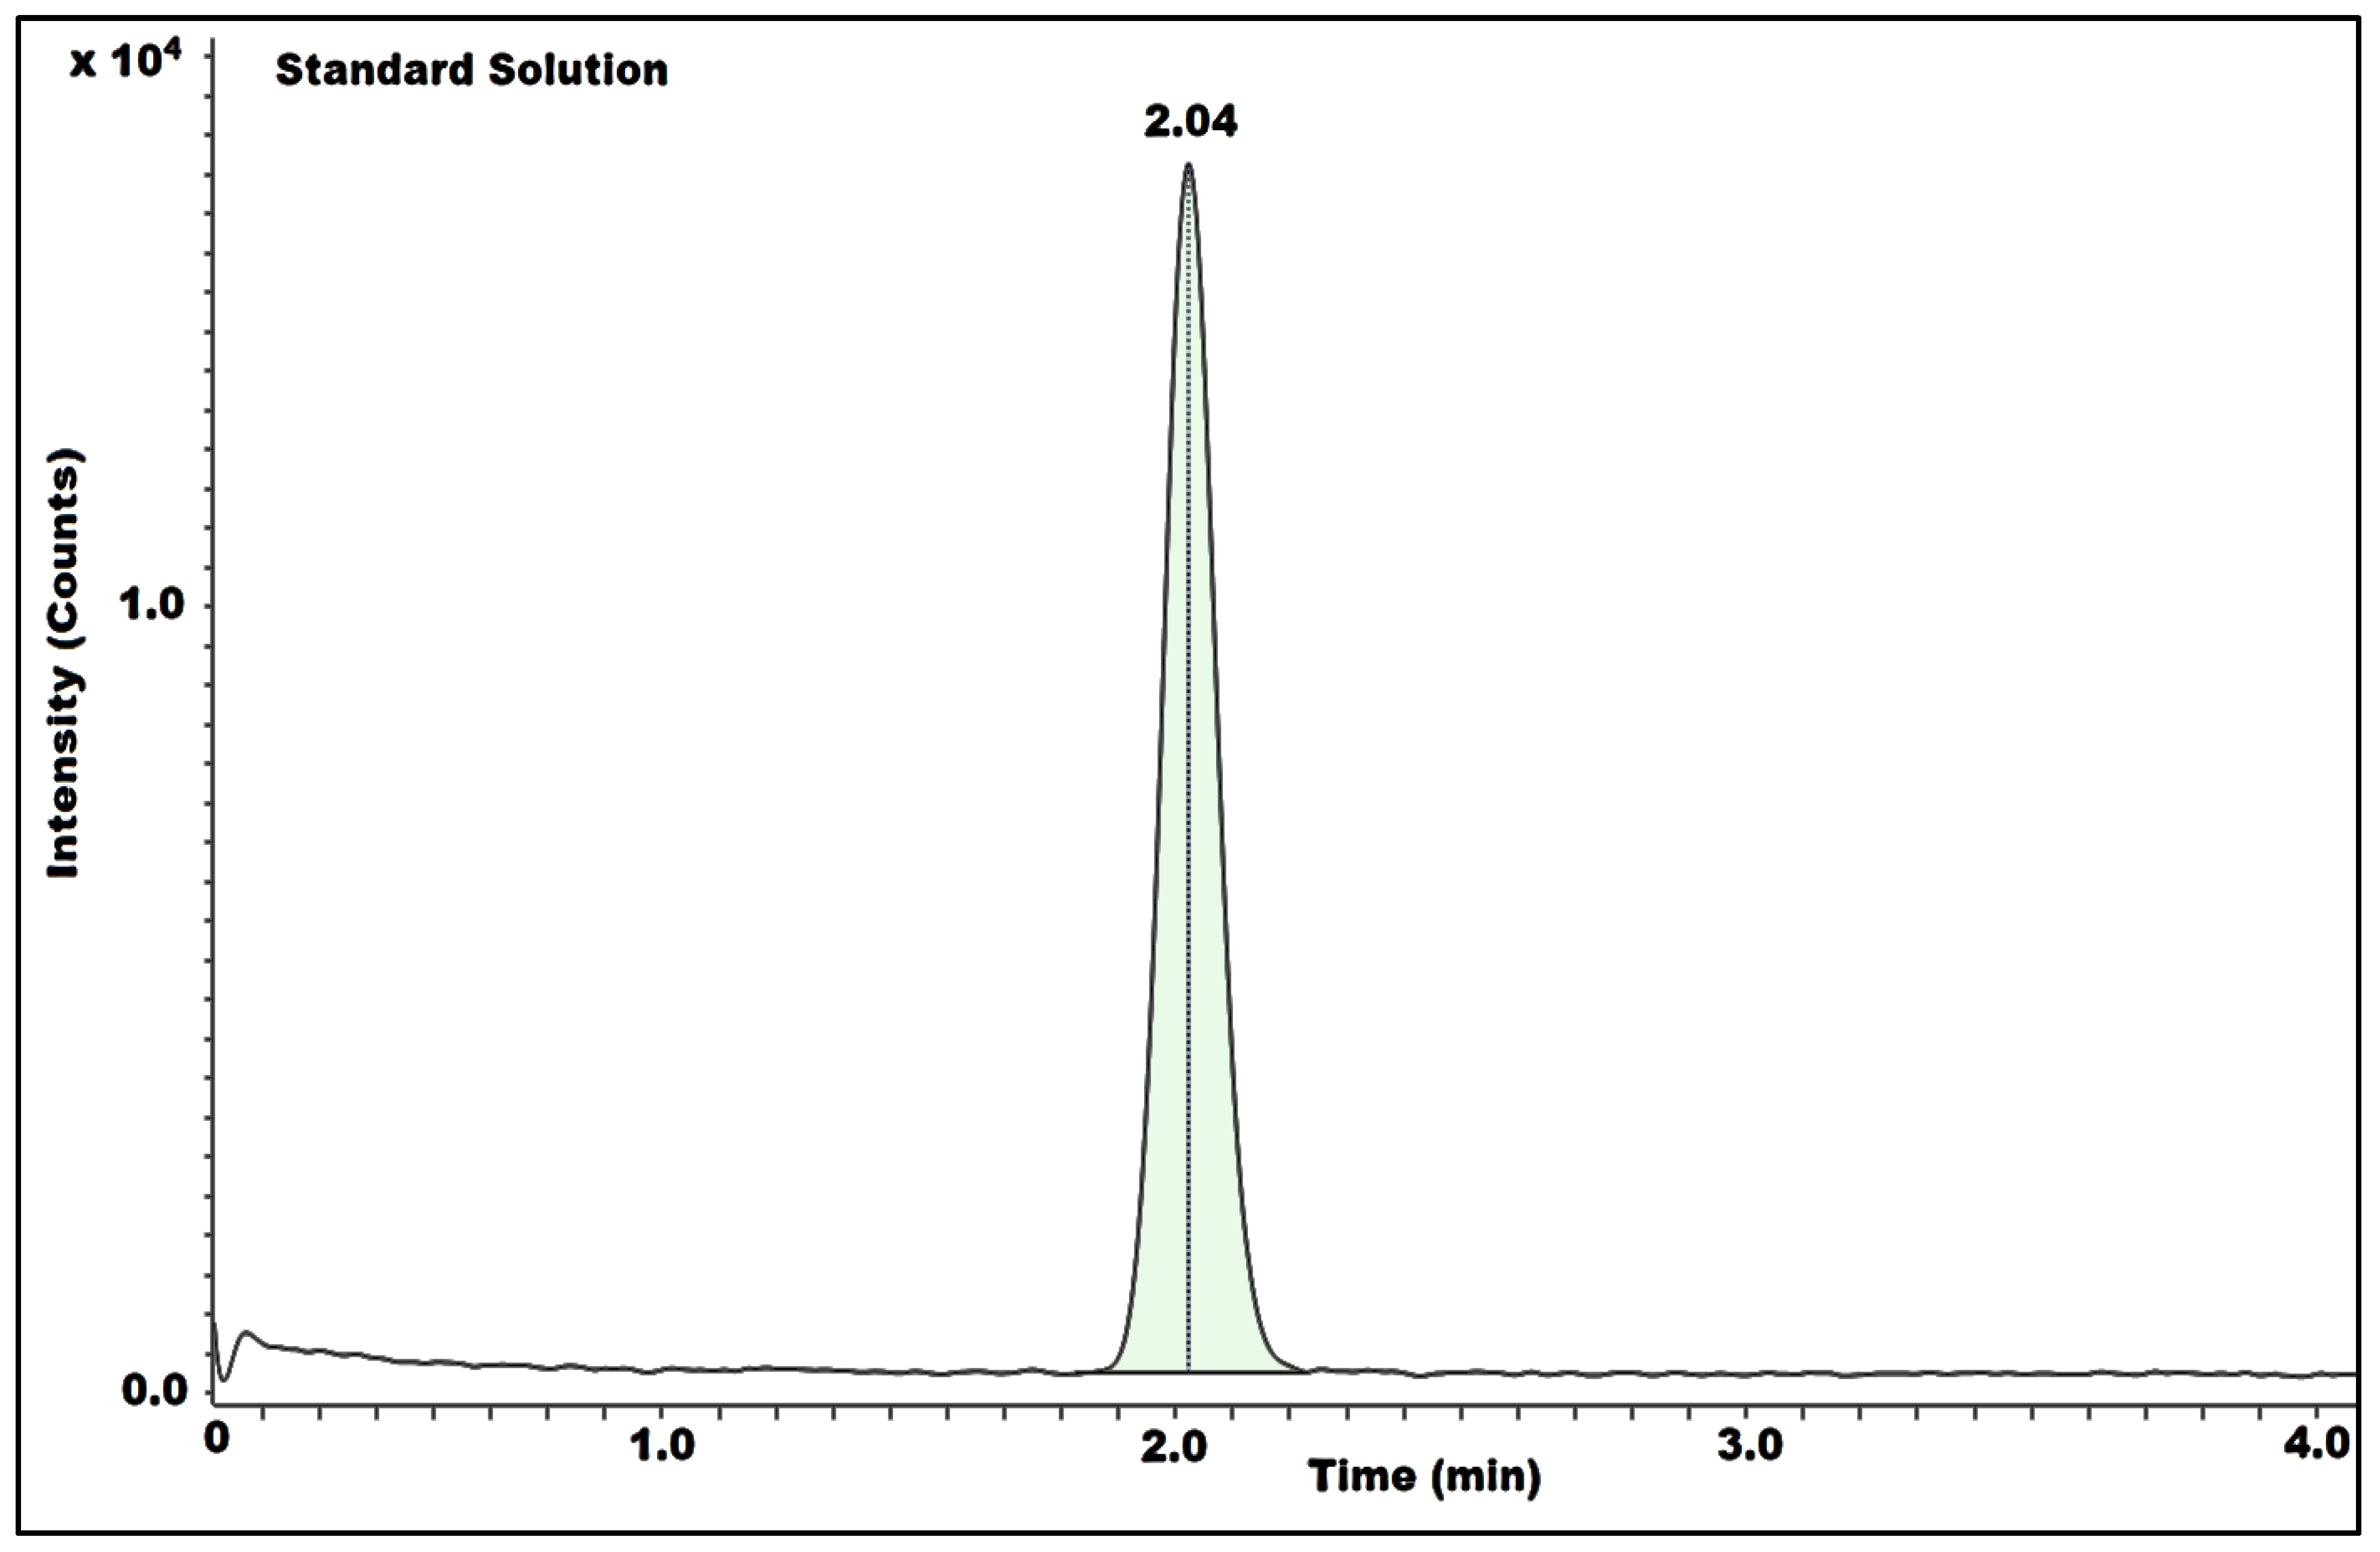
System stability and specificity were determined by injecting blank, standard, sample, and spiked sample solutions and individual impurity to check the % of RSD (relative standard deviation) and allylchloride peak retention time (RT) of all the above solutions. The obtained results were well within the limit. The standard solution and blank solution baselines were good, and there was no blank interference observed at the retention time of allyl chloride (Table 2) (Figure 4).

3.5. Limit of Detection, Limit of Quantification, Precision for Limit of Quantification

The smallest amount of analyte in a diluted standard solution that can be detected but not necessarily quantitated under the specified experimental circumstances is known as the limit of detection. The limit of quantification is the smallest quantity of analyte in a dilute standard solution and a sample that can be determined with acceptable accuracy and precision under the stated experimental conditions.
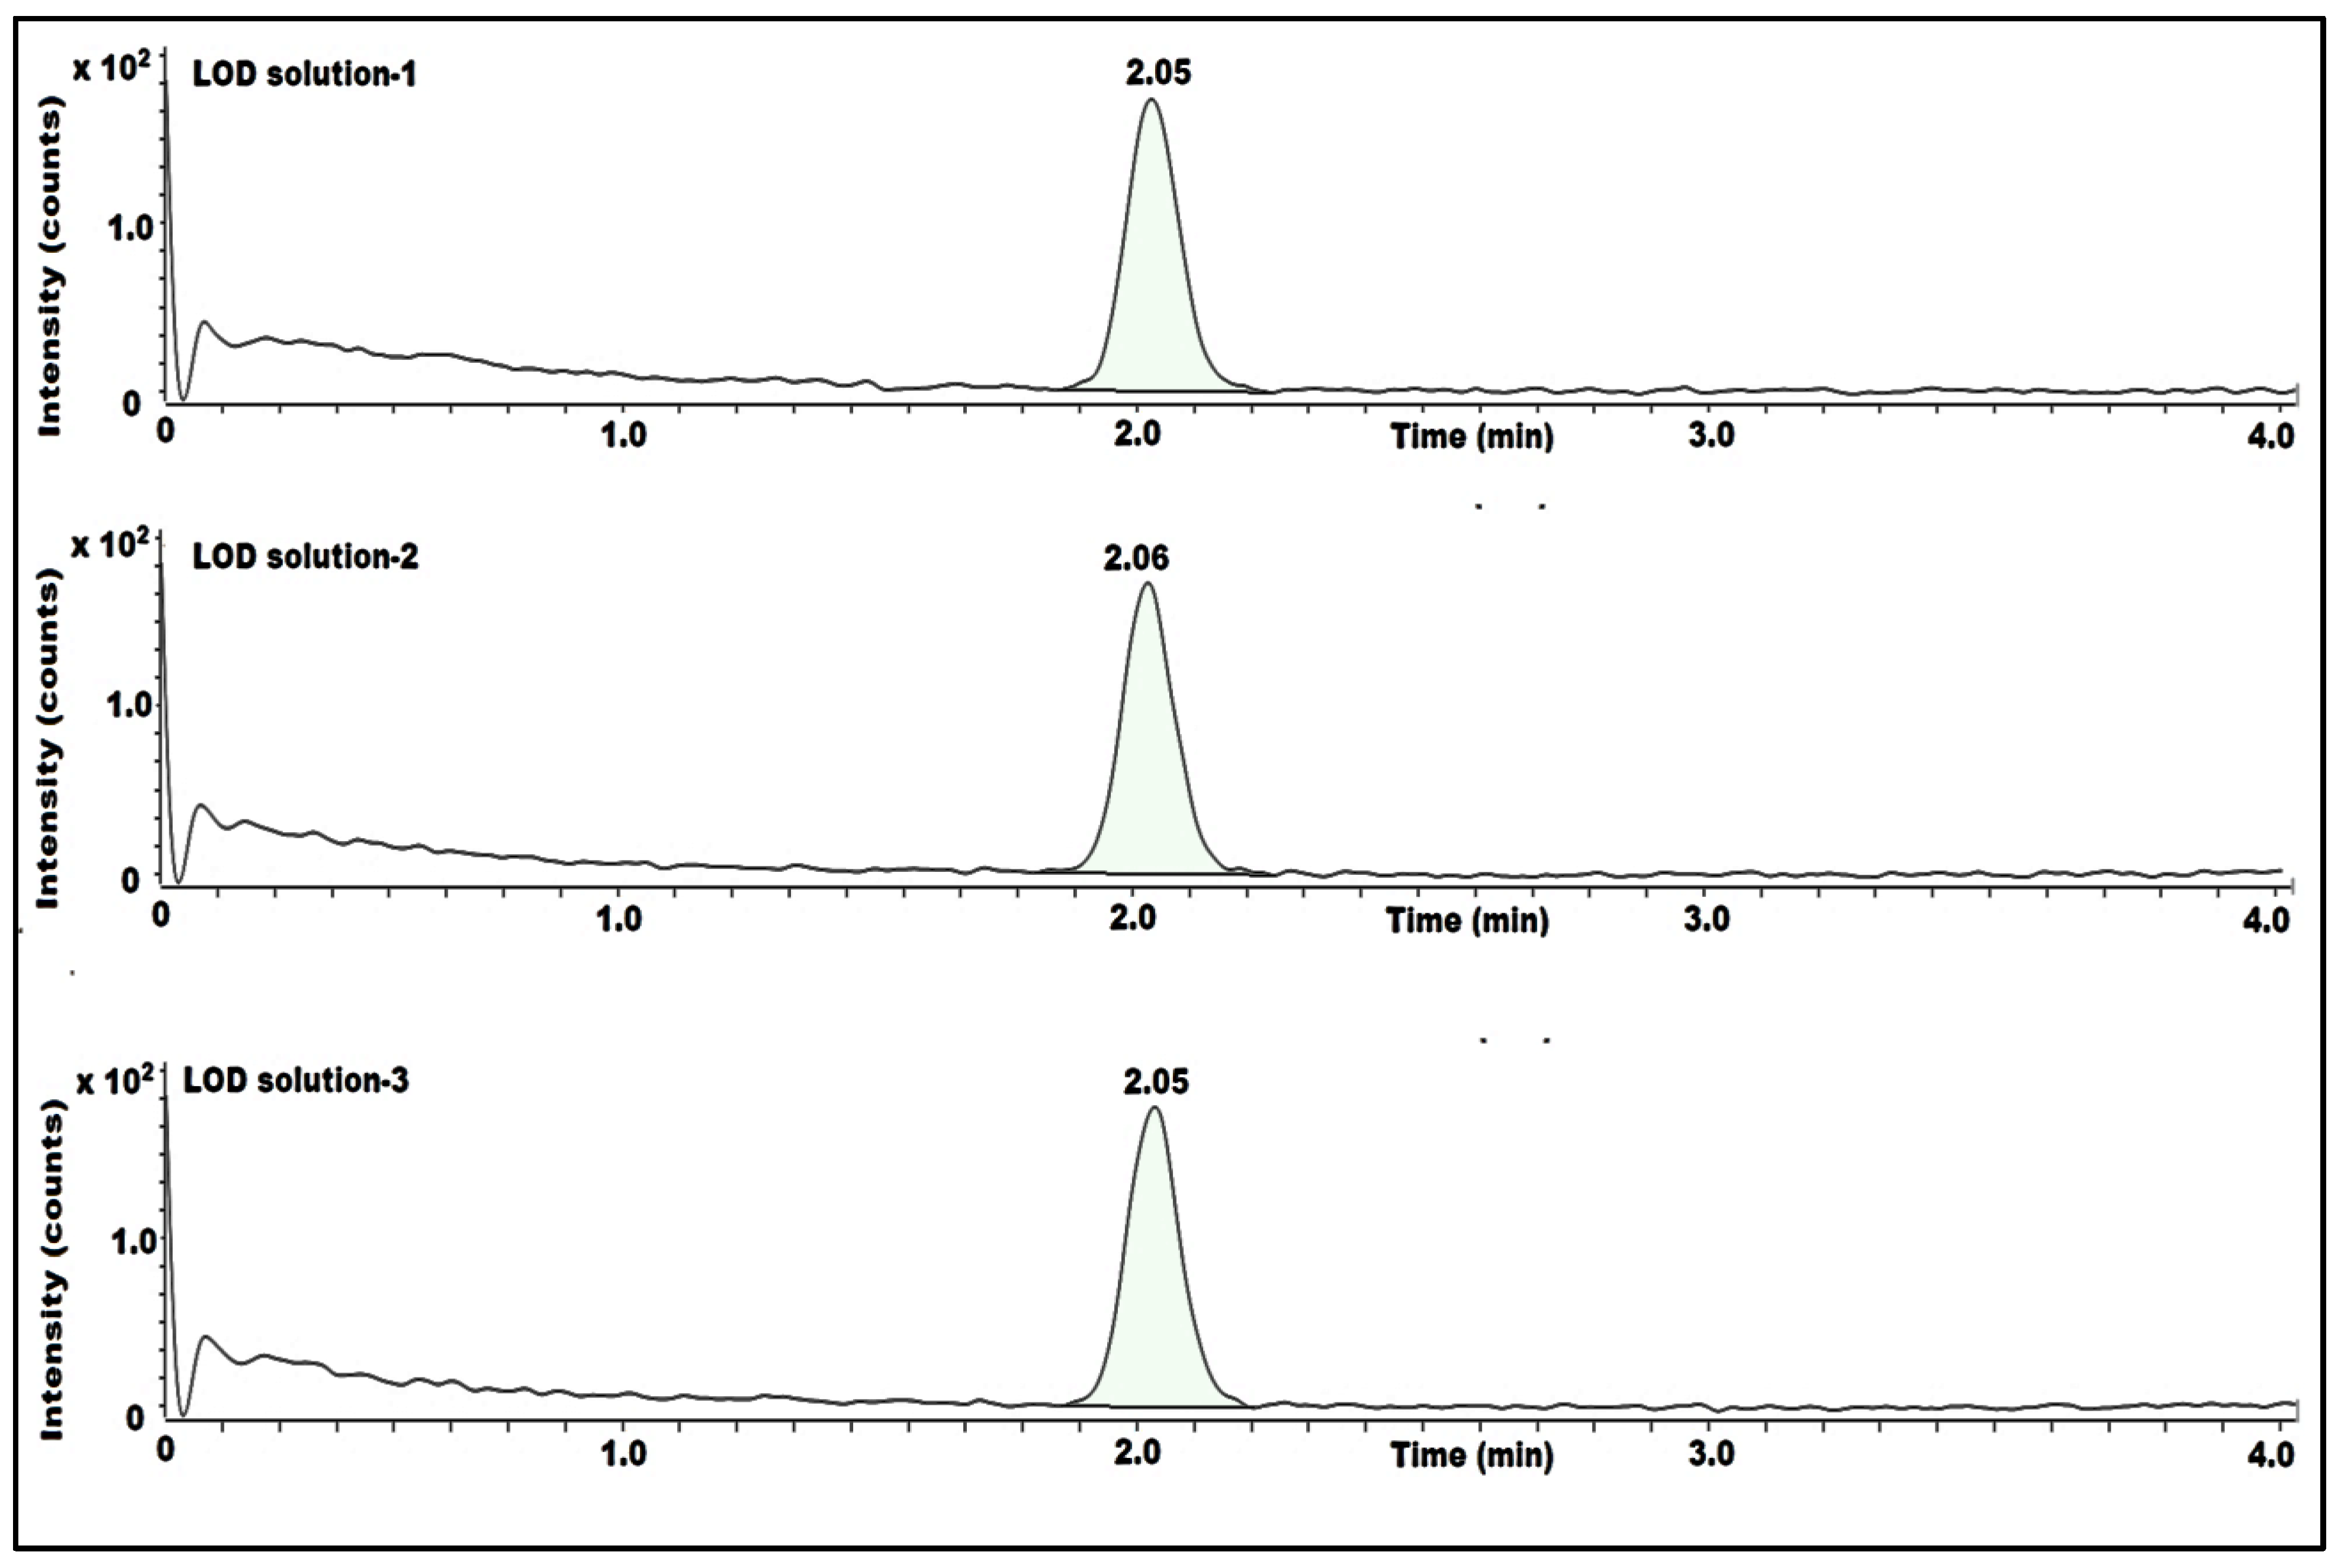
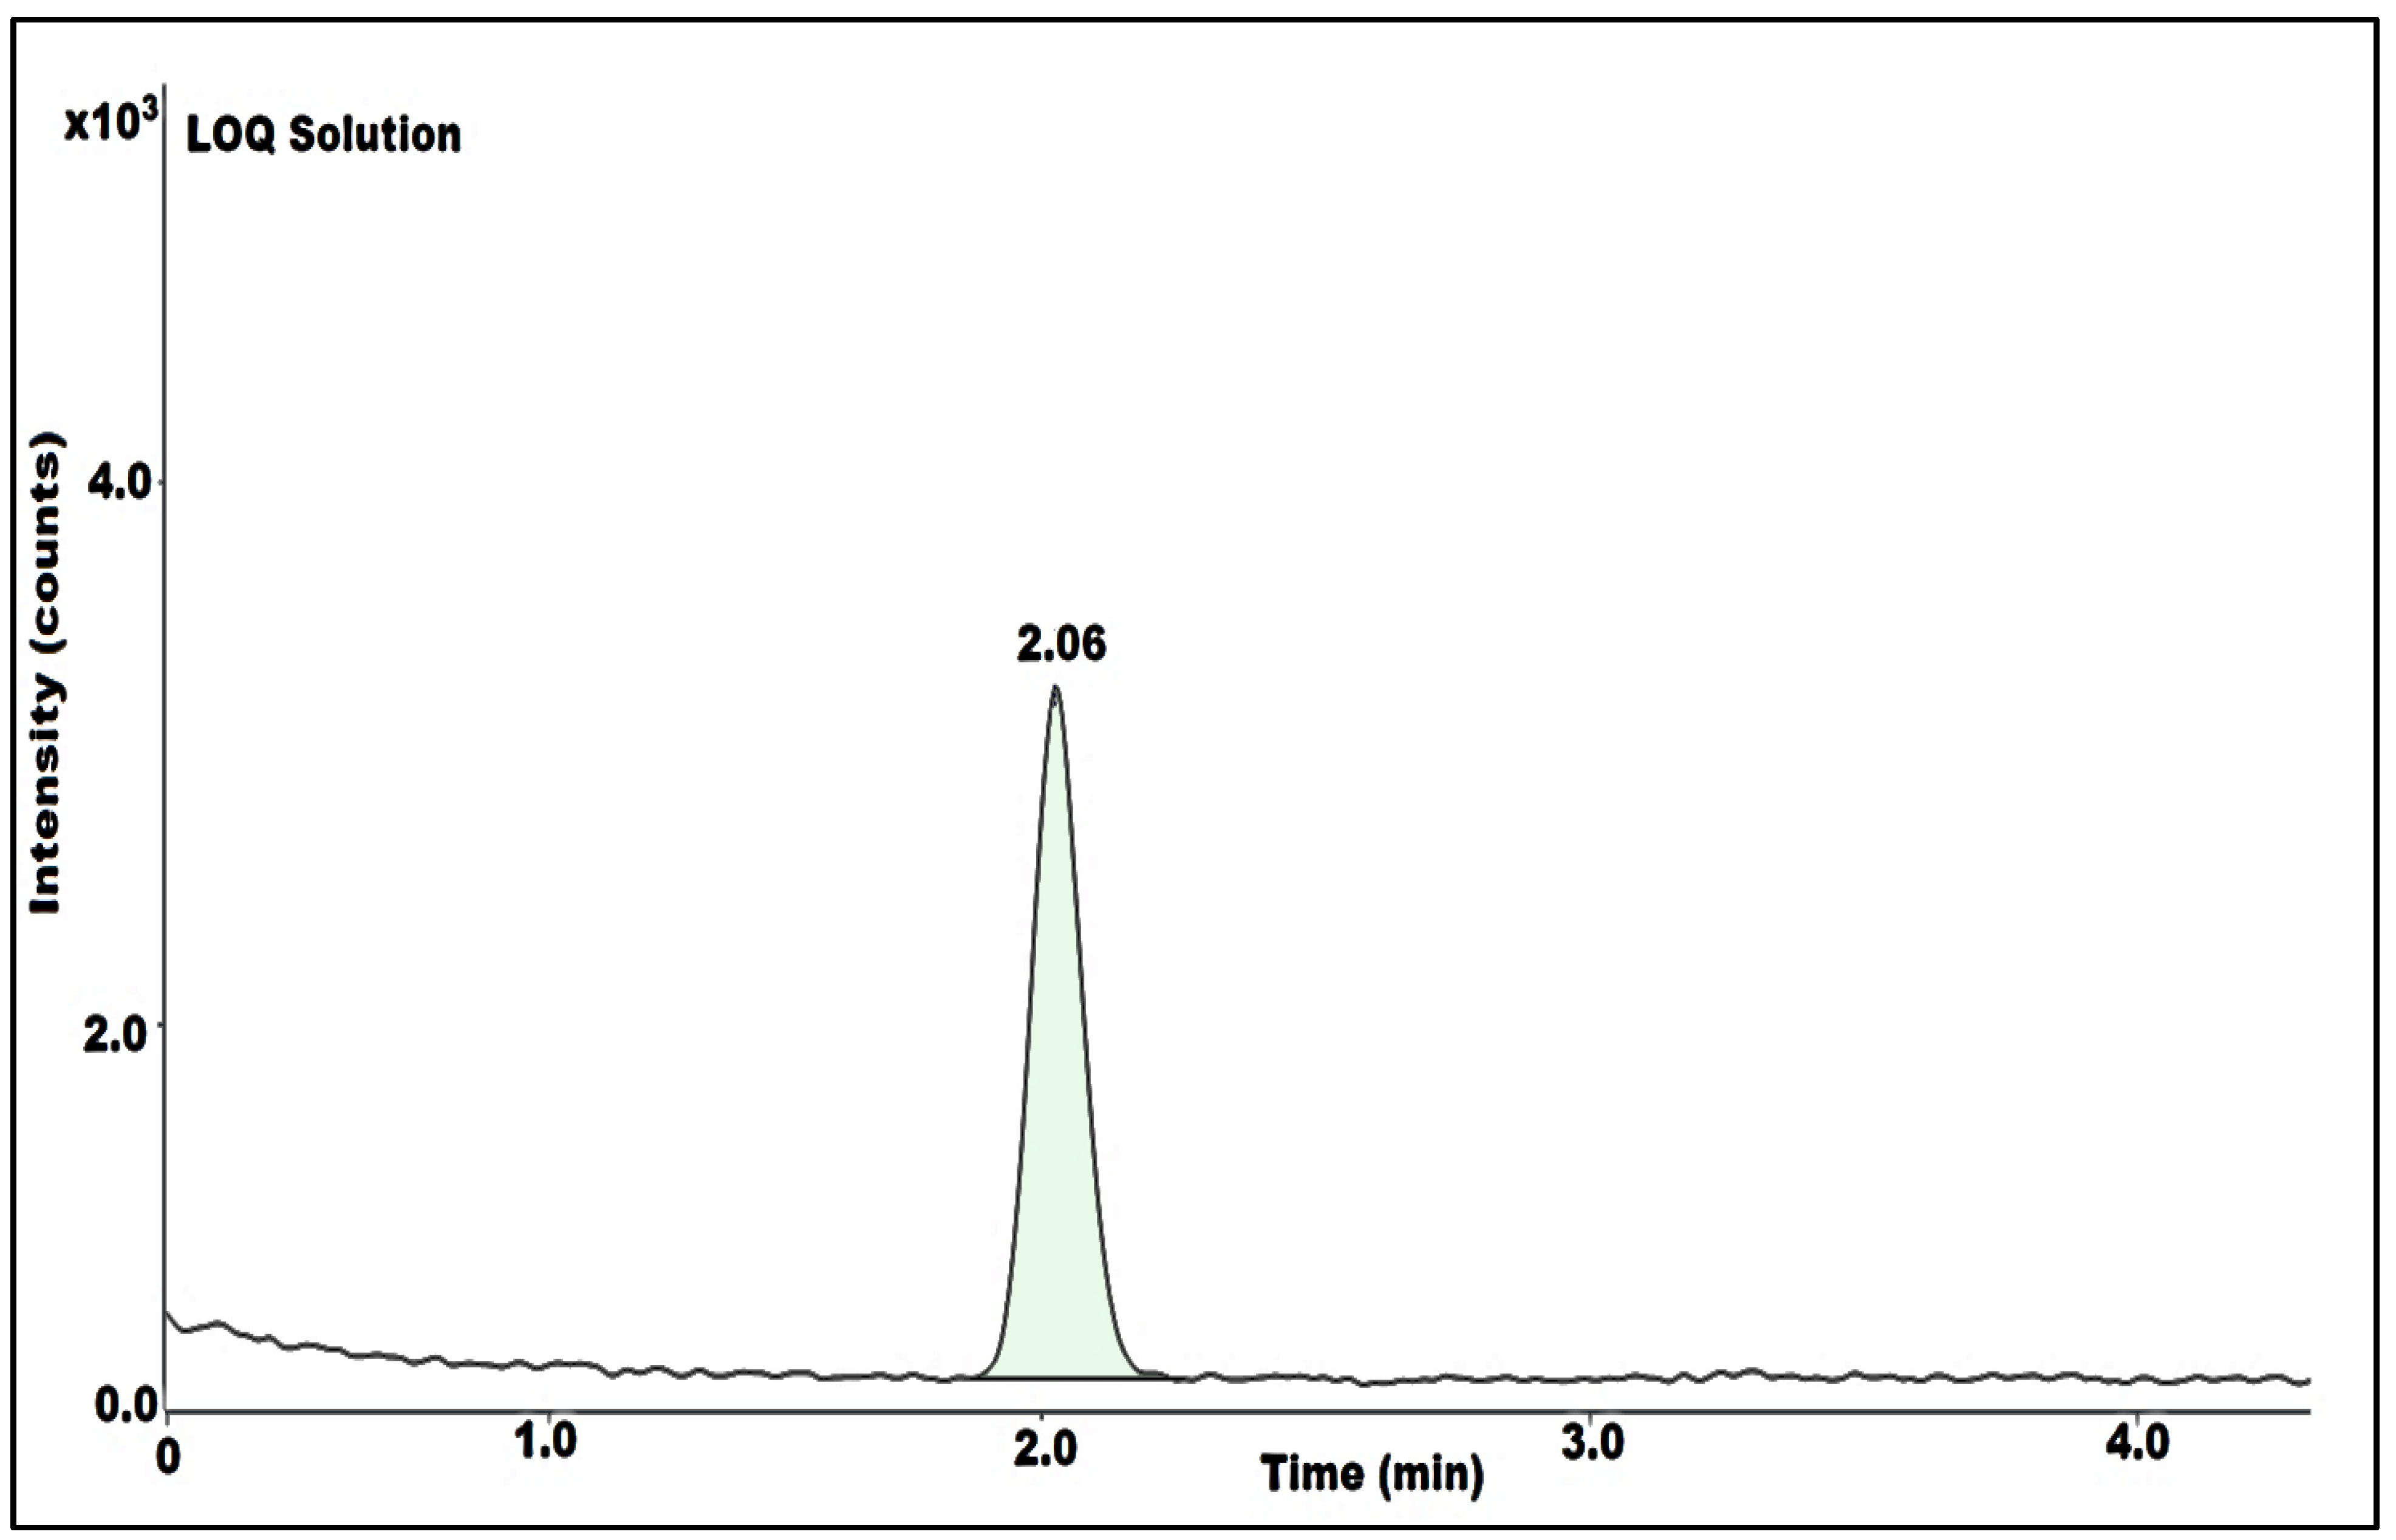
The limit of detection and limit of quantification were established by injecting diluted standard solutions in triplicate while measuring the impurity’s concentration, resulting in a signal-to-noise ratio (s/n) of at least 3 for LOD and at least 10 for LOQ. LOD is 0.005 ppm and LOQ is 0.01 ppm, LOQ precision was tested by administering six replicate injections of the LOQ solution. The obtained s/n ratio for LOD solutions and LOQ was more than 3 and 10, respectively. For six replicate injections of LOQ precision % RSD is 4.8 (Table 2), (Figure 5, Figure 6 and Figure 7).

3.6. Linearity

The linearity was established by injecting different known-concentration solutions of impurity with LOQ ranging up to 150% of the specified concentration level. The standard was prepared (in ppm) 0.01, 0.015, 0.0225, 0.03, 0.036, and 0.045 in the diluent, and injected at LOQ levels of 50%, 75%, 100%, 120%, and 150% levels in duplicate. The correlation coefficient (r) and square of correlation coefficient (r2) were determined by plotting the graph of the peak area responses against concentration. Both r and r2 were 0.99. The method was linear as a result (Table 2).

3.7. Method Precision

By injecting six samples of Gemfibrozil and six spiked samples of impurity into the system at a concentration of 0.03 ppm, the method precision (MP) was established. One injection was given for each preparation. In both the sample and spike solutions, the impurity content and %RSD were calculated. As a result, the sample solutions were devoid of impurities. The %RSD for the spiked sample solutions (n = 6) was 5.5. The procedure was exact and repeatable, according to the findings (Table 3).

3.8. Intermediate Precision

Repeating MP parameters with different analysts, different days, and different lot columns were used to establish the intermediate precision (IP). Gemfibrozil samples and 0.03 ppm impurity-spiked sample solutions were used to calculate the impurity’s content and % RSD. As a result, the impurity is absent from the sample solutions. The %RSD for the spiked sample solutions (n = 6) was 4.8. The RSD (%) for preparations of MP and IP spiked sample at specification level less than 20.0 (n = 12). The results showed that the procedure was rugged (Table 3).

3.9. Accuracy

The accuracy was determined between LOQ and 150% level impurity concentration. Prepared triplicate solutions by spiking impurity into the sample of gemfibrozil at LOQ (0.01 ppm), 50% (0.015 ppm), 100% (0.03 ppm), and 150% (0.045 ppm). Each level was prepared in triplicate with a single injection. The impurity % recovery was calculated from the spiked sample solutions and was found to be between 80% and 120%. According to the outcomes, the method was accurate (Table 3).

3.10. Robustness

By altering the real column flow rate (plus + flow) of 2.2 mL/min and (minus − flow) of 1.8 mL/min as well as the initial column oven temperature of 42 °C (plus + oven) and 38 °C (minus − oven), robustness was determined. With standard and spike solutions, the results were compared with MP data for retention time and concentration. The impurity content % difference between MP and robustness study findings was less than 5. The technique was hence robust (Table 3).

3.11. Standard and Spike Solution Stability

Utilizing allyl chloride secondary intermediate stock solution and spiked samples at 100% concentration levels for up to 48 h at ambient laboratory temperature (25 ± 5 °C) and under refrigerated conditions (2–8 °C), a stability study was performed. By comparing against freshly prepared standard solutions of allyl chloride, which have been shown to be stable, the percentage recoveries of standard solutions of allyl chloride and spiked samples submitted to stability studies were calculated. The results were found to be stable (Table 3). Additionally, validation chromatograms as well as standard qualification data are provided in the Supplementary Materials (Figures S1–S16).

4. Discussion

In the pharmaceutical business, gas chromatography with electron ionization mass spectrometry is an effective analytical technique for very precise and quantitative assessments of very low levels of analytes and impurities. To determine the content of allyl chloride in gemfibrozil, an improved GC-MS/MS method was optimized. No interferences caused by other drug substances or blank were observed at the retention time of the impurity because molecular mass is more particular for each drug substance and impurity. The ability to detect allyl chloride at very low ppm levels, as opposed to those stated [29,30,31,32], is an additional benefit of this method. The developed method is straightforward and requires no additional derivatization steps. The method has the following advantages over the other methods reported in the research. A more accurate and sensitive way of detection would be to use GC-MS/MS; findings from a validation study for the suggested method showed great accuracy and precision. The limit of quantification was used to measure the sensitivity. It was established that the LOQ was 0.01 ppm. This approach is just as effective as or better than that those mentioned in other articles.

5. Conclusions

The simple, effective and reproducible GC-MS/MS method described in the present work is useful for the determination and quantification of very low traces of allyl chloride impurity in Gemfibrozil. The developed method was validated according to ICH guidelines and complied with the acceptance criteria of the analytical parameters. This method is suitable to identify the allyl chloride impurity in routine analysis of the drug substance for Gemfibrozil since it can detect the impurity at 0.005 ppm and quantify it at 0.01 ppm.

Supplementary Materials

The following supporting information can be downloaded at: https://www.mdpi.com/article/10.3390/separations10030145/s1, Figure S1: Allyl chloride standard certificate of analysis; Figure S2: Allyl chloride standard purity by GC analysis; Figure S3: Allyl chloride standard Mass data; Figure S4: Allyl chloride standard 1H-NMR data-1; Figure S5: Allyl chloride standard 1H-NMR data-2; Figure S6. Allyl chloride standard 1H-NMR data-3; Figure S7: Allyl chloride standard 1H-NMR data-4; Figure S8: Allyl chloride standard IR-Spectrum; Figure S9: MS/MS chromatogram of Blank solution; Figure S10: MS/MS chromatogram of System suitability standard solution; Figure S11: MS/MS chromatogram of spiked sample solution; Figure S12: MS/MS chromatograms of Method precision; Figure S13: MS/MS chromatograms of Intermediate precision; Figure S14: MS/MS chromatograms of 150% Accuracy; Figure S15: MS/MS chromatograms of Solution stability standard; Figure S16: MS/MS chromatograms of Solution stability spiked sample; Figure S17: MS/MS chromatograms of Allyl chloride standard poor response and improper peak in Method optimization with different diluents study.

Author Contributions

Conceptualization, H.N.P.R.C. and J.V.S.K.; methodology, H.N.P.R.C. and J.V.S.K.; formal analysis, M.R.S., M.R.H., M.K., A.A. and B.S.; investigation, H.N.P.R.C., J.V.S.K. and M.R.S.; resources, H.N.P.R.C. and J.V.S.K.; data curation, H.N.P.R.C., J.V.S.K., M.R.S. and M.R.H.; validation, A.B. and M.K.; writing—original draft preparation, H.N.P.R.C., J.V.S.K. and A.B.; writing—review and editing, H.N.P.R.C. and M.R.S.; supervision, J.V.S.K.; project administration, J.V.S.K.; funding acquisition, M.R.S. All authors have read and agreed to the published version of the manuscript.

Funding

The authors acknowledge the funding from Researchers Supporting Project number (RSPD2023R665), King Saud University, Riyadh, Saudi Arabia.

Institutional Review Board Statement

Not applicable.

Informed Consent Statement

Not applicable.

Data Availability Statement

Data are contained within the article and the Supplementary Materials.

Acknowledgments

The authors acknowledge the funding from Researchers Supporting Project number (RSPD2023R665), King Saud University, Riyadh, Saudi Arabia.

Conflicts of Interest

The authors declare no conflict of interest.

References

  1. Stauffer, F.; Vanhoorne, V.; Pilcer, G.; Chavez, P.; Rome, S.; Schubert, M.; Aerts, L.; De Beer, T. Raw material variability of an active pharmaceutical ingredient and its relevance for processability in secondary continuous pharmaceutical manufacturing. Eur. J. Pharm. Biopharm. 2018, 127, 92–103. [Google Scholar] [CrossRef] [PubMed]
  2. Sangshetti, J.N.; Deshpande, M.; Zaheer, Z.; Shinde, D.B.; Arote, R. Quality by design approach: Regulatory need. Arab. J. Chem. 2017, 10, S3412–S3425. [Google Scholar] [CrossRef] [Green Version]
  3. Bolt, H.M.; Foth, H.; Hengstler, J.G.; Degen, G.H. Carcinogenicity categorization of chemicals—New aspects to be considered in a European perspective. Toxicol. Lett. 2004, 151, 29–41. [Google Scholar] [CrossRef]
  4. Kondo, K.; Watanabe, A.; Iwanaga, Y.; Abe, I.; Tanaka, H.; Nagaoka, M.H.; Akiyama, H.; Maitani, T. Determination of genotoxic phenylhydrazine agaritine in mushrooms using liquid chromatography–electrospray ionization tandem mass spectrometry. Food Addit. Contam. 2006, 23, 1179–1186. [Google Scholar] [CrossRef]
  5. Leblanc, B.; Charuel, C.; Ku, W.; Ogilvie, R. Acceptability of low levels of genotoxic impurities in new drug substances. Int. J. Pharm. Med. 2004, 18, 215–220. [Google Scholar] [CrossRef]
  6. Froetschl, R. Presentation at the 2009 PhRMA API Workshop. New Burn, NC, USA, 2009; 18–21. [Google Scholar]
  7. Savale, S.K. Genotoxicity of drugs: Introduction, prediction and evaluation. Asian J. Biomater. Res. 2018, 4, 1–29. [Google Scholar]
  8. Liu, K.-T.; Chen, C.-H. Determination of impurities in pharmaceuticals: Why and how? In Quality Management and Quality Control-New Trends and Developments; IntechOpen: London, UK, 2019; pp. 1–17. [Google Scholar]
  9. Gosar, A.; Sayyed, H.; Shaikh, T. Genotoxic impurities and its risk assessment in drug compounds. Drug Des. Intellect Prop. Int. J. 2018, 2, 227–232. [Google Scholar]
  10. Committee, E.S. Scientific Opinion on genotoxicity testing strategies applicable to food and feed safety assessment. EFSA J. 2011, 9, 2379. [Google Scholar]
  11. Shah, S.U. Importance of Genotoxicity & S2A guidelines for genotoxicity testing for pharmaceuticals. IOSR J. Pharm. Biol. Sci. 2012, 1, 43–54. [Google Scholar]
  12. Honorato, J.; Masso, R.; Purroy, A. The Use of Gemfibrozil in the Treatment of Primary Hyperlipoproteinæmia. Preliminary Report. Proc. R. Soc. Med. 1976, 69, 78–79. [Google Scholar] [CrossRef] [Green Version]
  13. Todd, P.A.; Ward, A. Gemfibrozil. Drugs 1988, 36, 314–339. [Google Scholar] [CrossRef] [PubMed]
  14. Creger, P.L.; Neuklis, W.; Arbor, A. Aryloxypentane Compounds. U.S. Patent 3,707,566, 26 December 1972. [Google Scholar]
  15. Creger, P.; Moersch, G.; Neuklis, W. Structure/activity relationship of gemfibrozil (CI-719) and related compounds. Proc. R. Soc. Med. 1976, 69, 3–5. [Google Scholar] [CrossRef] [PubMed] [Green Version]
  16. Yang, Q.; Ren, T.; Yang, S.; Li, X.; Chi, Y.; Yang, Y.; Gu, J.; Hu, C. Synthesis and Pharmacokinetic Study of Three Gemfibrozil Salts: An Exploration of the Structure–Property Relationship. Cryst. Growth Des. 2016, 16, 6060–6068. [Google Scholar] [CrossRef]
  17. Rubins, H.B.; Robins, S.J.; Collins, D.; Fye, C.L.; Anderson, J.W.; Elam, M.B.; Faas, F.H.; Linares, E.; Schaefer, E.J.; Schectman, G. Gemfibrozil for the secondary prevention of coronary heart disease in men with low levels of high-density lipoprotein cholesterol. New Engl. J. Med. 1999, 341, 410–418. [Google Scholar] [CrossRef]
  18. ICH Guidelines, Q 3A(R); Impurities is New Drug Product. The Quality Guide Lines for Active Pharmaceutical Ingredients Related to Impurities According to the International Conference of Harmonization. 2022. Available online: http://www.ich.org (accessed on 1 January 2023).
  19. Madasu, S.B.; Vekariya, N.A.; Velladurai, H.; Islam, A.; Sanasi, P.D.; Korupolu, R.B. Improved Process for Preparation of Gemfibrozil, an Antihypolipidemic. Org. Process Res. Dev. 2013, 17, 963–966. [Google Scholar] [CrossRef]
  20. Hitesh, T.K.; Mahantesh, J.; Vikrant, M.P.; Somanath, N.S.; Pravin, M.N.; Ameya, M.T.; Sudhir, N. An Improved Process for the Preparation of a Key Intermediate of Gemfibrozil. WIPO (PCT) Patent Application No. WO2019069321A1, 11 April 2019. [Google Scholar]
  21. Nunna, R.; Jayanna, N.; Ramachandran, D. An Improved New Path to Synthesize Gemfibrozil. Asian J. Chem. 2015, 27, 925. [Google Scholar] [CrossRef]
  22. Friedland, S.N.; Leong, A.; Filion, K.B.; Genest, J.; Lega, I.C.; Mottillo, S.; Poirier, P.; Reoch, J.; Eisenberg, M.J. The cardiovascular effects of peroxisome proliferator-activated receptor agonists. Am. J. Med. 2012, 125, 126–133. [Google Scholar] [CrossRef] [PubMed]
  23. Zhao, M.; Shi, J.; Li, W.; Guan, C.; Sun, C.; Peng, Y.; Zheng, J. Metabolic activation of gemfibrozil mediated by cytochrome P450 enzymes and sulfotransferases. Chem. Res. Toxicol. 2022, 35, 1257–1266. [Google Scholar] [CrossRef]
  24. Boyd, M.R.; Grygiel, J.J.; Minchin, R.F. Metabolic activation as a basis for organ-selective toxicity. Clin. Exp. Pharmacol. Physiol. 1983, 10, 87–99. [Google Scholar] [CrossRef] [PubMed]
  25. Ogilvie, B.W.; Zhang, D.; Li, W.; Rodrigues, A.D.; Gipson, A.E.; Holsapple, J.; Toren, P.; Parkinson, A. Glucuronidation converts gemfibrozil to a potent, metabolism-dependent inhibitor of CYP2C8: Implications for drug-drug interactions. Drug Metab. Dispos. 2006, 34, 191–197. [Google Scholar] [CrossRef]
  26. Sallustio, B.C.; Foster, D. Reactivity of gemfibrozil 1-o-beta-acyl glucuronide. Pharmacokinetics of covalently bound gemfibrozil-protein adducts in rats. Drug Metab. Dispos. 1995, 23, 892–899. [Google Scholar]
  27. U.S. Department of Health and Human Services. Registry of Toxic Effects of Chemical Substances (RTECS, Online Database); National Toxicology Information Program, National Library of Medicine: Bethesda, MD, USA, 1993. [Google Scholar]
  28. Omura, M.; Itonaga, Y.; Komatsu, H.; Mangen, Z.; Hirata, M.; Tanaka, A.; Inoue, N. The acute toxicity of allyl chloride by subcutaneous injection in mice. Fukuoka Igaku Zasshi = Hukuoka Acta Med. 1993, 84, 427–432. [Google Scholar] [PubMed]
  29. U.S. Environmental Protection Agency. Health and Environmental Effects Profile for Allyl Chloride; Environmental Criteria and Assessment Office, Office of Health and Environmental Assessment, Office of Research and Development: Cincinnati, OH, USA, 1986. [Google Scholar]
  30. Ingle, S.U.; Patil, P.P.; Barhate, S.D.; Umarkar, A.R. Stability indicating rp–hplc method for determination of gemfibrozil in pharmaceutical formulation. World J. Pharm. Res. 2015, 4, 1625–1635. [Google Scholar]
  31. Vishnupriya, S.; Narenderan, S.; Vishnu, K.; Babu, B.; Meyyanathan, S. A novel analytical liquid chromatography-tandem mass spectrometry method for the estimation of Gemfibrozil in bulk and pharmaceutical formulations. J. Appl. Pharm. Sci. 2019, 9, 97–101. [Google Scholar]
  32. Ulu, S.T. LC determination of gemfibrozil in tablets. Chromatographia 2006, 64, 447–451. [Google Scholar] [CrossRef]
  33. Branch, S.K. Guidelines from the international conference on harmonisation (ICH). J. Pharm. Biomed. Anal. 2005, 38, 798–805. [Google Scholar] [CrossRef] [PubMed]
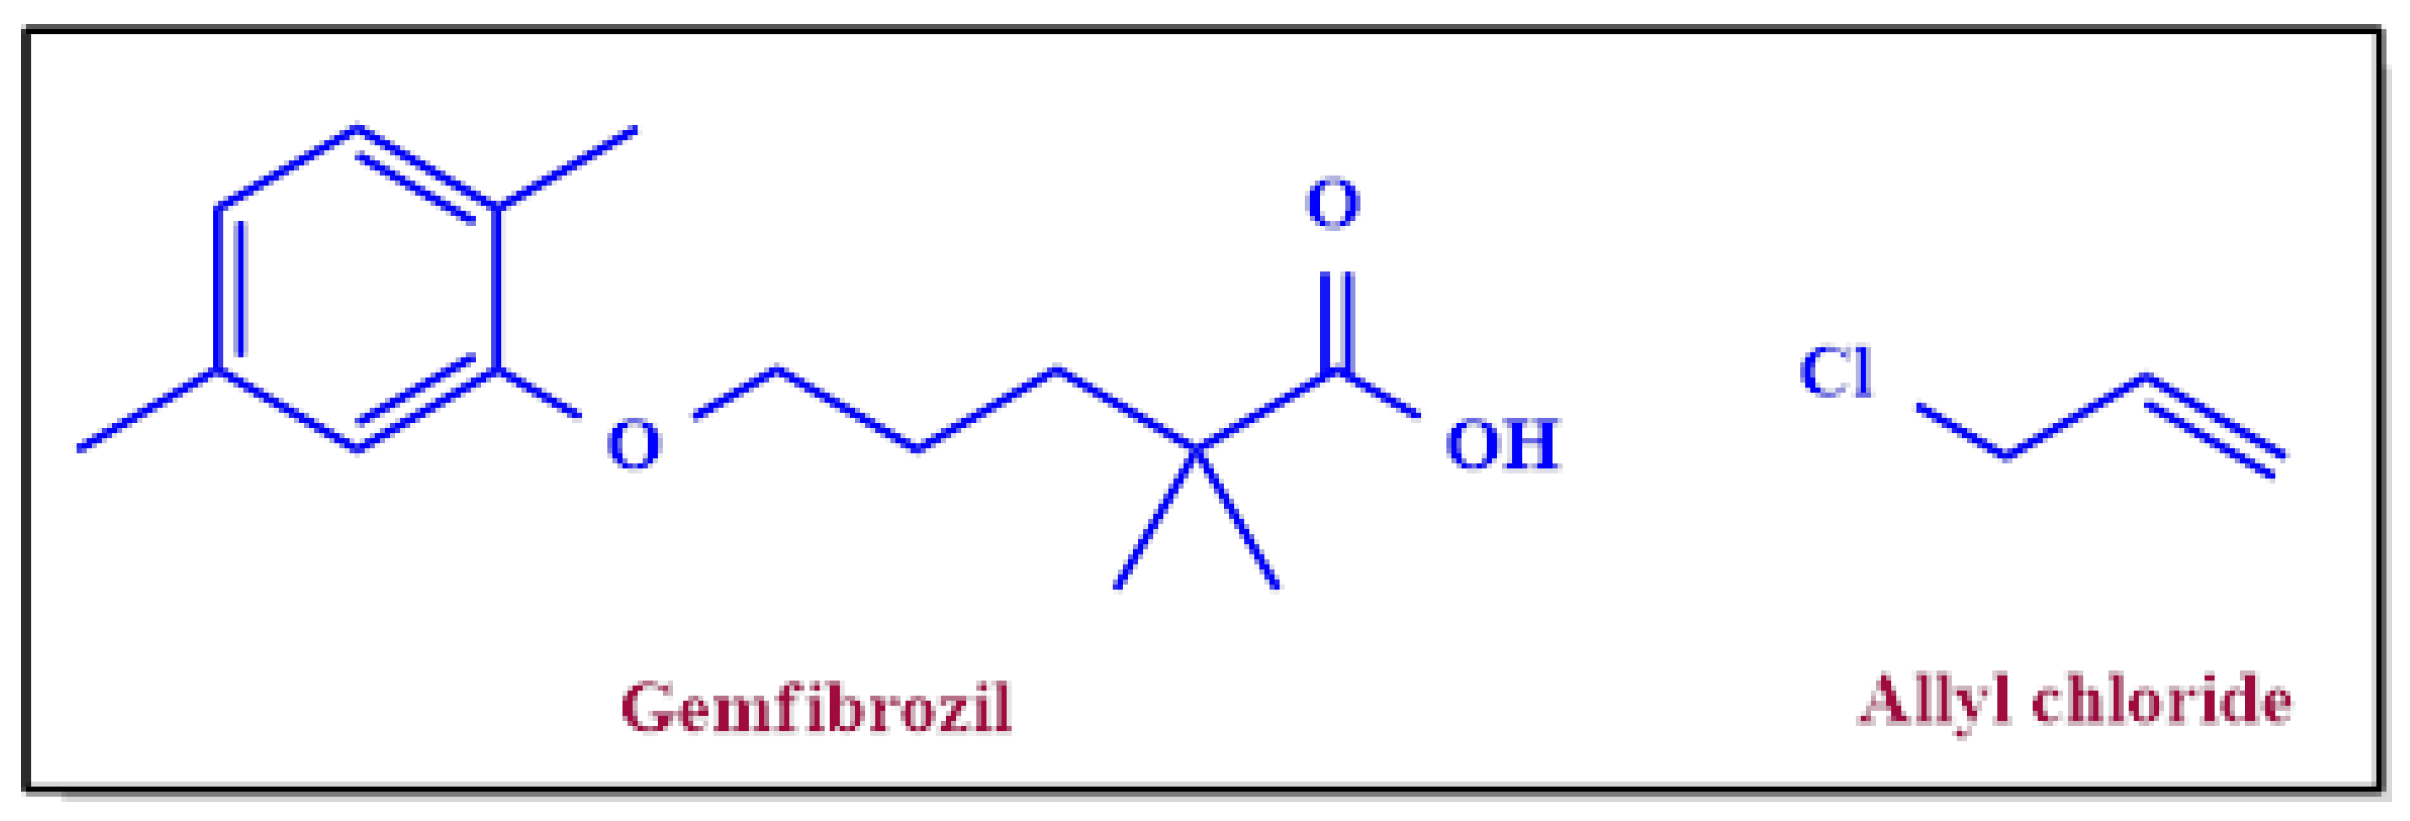
Figure 1. Structure of Gemfibrozil and Allyl chloride.
Separations 10 00145 g001
Figure 2. Reaction mechanism for the formation of 5-Bromo-2,2-dimethyl-pentanoic acid isobutyl ester.
Separations 10 00145 g002
Figure 3. Mass fragmentation of allyl chloride.
Separations 10 00145 g003
Figure 4. Allyl chloride standard solution chromatogram.
Separations 10 00145 g004
Figure 5. LOD solution chromatogram.
Separations 10 00145 g005
Figure 6. LOQ solution chromatogram.
Separations 10 00145 g006
Figure 7. Linearity solution chromatogram.
Separations 10 00145 g007
Table 1. GC-MS/MS instrument final conditions.
Instrument SetupDetails
GC Parameters
Chromatographic systemAgilent Technologies 7890B GC system
GC ColumnUSP phase G27, 30 m length, 0.32 mm internal diameters, 1.5 µm film thickness
Carrier GasHelium
Column ModeConstant Flow
Gas flow 2 mL/min
Injector (Heater) 200 °C
Volume of injection 2 microliters
Oven ProgrammingRamping (°C/min) rateTemperature Hold time in minutes
-40 (°C)0
15250 (°C)6
Split flow20
Run time 20 min
Mass spectrometry conditions
MS systemAgilent Technologies 7010B GC/TQ
Ion source and Detection mode EI and MRM
For qualification (m/z)76 amu 39 amu
For quantification (m/z)76 amu 41 amu
Dwell time (in milliseconds)100
Collision energy (CE)8 v
Gain Factor20
Detector off (MS -Off)4 min
Temperature of Source (°C)230
Temperature Transfer Line (°C)240
MS Quad temperature (°C)150
Table 2. Summary of method validation results.
ParametersAcceptance CriteriaObservation
Specificity and SSTArea % RSD of allyl chloride peak should be ≤15.0.3.5%
RT % RSD of allyl chloride peak should be ≤5.0.0.8%
RT of allyl chloride peak.2 min
Any blank Interference Not observed
Limit of detectionLimit of detection Concentration 0.005 ppm
Signal-to-noise ratio should be ≥322
Limit of quantificationLimit of quantification Concentration 0.01 ppm
Signal-to-noise ratio should be ≥1045
Precision for Limit of quantificationArea % RSD of allyl chloride peak from 6 injections of LOQ solution should be ≤20.0%4.8%
Linearity and RangeRange for allyl chloride0.01 to 0.045 ppm
Correlation coefficient for allyl chloride linearity solutions should be ≥0.990.99
Square of the correlation coefficient for allyl chloride linearity solutions should be ≥0.990.99
Table 3. Method validation results.
ParametersAcceptance CriteriaObservation
Method precisionArea % RSD of allyl chloride peak from six preparations of spiked samples should be ≤15.0.5.5%
Intermediate precisionArea % RSD of allyl chloride peak from six preparations of spiked samples should be ≤15.0.4.8%
Area % RSD of allyl chloride peak from 12 preparations of spiked samples from MP and IP should be ≤20.0.Results with in acceptance limit.
AccuracyThe average recovery should be between 70% to 130% for LOQ spiked solution.94.40%
Average recovery should be between 80% to 120% for 50% spiked solution.96.60%
Average recovery should be between 80% to 120% for 100% spiked solution.98.50%
Average recovery should be between 80% to 120% for 150% spiked solution.97.30%
RobustnessPlus flow: concentration difference and retention time of allyl chloride spiked sample.2.1%, 1.9 min
Minus flow: concentration difference and retention time of allyl chloride spiked sample.1.4%, 2.1 min
Plus oven temperature: concentration difference and retention time of allyl chloride spiked sample.2.6%, 1.9 min
Minus oven temperature: concentration difference and retention time of allyl chloride spiked sample.1.7%, 2.1 min
Standard and spike solution Stability Allyl chloride standard and spiked solutions were observed for 48 h under ambient laboratory temperature (25 ± 5 °C) and under refrigeration (2–8 °C).Both solutions are Stable
Disclaimer/Publisher’s Note: The statements, opinions and data contained in all publications are solely those of the individual author(s) and contributor(s) and not of MDPI and/or the editor(s). MDPI and/or the editor(s) disclaim responsibility for any injury to people or property resulting from any ideas, methods, instructions or products referred to in the content.