Abstract
Hydrophobicity is an important physicochemical property of peptides in solution. As well as being strongly associated with peptide stability and aggregation, hydrophobicity governs the solution based chromatographic separation processes, specifically reversed-phase liquid chromatography (RPLC). In addition, hydrophobicity is a major physicochemical property of peptides in comparison to H-bonding, electrostatic, and aromatic properties in intermolecular interactions. However, a wide range of molecular factors can influence peptide hydrophobicity, with accurate predictions depending on specific peptide amino acid compositions, structure, and conformation. It is noticeable that peptide composition, the position of the amino acid, and its neighbouring groups play a crucial role in the elution process. In light of this, the same amino acid behaved differently depending on its position and neighbouring amino acid in the peptide chain. Extra attention should be paid to the denaturation process during the course of elution, as it has been shown to complicate and alter the elution pattern. This paper reports on the key peptide properties that can alter hydrophobicity and, consequently, the RPLC elution behaviour of the peptides, and it will conclude by proposing improved prediction algorithms for peptide elution in RPLC.
1. Introduction
Peptides are consolidating their importance in the pharmaceutical arena with a total FDA approvals of 22 peptide-based therapeutics during the last six years [1]. Peptides also exist in other pharmaceutical therapeutics such as the antibody drug conjugates, where they can be found as linkers or therapeutic payload, or both [2]. This success is ascribed to their high specificity and tolerable safety profile. Furthermore, the advancements in the main synthetic methodology called solid-phase peptide synthesis (SPPS) have enabled the synthesis of new families of peptides with both high purity and yield [3]. However, though SPPS produces relatively pure peptides, these purities are insufficient for therapeutic use by humans. Therefore, peptide separation and purification is a core facet for the manufacture of therapeutics products that are safe for human consumption. Reversed-phase liquid chromatography (RPLC) is the industry standard method to achieve such purity [4,5]. Peptide hydrophobicity is an important physicochemical property the governs the RPLC separation process of peptides and determines how they interact with the chromatographic packings [6,7]. Due to the intrinsic structural characteristics of peptides, synthetic peptide impurities often have very similar structures, complicating their separation and purification [8]. Hence, developing a reliable and accurate tool for predicting the chromatographic retention behaviour of structurally similar peptides is of the utmost importance for optimising industrial RPLC processes.
Previous studies have discussed the prediction of peptide retention times based on oligomer structures [7]. In fact, such structures do not represent the real “therapeutic”, or model peptides or even those obtained from the tryptic digest. Hence, data generated from these oligomers-based peptides have only a limited use. However, when it comes to predicting the retention behaviour of real or model peptides, their validity is questionable. As will be discussed in this review, several groups have considered model peptides for the retention time prediction, but these overall efforts have only had limited success.
2. Retention Time Prediction Based on Model Peptides
Guo et al. [9] have reported on predicting the retention time of peptides by estimating the influence of the individual amino acid residues in a “model peptide” containing the following sequence: (Ac-Gly-X-X-(Leu)3-(Lys)2-Amide). All the proteinogenic amino acids are placed independently in position X. This work incorporates two amino acids of the same type at a time to amplify their influence on the final retention behaviour in the model peptide. Mobile phases investigated included pH 2 (A: 0.1%trifluoroacetic acid (TFA) in water; B: 0.1%TFA in ACN) and pH 7 (A: 10 mM (NH4)2HPO4—0.1 M NaClO4; B: 0.1 A4 NaClO4 in 60% aq. ACN), which were evaluated in the study with the following columns: Beckman Ultrapore RPSC C3, 5 µm, 4.6 × 75 mm; SynChropak RP-4 (C4), 6.5 µm, 4.1 × 250 mm; SynChropak RP-8 (C8), 6.5 µm, 4.1 × 250 mm; Whatman Partisil 5 (C8), 6.5 µm, 4.6 × 250 mm; and three SynChropak RP-18 (C18) columns: 6.5 µm, 4.1 × 250 mm, 6.5 µm, 4.1 × 50 mm, and 6.5 µm, 10 × 250 mm. All of these columns have a 300 Å pore size, except the Whatman Partisil, which has a size of 60 Å [9].
The most pronounced retention coefficient changes were noticed in the following residues: Glu, Asp, His, Arg, and Lys; basically, those are charged residues. At pH 7, the acidic residues Glu and Asp are completely ionised and hence elute earlier. At pH 7, His is neutral, which leads to it being retained more strongly. For Arg and Lys, the authors proposed that some kind of ionic interaction is taking place between their positive charge and the silanol groups of the stationary phase [9].
The retention coefficient of each amino acid is determined based on the retention time of the peptide containing the corresponding amino acid. Retention coefficient of the termini was determined using the following peptide: Y-Gly-(Leu)3-(Lys)2-Z, where Y: acetylated (Ac) or non-Ac N-terminus; Z: amide or acid C-terminus. The non-Ac peptides at pH 2.1 revealed a clear reduction in their retention time due to the positive charge associated with the protonation of the N-terminus. On the other hand, changing the amide C-terminus to an acid one had a minimal effect in decreasing the retention time, because it would be protonated with no charge at pH 2.1. On the contrary, the effect of pH 7.4 on the N-terminus (Ac or non-Ac) would have a small effect, whereas changing the C-terminus from amide to acid would show a pronounced reduction in the retention time due to the deprotonation of the carboxylic C-terminus (Table 1) [9].

Table 1.
Retention time for pH 2.0 and 7.0 [9].
Differences between the retention times among various groups might be attributed either to the absence of certain amino acids in one of the studies under comparison, or to the neighbouring effect or chain length. This research group also investigated the effect of various organic modifiers added to the mobile phase that can be used to enhance peptide separation. Acetonitrile proved to be superior in comparison with 2-propanol and methanol. However, for highly hydrophobic peptides, the 2-propanol, which is more non-polar, was more beneficial [9]. Similarly for a highly hydrophilic peptide, methanol, which is more polar, performed better. These findings are in agreement with the work of Meek and Rossetti [10]. Interestingly, when C8 and C18 columns with different lengths were used, different elution patterns for alkylphenones were observed, while with peptides, the elution pattern was almost the same. This observation could lead to some insight into the mechanism of the elution. In the case of alkylphenones, it is mainly attributed to the partitioning effect, which explains the late elution when using C8, which has almost double the ligand density compared to the C18. Whereas adsorption/desorption is the driving force for the separation process in the case of peptides, it is to be noted that partitioning contributes as a retention mechanism for peptides, albeit to a lesser extent, and this is mainly dependent on the composition of the peptide being investigated. Thus, using an internal standard could help in decreasing the differences. The internal standard has to be peptide based to fulfil the prerequisite of being as close as possible to the nature of the material being separated. In a study using alkylphenones as an internal standard, the authors highlighted a different retention mechanism of separation [9].
The predicted retention time () of a peptide is calculated as follows:
where represents the sum of the retention coefficients for all amino acid residues and the termini, is the estimated dead volume of the column using the retention time of the TFA peak, and is the time correction for the peptide standard. This last value is previously calculating using the same equation in the form , where and are observed values for the standard that is run under the same chromatographic conditions as the peptides to be predicted.
Determining the retention values for standard peptide and unretained compounds is beneficial, as for any HPLC system where the column’s specifications such as length, particle size, or packing are known, this data can then be used to predict the retention time of peptides with a known structure [9].
Guo and co-workers also carried out another study to investigate further factors that may influence the peptide’s retention time [11]. A total of 58 peptides in the range of 2–16 residues were investigated in this study. An excellent correlation was obtained between predicted and measured retention times, r = 0.98, which proved the dependence of the retention time of peptides on their amino acid composition [11].
Several findings were observed as a result of changing various condition of the chromatographic system. Increasing the flow rate and decreasing the elution gradient steepness had a positive effect on the resolution of peptide mixture. This behaviour is ascribed to the fact that the retention time is not strongly affected by the flow rate, whereas the peptide tendency to diffuse decreases with faster flow rates, which leads to a decrease in the peak width and consequently enhances the resolution, provided that the resolution is calculated by dividing the difference in the retention times of the two peaks over their total widths. For the gradient steepness, the increase in the retention time difference is more pronounced than the increase in the peak width, and hence, a higher resolution is obtained [11].
Increasing the column temperature decreased the peptide retention time and enhanced the resolution. Interestingly, for chromatographed homologous peptide pairs (the same amino acids with different order), those pairs were eluted as a single peak, and in the extreme case where a complete rearrangement of the sequence was considered, a near doublet peak was observed. These findings reaffirmed the accuracy of their developed retention time predictivity model, which depends primarily on the amino acid composition in the peptide, rather than their order. Increasing the temperature increased the peptide solubility in the mobile phase, which translated to decreasing the retention time and enhancing the resolution. That is, the peptide had a stronger preference for the mobile phase compared to the stationary phase. This study considered temperatures in the range of 26–66 °C. The molecular weight of the peptide has a key role for peptides up to 20 residues, but beyond 20 residues, a molecular weight correction must be incorporated [11]. The fundamental function of a prediction tool is to narrow the retention time/volume in which the peptide of interest will be eluted, thus saving, time, chemicals, and effort during processing [11].
Hodges and co-workers (including Guo) also introduced another hydrophobicity scale [12] by normalizing the coefficients previously determined in their study (Table 1) [9]. Reporting a relationship between hydrophilicity and antigenicity, this study aimed to investigate which amino acid is antigenic based on its hydrophilicity value. Determination of retention time coefficients was carried out by assigning a value of −10 to the amino acid with the highest retention coefficient from their previous study (shown in Table 1) [9], whereas the amino acid with the lowest retention coefficient was assigned with a +10 value. Other amino acids will be scaled accordingly [12].
Dealing with real peptides showed that several factors play a role in the hydrophobicity of amino acids.
3. Factors Affecting Amino Acid Hydrophobicity
3.1. Stationary Phase
In 1991, Wilce et al. carried out an extensive study using 2106 peptides from various studies to extract the retention coefficients of the amino acids [13]. A multiple regression matrix approach was utilized for this purpose. This statistical analysis revealed that at least 100 peptides are required for accurate retention coefficients determination. Various studies (Section 3.4) proved that as the peptide chain becomes larger, more deviation is expected from the linear summations of the hydrophobic contributions of the individual amino acids. This limitation is ascribed to the developed secondary, tertiary, and quaternary structures by the peptides in solution. These conformational changes result in changing the overall interaction patterns of the peptide molecule while in the chromatographic system, with either mobile or stationary phases. The main idea of this study is to assess the influence of various chromatographic conditions on the amino acid hydrophobicity coefficients [13].
Assuming that the retention mechanism is being governed solely by the hydrophobic interactions between the solute, mobile phase, and stationary phase, with the absence of any other electrostatic or H bonding interactions, this could be translated in the expression:
where and are the retention factor and the equilibrium association constant of a hydrophobic solute, and is the phase ratio of the column measured as the ratio of the volumes of the stationary phase and the mobile phase.
Since the selectivity () of two peptide entities (Pi and Pj) under a defined chromatographic condition can be measured as the ratio of and , the difference in retention coefficient of two peptides with only one different amino acid would be:
Here, 𝜏 can be understood as the difference in the energy due to the transfer of the peptide i from the mobile phase to the stationary phase, with respect to that of peptide j.
According to the solvophobic theory [14], where the retention coefficients represent the interaction of a certain portion of the analyte with the hydrophobic stationary phase, and including the ligand immobilized on it, the authors predict that a linear relationship should also be present, provided that the retention coefficients were derived from experimental chromatographic retention data. So, this means that the approach is also useful to understand the relationship between the amino acids and the ligands immobilized on the stationary phase as well as their densities.
Casal et al. studied the elution profile of 25 different peptides using four columns [15]. In this study, multiple linear regression (MLR) and partial least square (PLS) regression analyses were used. The main idea of this study is to evaluate the influence of different stationary phases on the retention coefficients of short peptides as well as on their retention times. The following columns were incorporated: (C8—Ultrasphere, 5 µm, 4.6 × 250 mm), (C18—Ultrasphere, 5 µm, 4.6 × 250 mm), (polymeric RP—PLRP-S, 8 µm, 300 A, 4.6 × 150 mm), and (C18—Nova-pak, 4 µm, 60 A, 3.9 × 150 mm). The following mobile phases were used: A: 0.1 TFA in water, B: 0,1% TFA in acetonitrile [15].
The MLR and PLS regression models assumed the following equation to predict the retention times of peptides based on their amino acid compositions:
where is the intercept of the linear model, is the amino acid retention coefficient, and is the number of times the same amino acid repeats in the peptide sequence.
Computer-aided programming was carried out afterwards to predict the retention times of peptides.
Several short peptides were chromatographed using these four columns, and their retention times of were used establish the retention coefficient of each amino acid using MLR and PLS models (Table 2).
Table 2.
Retention time coefficients of amino acids [15].
From the retention data in Table 2, a limited influence of the stationary phase on the retention behaviour of the amino acids was observed. Furthermore, the higher pore diameter of PLRP-S column had little effect on the behaviour of short peptides. This confirms the independence of the retention behaviour of peptides on the column length, packing, or even the length of the alkyl chain attached to the stationary phase. These observations were also previously noted by Meek and Rossetti [10] and Guo et al. [9]). However, the authors stated that the effect of alkyl chain length could be more significant with the long peptides, which is ascribed to fact that one of the investigated peptides (DRVYIHPFHLLVYS) exhibited an overestimated predicted retention time by 18 min [15].
The suitability of this study in predicting the retention times of peptides was exemplified by comparing the predicted and the observed retention times of peptides recruited in this study as well as those were not used to estimate the retention coefficients. Good agreements were obtained where the correlations were r = 0.999 and 0.941, respectively. In conclusion, this study proved the ability to predict the retention times of short peptides [15].
Field et al. studied the effect of 38 different stationary phases on the elution pattern of peptides. Interestingly, various peptide analogues were recruited to have most of the potential structural modifications. Thus, oxidation, racemisation, and an increase and decrease in the charge were included in the study [16]. The main motivation of this study is the failure of the small molecule databases to correlate with the chromatographic behaviour of peptides. The study offers a selection of novel stationary phases for enhanced selectivity and peak shape [16].
3.2. Mobile Phase Composition and Alkyl Chain Length
Wilce et al. investigated the effect of different alkyl chain lengths as well as organic modifiers on the retention coefficients [13]. A total of 44 group sets were assigned for the incorporated peptides in this study. In this context, C18, C8, and C4 columns, and TFA–acetonitrile–water, TFA–1-propanol–acetonitrile–water mobile phases were investigated for their influence on the retention coefficients. The study proved a linear relationship between the retention time and the amount of organic modifier in the mobile phase. A multiple regression matrix approach was considered to calculate the retention coefficients, in addition to an alternative computational-based approach (multiple linear analysis with forcing) being considered. Comparable data were obtained almost to a certain extent. However, as the matrix approach is performed via statistical means, it is considered superior to the computational approach, and it can also provide more information about the individual amino acids [13].
Wilce et al. extracted the retention coefficients of individual amino acids from two different mobile phases using experimental data from 2106 peptides via a complex multi-linear regression analysis approach [13]. Moving from a TFA–ACN mobile phase to TFA–1-propanol–ACN, certain amino acids exhibited a significant difference in their retention coefficients (F, L, I, Y, C and A). Specifically, F, L, Y, and A interacted more strongly with the C18 stationary phase for TFA–ACN. The other amino acids, I and C, interacted more with the TFA–1-propanol–ACN mobile phase. This confirmed the different selectivity based on the organic modifier used in the mobile phase [13]. Specifically, differences in alkyl chain length also resulted in differences among the retention coefficients, while changing from C18 to C8 stationary phases affected the amino acids F, L, W, Q, M, A and D. Specifically F, L, and W showed longer retention times for C8 versus C18. On the other hand, Q, M, and D eluted earlier with C8- than C18-based columns. Significant differences were also observed by going from C18 to C4 alkyl chain length stationary phases for the amino acids F, L, C and H. The hydrophobic residues F and L eluted at a longer retention time with C18 columns compared to C4 columns, while C and H residues behaved in the opposite manner [13]. The authors also referred to other factors that could play a role in the overall separation process. An NMR study revealed that the solution conformation of the alkyl chain themselves could vary, hence affecting the separation process. Furthermore, the molecular mobility of alkyl chains bonded to the stationary phase could be increased as a result of increasing the polarity of the mobile phase. In conclusion, the variety of retention coefficients reported using different stationary phases demonstrated the direct influence of the alkyl chain length on the separation process and the way the peptide is interacting with the surface of the stationary phase. Finally, the hydrophobic character of a specific amino acid could vary depending on the organic modifier used in the mobile phase and/or the length of the alkyl chain of the column [13].
While Wilce and co-workers previously used data reported in the literature [13], later, they experimentally measured the retention coefficients for 118 peptides selected as heptamers related to the primary sequence of the myohemerythrin protein [17]. A multiple linear regression approach was again used to calculate the retention constants for the constituent amino acids. The obtained retention coefficients were then compared with the previously determined values for 2106 peptides [13]. Five chromatographic mobile phase conditions were included in this study: ACN, methanol, 2-propanol as alternate organic modifiers, TFA or potassium phosphate-based mobile phase, in addition to different silica-based stationary phases (octadecyl or phenyl). The authors also investigated the effect of the peptide chain length on the prediction capability. The five solution/column conditions evaluated were:
Condition 1: mobile phases A: 0.1% aqueous TFA, B: 0.09% TFA-50% in ACN; Zorbax C18;
Condition 2: mobile phases A: 0.1% aqueous TFA, B: 0.09% TFA-50% in methanol; Zorbax C18;
Condition 3: mobile phases A: 0.1% aqueous TFA, B: 0.09% TFA-50% in 2-propanol; Zorbax C18;
Condition 4: mobile phases A: 25 mM KH2PO4 B: 35 mM KH2PO4-50% in ACN; Zorbax C18;
Condition 5: mobile phases A: 0.1% aqueous TFA, B: 0.09% TFA-50% in ACN; Zorbax phenyl silane.
A DuPont Zorbax C18, 5 µm, 4.4 × 150 mm column was considered with all four conditions, and Condition 5 was the DuPont Zorbax phenyl silane; 5 µm, 4.6 × 150 mm with Condition 1 mobile conditions; both columns have a 75 nm pore size. Hydrophobicity coefficients for the amino acids were then extracted for these chromatographic conditions (see Table 3) [17].
Table 3.
Estimated amino acid retention coefficients in five different chromatographic conditions [17].
Similar behaviours were observed in all conditions, where the highest correlation was between mobile phases 1 and 3 (r = 1.00), and the lowest was between mobile phase 4 and 2 (r = 0.800). Some differences between this study and the previous one [13] are ascribed to the differences in the frequency of the amino acids distribution within the peptide sequence. In addition, the number of the peptides used in the data analysis were 112 in this study [17] versus 2106 previously [13]. The specific peptide sequence of both studies could also have a role in the observed discrepancies. In the previous study [13], the origin of the peptides were from enzymatic and chemical cleavage of a wide range of proteins, whereas in this study, they are from only a single protein [17]. Given that, the first peptide represents the first seven residues of myohemerythrin sequence, and the second one comprises the residues from 2 to 8. In summary, the local environment around the amino acid residues influences the extent of the interaction of the peptides with the stationary phase in chromatographically [17].
Recently, Field and co-workers investigated the factors that could influence the robustness of the method that includes DoE as well as the robustness of mobile phase switching. The study addressed the mitigation strategies for the impact of gradient variation as well as the sample load and its influence on switching between low and intermediate pH values [18]. In a very recent study, the authors have also investigated a total of 51 mobile phase with different pH values on the selectivity of peptide separation process [19]. In this study, the authors compared mobile phases with various salts, ion pairs, pH, stationary phases, and hence, it is a quite comprehensive study [19]. The study concluded that different mobile phases would allow a vast selectivity difference if applied at a correct pH. Hence, this study, along with their previous work [16], will help in the development process of RPC process [19].
Ion-Pairing Reagent
In 1987, Guo and co-workers studied the ion-pairing effect on the prediction of peptide retention time [20]. As the TFA is a hydrophobic ion-pairing reagent, it interacts with the basic sites of the peptide, leading to an increase in the retention time and thus affecting the prediction accuracy. The hydrophobic ion-pairing reagent is not only capable of interacting with the analyte to form the ion pair, but it is also able to result in an increased affinity of the peptide with the stationary phase, leading to an increased retention time. On the other hand, a hydrophilic ion-pairing reagent, after forming the ion pair with the peptide, is unlikely to interact with the non-polar stationary phase. Phosphoric acid (H3PO4) can be used as a hydrophilic ion-pairing reagent. Guo and co-workers compared the influence of the three ion-pairing regents on the peptide retention: TFA, HFBA, and H3PO4. The model peptide (Ac-Gly-X-X-(Leu)3-(Lys)2-Amide) was studied, which was also used to establish the retention time coefficient in a previous study by the same researchers (Table 1) [9]. Columns considered were SynChropak C18, 6.5 µm, 4.1 × 250 mm and Aquapore C8 10 µm, 4.6 × 220 mm, both with 300 Å pore sizes [20].
This study plotted the retention times of the peptides/number of the positive charge on each peptide for each of the three ion-pairing reagents versus the values obtained for the other two. Excellent correlations using linear least square fit were obtained: HFBA and TFA r = 0.999, H3PO4 and TFA r = 0.998, H3PO4 and HFBA r = 0.997. These results suggested that each positive charge contributes equally to the retention time shifts, in addition to the fact that only positive charges can influence the retention mechanism. Moreover, the negligible change in the retention behaviour of neutral peptides supports those findings. The authors proposed an equation to predict the retention times and examined a mixture of peptides with various numbers of positively charged groups. The results showed the largest retention time was for HFBA (the most hydrophobic), while the lowest retention time was for H3PO4 (the most hydrophilic). Changing the ion-pairing reagent is beneficial for separating peptides with similar hydrophobicity, but with a different number of positive charges. This approach is more advantageous than searching for different columns and specifications. The results showed accuracy between the predicted and the observed retention times, though sometimes discrepancies can arise due to the fact that not all residues are involved in the interaction; this is especially the case if there are two charged residues in a close proximity to each other, for example, a charged residue at the N-terminal of the peptide chain. Overall, this study reported an excellent tool to predict the retention times and to evaluate the effect of various ion pairs on the peptide separation process [20].
3.3. Sample Size
Wilce et al. included seven different sample sizes, where each set contained randomly selected peptides [13]. The separation was performed on a C18 column using TFA–ACN–water as the mobile phase. Afterwards, a multiple linear regression analysis was performed to generate the retention coefficients. The study revealed that the smaller the sample size, the more accurate the retention coefficients, in which deviation would be highly expected in case of any other peptide out of the set that was considered to generate the coefficients. Thus, the larger the sample size, the more universal the retention coefficients will be. It is worth mentioning that the correlation between the tested peptide sets decreased as the sample size increased. However, what really matters is the overall influence on the retention coefficient rather than the correlation. To explain the last point regarding the low correlation in the large sample size; assuming the nearest neighbour factor, obviously, this effect would be significantly pronounced in the large-sized sets as the possibility of having various amino acids is more likely to be high in comparison with the small sized ones. In turn, this would affect the final correlation among the sets under investigation [13].
3.4. Peptide Chain Length
Wilce et al. investigated several peptide sets, each with 100 peptides and a peptide chain length of 4–15 residues. The obtained correlation of 0.58 to 0.66 proved that in the selected peptide chain length range, there is no substantial effect associated with chain length on the retention coefficients [13]. The study considered eight peptide groups, in which the chain lengths were as follows: 2–30, 220, 2–15, 2–10, 2–8, 2–7, 2–5, and 2–4. In fact, the highest correlation was with the peptide group of 2–15 residues, which compromises an average chain length of 7.2 residues. Thus, it is not surprising to have a good correlation considering the heptamer peptide fragments that were used in this study [17]. On the other hand, a lower correlation was observed with 2–10, 2–8, 2–7, 2–5, and 2–4 amino acid residues. The low correlation with the latter groups could be circumvented by incorporating the coefficients for N- and C-termini. As the peptide chain reaches 19 residues, a poor correlation (r = 0.38) with the previous study [13] was obtained. This confirms the effect of the chain length on the predicted retention time. Excluding the peptides of more than seven residues in length resulted in an enhanced correlation of r = 0.82. Again, this emphasizes that other factors are influencing the retention behaviour of peptides. The conformational flexibility of the peptide has an important influence on the retention time as it directly controls the way the peptide will interact with the stationary phase [17].
The ability to predict the retention time using the scales in the previous study [13] and the current one (Table 3) [17] was exemplified by the good correlation values. A total of 118 peptides were examined and showed a good correlation (r = 0.98) between the predicted and observed retention times, according to the scales obtained from this study. Moreover, using the previously estimated scale, the correlation between the predicted and the observed retention times was r = 0.91. It is worth mentioning that some adjustments were needed while using the previous study to account for the differences in the column configurations. This study proved the general usefulness of using retention time constants to predict the behaviour of new peptides other than those used to establish the scale [17].
Mant et al. investigated the effect of the chain length on the retention behaviour of peptides [21]. The authors agree with the key assumption that the amino acid composition is driving the retention process, but not for long peptides. The previous rule is valid for up to 15 amino acid residues, after which, the retention time starts to become shorter and deviates from the predicted retention times. In this study, the authors investigated the elution behaviour of four peptides (5–50 residues), which in turn resulted in extending the utility of their retention time prediction for up to 50-residue peptides. In fact, other factors must be considered when it comes to peptide separation. The neighbouring groups do contribute and could even reduce the retention behaviour of the primary amino acid. In another words, the retention coefficient of certain amino acids might change in the case of having another adjacent amino acid, and the extent of this change depends on the type of the amino acid in the close proximity. Moreover, the conformation of the peptide structure also plays a significant role in the elution process. Conformation can reduce the overall hydrophobicity in comparison to a random coiled structure, leading to the retention time being shorter, which is mainly ascribed to some amino acid surface residues being masked and not in a direct contact with the stationary phase. The preferred binding domain (will be discussed later, Section 3.9) also has a clear influence on the separation process [21].
These peptides were designed to have similar chain length but with different hydrophobic constituents. The study considered the chromatographic conditions and the retention coefficients from the Guo et al. study [9]. A correlation was obtained in this study with the penta- and decapeptides, confirming the validity of the Guo et al. model. However, this behaviour was only true for up to 10 amino acid peptides with considerable hydrophobicity, and the model does not hold true when moving to 50 amino acid residues. Some decapeptides had also deviated from Guo’s prediction model, and this was in the case of highly hydrophobic peptides. Thus, the study showed that the higher the hydrophobic character, the more likely was deviations from Guo’s model. The non-linear relationship between the predicted retention time and the observed one was confirmed in this study using three columns with different alkyl chains: SynChropak C4, 6.5 µm, 4.1 × 250 mm, Aquapore C8 7 µm, 4.6 × 220 mm, and SynChropak C18, 6.5 µm, 4.6 × 250 mm, all with a 300 Å pore size. The phenomenon was confirmed by plotting the observed retention time versus the number of amino acid residues (N) or versus ln N, and in both cases, a linear relationship was attained with various slopes depending on the hydrophobicity of each peptide under investigation [21]. The core problem that arose in this work is even if linearization is achievable with respect to the chain length, the hydrophobicity of the various resides will cause correlation divergence, depending on the hydrophobicity extent. A correlation between the discrepancy between the predicted and observed retention times with the chain length and the hydrophobicity was drawn using the linear least-squares fitting and showed a high correlation of almost r = 1.00 for the C18 column and r = 0.99 for the other C4 and C8 columns. These data reemphasised the importance of considering both the chain length as well as hydrophobicity. Excluding the latter from the final equation resulted in a non-linear relationship. With respect to the stationary phase, the alkyl chain length of the stationary phase has almost no influence on the separation process of the peptide molecules, which was previously noted by Meek and Rossetti [10] and Guo et al. [9].
Based on the above findings, a modification to Guo’s predicting equation was proposed by incorporating a correction factor to account for the chain length as well as the hydrophobicity, hence enhancing the prediction capability of the model:
where the first part is the same as in Equation (1), and the second part is a correction based on the sum of the retention coefficients for all amino acid residues and the termini (), the number of times that amino acid repeats on the peptide sequence (), the slope (), and the intercept () of a linear model.
Using the above equation, the prediction accuracy was enhanced with a difference between the predicted and observed retention time of not more than 1.9 min on average, with a high correlation as well (r = 0.99) [21]. It is worth highlighting that using molecular weight instead of the chain length with hydrophobicity did not exhibit a high correlation [21].
In 1989, Mant et al. extended their findings to large proteins of up to 300 amino acids [22]. The authors examined 23 proteins with a known sequence using RP-HPLC and employed columns with different hydrophobicities and ligand densities. They concluded that their model from their previous study [21] is also valid for large proteins; however, an understanding of the three-dimensional structures of proteins upon interacting with the stationary phase is important for a better accuracy.
Chabanet and Yvon predicted of the retention time of the peptides based on the relative hydrophobicity contribution of each amino acid [23]. However, as this prediction may overestimate the retention time of longer peptides of 15 residues and more, they proposed considering the contribution of each amino acid as a decreasing function of the peptide length. The study used 104 peptides with a non-linear multiple regression analysis. The main assumption in this study is that the amino acid residues in large peptides may be less accessible to adsorption on the stationary phase, so some amino acid residues are analysed as being “hidden”, which means their contribution is less [23]. Mobile phase A was 0.11% aqueous TFA and mobile phase B was 0.1% TFA in acetonitrile, with a Waters µBondapak C18, 10 µm, 4.6 × 250 mm column. In this study, the retention time was expressed as the percentage of acetonitrile at the elution point, which is calculated by multiplying the peak retention time (subtracted from the gradient elapsed time) by the percentage of acetonitrile in the gradient program.
For short peptides, the following linear model was adopted for predicting peptides retention times:
where is the number of times amino acid j in the peptide , is the retention coefficient of the amino acid j, is the retention coefficient for both N- and C-termini, and is the independent error.
The authors tried to simulate the decrease in the retention time as a result of chain length. Thus, they suggested a new model that considers the contribution of each amino acid residue (Ai) to the retention time as a decreasing function of peptide length (li). It was assumed that the slope equals zero when li = 0.
Here, the contribution of each amino acid () is calculated using and .
In small peptides, the contribution of each residue () is very close to the retention coefficient of each residue (aj), while in the long peptides, this contribution () is proportional to aj (), and represents the curve’s slope. Based on this model, they considered two scenarios or sub-models: (i) considering the chain length will have an effect irrelative to the amino acid composition, and thus, and would be similar for all residues; and (ii) taking each amino acid residue into consideration when applying the decreasing function. To make the evaluation process easier, and to decrease the number of parameters that need to be estimated, the authors have classified the amino acids under various groups: non-polar (Gly, Ala, Val, Met, Ile, Leu, Phe, Trp), polar (Asp, Asn, Thr, Ser, Glu, Gln, Pro, Tyr, His), and charged residues (Lys and Arg). Then, the same kj was assigned for all residues of the same group. Consequently, the residues of the same group would have an identical accessible surface area, hence the same decreasing effect (). The following equations would be generated:
Model 1—all residues:
Model 2—non polar residues:
Model 3—polar residues:
Model 4—charged residues:
A total of 104 peptides with various chain lengths were investigated, and the retention time prediction was estimated using the forementioned models [23].
Based on Guo et al., Equation (1) [9], the decrease in the retention time as a function of chain length was simulated in a way that makes it applicable even for short peptides [23]. Using peptides of different lengths helped in having accurate data for each amino acid. As discussed earlier, some long chains could result in decreasing the accessibility to certain residues, leading to an unexpected elution pattern (earlier than expected). Thus, the retention time coefficients for each amino acid were determined using the linear model and utilizing short peptides; 67 (decapeptides) or 55 (heptapeptides). The correlation was higher in the case of heptapeptides. This work confirms the effect of the chain length on the retention time, which also reaffirms the findings of Mant et al. [21]. For long peptides, the new Models 1 and 2, which considered the chain length effects, were used. It should be noted that using Model 2 for some cases, the authors had to pre-set some values in advance to overcome some difficulties in obtaining all the required parameters. Specifically, they set the parameters for the charged amino acid, as they were only two residues (Arg and Lys), in addition, their retention coefficients were small [23]. These authors also determined the retention times for 19 amino acids using the small peptides (seven residues and fewer) and applying the linear model (Table 4) [23].
Table 4.
Retention time coefficients for amino acids and termini using linear and modified models [23].
The estimated retention coefficients using either Model 1 or 2 correlated well with those obtained from the linear model. Where the difference with respect to the linear model were observed, these were less in the case of Model 2 than Model 1. The correlation between the predicted and the observed retention times in both Models 1 and 2 were r = 0.98 and 0.99, respectively [23].
Using Model 1, the retention times were underestimated for peptides in the range of 4 to 10 amino acids and for those of more than 20 amino acids. Furthermore, they were overestimated for the very short peptides of less than 3 amino acids as well as those in the range of 10 to 20 amino acids. Overall, the results obtained from Model 2 were more satisfactory than those from Model 1. The authors pointed out that having only three groups to classify the amino acids with may not be sufficient; in addition, the distribution of the amino acids might not be performed accurately [23]. The effect of polar residues on the peptide retention time decreased dramatically as the chain length increased. For example, the effect of polar residues is more pronounced in dipeptides than pentapeptides. Thus, the predicted retention time as a result of polar residues in peptides up to seven residues is usually lower than observed. As a result, peptides that were predicted based on the linear model reported underestimated retention times, unless there are more than three residues [23]. The authors proposed that this phenomenon is due to the development of secondary structure in solution, and this topic would be discussed later in this review [24]. The estimated retention constants were compared with other studies of similar chromatographic conditions. Satisfactory correlations were obtained, for example, comparing the data from this study with that of Sasagawa et al. [25], giving a correlation of r = 0.93 and 0.94 for Model 1 and 2, respectively.
For Model 1, the effect of chain length on the predicted retention times was related to the nature of each amino acid. Hence, it is expected that some conformational constraints would mask some interactions between certain residues and the stationary phase, thus decreasing the lability of certain residues to adsorb on the stationary phase [23].
To assess the accuracy of the developed models the authors challenged them using 47 new peptides, which were not used in the original retention coefficient estimation work. The same chromatographic conditions used for estimating the retention coefficients were adopted. The selected peptides comprised chain lengths from 2 to 58 amino acids. A satisfactory correlation of r = 0.97 was obtained. Some peptides with a negative predicted retention coefficient showed a zero actual retention time [23]. The authors also applied their models to other group’s work, in which the chromatographic conditions are different. A quite good correlation of r = 0.93 was obtained. They predicted the retention time for 71 peptides out of 100 peptides tested by Sasagawa and co-workers [25]. The other 29 peptides were not checked as they have some amino acid residues whose their retention coefficients were not determined in this study [23].
The discrepancies did exist, which could be attributed to effects such as neighbouring amino acid effects or certain sequence-specific conformations. However, the model did show a good overall predicting capability [23].
3.5. Alpha-Amino Group
In 1993, Hodges and co-workers studied the effect of the α-amino group on the retention time of peptides, in addition, they determined the pKa for the α-amino groups in 19 peptides [26]. They considered two peptide analogues, acetylated and non-acetylated N-terminal, where the latter represents the α-amino group. The idea of the study was to compare the retention times of the two analogues with that of a Gly-containing analogue. Studies of simple organic molecules presented that the effect of the substituents next to the ionizable terminal groups (end groups) could affect the dissociation constants of those groups. Nevertheless, this study confirmed the difference in hydrophobicity between the presence or absence of the α-amino groups at the N-terminus. This effect was also proved to be sequence dependent. Increasing the pH led an increase in the retention time in the case of non-acetylated analogues as a result of amino group deprotonation, which resulted in a neutral charge and hence more retention. In this study, the 20 proteinogenic amino acids were investigated using the following analogues [26]:
1st analogue: Ac-X-Leu-Gly-Ala-Lys-Gly-Ala-Gly-Val-Gly-Amide.
2nd analogue: H-X-Leu-Gly-Ala-Lys-Gly-Ala-Gly-Val-Gly-Amide.
Core peptide: Ac-Leu-Gly-Ala-Lys-Gly-Ala-Gly-Val-Gly-Amide.
The rationale for the core peptide compositions investigated is to represent an ideal model peptide which lacks structural factors which are known to contribute to deviations from the expected retention behaviour, for example, the presence of an amphipathic helix with preferred site of binding [24]. A decapeptide chain length was chosen because it is the most common average length for peptides following proteolytic digest, and also to avoid any effects from the chain length as previously reported by Mant et al. [21]. The hydrophobicity of the amino acids that compose the core peptide sequence would cause the peptide to be eluted at around 15–40% of acetonitrile, where the optimum resolution could be achieved. The presence of the Lys residue is to confer good solubility to the peptide [26]. The two model peptides (acetylated versus non-acetylated) with the same amino acid substitution were separated using HPLC over a pH range from 2 to 6.8. pH had little effect on the majority of the acetylated analogues. Anomalous behaviour was observed in the case of Leu residue in which, as the pH increased from 2 to 6, a decrease in the retention time of the acetylated analogue was observed, whereas an increase in the retention time was observed with the non-acetylated analogue which is ascribed to the deprotonation of the N-terminal. The increase in the pH also led to an inversion of the elution order of the Leu and Ile residues [26].
Interestingly, the deprotonation explanation was not the case with all analogues. Furthermore, the α-amino group in the non-acetylated analogue not only influenced the hydrophobicity, but it was also sequence dependent. Five peptide analogues were investigated (acetylated and non-acetylated) on a C18/C2, 5 µm, 4 × 250 mm column at pH 2. The effect was mainly shifts to the shorter retention time of the non-acetylated analogues as a result of the positive charge that was developed on the N-terminus. Nevertheless, it cannot be concluded that the effect of α-amino group is to decrease the retention time as despite the decreased retention times, the elution pattern had also changed. For example, some acetylated analogues were baseline resolved; however, this was not the case with the non-acetylated analogues, in which a coeluted elution profile was obtained instead. Some non-acetylated analogues were well resolved at pH 2 but coeluted at pH 6.8, and the opposite is true for other analogues as well. So, each analogue has shown a distinct elution profile, and this suggests that besides affecting the hydrophobicity of the non-acetylated analogues, the α-amino group is also sequence dependent with respect to the amino acid residue at the N-terminal [26].
In order to quantify the effect of α-amino group, pairs of acetylated and non-acetylated peptides were chromatographed using polystyrene-based columns (PLRP-S, 5 µm, 4.6 × 250 mm) to allow the use of high pH elutions (where silica-based columns have silanol activity concerns and they could be negated at high pHs) and determining the pKa values of the α-amino group and the basic sidechains simultaneously [26]. The researchers proposed several equations to quantify factors that are believed to affect the elution process of peptides:
To determine the effect of α-amino group:
To determine the hydrophobicity in the absence of α-amino group.
tR H−X − tR Ac−Gly represents a combination of both effects (α-amino group (a) and the hydrophobicity of the sidechain of the N-terminal in the presence of α-amino group (h)), then:
To determine the effect of α-amino group (a) and the hydrophobicity of the sidechain of N-terminal in the presence of α-amino group
To determine the effect of the α-amino group on the hydrophobicity
It is to be noted that the obtained results were comparable to those obtained by Guo et al. [9]. If the α-amino group has no effect on the hydrophobicity of the peptide, this would result in zero value of the s, which was not the case. Plus, the difference in the retention time between the acetylated and non-acetylated analogues was not the same among various analogues [26].
Interestingly, plotting the difference in the retention time between the acetylated and non-acetylated analogues versus the pH over the range from 2–9, helped determine the pKa of the α-amino group. Polystyrene-based columns are the best choice for a high-pH mobile phase, whereas silica-based columns might decompose. The authors determined the pKa of the α-amino group by plotting the difference in the retention time between the acetylated and non-acetylated analogues [tR H−X − tR Ac−X] versus the pH from 2 to 9. The obtained pKa values were higher than in the case of free amino acids, and this is in line with the fact the acidic amino acids have higher pKa in proteins than in free state (Table 5). Furthermore, it was reported that the hydrophobic environment could also affect the dissociation of the ionizable groups [27]. Increasing the percentage of the organic solvent has led to a decrease in the dissociation of the α-carboxyl group of Gly (increase in the pKa from 2.35 to 3.96), and increase dissociation of α-amino group (decrease in the pKa from 9.78 to 7.42) [27].
Table 5.
pKa values for various α-amino group of peptide analogues, 19 N-terminus amino acids [26].
Interestingly, the plot of each amino acid resembled a titration curve, and for each amino acid it was different and unique. This suggests that the deprotonation of the α-amino group varies based on the substituted amino acid at the N-terminus [26].
The authors were also able to establish the pKa of the ionizable sidechain (with the absence of α-amino group effect) by plotting the difference in the retention time between the acetylated analogues and acetylated core peptide over the same pH range of 2–9. The study showed that the pKa of the sidechain of the acidic amino acid is significantly higher whilst part of a protein than in its free state (Table 6). The opposite was observed with the amino acids of a basic sidechain. Nevertheless, the values obtained in this study are similar to those in protein [26].
Table 6.
pKa values for sidechain of peptide analogues (absence of α-amino group effect) [26].
These findings suggest that the stationary phase could mimic the hydrophobic environment as found in the proteins, provided that these pKa values were comparable to those reported for proteins [26].
3.6. Sidechain Amino Acid in the Absence of Nearest Neighbour Effect
Kovacs et al. [29] have studied the sidechain hydrophobicity of 20 proteinogenic amino acids as well as norleucine, norvaline, and ornithine as non-proteinogenic amino acids in the absence of the nearest neighbour group effect. The following decapeptide was considered: Ac−X−Gly−Ala−Lys−Gly−Ala−Gly−Val−Gly−Leu−amide. It is noticeable that X position has Gly as a nearest neighbour group. Gly has only H as sidechain, which is known not to have any steric effect. This ensures the unrestricted rotation around the peptide (amide) bond from either side between the substitution site and the residue next to it. To demonstrate the free rotation, all the 23 amino acids were substituted in their L and D isomers, while the adjacent amino acid is the Gly. Having an unrestricted rotation means that both diastereomers should elute at the same retention time. Taking into account that the overall composition of the two peptides is identical, whether the adjacent amino acid is Gly or Leu (Table 7) [29].
Table 7.
Comparison between the retention times of (L and D)-peptides, absence of the nearest group effect (Ac−XGAKGAGVGL−amide) [29].
When the adjacent residue is Leu, well-resolved diastereomers were obtained at pH 2. On the other hand, when the Gly was the adjacent residue, these diastereomers were inseparable. However, the gradient was very shallow (0.25% ACN). The exception was for two amino acids out of 23 (Asp and Trp). Using a more standard gradient condition (1% ACN), even these two pairs were not separable anymore. The N-terminal was acetylated, and the C-terminal was amidated, to eliminate any potential effect from the charges that might develop during various pH environments [29]. Having proven the above concept, the L- amino acid peptides were investigated using six mobile phases with various pH values: 2, 5 and 7. Different ion-pairing reagents were also considered as well as the presence and the absence of different salts: 20 mM H3PO4 or 20 mM TFA at pH 2; 10 mM PO4 buffer at pH 5; and 10 mM PO4 buffer at pH 7, containing no salt, containing 50 mM NaCl, or containing 50 mM NaClO4 (Table 8). The following columns were used: for mobile phase of pH 2: Kromasil C18, 5 µm, 2.1 × 150 mm; for that of pH 5 and 7: Zorbax Eclipse XDB-C8, 5 µm, 2.1 × 150 mm [29].
Table 8.
Peptide retention times in various mobile phases (absence of the nearest group effect) [29].
The results confirmed that the hydrophobicity is independent of the mobile phase’s pH, buffer conditions, and alkyl chain length in the stationary phase for 17 amino acid residues. Conversely, for the potentially charged residues (His, Asp, Glu, Arg, Lys, Orn), the pH was proven to play a crucial role in the hydrophobicity coefficients of those residues (Table 8) [29].
Peptides are generally highly retained in case of the hydrophobic TFA than the hydrophilic H3PO4. At pH 5 and 7 without added salt, the retention times of all peptides have decreased except for Orn, Lys, His, and Arg. This effect is ascribed to the deprotonation of their sidechain, resulting in a neutral charge and enhancing their hydrophobic character and hence their retention. It should be noted that the pKa of the highly basic residues are decreased in the hydrophobic environment such as protein or RP stationary phase. Adding 0.05 M of NClO4 to the mobile phase of pH 7 increased the retention time of the peptides more than when the NaCl was added [29].
Comparing the retention times of the 19 amino acids, except the positively charged ones, in TFA versus in H3PO4, there was a high correlation of r = 0.999. This reflects that the relative hydrophobicity is not affected by the type of ion pair, considering that TFA can make ions pair with the Lys residue, leading to a longer retention time. As for the positively charged amino acids Orn, Lys, His, and Arg, their hydrophobicity indexes have increased in the TFA-containing mobile phase in comparison with the H3PO4 one. Comparing the retention time of the 17 amino acids with neutral sidechains in mobile phase of pH 2 and 7 with no added salt, a good correlation of r = 0.999 was obtained, reflecting the independence of the hydrophobicity on the pH. On the other hand, the hydrophobicity indexes of the positively charged amino acids have increased as a result of their deprotonation, and their positive charge has diminished. For the negatively charged amino acids Asp and Glu, at pH 7, their hydrophobicities have decreased due to the deprotonation effect and developing of the negative charge, the same happened at pH 5. The elution profile for the amino acids with neutral sidechain was similar either in pH 2 (H3PO4) or pH 7 with no added salt. The major changes in hydrophobicity were noticed with the charged amino acids, in which higher hydrophobicity was observed with peptides having residues Orn, His, Lys, and Arg as the pH was raised from 2 to 7. On the contrary, a decrease was observed with the Asp- and Glu-containing peptides [29].
Comparing pH 7 with 5 in the absence of added salt, a good correlation of r = 0.999 was obtained, with the exception of Orn, His, Lys, and Arg. The non-linear relationship of the charged residues could be ascribed to the deprotonation effect of these residues, leading to a longer retention time. As for Asp and Glu, they were both deprotonated and held a negative charge at both investigated pHs [29].
The effectiveness of Cl− vs. ClO4− was evaluated at pH 7. The comparison between the mobile phases with and without Cl−, showed a good correlation (r = 0.998) for all 23 amino acids. Also included were the positively charged residues, but with little effect so far. This reflects the ineffectiveness of the Cl− ion as an ion-pairing reagent. On the other hand, ClO4− affected the positively (except His) and negatively charged residues, reflecting the effectiveness of this ion-pairing reagent. All the neutral residues (in addition to the charged His) showed a high correlation of r = 0.999. The positively charged residues Orn, Lys, and Arg were eluted at a longer retention time due to the ion-pairing effect. As for His, it is deprotonated at pH 7, so it became neutral and thus behaved such that it showed no response to the addition of NaClO4. The poor correlation with Asp and Glu could be ascribed to the decreased ion-paring capability of ClO4− with the positively charged residues, as indicated by the net charge on the peptide of zero [29].
The retention time difference between the X-substituted peptides (22 amino acids other than Gly) and the Gly-substituted peptide represents the hydrophobicity of the sidechain in the absence of the nearest group effect (Table 9) [29].
Table 9.
Hydrophobicity coefficients in five different mobile phases (absence of the nearest group effect) [29].
It was observed that the norVal is more hydrophobic than Pro, despite both of them having the same number of carbon atoms. This behaviour is ascribed to the fact that the cyclisation in case of Pro makes it less exposed to the stationary phase, thus meaning less retention and less hydrophobicity. Comparing the hydrophobicity between Ala, Val, Ile, norVal, norLeu, and Gly showed that the greater the distance between the added carbon and the peptide backbone will result in higher hydrophobicity. It can be noted that in case of Ala, the methyl group is at the β-carbon, whereas in case of Ile, it is at the 𝛿-carbon, and in norLeu, it is the at ɛ-carbon. Interestingly, the addition of a methyl group at β-carbon resulted in increased hydrophobicity, like in the case of Gly to Ala or Ser to Thr. However, the increase was more pronounced in the former than the latter. This is ascribed to the fact that the OH is also attached to the β-carbon which shields the methyl group from interacting with the stationary phase, hence decreasing its hydrophobicity expression [29].
All uncharged amino acids in all mobile phases showed a good correlation of r = 0.997, where the retention time difference (with Gly) in various mobile phases was plotted. This highlights the independence of those residues on the pH, nor the ion pair composition of the mobile phase. Ionizable residues showed higher hydrophobicity at pH 2, due to the protonation of their sidechain, and hydrophobicity in TFA was higher than in the H3PO4 mobile phase [29]. At pH 5 and 7, the Asp and Glu are considered hydrophilic due to the deprotonation of their sidechain, leading to the development of a negative charge; it was also noticed that their hydrophilicity increases even more in the presence of ClO4− [29]. Plotting the retention time of peptides versus the net charge (considering the Lys that is already included in all peptides), showed that the increased hydrophobicity is ascribed to the ion-pairing effect of the ClO4−. On the other hand, the ineffectiveness of Cl− was clear from the independence of the retention behaviour in this mobile phase on the net charge [29].
For charged amino acids, the pKa is important, as is their protonated or deprotonated state. In addition, the concentration of the HPO43− is also important as it can efficiently neutralize the positively charged sidechains in the peptide [29].
3.7. Sidechain Amino Acid That Restricts Conformation (Presence of Nearest Neighbour Effect)
Kovacs et al. quantified the effect of the nearest group effect (i to i + 1) using RP-HPLC [30]. They noticed that no nearest group effect is observed to i (any amino acid) when i + 1 is Gly [29]. However, after replacing the Gly with a bulky and hydrophobic amino acid such as Leu, a pronounced effect started to show depending on the nature of i amino acid. They calculated the minimum energy conformations for certain peptides with L and D amino acid next to L-Leu and proved that the most energetically favourable configuration is dependent on its orientation with respect to the Leu. Consequently, this translates in the way they will be interacting with the stationary phase [30]. The authors believe that the restriction of conformational space of the protein could start from the backbone of the polypeptide itself, depending on the type of amino acids in close proximity to each other [30].
3.7.1. Rationale of Selecting the Model Peptide
The following model peptide was considered: Ac-X-Leu-Gly-Ala-Lys-Gly-Ala-Gly-Val-Gly-amide, where X is substituted by the 19 L and D- amino acids. The presence of the Gly residues suppresses any secondary structure formation. In order to eliminate the potential effect of any possible positive charge at the α-amino group or negative charge at the C-terminus, both termini were acetylated and amidated, respectively. One Lys residue was incorporated into the structure to enhance the solubility over a wide pH range. Four hydrophobic residues were included to ensure satisfactory retention, and they were distributed in a way that guaranteed no hydrophobic interactions among them and, hence, no preferred domain of interaction which could alter important interactions. To supress any effect due to chain length, a decapeptide length was considered [21,23]. Leu was considered as a bulky, hydrophobic, and neutral amino acid, thus eliminating any interactions due to charges, and also any polar interactions such as H bonding [30].
The X-amino acid is placed at the N-terminal to study the effect of being next to only one Leu residue; in addition, the Gly was placed at position 3, to avoid any other nearest-group interactions with the Leu from the other side, provided that Gly has no effect, as shown previously (Table 7) [29]. It is to be noted that such a neighbour effect is considered as a peptide-based approach that can be used to evaluate the protein folding as well as stability [30].
3.7.2. Nearest Neighbour Effect on the Elution of L and D Diastereomers
In the previous study (Table 7) [29], the same researchers studied the L and D amino acids at the N-terminal position, where the Gly adjoined. The study stated that the coelution of both diastereomers reflects a completed freedom of rotation about the peptide bond between the L-/D-amino acid and the Gly residue. Meaning therefore that the Gly has no nearest group effect. Therefore, any variation in the retention behaviour in this study would definitely be ascribed to the substituted amino acid being next to the bulky Leu residue [30]. The study considered five different mobile phases (the same as in their previous study (Table 7), except the pH 5 mobile phase) [29]; a shallow gradient (0.25%) was considered to magnify any difference between the L-/D-peptide diastereomers. The same columns as in the previous study were considered [29]. A model peptide was tested using the 20 proteinogenic amino acids under these conditions. Unlike the previous study (Table 7) [29], it is noticeable that the presence of the bulky Leu group next to the substitution site led to significant separation of L and D diastereomers (Table 10) [30].
Table 10.
Retention times in mobile phases (presence of nearest neighbour effect) [30].
The retention times of the peptides in various mobile phases was compared by the mean of subtraction to estimate any effect due to the mobile phase [30]. At pH 2, the negatively charged counter ion of the TFA and/or H3PO4 would form an ion with the positively charged amino acids. The study showed that because TFA is more hydrophobic, it enhanced the retention of the peptides more than the H3PO4, which is more hydrophilic. The increase was significant in those with a positive charge at pH 2 Lys, His, and Arg. It is worth noting that this higher hydrophobicity effect of TFA over H3PO4 was only pronounced with the charged amino acids and became almost the same in the case of neutral amino acids. However, in the selected model peptide, there would be little effect due to the presence of Lys residue, which is positively charged at pH 2 and it will interact with counter ion. Thus, little increase in the retention time was also observed, especially, when using a TFA-containing mobile phase [30].
At pH 7, the positively charged amino acids were not affected as they were deprotonated at that pH. The negatively charged amino acids Asp and Glu, became deprotonated and exhibited a negative charge. NaCl as an added salt in the mobile phase did not affect the retention, as the Cl− is ineffective as an ion-pairing reagent. On the other hand, NClO4 had a dramatic effect on increasing the retention times of all the amino acids except the Asp and Glu. The lesser effect on Glu and Asp might be ascribed to the ineffective ion-pairing capability of ClO4− in the presence of negatively charged residues. Almost the same enhancement that was observed earlier in the case of TFA with respect to H3PO4 was observed. Here, the retention times of the positively charged amino acids containing peptides His, Arg, and Lys increased in comparison to the other 17 amino acids [30].
In conclusion, the presence of the hydrophobic TFA (pH 2) and the NClO4− (pH 7) increased the retention times of the peptides with positively charged amino acids, compared to the other peptides with other residues. These observations were ascribed to the higher hydrophobicity of TFA over H3PO4 and the higher pairing efficacy of the NClO4− over the Cl−, respectively. Away from the charged amino acids, the effect of the added salt, decreased with decreasing the hydrophobicity of the substituted residue [30].
3.7.3. Evaluating the Nearest Neighbour Effect
The difference in the retention times between the L-/D- diastereomers was almost negligible, which means that the nearest group effect is independent of the mobile phase composition or pH. Some differences were observed in the case of Asp, Glu, and His among the various mobile phases (Table 11). In this study, the difference in the retention times is ascribed to the different hydrophobicity of the individual amino acid as well as its final configuration when it is adjacent to the bulky Leu [30].
Table 11.
Retention times differences in mobile phases (presence of nearest neighbour effect) [30].
Using computational analysis, the authors speculated that the most favourable energetic conformation is dependent on the orientation of the substituted amino acid with respect to the adjacent Leu residue. For example, substituting a large hydrophobic residue D-Leu next to the L-Leu, showed a difference in the retention time of 6.7 min. This high hydrophobicity reflects that the most favourable energetic configuration of the D-Leu is that when it is interacting with the hydrophobic stationary phase more than the L-Leu. Indeed, it seems that in the D-configuration, both bulky groups are being directed to the one side of the molecule and hence facilitating their interaction with the stationary face. As for the L-Leu, the opposite scenario is more likely to drive the separation process [30]. The same explanation could also be adopted for the polar and charged residues. For example, the most favourable configuration of D-Lys was when adjacent to L-Leu and would bring the positive charge in close proximity to the stationary phase more than the L-Lys, which means that the D-Lys diastereomer will be eluted faster than the L-Lys diastereomer (represented by negative value of tR D-L) (Table 11). In this case, the L-Lys is more hydrophobic than the D-Lys [30].
Interestingly, the hydrophilic character for D-Ser was predominant in all mobile phases (ΔtR D-L = −1.6, −1.4, −1.5, −1.4, and −1.3) (Table 11), which could be ascribed to having the polar hydroxyl group directed towards the stationary phase in the D-Ser diastereomer than in the L-Ser. On the other hand, as for the Thr residue, the hydrophobic character was predominant in all mobile phases in the D-Thr diastereomer than the L-Thr (ΔtR D-L = 1.3, 1.4, 1.4, 1.3, and 1.5) (Table 11). The reason could be the masking effect of the hydroxyl group on β-carbon by the methyl group on the same carbon, which led to a favoured hydrophobic interaction with the stationary phase. In addition, in the L-Ser, the methyl group of the acetyl at the N-terminal is at the same side of the sidechain at the adjacent L-Leu, leading to more preferred interaction with the stationary phase. Thus, it will be eluted later than the D-Ser diastereomer. In contrast, in the D-Ser, the polar hydroxyl group is directed on the same side with the sidechain of the adjacent L-Leu, leading to less affinity to interact with the stationary phase, and hence, it will be eluted faster. As Trp is highly hydrophobic, it is expected that the retention time of Trp-containing peptides would be high: at pH 2, 20 mM H3PO4, they were 66.5 and 69.9 for L- and D-Trp, respectively (Table 10). Unexpectedly, the nearest neighbour effect in the case of the highly hydrophobic Trp residue was close to the moderately hydrophobic Ala residue: at pH 2, 20 mM H3PO4, ΔtR D-L = 3.4 and ΔtR D-L = 2.9, respectively (Table 11). It was confirmed that the conformational structure of D-Trp, which is adjacent to the L-Leu, did have an interaction with the nonpolar surface with respect to L-Trp, but the difference is not significant enough for such a hydrophobic amino acid. The explanation could be ascribed to the overall hydrophobicity of Trp-containing peptides with either the enantiomers (L or D). Thus, the interaction with the stationary phase is mainly governed by the hydrophobic component. Furthermore, it was computationally predicted that the ring of D-Trp is directing towards the stationary phase and masking the full interaction with the stationary phase that takes place normally via H-bonding [30]. Generally, the hydrophobic environment enhances the hydrophilic character of the polar sidechain. Given that D-Tyr conformation is directed towards the stationary phase when it is adjacent to the bulky Leu, this would likely increase the hydrophilicity of the OH with respect to the L-Tyr, leading to an overall lower hydrophobicity of the D-Tyr and to it being eluted earlier (ΔtR D-L = −1.0) at pH 2/H3PO4 (Table 11) [30].
Examining the ΔtR D-L for these 20 amino acids in five mobile phases at pH 2 (H3PO4) versus the TFA mobile phases, and at pH 7 (in the absence of the salt versus the presence of 50 mM NaCl or 50 mM NaClO4), the effect of nearest neighbour effect proved to be independent of the relative hydrophobicities of the counter ions in the mobile phase (TFA versus H3PO4). So, for the mobile phases of pH 2, a satisfactory correlation of r = 0.997 was obtained. The same observation was noticed with the mobile phases at pH 7, where the correlation was r = 0.995, which confirmed the independence of the nearest neighbour effect on the effectiveness of the anion of the added salt (Cl− vs. ClO4−). It is worth mentioning that some anomalous behaviour in the His residue was observed in case of the mobile phase with the added NaCl [30]. A good linear correlation of r = 0.972 was obtained between the observed retention times (nearest neighbour effect, ΔtR D-L) and the sidechain hydrophobicity of D-substituted peptides (ΔtR Gly). As the hydrophobicity of the sidechain increased, the effect of the neighbour group also increased. Additionally, a good correlation of r = 0.999 was obtained with three amino acids Trp, Tyr, and His, whereas a smaller nearest neighbour effect was observed [30].
3.7.4. Retention Coefficients Determination
The determination of the sidechain hydrophobicity was performed by comparing the retention times of the X-substituted (L and D) diastereomers with that of the Gly-substituted peptide (Table 12).
Table 12.
Retention coefficients of amino acids [30].
Hydrophobicity for the mobile phases pH 2/H3PO4 and pH 7/NClO4 showed a good correlation: r = 0.994 and 0.997, respectively. Only the charged residues deviated as a result of adopting different charges at different pHs. Nevertheless, the behaviour of the neutral residues proved the independence of the retention coefficients on either pH or the type of the anionic counter ion (PO43− vs. ClO4−) [30]. Comparing two mobile phases at pH 2 with different counter ions (H3PO4 versus TFA) showed a good correlation for all the included amino acids in the study: r = 0.982 and 0.976, respectively. This means that the sidechain hydrophobicity coefficient is independent of the counter ion in the mobile phase. A good correlation was noted for all amino acids when comparing the three mobile phases at pH 7: no added salt, with added NaCl, or with added NClO4; r = 0.977, 0.972, and 0.979, respectively [30].
In conclusion, the study confirmed that the sidechain coefficient is independent on either the absence or presence of the anion, or even its nature. Furthermore, it is independent of having the ineffective Cl− or the effective NClO4− as ion-pairing reagents in the mobile phase [30].
3.8. N and C Termini Position
Tripet et al. [31] studied the hydrophilicity/hydrophobicity when substituting 20 amino acids at the N and C-termini. The following models were considered: Nα-acetyl-X- and Nα-amino-X- at the N-terminus and –X-Cα-carboxyl and –X-Cα-amide at the C-terminus. The retention time coefficients were determined for each amino acid at these positions, and these were also compared with the sidechain coefficients and the internal coefficients determined at the centre of the peptide chain. Thus, the accuracy of retention times prediction would be enhanced (Figure 1).

Figure 1.
Schematic representation of the three different positions of an amino acid in a peptide chain. Created with Biorender.com.
A TFA-containing mobile phase was considered in this study: mobile phase A: 20 mM TFA in water (containing 2% v/v of ACN); mobile phase B: 0.2% TFA in ACN. Kromasil C18, 5 µm, 2.1 × 150 mm was used (Table 13).
Table 13.
Retention times of peptide models [31].
The predicted retention time (τ) was determined as follows:
where the gradient time (), the time for the gradient to reach the detector, is calculated from the summation of the dwell or gradient delay time (), the time for the gradient to reach the top of the column from the proportioning valve via the pump, solvent mixer, and injection loop, and the void volume () estimated from the elution time of an unretained peak. Thus, .
3.8.1. Rationale of Selecting the Model Peptides for Investigation
Peptides were selected not to have more than 10 residues. Furthermore, they must not have any propensity to form secondary structures which could block certain residues from interacting with the stationary phase leading to misleading results. The peptide must have an overall hydrophobicity to maintain column retention behaviour. Having Gly distributed in the peptide sequence helps in ensuring that no secondary structures will form. Gly was placed next to the substitution position to allow a free rotation around the peptide bond between the substitution position and the adjacent residue. When the substitution is at the N-terminal, the N-terminal was either acetylated or left free; the same applies when the substitution is at the C-terminal, where it was amidated or left free. This would help in demonstrating the effect of these end groups on hydrophobicity, e.g., by preparing the same peptides with different N- or C-termini. When the substitution is at the internal position, a Gly residue was placed on both sides. All the selected peptides should have at least one positive charge (at pH 2) to enhance their solution solubility [31].
The retention time coefficients were considered from Lau et al., and their work [32] was conducted using a TFA mobile phase, as it is the most common ion-pairing reagent for reverse-phase peptide separation. A low gradient (0.35%) was considered to enhance the separation among peptides and magnify the differences in the hydrophobic character [31].
3.8.2. Hydrophobicity Determination
For the sake of hydrophobicity determination, a Gly-substituted peptide was used as a reference, in which the retention time difference was recorded for the 19 proteinogenic amino acids other than the Gly (Table 14) [31].
Table 14.
Hydrophobicity of peptide models [31].
3.8.3. Comparison of the Different C-Terminal
The ΔΔtR of the obtained hydrophobicity coefficients, from Table 14, for the 20 peptides with an acid terminal versus those of the amide terminal, peptides 1 and 2, are reported in Table 15. Plotting the obtained values gave a correlation of r = 0.993, which means that the relative difference in the hydrophobicity for both acidic and amide C-terminus is almost the same regardless of what the C-terminus is (Table 15), taking into consideration that several sidechain values varied quantitatively between both termini, especially for the hydrophobic residues (Pro, Val, Met, Ile, Leu, Phe, Tyr, and Trp). On the other hand, the hydrophilic residues showed little variations, including the polar (Asp, Glu, Asn, Gln, Ser, and Thr) and the charged residues (His, Lys, and Arg) [31].
Table 15.
Hydrophobicity differences among the peptide models [31].
Residues that differ by 2.5 min or more are considered hydrophobic, including Pro, Val, Met, Ile, Leu, Phe, Tyr and Trp—shown in yellow. Residues that showed little variation are considered hydrophilic, such as the polar residues Asp, Glu, Asn, Gln, Cys, and Thr (shown in blue) and the positively charged residues His, Lys, and Arg (shown in orange), and the small hydrophobic residues are Ala and Cys (shown in grey) [31].
3.8.4. Comparison of the Different N-Terminal (Difference from 0.0 to 7.9)
The ΔΔtR of the 20 peptides with the free N-terminal were compared with those of acetylated N-terminal, peptides 3 and 4, respectively (Table 15). Plotting those values showed a high correlation r = 0.982. Thus, the relative differences in the hydrophobicity for both N-terminal situations are the same regardless of what is the N-terminus. Unsurprisingly, several sidechains showed quantitative differences. The hydrophobic residues that differ by 2 min or more are the same as those in C-terminal study. In addition to Cys, the hydrophilic residues are the same as those of C-terminal study: polar and positively charged residues. The small hydrophobic residue here is only Ala. Acetylation is one of the major post-translational modifications; thus, determining their hydrophobicity coefficients are useful for predicting the retention time of such N-terminal modified peptides [31].
3.8.5. Comparison of Terminals with the Largest Difference (from 0.0 to 16.4 min)
The ΔΔtR of the 20 peptides where the residue was placed at the C-terminus were compared with the N-terminus locations: peptides 1 and 4, respectively (Table 15). Plotting the differences resulted in a good correlation of r = 0.967, which suggests a similar relative difference in the hydrophobicity regardless of the amino acid position (N- or C-terminus). There are quantitative differences between amino acids. The hydrophobic residues that differ by 3 min or more are as follows: Ala, Cys, Pro, Val, Tyr, Met, Ile, Leu, Phe, and Trp. Meanwhile, the hydrophilic residues are the polar residues: Asp, Glu, Asn, Gln, Ser, and Thr in addition to the charged ones His, Lys, and Arg [31].
3.8.6. Relative Hydrophobicity of N- and C-Termini
This model highlighted the absence of any effects related to N- or C termini. So, comparing the Gly-substituted peptide at the N-terminal with the acetylated N-terminal, demonstrated that the acetylated analogue is more hydrophobic. This behaviour is ascribed to the fact the free N-terminal is protonated at pH 2. Depending on the concentration of the ion pairing (in this case the TFA), the hydrophobicity of the free N-terminal could be increased proportionally with the ion-pairing concentration. Consequently, the lower the concentration of TFA, the lower the hydrophobicity of the free N-terminus, and the greater the difference would be [31]. The acid C-terminal is more hydrophobic than the amide one. The reason here is the carboxyl group is fully protonated at pH 2 and thus more hydrophobic than the amide one. Any ionization that could happen to the carboxyl group (e.g., at high pH) would increase its hydrophilicity [31]. In conclusion, a single value is not possible to be assigned for any of the termini as they are basically amino acid dependent [31].
3.8.7. Comparison of the C- and N-Termini with the Internal Coefficients
When the amino acid residue is place at the centre of the chain with two Gly residues around it, this peptide, with the 20 amino acids, showed smaller hydrophobicity differences than having the amino acid at the C-terminus; see peptides 5 and 1, respectively in (Table 15). Plotting ΔΔtR of these 20 peptides resulted in good correlation (r = 0.984), which means having the same relative differences in the hydrophobicity. Several residues showed considerable differences (from 17.1 to 4.8 min) (Table 15). The only non-hydrophobic (hydrophilic) residue in this study was the Arg. Arg, when at the centre of the chain, is much more hydrophilic than when at the termini when it is always hydrophobic (Table 14). The other charged residues such as His and Lys also became more hydrophilic at the centre than at the C-terminus (Table 14). In summary, the hydrophilic amino acids showed little difference, including the charged amino acids, than the hydrophobic ones [31]. This phenomenon is less pronounced when comparing the residues at the centre of the chain with those at the N-terminus; peptides 4 and 5, respectively. The charged residues His, Lys, and Arg became more hydrophobic at the N-terminal than at the centre. Interestingly, the aromatic amino acids Tyr and Trp became more hydrophobic at the N-terminus than the centre; however, the other hydrophobic amino acids remained almost the same at both locations: Phe, Leu, Ile, Met, Val [31].
Acidic C-terminus showed the most pronounced difference when compared to internal coefficients for Amide C-terminus, free N-terminus and acetylated N-terminus. For example, Trp, when located at the N-terminus, has a retention coefficient of 27.9 min with respect to the Gly; when it was located at the centre, it dropped to 23.1 min, while it showed the maximum value when it was located at the C-terminus 40.0 min (Table 14). In summary, the value of the -Trp-COOH-substituted peptide showed a 3.4-fold higher hydrophobicity coefficient than for NH2-Trp- (Table 14) [31].
3.8.8. Retention Time Prediction
The importance of this work was demonstrated by its ability to predict the retention times for the peptides, first by considering the coefficients from the model with the largest influence based on this study (which is the peptide with an acidic C-terminus, and the substitution is at the C-terminal). The large overestimation in the predicted retention times observed resulted on insufficient weighting of the residues at the centre of the chain (Column 3, Table 16) [31].
Table 16.
Comparison of predicted and observed retention times [31].
Secondly, they performed the prediction based on the coefficients estimated from the model peptide where the substitution is at the C-terminus and considering a weighing factor of 0.5 (Table 17) [31].
Table 17.
The weighed retention coefficients of peptide 1 [31].
These results were better than the first un-weighted protocol. However, an underestimation in the predicted retention time was observed especially with the hydrophobic containing peptides of up to 19.5 min (Column #5, Table 16). This difference is ascribed to the fact that the hydrophobicity at the C-terminus is different to any other locations. Thus, the weighted coefficients must be applied to all residues except the C-terminus one. Thirdly, when using a weighing factor of 0.5 for all residues except those at the C-terminus, more concordant values, within a 0.5 min difference, were obtained (Column #7, Table 16). Fourthly, they predicted the retention times by considering the internal retention coefficients. An underestimation was observed, especially with the hydrophobic residues of up to −16.7 min (Column #9, Table 16). Again, the same reason as in the second scenario happened, it applies here (using the weighed coefficients from the C-terminus peptide and applying them to all residues including at C-terminus position). Unsurprisingly, the values were also similar to those obtained in the second scenario. Finally, they used a combination of the internal hydrophobicity coefficients and the C-terminus ones accordingly. These results proved to be the most accurate ones, where the maximum difference between the predicted and the observed retention times was less than 0.4 min for all peptides (Column #11, Table 16) [31].
It is worth mentioning that plotting the over- and/or underestimated values versus the observed retention time in the three scenarios resulted in linear relationship with high correlation. Even though there were differences, this suggests the presence of a systematic error which they were able to circumvent by introducing the weighting factor. Thus, the C-terminal coefficients are not representative to the internal values and vice versa [31].
In conclusion, the hydrophobicity coefficients of the amino acids based on their position in the chain, is of utmost importance to accurately predict the peptide retention times. Especially important are those located at the C-terminus, as they showed a dramatic difference with respect to the other positions within the chain. In fact, such an approach seems to be greatly assisting and improving the prediction capability of the chromatographic method. However, additional factors could be included to ensure the robustness of this approach [31].
3.9. Preferred Domain of Binding
Zhou and co-workers studied the effect of the preferred domain of binding of the peptide with the non-polar stationary phase during the course of HPLC work [24]. If the molecule/peptide becomes helical on binding and has a preferred domain of binding, like the case with the amphipathic helix, this would affect the overall hydrophobicity of the peptide as some residues will not be contributing/interacting like in their primary structure (Figure 2).
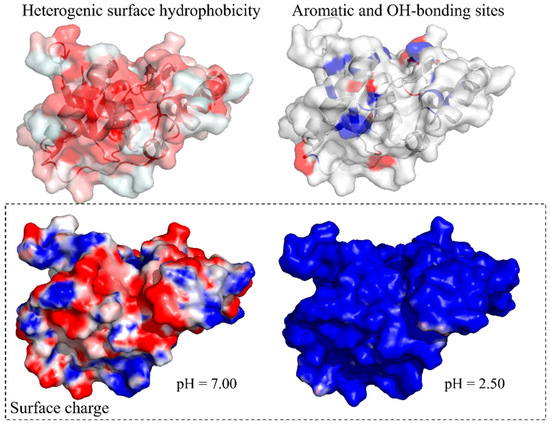
Figure 2.
Peptide surface properties. Three-dimensional structure of a hydrolysing peptide represented by its accessible surface area. (Top-left) Red-coloured areas depict higher hydrophobicity. (Top-right) Blue and red show sites where π–π interactions and OH-bonding are possible, respectively.
The following mobile phases were investigated: A: 0.1% TFA in H2O; B: 0.1% TFA in ACN. The following columns were also investigated: SynChropak C4, 6.5 µm, 4.1 × 250 mm; Aquapore C8 7 µm, 4.6 × 220 mm; SynChropak C18, 6.5 µm, 4.6 × 250 mm; all columns had 300 Å pore size [24].
Circular dichroism studies proved that both model peptides showed high propensity to form α-helical structures in the non-polar environment. Size-exclusion chromatography proved that all peptides were monomeric while they are bound to the stationary phase. Interestingly, this study confirmed the ability to predict the retention behaviour of peptides with α-helical structures and subsequently to deduce the presence of such phenomenon in any peptide based on its retention data [24].
Several factors can affect the retention time of a peptide, including: (i) amino acid composition and the relative hydrophobicity of each amino acid residue; (ii) peptide chain length, in which longer peptides may be eluted at shorter retention time due to a stabilized secondary structure which led to some amino acids being masked from interacting with the stationary phase; and finally (iii) the sequence-dependent effect, which can be divided into nearest neighbour and conformational effects. The former is amino acid dependent but independent of the conformation. The conformational effect could alter the overall hydrophobicity of the peptide as a result of adopting certain conformational structures in comparison to the same peptide when it is present in a random coil conformation (lacking a unique conformation). The aim of this study was to demonstrate the presence of a preferred domain of binding in α-helical peptides and investigate how this domain of binding can affect the behaviour of peptides with the stationary phase. Additionally, the study was trying to locate which amino acid or part of the sequence is responsible for this preferred domain of binding [24].
Zhou et al. considered two sets of peptides with the following lengths: 7, 14, 21, 28, and 35 amino acid residues. All peptides have the same amino acid constituents, albeit with different sequences [24].
Ac-Lys-Cys-Ala-Glu-Gly-Glu-Leu-[Lys-Leu-Glu-Ala-Gly-Glu-Leu]n-amide and Ac-Lys-Cys-Ala-Glu-Leu-Glu-Gly-[Lys-Leu-Glu-Ala-Leu-Glu-Gly] n-amide, where n = 1–4.
The N-terminal was acetylated, and the C-terminal was amidated to eliminate any ionic interactions as a result of different charges that might develop in different pH environments. The sequence of Cys residue in the set B peptides is similar to a protein with a known α-helical coiled-coil structure, tropomyosin. However, the Cys in this study is at the N-terminus of the adopted model, while in the original tropomyosin, it is in the internal position 190. The same chromatographic elution conditions as per the of work of Guo et al. were adopted [9].
The set B peptides showed a larger retention time than set A peptides, with the same chain length, which is ascribed to the presence of preferred domain of binding in the B set. The difference in the retention times between the two sets have increased as the chain length increased, from 2.9 min for the 14 amino acid residues and up to 7.3 for the 35 amino acid residues [24]. Several studies showed a relationship (either linear or exponential) between the molecular weight and the retention time for the peptides which bind to the stationary phase on their monomeric form [21,32].
The retention times were compared of both peptide sets A and B with another peptide included in the study, the S peptide, which has no tendency to form α-helical structure. The S peptide is a series of five peptides with the following sequences: Ac-(Gly-Leu-Gly-Ala-Lys-Gly-Ala-Gly-Val-Gly)n-amide, where n = 1–5 comprising in total 10–50 residues. Furthermore, the same positive charges were also considered in the comparison study (+1 to +5). Such a comparison would help in estimating the importance of α-helical conformation on adsorption and thus the elution process. The same molecular weight range was considered in the S peptide and the A and B sets as follows: 826–3894 and 789–3479 Da, respectively. The predicted retention time was calculated using Equation (5), developed by Mant [21], where the correction for the chain length was included in this equation, and the retention coefficients were obtained from the work of Guo et al. [9]. Equation (5) proved to be suitable in the case of S peptides as well as the peptides of set A. This agreement was exemplified by the low average deviation between the predicted and the observed retention times of 0.5 and 1.8 min, for S and set A peptides, respectively. Furthermore, a good correlation between the predicted and the observed retention times in both sets was obtained: r = 0.99. In contrast, utilizing Equation (5) to predict the retention time in case of set B peptides, which have a preferred domain of binding, resulted in high variation between the predicted and the observed retention times, i.e., around a 6 min difference in the case B peptides. To account for this phenomenon, the authors incorporated another parameter into Equation (5). They were then able to achieve better prediction for the retention times of peptides that are prone to have a preferred domain of binding with the hydrophobic stationary phase. The new term basically considers the summation of the retention coefficients of the most hydrophobic residues. If the hydrophobic residues are evenly distributed around the α-helix structure, this term would be cancelled out [24].
where Equation (5) is modified by a correction factor for the preferred domain of binding () calculated as . Here, N represents the total number of residues in the chain, and n is the number of residues in the preferred domain of binding. Parameter is the sum of retention coefficients in the preferred domain of binding (reflected by the most nonpolar residue). If there is no preferred domain of binding, then ΣRc,n = ΣRc,(n/N), and PA = 0.
To determine the preferred domain of binding, a pattern recognition exercise was conducted so the distribution of the hydrophobic amino acids could be visualized. It was observed for the set A peptides that all the hydrophobic Leu residue cannot be found in one area at one time. On the other hand, this was observed with the peptides of set B. Thus, the hydrophobicity would be higher in set B than A, and accordingly, it was also the preferred domain of binding [24].
The modified equation that takes account of the preferred domain of binding yielded decreased retention time deviations to 0.7, 0.8, and 1.8 min for S, A, and B peptides, respectively. Moreover, a good correlation between the predicted and the observed retention times was obtained (r = 0.99) with the three sets of peptides using the three columns [24].
It is worth highlighting that despite there being no preferred domain of binding in the peptides of set A, using the new equation that count for this phenomenon resulted in a small enhancement in the results compared to the original equation (from 1.8 to 0.8) min. This improvement of course simply reflects the increased number of variables of fit employed in the modified equation. The significant improvement was in the case of peptides of set B (from 6.0 to 1.8 min) [24].
It was concluded that if the hydrophobic residues are evenly distributed around the α-helical structure of the peptide, then the α-helical structure will not have an enhanced contribution to the separation process as in the case of set A peptides. On the other hand, set B showed a large difference between the observed and the predicted retention times. This difference is mainly ascribed to the difference in the distribution of the hydrophobic residues around the α-helical structure of the peptide. Again, this explains the presence of a preferred domain of binding ascribed to the amphipathic nature of the α-helical structure of the peptides of set B [24].
3.10. Denaturation
Lau et al. studied the effect of the solvents and hydrophobic surfaces used in the HPLC on the secondary and quaternary structure of selected peptides [32]. A series of peptides were synthesized to study the denaturation process during the course of the HPLC work. All peptides were separated using different columns with different alkyl loadings, pore sizes and alkyl chain lengths: Alex Ultrapore RPSC C3, 5 µm, 4.6 × 75 mm, Whatman Prtisil CCS/C8, 5 µm, 4.6 × 250 mm, and SynChropak C18, 6.5 µm, 4.1 × 250 mm. Alex and SynChropak have a 300 Å pore size, whereas the Whatman Partisil has 60 Å pores [32]. The study aimed to investigate the denaturation phenomenon, in addition to evaluating the RP columns, and to study the relationship between the retention times and the natural logarithm (ln) of the molecular weights. In general, the separation in the RP involves a linear gradient program which starts with a high percentage of the aqueous solvent, with an increasing percentage of the organic phase being programmed until the full elution is achieved. TFA is a good choice for HPLC, as silica is more stable at low pH than at high pH. Low pH can avoid the ionization of the weakly acidic silanol groups (ionising at pH 3.5 and above), thus avoiding any interactions of those groups with the basic molecules. TFA is also considered as a good stabilizer for peptides and proteins and is used to extract proteins and peptides after cleaving them from the solid supports (resins). Nevertheless, denaturation does also occur in an acidic medium, which triggered this investigational work [32].
Stationary phases usually have high loading of the alkyl chains attached, which facilitates the binding of the peptides or proteins to these hydrophobic sites. In addition, the amount of the organic solvent being used in the separation process enhances the stability of the secondary structure of the aforementioned molecules. Hence, it is highly expected that under these conditions, the denaturation of the tertiary and quaternary structure may take place (see Figure 3). This would translate into compromising the purification process, especially if the purification was designed based on the native peptide/protein conformations.

Figure 3.
Denaturation of peptides and proteins during LC separation. (Created with Biorender.com.)
It is worth highlighting that the extent of hydrophobicity is not the same for the folded and unfolded states of peptides and proteins. This behaviour is mainly ascribed to the fact that some amino acids are being buried as a result of the folding phenomenon. In summary, avoiding denaturation is of utmost importance for efficient LC separation tasks [32].
The authors studied five synthetic peptides with the following parent sequence: Ac-(Lys-Leu-Glu-Ala-Leu-Glu-Gly)n,-Lys-amide, where n = 1–5, so the peptides were: TM-8, TM-15, TM-22, TM-29, and TM-36 in length, respectively. The selection of (TM-22, TM-29, and TM-36) peptides was on the basis that they are forming a stable two-stranded α-helical coiled coils, which are stabilized by the hydrophobic interactions among the chains. High-performance size-exclusion chromatography was used to investigate the conformational structure of the peptides, including their monomeric or dimeric forms [32].
A mixture of the five peptides were analysed using three solvents: 0.1% aqueous TFA, which is the starting solvent for the RP-HPLC; 0.1% TFA in can, which represents the upper limit of the organic solvent usually used in the RP-HPLC; and 0.1 TFA in trifluoroethanol (TFE), which was chosen as it is does not interact with the α-helical-induced properties. Acetonitrile was considered based on the fact that it is suitable for the majority of the peptides, whereas methanol is for more hydrophilic peptides and propanol for the highly hydrophobic ones. Three columns were incorporated in the study: C3, C8, and C18. The first three peptides (TM-8, TM-15, and TM-22) appeared as monomers, whereas the last two TM-29 and TM-36 appeared as dimers in 0.1% TFA in water [32].
A linear relationship between the natural logarithm of the monomeric molecular weights and the retention volumes was observed for the 5 peptides in the system with the organic solvent. However, for the system with the aqueous phase, the linear relationship was only obtained when using the dimeric molecular weight for the last two peptides (TM-29 and TM-36) [32].
It was observed that the tertiary and quaternary structure of TM-29 and TM-36 peptides is being disrupted in the nonpolar solvents. Obviously, the stabilizing forces for the α-helical structure are the hydrogen bonding which are highly unstable in the presence of water. Thus, the opposite is true: as the non-polarity of the medium increases, the stability of the α-helical structure will also increase [32].
There were no differences in the separation process between the different columns with respect to the alkyl chain lengths or the carbon loading. However, the best resolution was obtained with the C18 column. Other studies noticed that for long peptides of 30–150 residues, the most important parameter is the pore size [33]. A 300 Å pore size is superior to 100 Å, whereas 80–100 Å pores delivered poor resolution and recovery. Nonetheless, for small molecules such as the peptides in this study with 8–36 residues, the pore size had little effect on the chromatographic resolution. As for the particle size, usually, the smaller the particle size, the higher the column efficiency, and the sharper the peaks would be [32].
Plotting the natural logarithm molecular weights of the five peptides (monomeric form) versus their retention times in the RP-HPLC showed a linear relationship. As shown in another study [34] and from the size-exclusion data, these two peptides form extremely stable dimers, confirming that the hydrophobic stationary phase caused the disruption in the hydrophobic interactions among the subunits of those peptides. This resulted in them being eluted as dimers, which then dissociated upon interacting with the reversed phase media causing denaturation to occur, as indicated from the linear relationship [32].
Interestingly, denaturation was also observed even with a C3-based column with low carbon loading. Though the organic mobile phase can cause denaturation, the hydrophobicity of the stationary phase also plays a major role in this process. In conclusion, if it is required to perform the separation and/or purification using only the native conformation, then the hydrophobicity of the stationary phase must be reduced. Furthermore, the solvent in the mobile phase must be a non-denaturing one [32].
4. Conclusions
As shown in this review, several research groups have tried to predict the retention behaviour of peptides. Although the exact behaviour cannot be accurately established, these efforts provide a useful insight into how a peptide would behave and interact with various chromatographic components. Many factors can affect the separation and the purification of peptides. Unlike the small molecules, peptides comprise different points of interaction with the separation components. For example, they can develop charges within their structure depending on the amino acid composition and the pH of mobile phase. Similarly, peptides can adopt various conformational structures which govern the extent of their adsorption. Therefore, their separation behaviour will vary according to the employed conditions. Given that the adsorption on RPLC columns is governed mainly by hydrophobic interactions, any difference in the hydrophobicity of peptide will alter their elution pattern accordingly. In fact, weighing factors are deemed necessary to improve the prediction capability of the models. In light of this, the position of amino acids within the peptide chain (N-, C-termini, or internal positions), as well as the neighbouring amino acid, influences the overall hydrophobicity. Having an a priori computational tool that considers all these factors would benefit the field for two reasons: firstly, to account for conformational and denaturation changes within the peptide structure and enhance the prediction capability, and secondly, to interpret the experimental findings and understand any unexpected or anomalous retention behaviour.
Author Contributions
All authors have read and agreed to the published version of the manuscript.
Funding
The APC was funded by Imperial College London.
Institutional Review Board Statement
Not applicable.
Informed Consent Statement
Not applicable.
Data Availability Statement
Not applicable.
Acknowledgments
The continuous support of Imperial College London is acknowledged. The authors would also like to thank Lucia Lombardi, Department of Chemical Engineering, for her contribution to designing some figures of the article.
Conflicts of Interest
The authors declare no conflict of interest.
References
- Al Shaer, D.; Al Musaimi, O.; Albericio, F.; de la Torre, B. 2021 FDA TIDES (Peptides and Oligonucleotides) Harvest. Pharmaceuticals 2022, 15, 222. [Google Scholar] [CrossRef] [PubMed]
- Al Musaimi, O.; Al Shaer, D.; Albericio, F.; de la Torre, B. 2020 FDA TIDES (Peptides and Oligonucleotides) Harvest. Pharmaceuticals 2021, 14, 145. [Google Scholar] [CrossRef] [PubMed]
- Merrifield, R.B. Solid Phase Peptide Synthesis. I. The Synthesis of a Tetrapeptide. J. Am. Chem. Soc. 1963, 85, 2149–2154. [Google Scholar] [CrossRef]
- Ferrazzano, L.; Catani, M.; Cavazzini, A.; Martelli, G.; Corbisiero, D.; Cantelmi, P.; Fantoni, T.; Mattellone, A.; De Luca, C.; Felletti, S.; et al. Sustainability in peptide chemistry: Current synthesis and purification technologies and future challenges. Green Chem. 2022, 24, 975–1020. [Google Scholar] [CrossRef]
- Snyder, L.R.; Kirkland, J.; Dolan, J. Introduction to Modern Liquid Chromatography, 3rd ed.; Wiley-Interscience: New York, NY, USA, 2010. [Google Scholar]
- Field, J.K.; Euerby, M.; Lau, J.; Thøgersen, H.; Petersson, P. Investigation into reversed phase chromatography peptide separation systems part I: Development of a protocol for column characterisation. J. Chromatogr. A 2019, 1603, 113–129. [Google Scholar] [CrossRef]
- Al Musaimi, O.; Valenzo, O.; Williams, D. Prediction of peptides retention behavior in reversed-phase liquid chromatography based on their hydrophobicity. J. Sep. Sci. 2022. [Google Scholar] [CrossRef]
- Al Musaimi, O.; Summers, B.; Basso, A.; De la Torre, B.; Albericio, F.; Serban, S. Combining solid phase synthesis and chromatographic purification for efficient peptide manufacture. Chim. Oggi/Chem. Today 2020, 38, 18–21. Available online: https://www.teknoscienze.com/tks_article/combining-solid-phase-synthesis-and-chromatographic-purification-for-efficient-peptide-manufacture/ (accessed on 24 December 2022).
- Guo, D.; Mant, C.; Taneja, A.; Parker, J.; Rodges, R. Prediction of peptide retention times in reversed-phase high-performance liquid chromatography I. Determination of retention coefficients of amino acid residues of model synthetic peptides. J. Chromatogr. A 1986, 359, 499–518. [Google Scholar] [CrossRef]
- Meek, J.L.; Rossetti, Z. Factors affecting retention and resolution of peptides in high-performance liquid chromatography. J. Chromatogr. A 1981, 211, 15–28. [Google Scholar] [CrossRef]
- Guo, D.; Mant, C.; Taneja, A.; Hodges, R. Prediction of peptide retention times in reversed-phase high-performance liquid chromatography II. Correlation of observed and predicted peptide retention times factors and influencing the retention times of peptides. J. Chromatogr. A 1986, 359, 519–532. [Google Scholar] [CrossRef]
- Parker, J.M.; Guo, D.; Hodges, R. New hydrophilicity scale derived from high-performance liquid chromatography peptide retention data: Correlation of predicted surface residues with antigenicity and X-ray-derived accessible sites. Biochemistry 1986, 25, 5425–5432. [Google Scholar] [CrossRef]
- Wilce, M.C.J.; Aguilar, M.; Hearn, M. High-performance liquid chromatography of amino acids, peptides and proteins: CVII. A Analysis of group retention contributions for peptides separated with a range of mobile and stationary phases by reversed-phase high-performance liquid chromatography. J. Chromatogr. A 1991, 536, 165–183. [Google Scholar] [CrossRef]
- Horváth, C.; Melander, W.; Molnár, I. Solvophobic interactions in liquid chromatography with nonpolar stationary phases. J. Chromatogr. A 1976, 125, 129–156. [Google Scholar] [CrossRef]
- Casal, V.; Martin-Alvarez, P.; Herraiz, T. Comparative prediction of the retention behaviour of small peptides in several reversed-phase high-performance liquid chromatography columns by using partial least squares and multiple linear regression. Anal. Chim. Acta 1996, 326, 77–84. [Google Scholar] [CrossRef]
- Field, J.K.; Euerby, M.; Petersson, P. Investigation into reversed phase chromatography peptide separation systems part III: Establishing a column characterisation database. J. Chromatogr. A 2020, 1622, 461093. [Google Scholar] [CrossRef]
- Wilce, M.C.; Aguilar, M.; Hearn, M. High-performance liquid chromatography of amino acids, peptides and proteins. CXXII. Application of experimentally derived retention coefficients to the prediction of peptide retention times: Studies with myohemerythrin. J. Chromatogr. 1993, 632, 11–18. [Google Scholar] [CrossRef]
- Field, J.K.; Euerby, M.; Petersson, P. Investigation into reversed phase chromatography peptide separation systems part II: An evaluation of the robustness of a protocol for column characterisation. J. Chromatogr. A 2019, 1603, 102–112. [Google Scholar] [CrossRef]
- Field, J.K.; Euerby, M.; Haselmann, K.; Petersson, P. Investigation into reversed-phase chromatography peptide separation systems Part IV: Characterisation of mobile phase selectivity differences. J. Chromatogr. A 2021, 1641, 461986. [Google Scholar] [CrossRef]
- Guo, D.C.; Mant, C.; Hodges, R. Effects of ion-pairing reagents on the prediction of peptide retention in reversed-phase high-performance liquid chromatography. J. Chromatogr. 1987, 386, 205–222. [Google Scholar] [CrossRef]
- Mant, C.T.; Burke, T.; Black, J.; Hodges, R. Effect of peptide chain length on peptide retention behaviour in reversed-phase chromatogrphy. J. Chromatogr. A 1988, 458, 193–205. [Google Scholar] [CrossRef]
- Mant, C.T.; Zhou, N.; Hodges, R. Correlation of protein retention times in reversed-phase chromatography with polypeptide chain length and hydrophobicity. J. Chromatogr. A 1989, 476, 363–375. [Google Scholar] [CrossRef] [PubMed]
- Chabanet, C.; Yvon, M. Prediction of peptide retention time in reversed-phase high-performance liquid chromatography. J. Chromatogr. A 1992, 599, 211–225. [Google Scholar] [CrossRef]
- Zhou, N.E.; Mant, C.; Hodges, R. Effect of preferred binding domains on peptide retention behavior in reversed-phase chromatography: Amphipathic alpha-helices. Pept. Res. 1990, 3, 8–20. Available online: https://pubmed.ncbi.nlm.nih.gov/2134049/ (accessed on 24 December 2022).
- Sasagawa, T.; Okuyama, T.; Teller, D. Prediction of peptide retention times in reversed-phases high-performance liquid chromatography during linear gradient elution. J. Chromatogr. A 1982, 240, 329–340. [Google Scholar] [CrossRef]
- Sereda, T.J.; Mant, C.; Quinn, A.; Hodges, R. Effect of the alpha-amino group on peptide retention behaviour in reversed-phase chromatography. Determination of the pK(a) values of the alpha-amino group of 19 different N-terminal amino acid residues. J. Chromatogr. 1993, 646, 17–30. [Google Scholar] [CrossRef] [PubMed]
- Creighton, T.E. Proteins: Structures and Molecular Properties; W.H. Freeman: New York, NY, USA, 1993. [Google Scholar]
- Ross, J.R. Practical handbook of biochemistry and molecular biology; Edited by G D Fasman. pp 601. CRC Press, Boca Raton, Florida, USA. 1989. $00 ISBN 0-8493-3705-4. Biochem. Educ. 1991, 19, 95–96. [Google Scholar] [CrossRef]
- Kovacs, J.M.; Mant, C.; Hodges, R. Determination of intrinsic hydrophilicity/hydrophobicity of amino acid side chains in peptides in the absence of nearest-neighbor or conformational effects. J. Pept. Sci. 2006, 84, 283–297. [Google Scholar] [CrossRef]
- Kovacs, J.M.; Mant, C.; Kwok, S.; Osguthorpe, D.; Hodges, R. Quantitation of the nearest-neighbour effects of amino acid side-chains that restrict conformational freedom of the polypeptide chain using reversed-phase liquid chromatography of synthetic model peptides with L- and D-amino acid substitutions. J. Chromatogr. A 2006, 1123, 212–224. [Google Scholar] [CrossRef]
- Tripet, B.; Cepeniene, D.; Kovacs, J.; Mant, C.; Krokhin, O.; Hodges, R. Requirements for prediction of peptide retention time in reversed-phase high-performance liquid chromatography: Hydrophilicity/hydrophobicity of side-chains at the N- and C-termini of peptides are dramatically affected by the end-groups and location. J. Chromatogr. A 2007, 1141, 212–225. [Google Scholar] [CrossRef]
- Lau, S.Y.M.; Taneja, A.; Hodges, R. Effects of high-performance liquid chromatographic solvents and hydrophobic matrices on the secondary and quarternary structure of a model protein: Reversed-phase and size-exclusion high-performance liquid chromatography. J. Chromatogr. A 1984, 317, 129–140. [Google Scholar] [CrossRef]
- Regnier, F.E. High-Performance Liquid Chromatography of Biopolymers. Science 1983, 222, 245–252. [Google Scholar] [CrossRef]
- Lau, S.Y.; Taneja, A.; Hodges, R. Synthesis of a model protein of defined secondary and quaternary structure. Effect of chain length on the stabilization and formation of two-stranded alpha-helical coiled-coils. J. Biol. Chem. 1984, 259, 13253–13261. [Google Scholar] [CrossRef]


Disclaimer/Publisher’s Note: The statements, opinions and data contained in all publications are solely those of the individual author(s) and contributor(s) and not of MDPI and/or the editor(s). MDPI and/or the editor(s) disclaim responsibility for any injury to people or property resulting from any ideas, methods, instructions or products referred to in the content. |
© 2023 by the authors. Licensee MDPI, Basel, Switzerland. This article is an open access article distributed under the terms and conditions of the Creative Commons Attribution (CC BY) license (https://creativecommons.org/licenses/by/4.0/).