
Cost-Effective Simultaneous Determination of τ- and π-Methylhistidine in Dairy Bovine Plasma from Large Cohort Studies Using Hydrophilic Interaction Ultra-High Performance Liquid Chromatography Coupled to Tandem Mass Spectrometry

 ,
,  ,
,  ,
,  , ,
, ,  and
and
Abstract
1. Introduction
2. Materials and Methods
2.1. Chemicals
2.2. Samples
2.3. Solutions and Control Samples
2.4. Sample Preparation
2.5. UHPLC-MS/MS Method Development and Validation
2.5.1. Specificity
2.5.2. Recovery
2.5.3. Parallelism
2.5.4. Validation and Quality Control
3. Results and Discussion
3.1. Method Development and Validation
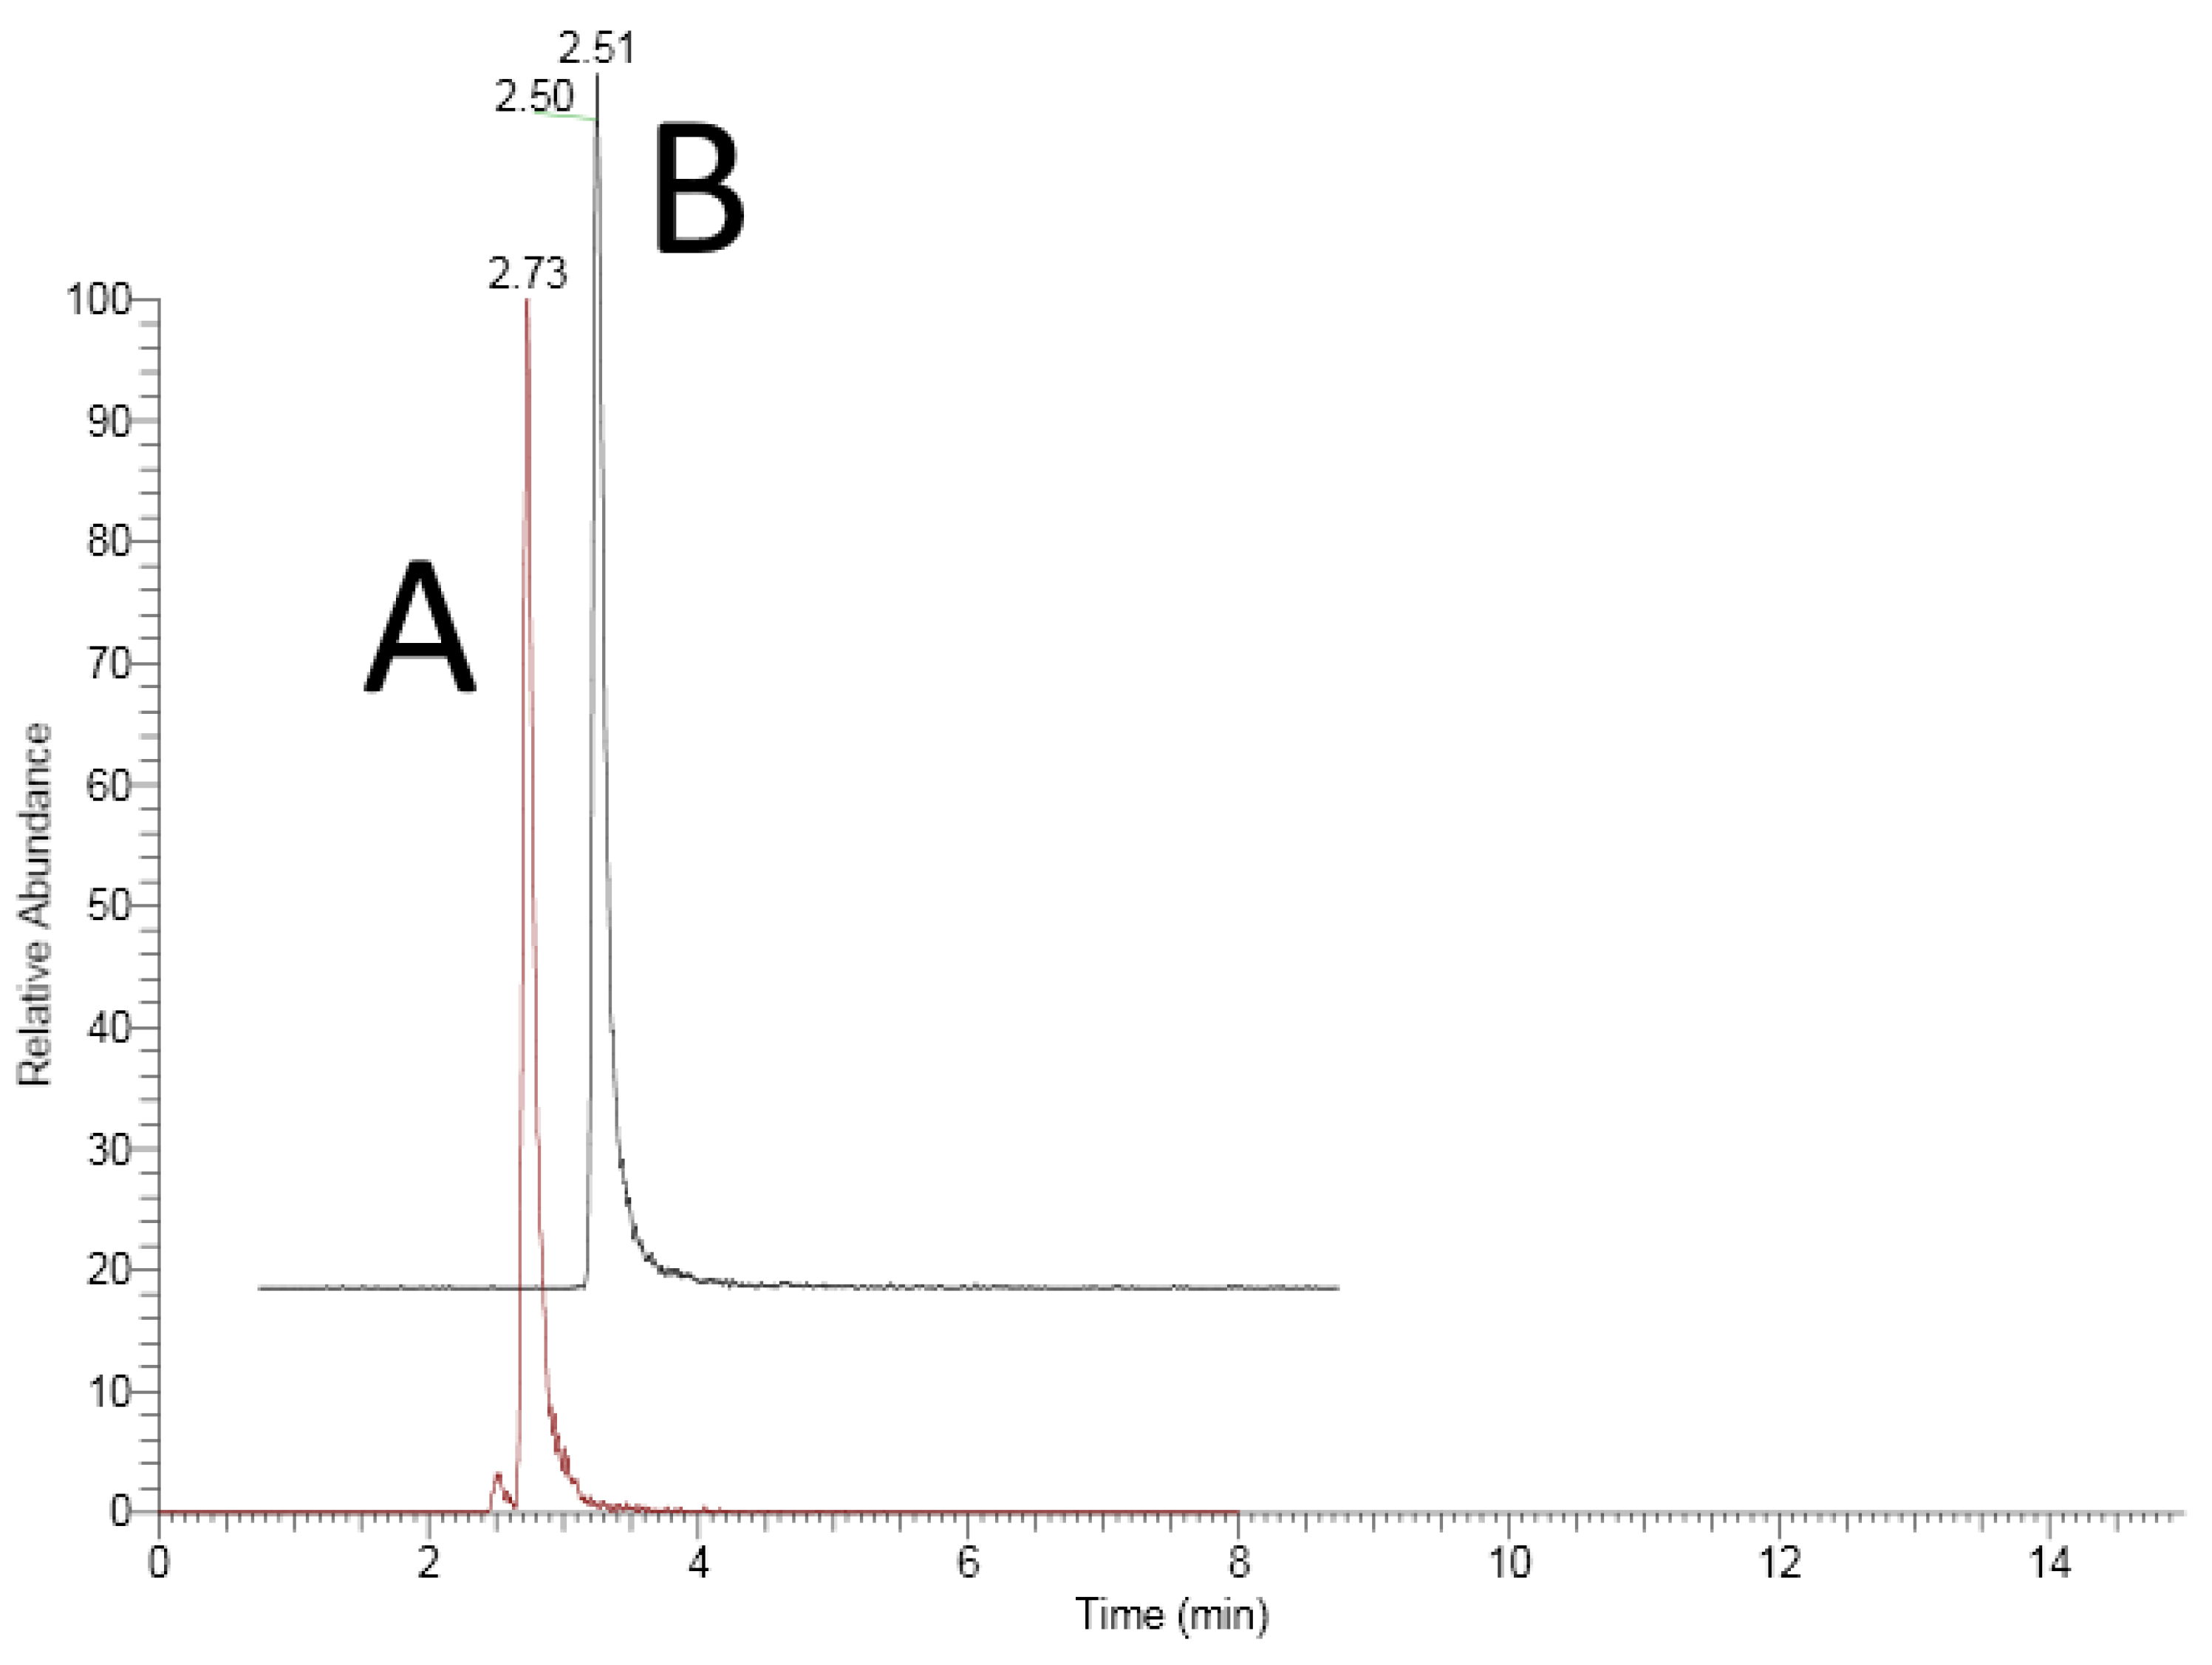
3.1.1. Specificity
3.1.2. Recovery
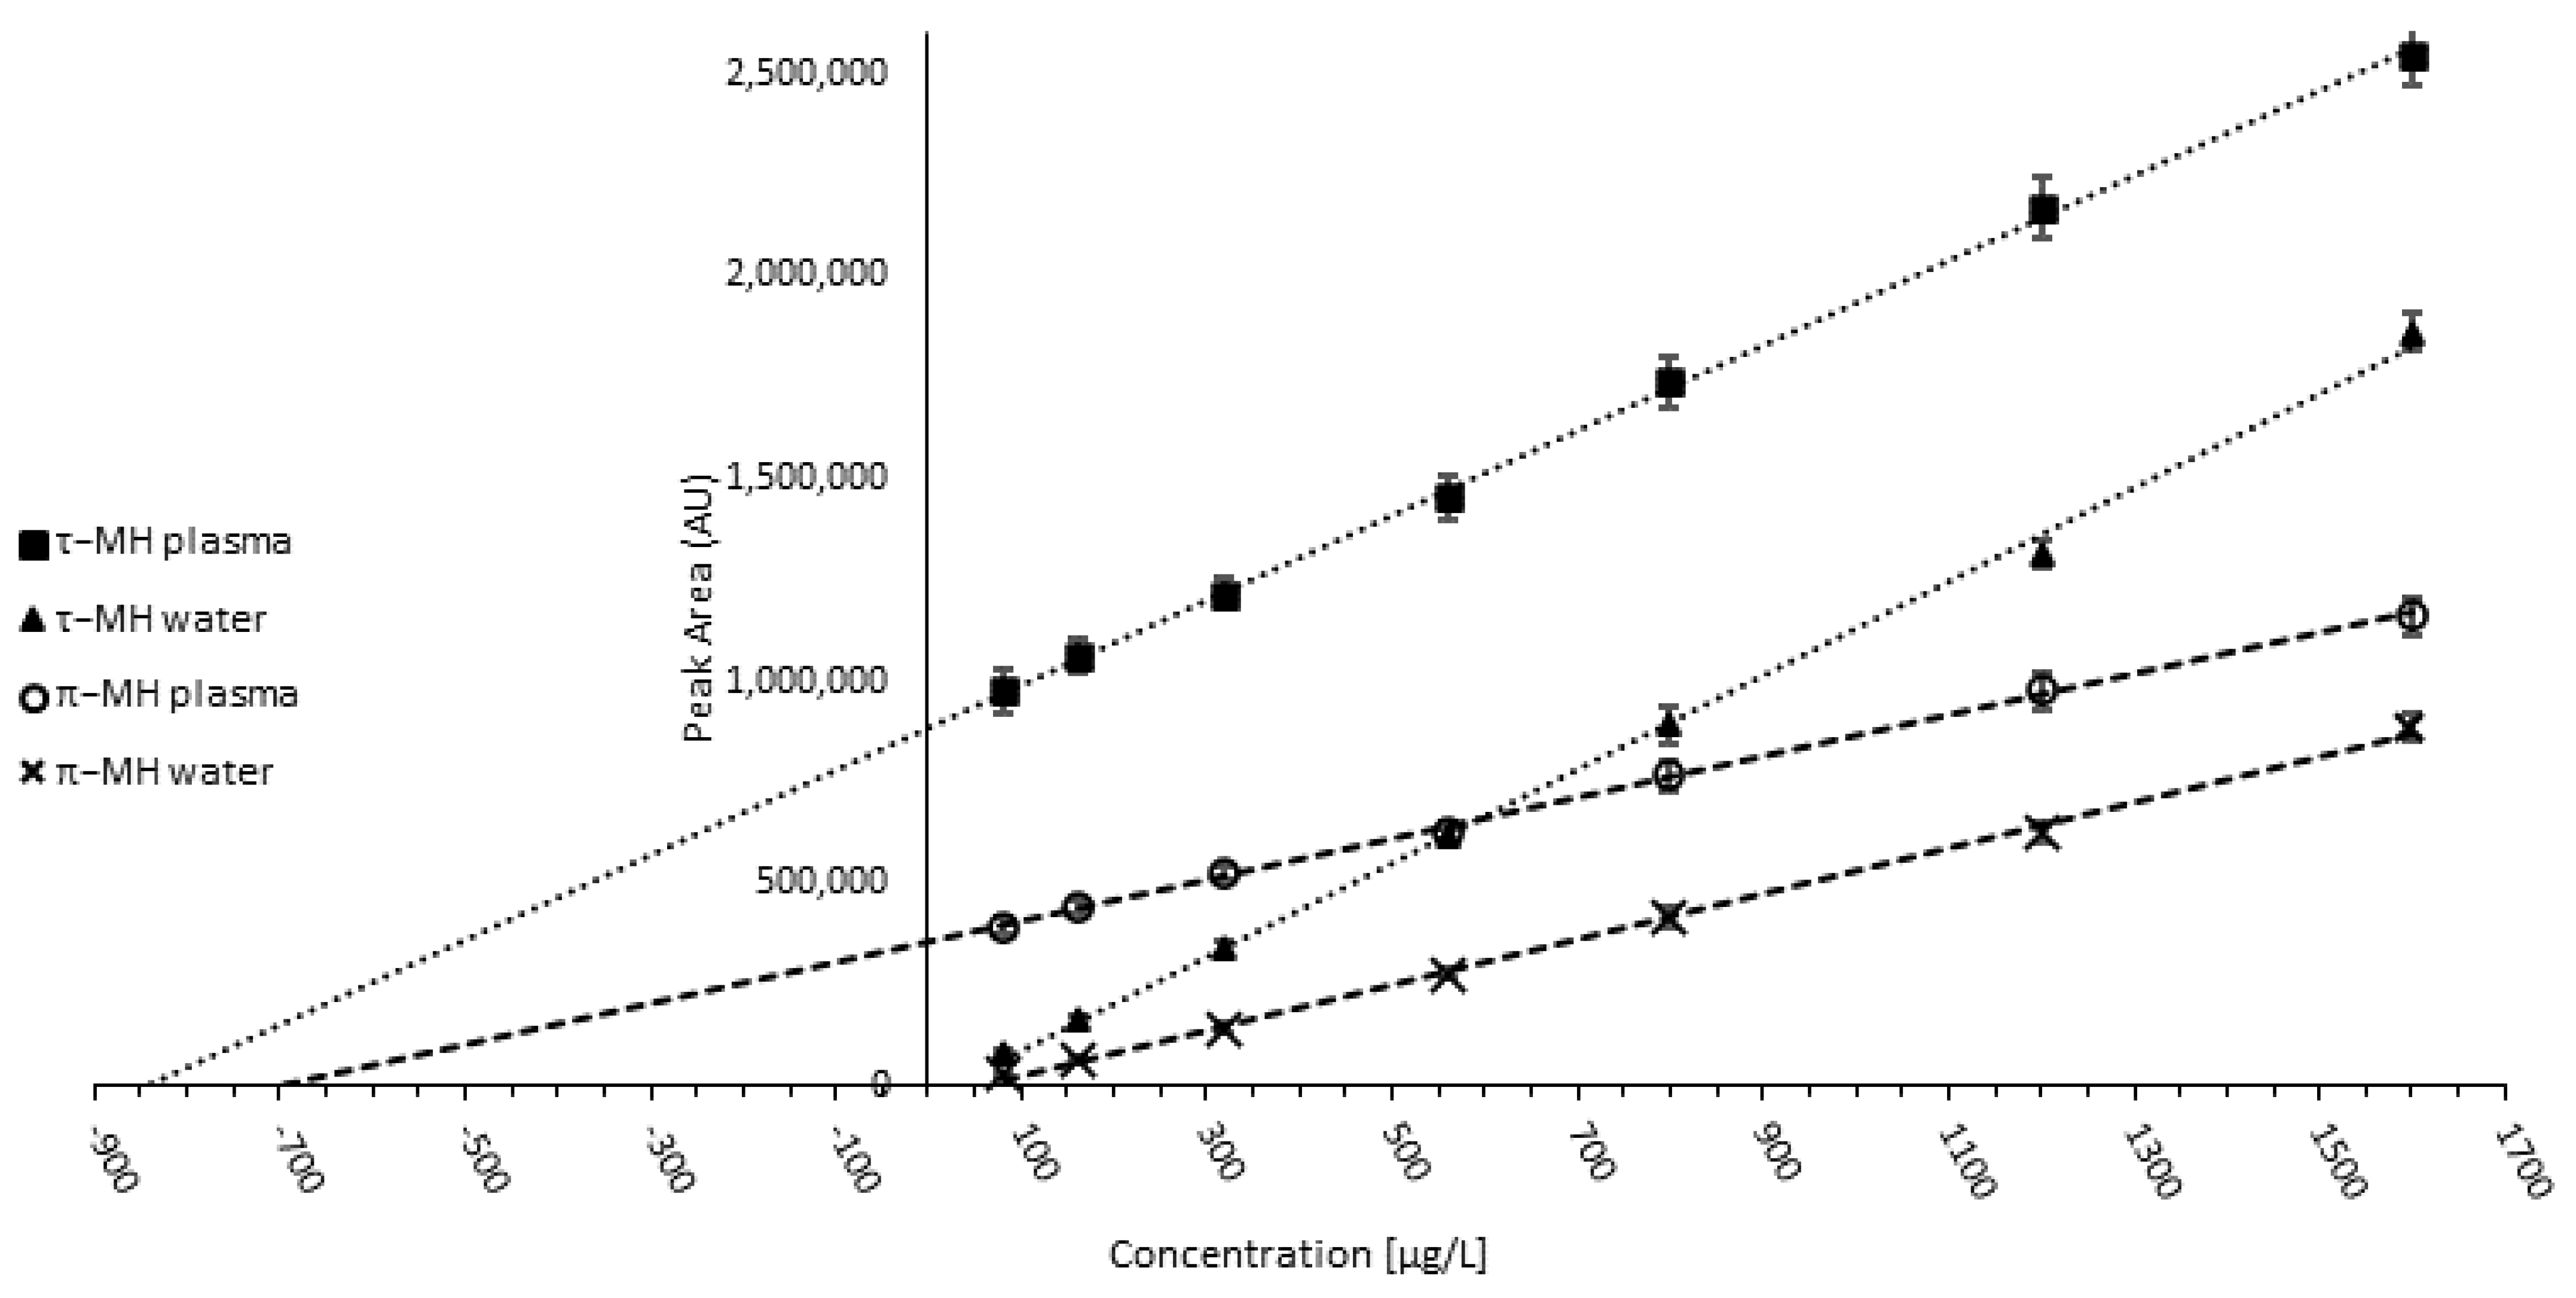
3.1.3. Parallelism
3.1.4. Validation and Quality Control
3.2. Sample Analysis
3.3. Discussion
4. Conclusions
Supplementary Materials
Author Contributions
Funding
Data Availability Statement
Conflicts of Interest
References
- Warnes, D.M.; Thomas, F.M.; Ballard, F.J. Increased Rates of Myofibrillar Protein Breakdown in Muscle-Wasting Diseases. Muscle Nerve 1981, 4, 62–66. [Google Scholar] [CrossRef]
- Johnson, P.; Perry, S.V. Biological Activity and the 3-Methylhistidine Content of Actin and Myosin. Biochem. J. 1970, 119, 293–298. [Google Scholar] [CrossRef] [PubMed]
- Myint, T. Urinary 1-Methylhistidine Is a Marker of Meat Consumption in Black and in White California Seventh-Day Adventists. Am. J. Epidemiol. 2000, 152, 752–755. [Google Scholar] [CrossRef]
- Drackley, J.K. Biology of Dairy Cows During the Transition Period: The Final Frontier? J. Dairy Sci. 1999, 82, 2259–2273. [Google Scholar] [CrossRef] [PubMed]
- Grummer, R.R.; Mashek, D.G.; Hayirli, A. Dry Matter Intake and Energy Balance in the Transition Period. Vet. Clin. N. Am. Food Anim. Pract. 2004, 20, 447–470. [Google Scholar] [CrossRef] [PubMed]
- van der Drift, S.G.A.; Houweling, M.; Schonewille, J.T.; Tielens, A.G.M.; Jorritsma, R. Protein and Fat Mobilization and Associations with Serum β-Hydroxybutyrate Concentrations in Dairy Cows. J. Dairy Sci. 2012, 95, 4911–4920. [Google Scholar] [CrossRef]
- Doepel, L.; Lapierre, H.; Kennelly, J.J. Peripartum Performance and Metabolism of Dairy Cows in Response to Prepartum Energy and Protein Intake. J. Dairy Sci. 2002, 85, 2315–2334. [Google Scholar] [CrossRef]
- Pires, J.A.A.; Delavaud, C.; Faulconnier, Y.; Pomiès, D.; Chilliard, Y. Effects of Body Condition Score at Calving on Indicators of Fat and Protein Mobilization of Periparturient Holstein-Friesian Cows. J. Dairy Sci. 2013, 96, 6423–6439. [Google Scholar] [CrossRef]
- Long, C.L.; Haverberg, L.N.; Young, V.R.; Kinney, J.M.; Munro, H.N.; Geiger, J.W. Metabolism of 3-Methylhistidine in Man. Metabolism 1975, 24, 929–935. [Google Scholar] [CrossRef]
- Leibholz, J. 3-Methylhistidine in the Blood Plasma of the Sheep. Biochim. Et Biophys. Acta (BBA)—Gen. Subj. 1968, 170, 432–434. [Google Scholar] [CrossRef]
- Tallan, H.H.; Stein, W.H.; Moore, S. 3-Methylhistidine, a New Amino Acid from Human Urine. J. Biol. Chem. 1954, 206, 825–834. [Google Scholar] [CrossRef] [PubMed]
- Young, V.; Munro, H. Ntau-Methylhistidine (3-Methylhistidine) and Muscle Protein Turnover: An Overview. Fed. Proc. 1978, 37, 2291–2300. [Google Scholar] [PubMed]
- Phillips, S.M.; Tipton, K.D.; Aarsland, A.; Wolf, S.E.; Wolfe, R.R. Mixed Muscle Protein Synthesis and Breakdown after Resistance Exercise in Humans. Am. J. Physiol.-Endocrinol. Metab. 1997, 273, E99–E107. [Google Scholar] [CrossRef] [PubMed]
- Castro Bulle, F.C.P.; Paulino, P.V.; Sanches, A.C.; Sainz, R.D. Growth, Carcass Quality, and Protein and Energy Metabolism in Beef Cattle with Different Growth Potentials and Residual Feed Intakes. J. Anim. Sci. 2007, 85, 928–936. [Google Scholar] [CrossRef]
- Saleh, A.A.; Eid, Y.Z.; Ebeid, T.A.; Kamizono, T.; Ohtsuka, A.; Hayashi, K. Effects of Feeding Aspergillus Awamori and Aspergillus Niger on Growth Performance and Meat Quality in Broiler Chickens. J. Poult. Sci. 2011, 48, 201–206. [Google Scholar] [CrossRef]
- Williamson, E.; Kato, H.; Volterman, K.A.; Suzuki, K.; Moore, D.R. Greater Plasma Essential Amino Acids and Lower 3-Methylhistidine with Higher Protein Intake during Endurance Training: A Randomised Control Trial. Amino Acids 2022. [Google Scholar] [CrossRef]
- Kochlik, B.; Franz, K.; Henning, T.; Weber, D.; Wernitz, A.; Herpich, C.; Jannasch, F.; Aykaç, V.; Müller-Werdan, U.; Schulze, M.B.; et al. Frailty Is Characterized by Biomarker Patterns Reflecting Inflammation or Muscle Catabolism in Multi-morbid Patients. J. Cachexia Sarcopenia Muscle 2023, 14, 157–166. [Google Scholar] [CrossRef]
- Betouke Ongwe, M.E.; Kohler, I.; Manurung, M.D.; Verhoeven, A.; Derks, R.; Janse, J.J.; Mouwenda, Y.D.; Kremsner, P.G.; Adegnika, A.A.; Lell, B.; et al. Urinary Metabolic Profiling in Volunteers Undergoing Malaria Challenge in Gabon. Metabolites 2022, 12, 1224. [Google Scholar] [CrossRef]
- Sato, R.; Koyama, S.; Yasukawa, M.; Inoue, T.; Matsumura, T.; Kanazawa, A.; Nozue, Y.; Wada, Y.; Yoshimura, I.; Hagita, Y.; et al. Evaluation of Prolonged Endometrial Inflammation Associated with the Periparturient Metabolic State in Dairy Cows. Animals 2022, 12, 3401. [Google Scholar] [CrossRef]
- Batchu, P.; Naldurtiker, A.; Kouakou, B.; Terrill, T.H.; McCommon, G.W.; Kannan, G. Metabolomic Exploration of the Effects of Habituation to Livestock Trailer and Extended Transportation in Goats. Front. Mol. Biosci. 2022, 9, 1027069. [Google Scholar] [CrossRef]
- Lackner, J.; Hess, V.; Marx, A.; Hosseini-Ghaffari, M.; Sauerwein, H. Effects of Dietary Supplementation with Histidine and β-Alanine on Blood Plasma Metabolome of Broiler Chickens at Different Ages. PLoS ONE 2022, 17, e0277476. [Google Scholar] [CrossRef]
- Houweling, M.; van der Drift, S.G.A.; Jorritsma, R.; Tielens, A.G.M. Technical Note: Quantification of Plasma 1- and 3-Methylhistidine in Dairy Cows by High-Performance Liquid Chromatography–Tandem Mass Spectrometry. J. Dairy Sci. 2012, 95, 3125–3130. [Google Scholar] [CrossRef]
- Boldyrev, A.A.; Aldini, G.; Derave, W. Physiology and Pathophysiology of Carnosine. Physiol. Rev. 2013, 93, 1803–1845. [Google Scholar] [CrossRef]
- Wishart, D.S.; Feunang, Y.D.; Marcu, A.; Guo, A.C.; Liang, K.; Vázquez-Fresno, R.; Sajed, T.; Johnson, D.; Li, C.; Karu, N.; et al. HMDB 4.0: The Human Metabolome Database for 2018. Nucleic Acids Res. 2018, 46, D608–D617. [Google Scholar] [CrossRef] [PubMed]
- CSID:491986. Available online: http://www.chemspider.com/Chemical-Structure.491986.html (accessed on 5 October 2021).
- CSID:312567. Available online: http://www.chemspider.com/Chemical-Structure.312567.html (accessed on 5 October 2021).
- Gold, V. (Ed.) The IUPAC Compendium of Chemical Terminology: The Gold Book, 4th ed.; International Union of Pure and Applied Chemistry (IUPAC): Research Triangle Park, NC, USA, 2019. [Google Scholar]
- MoNA—MassBank of North America. Available online: https://mona.fiehnlab.ucdavis.edu/ (accessed on 15 January 2023).
- Nishizawa, N.; Noguchi, T.; Hareyama, S.; Funabiki, R. Quantitative Isolation of Nτ-Methylhistidine by Ion-Exchange Paper and Column Chromatography. J. Chromatogr. A 1978, 151, 424–427. [Google Scholar] [CrossRef]
- Hung, S.S.O.; Moon, T.W. Determination of Free Methylhistidine and Amino Acids by High-Performance Liquid Chromatography. J. Chromatogr. A 1983, 269, 114–118. [Google Scholar] [CrossRef]
- Ali Qureshi, G.; Van den berg, S.; Gutierrez, A.; Bergström, J. Determination of Histidine and 3-Methylhistidine in Physiological Fluids by High-Performance Liquid Chromatography. J. Chromatogr. A 1984, 297, 83–89. [Google Scholar] [CrossRef]
- Qureshi, G.A.; Gutierrez, A.; Bergström, J. Determination of Histidine, 1-Methylhistidine and 3-Methylhistidine in Biological Samples by High-Performance Liquid Chromatography. J. Chromatogr. B Biomed. Sci. Appl. 1986, 374, 363–369. [Google Scholar] [CrossRef]
- Andersson, E.; Håkanson, E.; Larsson, L.; Mårtensson, J. Rapid and Sensitive Method for the Determination of Arterial-Venous Differences and Leg Efflux of 3-Methylhistidine Using Ion-Pair High-Performance Liquid Chromatography and Post-Column Fluorescence Derivatization. J. Chromatogr. B Biomed. Sci. Appl. 1987, 414, 174–179. [Google Scholar] [CrossRef]
- Minkler, P.E.; Ingalls, S.T.; Griffin, R.L.; Hoppel, C.L. Rapid High-Performance Liquid Chromatography of 3-Methylhistidine in Human Urine. J. Chromatogr. B Biomed. Sci. Appl. 1987, 413, 33–42. [Google Scholar] [CrossRef]
- Caccialanza, G.; Gandini, C.; Kitsos, M.; Ponci, R.; Benzo, M. Determination of Urinary 3-Methylhistidine by High-Performance Liquid Chromatography. J. Pharm. Biomed. Anal. 1988, 6, 1055–1058. [Google Scholar] [CrossRef] [PubMed]
- van Eijk, H.M.; Deutz, N.E.; Wagenmakers, A.J.; Soeters, P.B. 3-Methylhistidine Determined in Plasma by “High-Performance” Lipid Chromatography. Clin. Chem. 1990, 36, 556–559. [Google Scholar] [CrossRef] [PubMed]
- Min, S.; Yisheng, Y.; Lu, Y. Determination of Urinary 3-Methylhistidine by High-Performance Liquid Chromatography with o-Phthaldialdehyde Precolumn Derivatization. J. Chromatogr. B Biomed. Sci. Appl. 1992, 581, 272–276. [Google Scholar] [CrossRef] [PubMed]
- Kuhl, D.A.; Travis Methvin, J.; Dickerson, R.N. Standardization of Acid Hydrolysis Procedure for Urinary 3-Methylhistidine Determination by High-Performance Liquid Chromatography. J. Chromatogr. B Biomed. Sci. Appl. 1996, 681, 390–394. [Google Scholar] [CrossRef] [PubMed]
- Wassner, S.J.; Schlitzer, J.L.; Li, J.B. A Rapid, Sensitive Method for the Determination of 3-Methylhistidine Levels in Urine and Plasma Using High-Pressure Liquid Chromatography. Anal. Biochem. 1980, 104, 284–289. [Google Scholar] [CrossRef]
- Teerlink, T.; de Boer, E. Determination of 3-Methylhistidine in Urine by High-Performance Liquid Chromatography Using Pre-Column Derivatization with 9-Fluorenylmethyl Chloroformate. J. Chromatogr. B Biomed. Sci. Appl. 1989, 491, 418–423. [Google Scholar] [CrossRef]
- Zeece, M.G.; Chu, Q.; Jones, S.J.; Woods, T.L.; Reville, W.J. Determination of 3-Methylhistidine by Capillary Electrophoresis. J. Capill. Electrophor. 1996, 3, 55–59. [Google Scholar]
- Tůma, P.; Samcová, E.; Balínová, P. Determination of 3-Methylhistidine and 1-Methylhistidine in Untreated Urine Samples by Capillary Electrophoresis. J. Chromatogr. B 2005, 821, 53–59. [Google Scholar] [CrossRef]
- Tůma, P.; Samcová, E.; Opekar, F.; Jurka, V.; Štulík, K. Determination of 1-Methylhistidine and 3-Methylhistidine by Capillary and Chip Electrophoresis with Contactless Conductivity Detection. Electrophoresis 2007, 28, 2174–2180. [Google Scholar] [CrossRef]
- Zhou, L.; Yan, N.; Zhang, H.; Zhou, X.; Pu, Q.; Hu, Z. Microwave-Accelerated Derivatization for Capillary Electrophoresis with Laser-Induced Fluorescence Detection: A Case Study for Determination of Histidine, 1- and 3-Methylhistidine in Human Urine. Talanta 2010, 82, 72–77. [Google Scholar] [CrossRef]
- Zinellu, A.; Sotgia, S.; Pisanu, E.; Scanu, B.; Sanna, M.; Deiana, L.; Carru, C. Quantification of Histidine, 1-Methylhistidine and 3-Methylhistidine in Plasma and Urine by Capillary Electrophoresis UV-Detection. J. Sep. Sci. 2010, 33, 3781–3785. [Google Scholar] [CrossRef] [PubMed]
- Carisano, A. Separation of 3-Methylhistidine from Histidine by Thin-Layer Chromatography. J. Chromatogr. A 1964, 13, 83–89. [Google Scholar] [CrossRef] [PubMed]
- Larsen, T.W.; Thornton, R.F. Analysis of the Amino Acid 3-Methylhistidine by Gas-Liquid Chromatography. Anal. Biochem. 1980, 109, 137–141. [Google Scholar] [CrossRef] [PubMed]
- Matthews, D.E.; Starren, J.B.; Drexler, A.J.; Kipnis, D.M.; Bier, D.M. Picomole Assay for Nτ-Methylhistidine by Gas Chromatography—Mass Spectrometry. Anal. Biochem. 1981, 110, 308–317. [Google Scholar] [CrossRef] [PubMed]
- Beffa, D.C.; Carter, E.A.; Lu, X.-M.; Yu, Y.-M.; Prelack, K.; Sheridan, R.L.; Young, V.R.; Fischman, A.J.; Tompkins, R.G. Negative Chemical Ionization Gas Chromatography/Mass Spectrometry to Quantify Urinary 3-Methylhistidine: Application to Burn Injury. Anal. Biochem. 2006, 355, 95–101. [Google Scholar] [CrossRef]
- Smith, R.M.; Solabi, G.A.; Hayes, W.P.; Stretton, R.J. Pyrolysis—Gas Chromatography of Histidine and 3-Methylhistidine. J. Anal. Appl. Pyrolysis 1980, 1, 197–201. [Google Scholar] [CrossRef]
- Wang, H.; Hu, P.; Jiang, J. Measurement of 1- and 3-Methylhistidine in Human Urine by Ultra Performance Liquid Chromatography–Tandem Mass Spectrometry. Clin. Chim. Acta 2012, 413, 131–138. [Google Scholar] [CrossRef]
- Kochlik, B.; Gerbracht, C.; Grune, T.; Weber, D. The Influence of Dietary Habits and Meat Consumption on Plasma 3-Methylhistidine-A Potential Marker for Muscle Protein Turnover. Mol. Nutr. Food Res. 2018, 62, 1701062. [Google Scholar] [CrossRef]
- Roggensack, T.; Merz, B.; Dick, N.; Bub, A.; Krüger, R. Targeted Ultra-performance Liquid Chromatography/Tandem Mass Spectrometric Quantification of Methylated Amines and Selected Amino Acids in Biofluids. Rapid Commun. Mass Spectrom. 2020, 34, e8646. [Google Scholar] [CrossRef]
- King, A.M.; Mullin, L.G.; Wilson, I.D.; Coen, M.; Rainville, P.D.; Plumb, R.S.; Gethings, L.A.; Maker, G.; Trengove, R. Development of a Rapid Profiling Method for the Analysis of Polar Analytes in Urine Using HILIC–MS and Ion Mobility Enabled HILIC–MS. Metabolomics 2019, 15, 17. [Google Scholar] [CrossRef]
- Siachos, N.; Oikonomou, G.; Panousis, N.; Tsiamadis, V.; Banos, G.; Arsenos, G.; Valergakis, G.E. Skeletal Muscle and Adipose Tissue Reserves and Mobilisation in Transition Holstein Cows: Part 2 Association with Postpartum Health, Reproductive Performance and Milk Production. Animal 2022, 16, 100626. [Google Scholar] [CrossRef] [PubMed]
- Siachos, N.; Oikonomou, G.; Panousis, N.; Tsiamadis, V.; Banos, G.; Arsenos, G.; Valergakis, G.E. Skeletal Muscle and Adipose Tissue Reserves and Mobilisation in Transition Holstein Cows: Part 1 Biological Variation and Affecting Factors. Animal 2022, 16, 100627. [Google Scholar] [CrossRef] [PubMed]
- Deda, O.; Virgiliou, C.; Orfanidis, A.; Gika, H.G. Study of Fecal and Urinary Metabolite Perturbations Induced by Chronic Ethanol Treatment in Mice by UHPLC-MS/MS Targeted Profiling. Metabolites 2019, 9, 232. [Google Scholar] [CrossRef] [PubMed]
- Committee for Medicinal Products for Human Use (CHMP); EMA. Guideline on Bioanalytical Method Validation; European Medicines Agency: Amsterdam, The Netherlands, 2011.
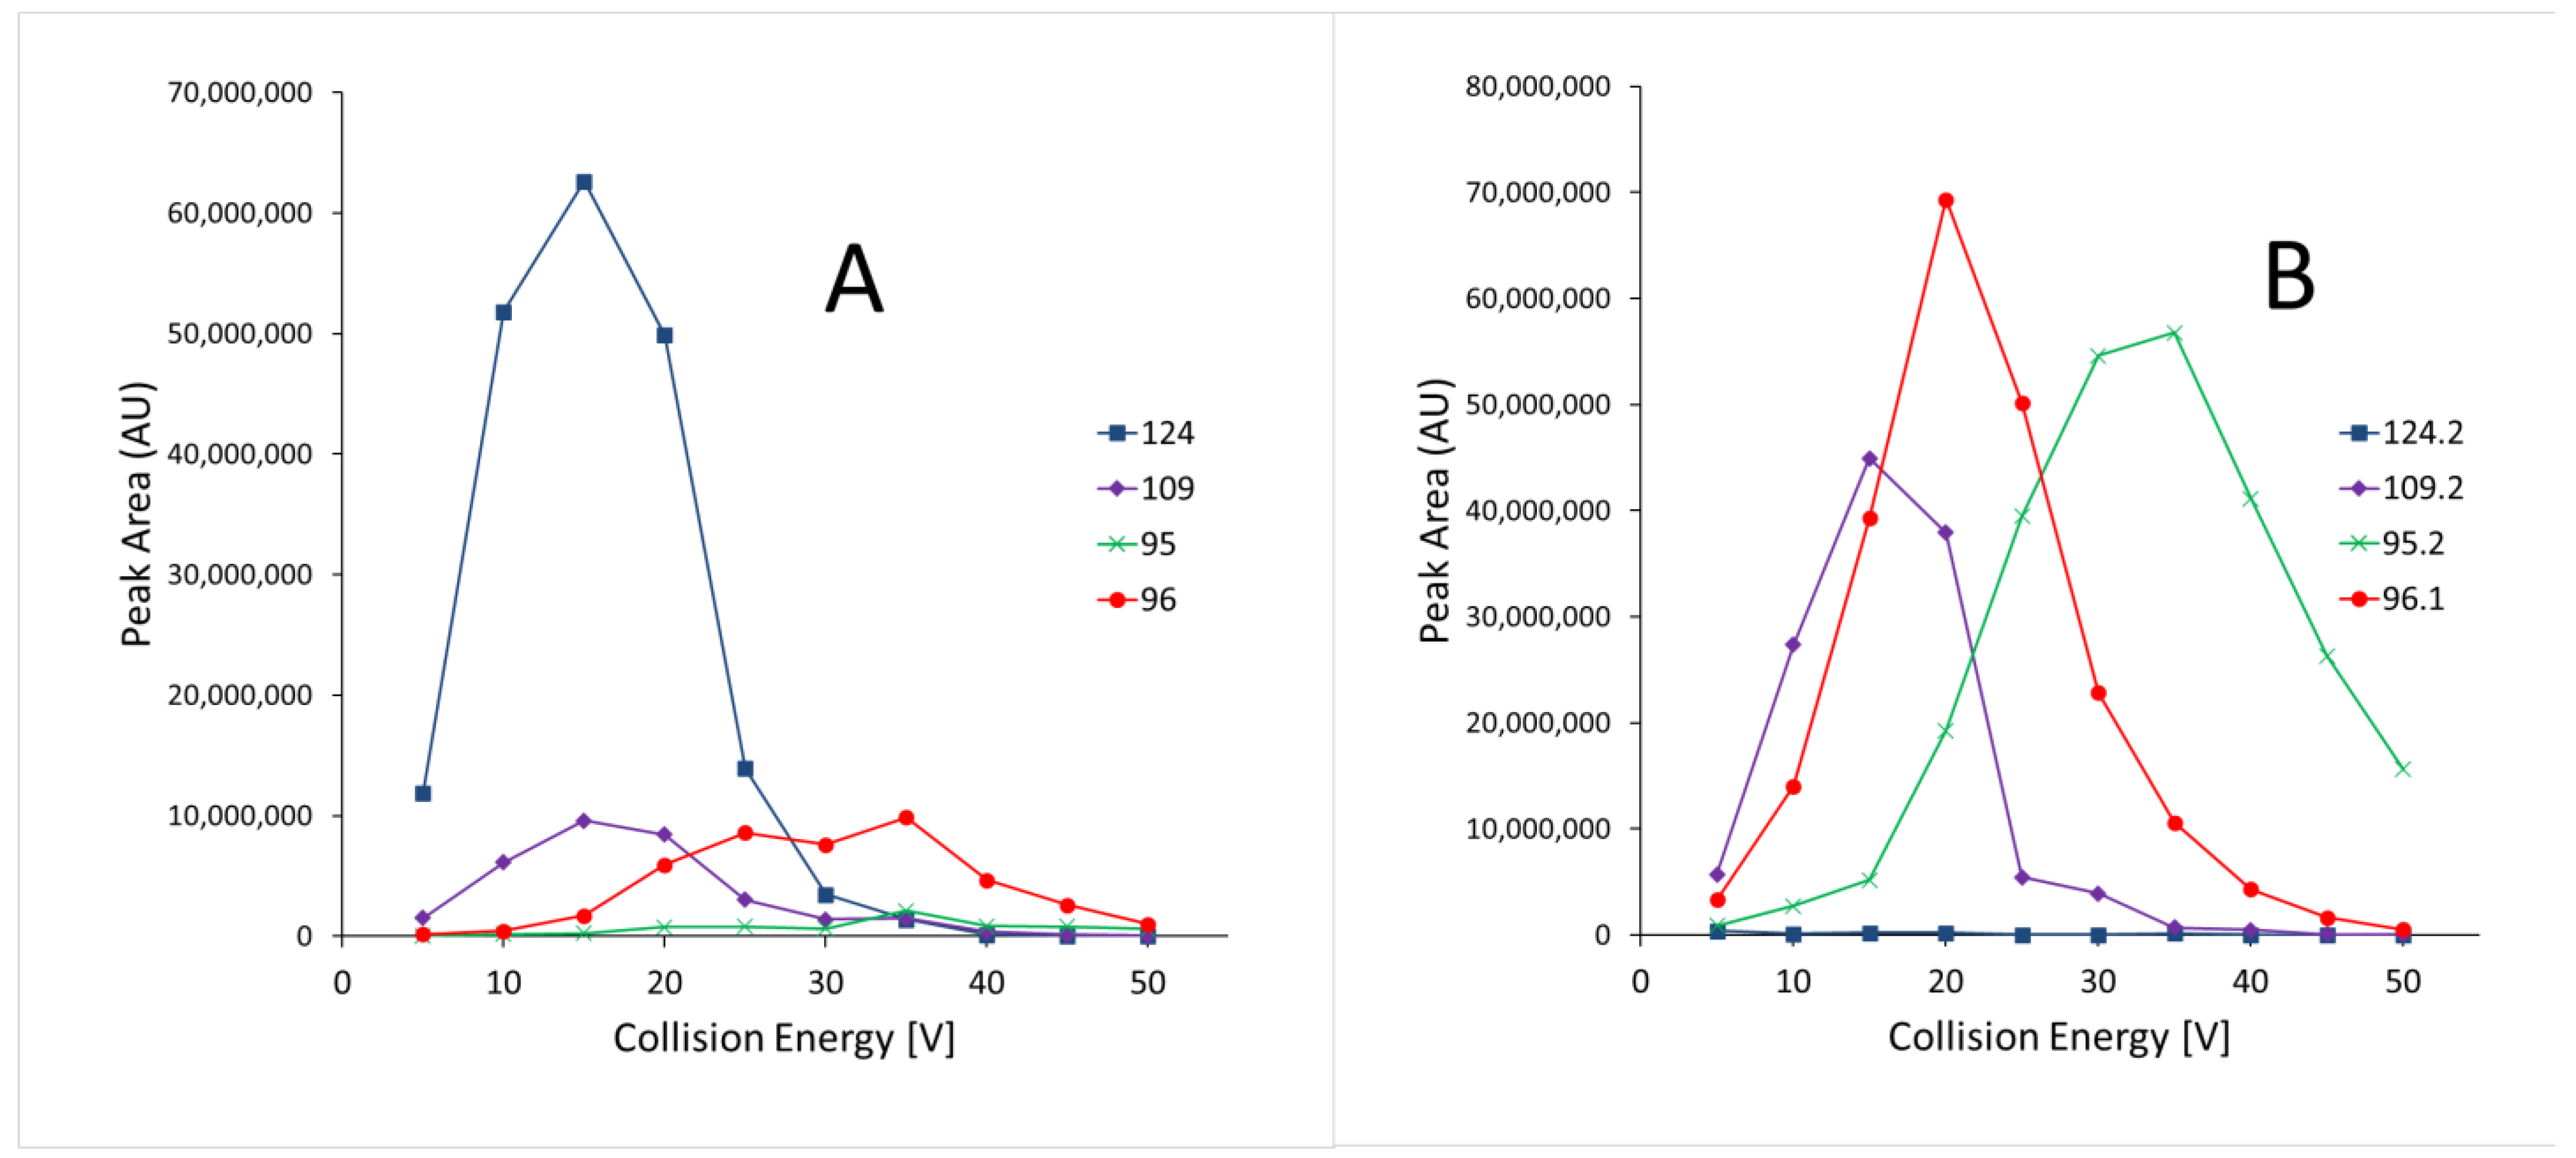
- Mörlein, S.; Schuster, C.; Paal, M.; Vogeser, M. Collision Energy-Breakdown Curves—An Additional Tool to Characterize MS/MS Methods. Clin. Mass Spectrom. 2020, 18, 48–53. [Google Scholar] [CrossRef]
- Houghton, R.; Horro Pita, C.; Ward, I.; Macarthur, R. Generic Approach to Validation of Small-Molecule LC–MS/MS Biomarker Assays. Bioanalysis 2009, 1, 1365–1374. [Google Scholar] [CrossRef]
- Jones, B.R.; Schultz, G.A.; Eckstein, J.A.; Ackermann, B.L. Surrogate Matrix and Surrogate Analyte Approaches for Definitive Quantitation of Endogenous Biomolecules. Bioanalysis 2012, 4, 2343–2356. [Google Scholar] [CrossRef]
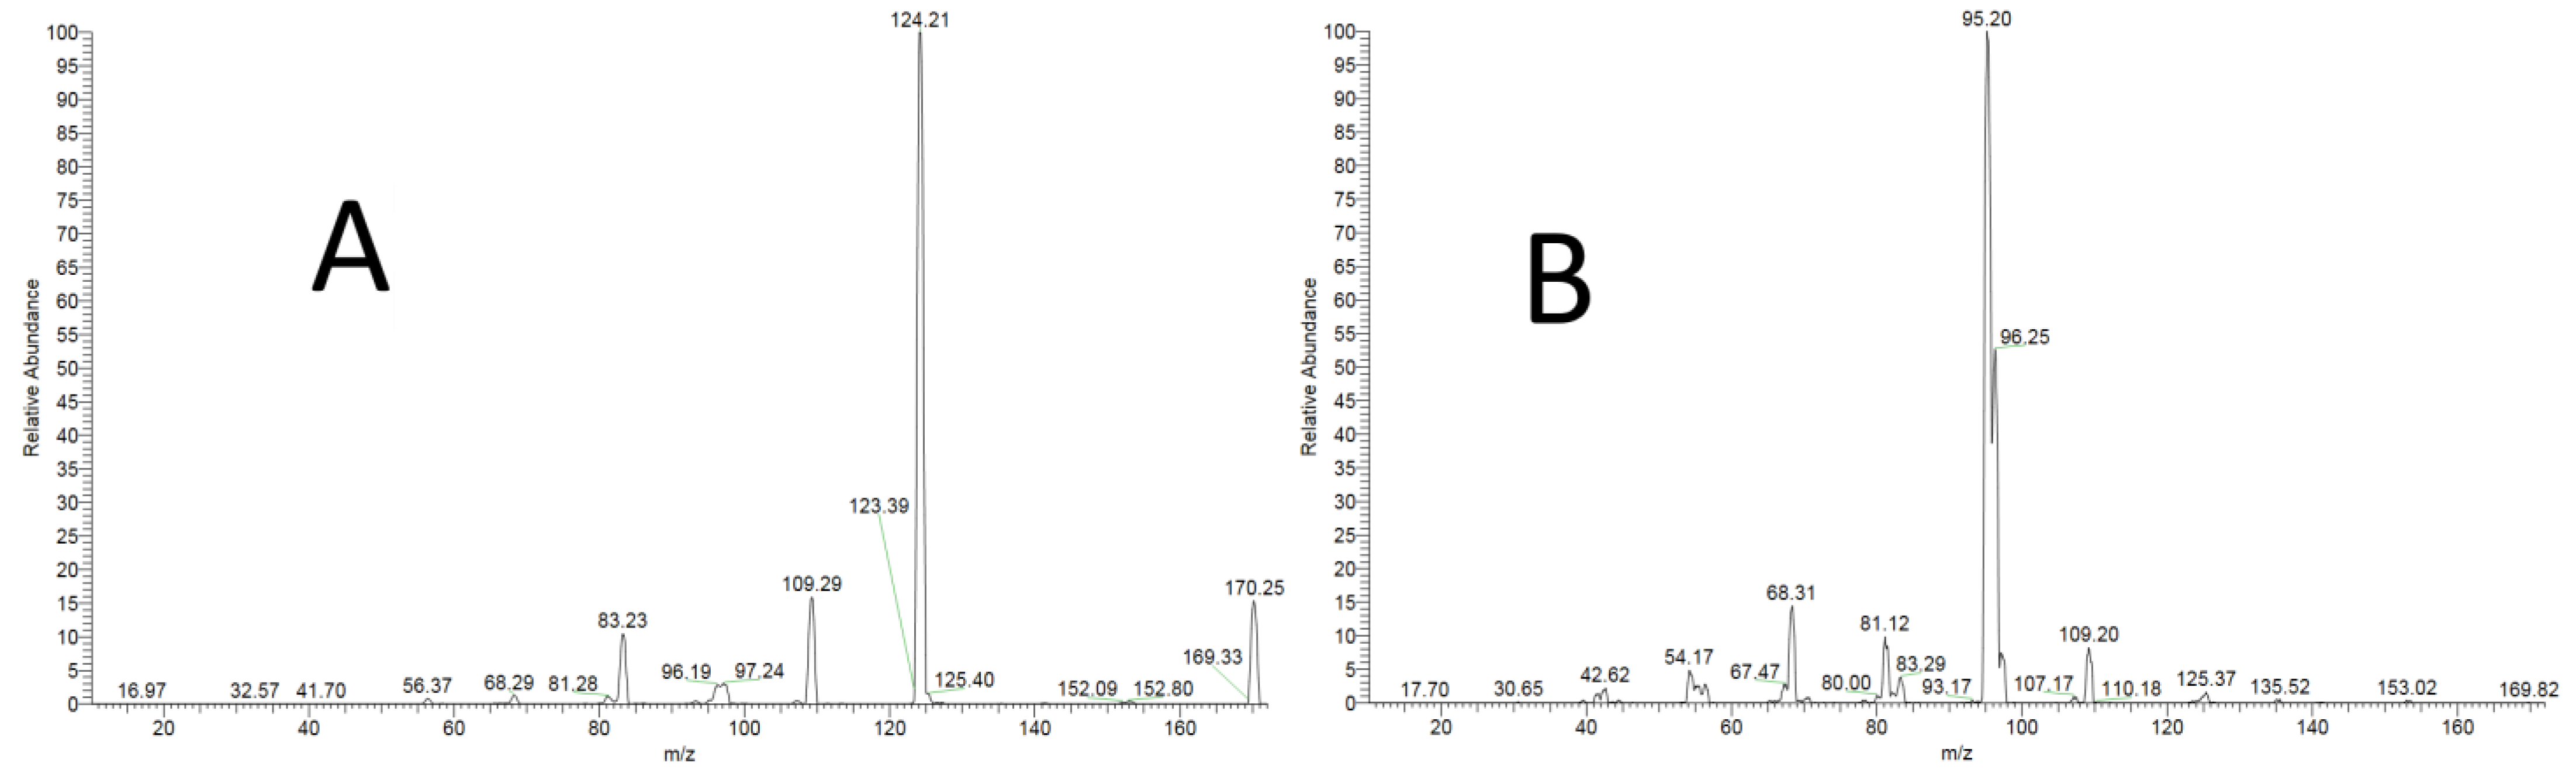
- MoNA Spectrum for 3-Methylhistidine (25eV). Available online: https://mona.fiehnlab.ucdavis.edu/spectra/display/HMDB0000479_ms_ms_696 (accessed on 15 January 2023).
- MoNA Spectrum for 1-Methylhistidine (25eV). Available online: https://mona.fiehnlab.ucdavis.edu/spectra/display/HMDB0000001_ms_ms_2 (accessed on 15 January 2023).
- Virgiliou, C.; Sampsonidis, I.; Gika, H.G.; Raikos, N.; Theodoridis, G.A. Development and Validation of a HILIC-MS/MS Multitargeted Method for Metabolomics Applications: Liquid Phase Separations. Electrophoresis 2015, 36, 2215–2225. [Google Scholar] [CrossRef]
- Virgiliou, C.; Theodoridis, G.; Wilson, I.D.; Gika, H.G. Quantification of Endogenous Aminoacids and Aminoacid Derivatives in Urine by Hydrophilic Interaction Liquid Chromatography Tandem Mass Spectrometry. J. Chromatogr. A 2021, 1642, 462005. [Google Scholar] [CrossRef]
- Gallart-Ayala, H.; Teav, T.; Ivanisevic, J. Hydrophilic Interaction Chromatography–Mass Spectrometry (HILIC–MS) Approaches for Probing the Polar Metabolome. In Advanced Mass Spectrometry-Based Analytical Separation Techniques for Probing the Polar Metabolome; Ramautar, R., Ed.; The Royal Society of Chemistry: London, UK, 2021; pp. 69–90. ISBN 978-1-83916-163-6. [Google Scholar]
- Harrieder, E.-M.; Kretschmer, F.; Böcker, S.; Witting, M. Current State-of-the-Art of Separation Methods Used in LC-MS Based Metabolomics and Lipidomics. J. Chromatogr. B 2022, 1188, 123069. [Google Scholar] [CrossRef]
- Alpert, A.J. Effect of Salts on Retention in Hydrophilic Interaction Chromatography. J. Chromatogr. A 2018, 1538, 45–53. [Google Scholar] [CrossRef]
- Kostiainen, R.; Kauppila, T.J. Effect of Eluent on the Ionization Process in Liquid Chromatography–Mass Spectrometry. J. Chromatogr. A 2009, 1216, 685–699. [Google Scholar] [CrossRef] [PubMed]
- Cech, N.B.; Enke, C.G. Practical Implications of Some Recent Studies in Electrospray Ionization Fundamentals. Mass Spectrom. Rev. 2001, 20, 362–387. [Google Scholar] [CrossRef] [PubMed]


| Solution Type | Recovery [%R] | Precision [%RSD] | ||
|---|---|---|---|---|
| τ-MH | π-MH | τ-MH | π-MH1 | |
| Low spike | 78.54 | 84.90 | 1.85 | 9.33 |
| Medium spike | 84.02 | 79.33 | 4.22 | 5.53 |
| High spike | 91.84 | 87.29 | 5.00 | 9.10 |
| Pooled sample | - | - | 4.33 | 7.78 |
| Figure of Merit | Within-Day (Day 1) n = 4 | Between-Days (Day 1, Day 2, Day 3) n = 12 | ||
|---|---|---|---|---|
| τ-MH | π-MH | τ-MH | π-MH1 | |
| Accuracy LQC [%] | 103.4 | 112.9 | 99.7 | 113.2 |
| Accuracy MQC [%] | 100.6 | 102.7 | 96.0 | 104.0 |
| Accuracy HMQC [%] | 97.9 | 102.5 | 95.6 | 105.2 |
| Accuracy HQC [%] | 99.8 | 100.3 | 97.1 | 106.2 |
| Precision LQC [RSD%] | 3.5 | 4.2 | 2.3 | 4.8 |
| Precision MQC [RSD%] | 6.5 | 6.2 | 3.7 | 4.2 |
| Precision HMQC [RSD%] | 3.9 | 4.7 | 3.4 | 3.7 |
| Precision HQC [RSD%] | 2.0 | 2.6 | 1.5 | 1.8 |
Disclaimer/Publisher’s Note: The statements, opinions and data contained in all publications are solely those of the individual author(s) and contributor(s) and not of MDPI and/or the editor(s). MDPI and/or the editor(s) disclaim responsibility for any injury to people or property resulting from any ideas, methods, instructions or products referred to in the content. |
© 2023 by the authors. Licensee MDPI, Basel, Switzerland. This article is an open access article distributed under the terms and conditions of the Creative Commons Attribution (CC BY) license (https://creativecommons.org/licenses/by/4.0/).
Share and Cite
Sampsonidis, I.; Marinaki, M.; Pesiridou, A.; Gika, H.; Theodoridis, G.; Siachos, N.; Arsenos, G.; Kalogiannis, S. Cost-Effective Simultaneous Determination of τ- and π-Methylhistidine in Dairy Bovine Plasma from Large Cohort Studies Using Hydrophilic Interaction Ultra-High Performance Liquid Chromatography Coupled to Tandem Mass Spectrometry. Separations 2023, 10, 144. https://doi.org/10.3390/separations10020144
Sampsonidis I, Marinaki M, Pesiridou A, Gika H, Theodoridis G, Siachos N, Arsenos G, Kalogiannis S. Cost-Effective Simultaneous Determination of τ- and π-Methylhistidine in Dairy Bovine Plasma from Large Cohort Studies Using Hydrophilic Interaction Ultra-High Performance Liquid Chromatography Coupled to Tandem Mass Spectrometry. Separations. 2023; 10(2):144. https://doi.org/10.3390/separations10020144
Chicago/Turabian StyleSampsonidis, Ioannis, Maria Marinaki, Anastasia Pesiridou, Helen Gika, Georgios Theodoridis, Nektarios Siachos, Georgios Arsenos, and Stavros Kalogiannis. 2023. "Cost-Effective Simultaneous Determination of τ- and π-Methylhistidine in Dairy Bovine Plasma from Large Cohort Studies Using Hydrophilic Interaction Ultra-High Performance Liquid Chromatography Coupled to Tandem Mass Spectrometry" Separations 10, no. 2: 144. https://doi.org/10.3390/separations10020144
APA StyleSampsonidis, I., Marinaki, M., Pesiridou, A., Gika, H., Theodoridis, G., Siachos, N., Arsenos, G., & Kalogiannis, S. (2023). Cost-Effective Simultaneous Determination of τ- and π-Methylhistidine in Dairy Bovine Plasma from Large Cohort Studies Using Hydrophilic Interaction Ultra-High Performance Liquid Chromatography Coupled to Tandem Mass Spectrometry. Separations, 10(2), 144. https://doi.org/10.3390/separations10020144