Abstract
In this study, a fast, concise and reliable ultra-high performance liquid chromatography-fluorescence (UHPLC/FLD) detection method for simultaneous quantification of avermectins (AVMs), including avermectin (AVM), ivermectin (IVM), emamectin (EMM), moxidectin (MOX) and doramectin (DOR) in six aquatic foods was established. Based on the QuEChERS pretreatment method, the samples were extracted with 0.2% (v/v) ammonia acetonitrile. N-methyl imidazole mixed with acetonitrile (1:1, v/v) and trifluoroacetic anhydride with acetonitrile (1:2, v/v) were used as derivatization reagents. The mobile phase consists of acetonitrile and water with a flow rate of 1.0 mL/min. An Infinity Lab Poroshell 120 EC-C18 column was used for optimum chromatographic separation of target analytes at 40 °C; the excitation and emission wavelengths were set at 365 nm and 465 nm, respectively. In six kinds of aquatic foods, the limits of detection (LODs) of AVM, IVM, EMM, MOX, and DOR were 2.7 μg/kg, 1.8 μg/kg, 2.1 μg/kg, 1.2 μg/kg, and 2.7 μg/kg, respectively, and the limits of quantification (LOQs) of AVM, IVM, EMM, MOX, and DOR were 5 μg/kg, 4.5 μg/kg, 4.5 μg/kg, 3.5 μg/kg and 5.0 μg/kg, respectively. The recoveries were all above 85.38% when the samples were spiked with the target compounds at the concentration level of 5, 10, 50, and 100 μg/kg. The intra-day and inter-day relative standard deviations (RSDs) were all less than 15%. This method considers the requirements of sensitivity, accuracy, and economics of the instrument.
1. Introduction
The avermectins (AVMs), a class of macrocyclic lactones, AVMs are produced by the soil-dwelling actinomycetes Streptomyces avermitilis, including avermectin (AVM), emamectin (EMM), ivermectin (IVM), eprinomectin (EPR), doramectin (DOR) and moxidectin (MOX). The AVM consists of a mixture of AVM B1a (at least 80%) and AVM B1b (not more than 20%). In addition, EMM consists of 90% or more of the B1a component and not more than 10% of the B1b component. Group a and b components belong to secbutyl and isopropyl homologs, respectively, which possess similar toxicological and functional activities, and, therefore, it is unnecessary to separate group a and b components [1]. The mechanism of action involves the stimulation of high-affinity GABA receptors and a consequent increase in membrane chloride ion permeability. Animal studies indicate a wide margin of safety because mammalian species are much less sensitive due to lower GABA receptor affinities and relative impermeability of the blood-brain barrier [2]. With increasing large-scale breeding, various parasitic diseases are seriously hindering economic output in the aquaculture industry. Avermectins (AVMs) in aquaculture are widely used as antiparasitic drugs against internal and external parasites in rainbow trout, crucian carp, sea bass, and so on [3,4,5,6]. The widespread use of these drugs may lead to drug residues in various aquatic products, causing potential risks to human health. For this reason, maximum residue limits (MRLs) on AVMs have been established strictly. Currently, the European Medicines Agency (EMEA) has set a maximum residue limit of EMM in salmon meat and skin of 100 μg/kg [7], the Codex Aliment Arius Commission (CAC) has set a maximum residue limit of 100 μg/kg for EMM in salmon, trout muscle, and fillet (natural ratio of muscle plus skin) [8], the Health Canada has been set maximum residue limits for EMM in muscle and skin of salmonids of 100 μg/kg and 1000 μg/kg, respectively [9], Japan has been stipulated a maximum residue limit of 100 μg/kg for EMM in salmonids such as salmon and trout [10], the World Health Organization (WHO) limits MOX at 20 μg/kg in cattle muscle [11], and the European Union (EU) has been set the maximum residue limit of AVM and EMM in amphibians at 100 μg/kg [12].
Recently, the QuEChERS method has been the preferred method in the field of pesticide multi-residue analysis [13,14,15,16,17]. It involves miniaturized extraction with acetonitrile, liquid–liquid partition by using sodium chloride (NaCl) and magnesium sulfate (MgSO4) as salts. QuEChERS pretreatment method is a common and effective pretreatment method, which is commonly used for pretreatment of residue detection in fruits, vegetables [14,15], and animal-derived food [13,16,17]. AVMs were mostly extracted with acetonitrile; modified QuEChERS methods were used for preparation. For animal samples, NaCl was used [18]. EDTA-treated sand was used for meat sample preparation [19]. Homogenized fish samples were extracted with acetonitrile, magnesium sulfate anhydrous, and sodium chloride [20].
AVMs have been determined mainly in vegetables [21,22,23,24], milk [25,26,27,28], and meat products [19,29,30,31]. Fewer studies have been reported on the determination of fish [13,32,33]. So far, pieces of literature have reported different detection methods for AVMs. Among them, AVM was detected by UPLC- UV in cabbage, where the LOD was 10.9 μg/kg [21], and the LOD of AVM detected by HPLC-UV in rape was 10 μg/kg [22]. Obviously, the LODs of those methods are not excellent enough. Apart from this, the AVM and IVM were detected simultaneously by HPLC-FLD in fish muscle samples, perch, and aquatic products. The LOQ was 3 μg/kg in fish muscle samples [34], the recovery values of AVM and IVM was 78.8–88% in perch [35], and the LOQs of AVM and IVM in aquatic products detected by the same method were both 3 μg/kg within 23 min (mins) [36]. The residues of AVM, IVM, DOR, and MOX were determined simultaneously by HPLC-FLD, and the detection time of each sample was 25 min [37]. The detection method is time-consuming and inefficient. Precision and recovery rates need to be improved. Over and above, detected by UPLC-MS, the LODs of AVM and IVM in milk were 1.0 μg/kg [38], and the LODs of AVM, DOR, and IVM in eel were 0.43~0.32 μg/kg [39]. However, the MS detector is always equipped with electrospray ionization (ESI) sources and is not suitable for mass detection because of its complicated pretreatment and fancy price.
Briefly, UHPLC-FLD combined the advantages of these methods. Not only is the equipment cheaper, but also the precision and the detection time are better, which is suitable for the detection of large quantities of multiple residues. In addition, few existing detection methods can simultaneously detect AVMs, which are widely used in a variety of aquatic products. Therefore, this study intended to establish a rapid, easy, and reliable UHPLC-FLD method to detect five AVMs (AVM, IVM, EMM, DOR, and MOX) simultaneously in aquatic products.
2. Materials and Methods
2.1. Chemicals and Reagents
EMM and IVM (purity ≥ 97.0%) were procured from ChemService (West Chester, PA, USA). AVM, MOX, and DOR (purity ≥ 97.0%) were purchased from Dr. Ehrenstorfer (Augsburg, Germany). HPLC grade acetonitrile, ethyl acetate, and n-hexane used for analysis were all obtained from J. T. Baker (Deventer, Holland). LC-MS grade water was bought from Merck (Darmstadt, Germany). Dimethyl sulfoxide (DMSO) was attained from Sigma-Aldrich (Shanghai, China). Concentrated ammonium water (AR, 25–28%) was ordered from Macklin (Shanghai, China). N-methyl imidazole was purchased from Hwrk Chem (Beijing, China). MgSO4, NaCl, heparin sodium, and trifluoroacetic anhydride were purchased from Sinopharm Chemical Reagent Company (Shanghai, China). The centrifugal tubes and 0.22 µm nylon syringe filters were acquired from CNW Technologies (Shanghai, China).
0.2% (v/v) ammonia acetonitrile solution as an extractant was made by the addition of 0.2 mL ammonia water in 100 mL acetonitrile and mixed well.
2.2. Equipment
An Agilent 1260 Infinity II SFC/UHPLC system (Milford, MA, USA) equipped with a quart solvent manager with a quart solvent pump, a sampler manager with an autosampler, and a fluorescence detector (FLD) was used. Data acquisition was performed by openlab CDS 2 software.
Other equipment, such as KQ 2200 DE ultrasonic cleaner (Ultrasonic Instruments, Kunshan, China), Vortex-HQ-60-IV (TZ-Biotech Develop, Beijing, China), AOSHENG nitrogen blower (Allsheng instrument, Hangzhou, China), Hitachi 20PR-520 automatic high-speed frozen centrifuge (Hitachi, Tokyo, Japan) and AX205 analytical balance (Mettler-Toledo, Zurich, Switzerland) were also applied in this study.
2.3. Standard Solution Preparation
Standard stock solutions were prepared by dissolving 10 mg AVM, IVM, EMM, MOX, and DOR standards in acetonitrile and diluted to a final concentration of 100 mg/L, respectively.
Then, 1 mL AVM, IVM, EMM, MOX, and DOR standard stock solutions were taken, diluted to 10 mL with acetonitrile, respectively, and a single standard solution with a mass concentration of 10 mg/L was prepared.
Finally, 1 mL of AVM, IVM, EMM, MOX, and DOR single standard solutions were placed in the same 100 mL volumetric flasks, diluted and fixed with acetonitrile, containing AVM, IVM, EMM, MOX, and DOR 1 mg/L. All standard solutions were contained in screw thread amber glass bottles and stored at −20 °C.
2.4. Sample Preparation
Six kinds of aquatic samples (green pond frog, eel, grass carp, crayfish, white shrimp, and soft-shelled turtle) were collected from Baishazhou agricultural and sideline products market (Wuhan, China). The eatable tissues were taken and homogenized. The samples were stored at −20 °C.
Before analysis, the samples were thawed at room temperature. Two-gram samples were weighed into a 10 mL centrifuge tube. Briefly, 5 mL of 0.2% ammonia acetonitrile solution was added, then vortexed 30 s and ultrasonically extracted for 2 min. Next, 1.2 g MgSO4 and 0.3 g NaCl were added. After vortexing, the sample was centrifuged at 5000 r/min for 5 min, and then the supernatant was transferred into a new 15 mL centrifuge tube. The residues were re-extracted with 5 mL of 0.2% ammonia acetonitrile solution, and the obtained upper layer was combined, and then 2 mL n-hexane saturated with acetonitrile was added into the tubes and then vortexed 30 s. After centrifugation at 5000 r/min for 5 min, the hexane layer was removed. The tubes filled with extract solution were condensed to dryness by a gentle nitrogen stream at 50 °C. Afterward, 100 μL of derivatization reagent A (N-methyl imidazole and acetonitrile (1:1, v/v)) and 150 μL of derivatization reagent B (trifluoroacetic anhydride and acetonitrile (1:2, v/v)) was added into the tubes. After vortex-mixing evenly, derivatization reaction lasted for 20 min at room temperature. Subsequently, the derivative was reconstituted by 1 mL acetonitrile. Finally, the obtained solution was filtered by 0.22 µm nylon syringe filter for UHPLC-FLD analysis.
2.5. Chromatographic Conditions
The analytical compounds were separated on an Infinity Lab Poroshell 120 EC-C18 column (2.7 μm, 100 mm × 4.6 mm) (Agilent, PaloAlto, CA, USA) at 40 °C. The injection volume was 20 μL. The detector was operated at an excitation wavelength of 245 nm and emission wavelength of 365 nm, respectively. The mobile phase was consisted of water (A) and acetonitrile (B) and applied at a flow rate of 1 mL/min. The chromatographic separation was carried out using gradient elution, the gradient elution program for AVMS separation was shown in Table 1, starting from 94% of eluent B, increased at 99% in 6 min and then kept stable for further 2 min, subsequently, decreased at 94% and re-equilibration time was 5 min, giving a total run time of 13 min.

Table 1.
Gradient elution program for AVMS separation.
2.6. Method Validation
Validation characteristics, including linearity, recovery, and precision were performed according to FDA guidelines for the chromatographic method [40].
Standard calibration curves for AVMs were constructed by plotting AVM’s peak areas versus seven concentrations (5, 10, 50, 100, 200, 500, and 1000 μg/kg) of AVMs in acetonitrile, respectively.
Recovery was determined by analyzing samples spiked at four levels (5, 10, 50, and 200 µg/kg) in six blank replicates, and recoveries were determined by comparing the peak areas of the analytes extracted from the samples with those of the target compounds in the standard solutions.
Precision, including intra-day precision and inter-day precision, was evaluated by relative standard deviation (RSD). As for intra-day precision, samples tested three times in a single day; for inter-day precision, samples were evaluated three times within three days.
When the signal-to-noise ratio (S/N) ≥ 3, the corresponding additive concentration was the LOD of the analytical method. When S/N ≥ 10, the corresponding additive concentration was the LOQ of the analytical method.
3. Results and Discussion
3.1. Optimization of Detection Wavelengths
Detection wavelengths (excitation wavelengths and emission wavelengths) are necessary parameters for fluorescence detection and can directly affect the sensitivity of detection. According to national standards [41,42,43] and previous studies [25,26,27,29,44], we make adjustments to the excitation wavelength and emission wavelength. Ultimately, according to the sensitivities and responses of target compounds, the excitation wavelength and emission wavelength of the target compounds were chosen as 245 and 365 nm, respectively.
3.2. Optimization of the Mobile Phase
The study used a gradient elution procedure, which started with 94% of acetonitrile, increased to 99% in 6 min, and was then kept stable for a further 2 min; it subsequently decreased at 94%, and re-equilibration time was 5 min.
Several mobile phases were tested: (1) MeOH:ACN (1:1, v/v) with 0.1% formic acid [45], (2): acetonitrile and aquatic 0.1 mM ammonium format containing 0.1% formic acid [30], (3): 10 mM TEA aqueous solution and acetonitrile [14], and (4): acetonitrile and water.
Because of the complex composition of these mobile phases and the appropriate peak shapes and peak areas, (4): acetonitrile and water were selected. The influence of different mobile phase additives on the peak area of 100 μg/kg standard AVMs was illustrated in Figure 1.
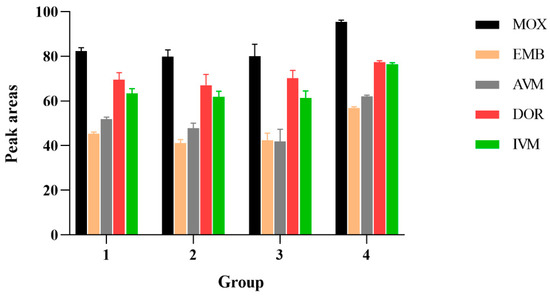
Figure 1.
The influence of different mobile phase additives on the peak area of 100 μg/kg standard AVMs. 1: MeOH: ACN (1:1, v/v) with 0.1% formic acid; 2: acetonitrile and aquatic 0.1 mM ammonium format containing 0.1% formic acid; 3: 10 mM TEA aqueous solution and acetonitrile; 4: acetonitrile and water.
When acetonitrile accounted for 90% of the mobile phase, the peak was unstable; when the mobile phase ratio was 99:1, the baseline chromatogram was stable, the analysis time was shortened, and the separation effects of each target were optimal. Compared to the isocratic elution procedure, high responses and sharp peak shapes were obtained from gradient elution procedures.
3.3. Optimization of Column Temperature
The analytes were commonly separated on a C18 column [39,45,46,47]. In our study, the same stationary column was used. Proper column temperature can reduce the separation time of the target analytes and optimize the peak shapes. In this study, the chromatographic peak shapes of five target compounds were tested at different chromatographic column temperatures (30 °C, 35 °C, and 40 °C), the result is shown in Figure 2, the retention times are listed in Table 2 and the tailing factors are listed in Table A1 (Appendix A). When the column temperature was 30 °C, the retention times of the target compounds were delayed. When the column temperature was set to 35 °C or 40 °C, the peak shape of the target analytes was improved, and the separation of the peaks was affected. When the temperature increased to 40 °C, earlier retention time, complete separation, and no interaction between compounds were obtained. Ultimately, considering excessive temperature would cause irreversible damage to the column, a column temperature of 40 °C was selected in this study.
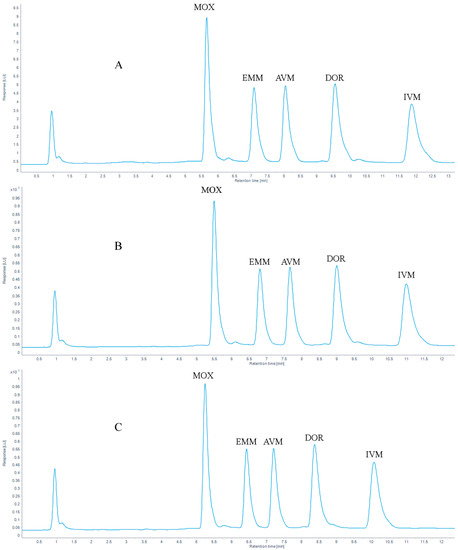
Figure 2.
Chromatogram of 100 μg/kg AVMs standards at (A) 30 °C, (B) 35 °C and (C) 40 °C.
Table 2.
The retention time of 100 μg/kg AVMs standard at 30 °C, 35 °C and 40 °C.
3.4. Optimization of Sample Preparation
AVMs were mainly extracted by acetonitrile [28,30,39,48,49,50]; based on the previous research, four different solutions were tested in order to optimize the extracts of the selected compounds: 1: acetonitrile; 2: 0.2% ammonia acetonitrile solution; 3: acetyl acetate; 4: acetonitrile: ethyl acetate (1:1, v/v). The result is shown in Figure 3; the drug recovery rates were 47.11% to 116.43% by extracted with acetonitrile, 75.65% to 114.39% through using 0.2% ammonia acetonitrile solution, 16.84% to 44.08% by extracting with acetonitrile: ethyl acetate (1:1, v/v) and when ethyl acetate was used as the extracting agent, the recovery rate of AVM, IVM, MOX, and DOR reached 32.34% to 44.49%, and the EMM recovery rate was only 3.94% to 5.47%. In conclusion, 0.2% ammonia acetonitrile solution as extractant has a higher recovery rate than other extractants; therefore, 0.2% ammonia acetonitrile solution was finally selected as the extractant.
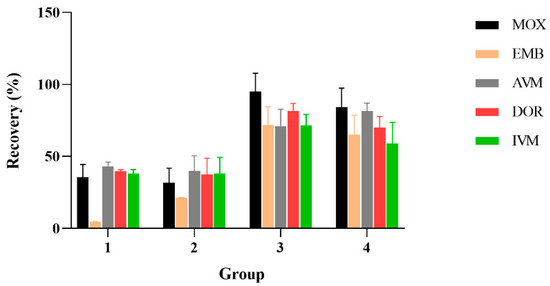
Figure 3.
Effect of different extract reagents on the recoveries of the five AVMs (n = 6). 1: extraction agent is ethyl acetate; 2: extraction agent is ethyl acetate mixed with acetonitrile (1:1); 3: extraction agent is 0.2% ammonia acetonitrile; 4: extraction agent is acetonitrile.
For the simultaneous determination of organic pollutants in aquatic products, 4 g MgSO4, 1 g NaCl, 1 g sodium citrate, and 0.5 g disodium citrate sesquihydrate were added to samples [51]. A total of 2 g MgSO4 and 2 g anhydrous sodium sulfate were used for the simultaneous determination of AVMs in aquatic products [13]. For animal samples, 3 g NaCl was used for the determination of AVMs [18].
Refereed to the relevant literature, we added 3 g MgSO4 with 1 g NaCl; however, the extractant was significantly reduced. Subsequently, we adjusted the amount of MgSO4 and NaCl, 1.2 g MgSO4 with 0.3 g NaCl was added. The results showed no significant reduction in extractant and good drug recoveries; therefore, the combination of 1.2 g MgSO4 with 0.3 g NaCl was selected as a purifying agent.
Regarding derivatization reaction time, some studies have shown that the best derivatization reaction time was 15 min [34,35,52]. In addition, AVMs in milk samples were taken 30 min at 70 °C [25], and announcement No. 1025-5-2008 of the Ministry of Agriculture and Rural Affairs (MARA) mentioned that AVMs in the bovine liver, muscle, and porcine liver were determined and their derivatization reactions were carried out at 96 °C for 100 min [43]. In another study, AVMs in cattle, sheep, and swine muscle were derived for 60 min at 67 ± 2 °C [53].
In order to screen out the optimal derivatization reaction time, the effect of derivatization reaction time on drug detection was examined using standard working solution samples configured at a concentration of 1 μg/mL for 10, 15, 10, 20, 30, 40, 50, and 60 min. The result was shown in Figure 4; the peak areas of all five drug-derived products were maximum at 20 min and remained constant for 1 h after the derivatization products. Therefore, the derivatization reaction was performed for 20 min at room temperature. Considering the stability of AVMs, the drug-derived reaction was performed in a brown inlet sample vial.
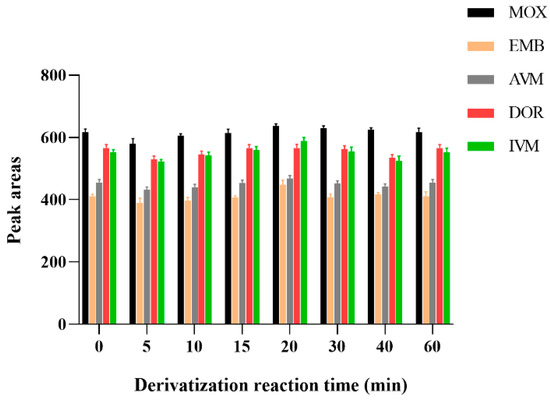
Figure 4.
Effect of different derivatization reaction time on the recoveries of the five AVMs (n = 6).
3.5. Validation Results of the Method
The chromatograms of 100 μg/kg AVMs standards are shown in Figure 5. With mass concentration as the abscissa and peak area as the ordinate, the linear regression equations and coefficients of determination (R2) of the standard working fluids are shown in Table 3. The results showed that the correlation coefficient (R2) ≥ 0.999 in the concentration range of 5 to 1000 μg/kg.
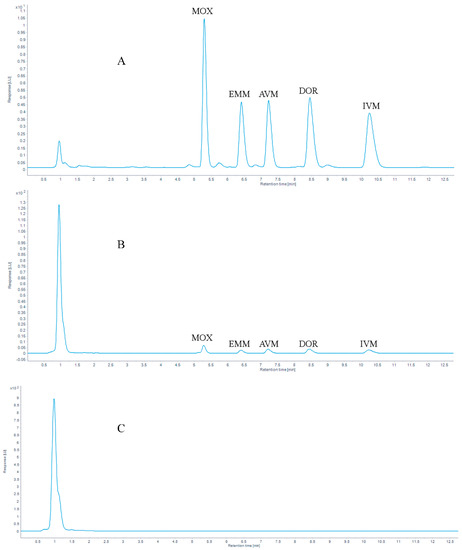
Figure 5.
Chromatograms of (A) 100 μg/kg five AVMs standards, (B) 10 μg/kg five AVMs standards spiked in a grass carp muscle sample and (C) a blank grass carp muscle sample.
Table 3.
Regression equations and correlation coefficients of five AVMs in matrix matching standard solutions.
The LOQs (S/N ≥ 10) and LODs (S/N ≥ 3) of AVMs were examined. The results are listed in Table 4. These values are lower than the LOQ values obtained in previous studies [54,55,56,57]; the summary of date validation obtained by others authors is listed in Table 5.
Table 4.
LODs and LOQs of five AVMs in matrix matching standard solutions.
Table 5.
Summary of dates validation obtained by others authors.
The results of the recovery and precision are listed in Table 6, Table 7 and Table 8. When the concentrations of AVMs were added to blank samples at 5, 10, 50, and 100 μg/kg levels, the recovery rates of the AVMs were ≥ 85.38%, and the RSDs were ≤13.62%.
Table 6.
Recoveries of five AVMs in aquatic products (n = 6).
Table 7.
Intra-day precision of five AVMs in aquatic products (n = 6).
Table 8.
Inter-day precisions of five AVMs in aquatic products (n = 6).
4. Real Sample Analysis
To evaluate the feasibility and applicability of the present method, 72 samples, including common frogs (pond green frog and bullfrog), crustaceans (proto-shrimp, white shrimp), and freshwater farmed fish (crucian carp, grass carp, yellow jawed fish, silver carp, carp, bighead carp, bluefish, and loach) sold in Baishazhou agricultural and sideline products market (Wuhan, China). AVMs residues were not detected in most of the samples; however, AVM was detected in grass carp, ranging from 5.59 to 18.04 μg/kg, which is listed in Table 9. AVMs residues were not detected in the actual samples in other studies [13,34]. The main reason may be that AVMs are highly toxic to fish, and the concentration should be kept at a low level in use.
Table 9.
Data of real sample analysis (n = 6).
5. Conclusions
A fast and effective sample preparation method coupled with the UHPLC-FLD method was established for the detection of multiple residues of AVMs in multi-kinds of aquatic products. The extraction method exhibited a good linear relationship (R2 ≥ 0.999), the obtained recoveries were all greater than 85.38%, and the RSDs were ≤13.62%. This method was found to have relatively high sensitivity, great precision, and a short detection time. Moreover, the newly developed method was successfully applied to the analysis of real samples, which proved the applicability of this method.
Author Contributions
R.S. and X.D.: Conceptualization, Methodology, Investigation, Data Curation, Writing-Original Draft. Y.L.: Resources, Writing-Review and Editing, Project administration. X.A.: Supervision, Resources. X.Z.: Software, Validation. All authors have read and agreed to the published version of the manuscript.
Funding
This study was supported financially by the National Key Research and Development Program of China (2019YFD0901701), the Central Public-interest Scientific Institution Basal Research Fund, CAFS (2020JBF06), and Chinese Agricultural Standard (SCB-20026).
Institutional Review Board Statement
The animal study protocol and care of animals were approved by the Fish Ethics Committee of Yangtze River Fisheries Research Institute, Chinese Academy of Fishery Sciences, Wuhan, China (ID 2021-Liu Yongtao-03).
Informed Consent Statement
The study did not involve humans.
Data Availability Statement
Not applicable.
Conflicts of Interest
The authors declare no conflict of interest.
Appendix A
Table A1.
The tailing factor of 100 μg/kg AVMs standard at 30 °C, 35 °C and 40 °C.
Table A1.
The tailing factor of 100 μg/kg AVMs standard at 30 °C, 35 °C and 40 °C.
| Compound | Tailing Factor | ||
|---|---|---|---|
| 30 °C | 35 °C | 40 °C | |
| MOX | 1.25 | 1.17 | 1.14 |
| EMM | 1.14 | 1.15 | 1.09 |
| AVM | 1.17 | 1.12 | 1.07 |
| IVM | 1.24 | 1.22 | 1.14 |
| DOR | 1.25 | 1.21 | 1.15 |
References
- Horvat, A.; Babić, S.; Pavlović, D.; Ašperger, D.; Pelko, S.; Kaštelan-Macan, M.; Petrović, M.; Mance, A. Analysis, occurrence and fate of anthelmintics and their transformation products in the environment. TrAC Trends Anal. Chem. 2012, 31, 61–84. [Google Scholar] [CrossRef]
- Bai, S.H.; Ogbourne, S. Eco-toxicological effects of the avermectin family with a focus on abamectin and ivermectin. Chemosphere 2016, 154, 204–214. [Google Scholar] [CrossRef] [PubMed]
- Horsberg, T.E. Avermectin use in aquaculture. Curr. Pharm. Biotechnol. 2012, 13, 1095–1102. [Google Scholar] [CrossRef] [PubMed]
- Braun, E.; Hochwartner, O.; Tichy, A.; Joachim, A.; Licek, E. Safety and efficacy of antiparasitic drugs for treatment of salmonids in breeding carp (Cyprinus carpio morpha domestica). Wien. Tierarztl. Mon. 2008, 95, 210–218. [Google Scholar]
- Hanson, S.K.; Hill, J.E.; Watson, C.A.; Yanong, R.P.E.; Endris, R. Evaluation of emamectin benzoate for the control of experimentally induced infestations of Argulus sp. in goldfish and koi carp. J. Aquat. Anim. Health 2011, 23, 30–34. [Google Scholar] [CrossRef]
- Reimschuessel, R.; Gieseker, C.; Poynton, S. In vitro effect of seven antiparasitics on Acolpenteron ureteroecetes (Dactylogyridae) from largemouth bass Micropterus salmoides (Centrarchidae). Dis. Aquat. Organ 2011, 94, 59–72. [Google Scholar] [CrossRef]
- European Food Safety Authority. Conclusion on the peer review of the pesticide risk assessment of the active substance emamectin. EFSA J. 2012, 10, 2955. [Google Scholar] [CrossRef]
- CAC/MRL 2-2015; Maximum Residue Limits for Veterinary Drugs in Foods. Updated as at the 35th Session of the Codex Alimentarius Commission; Food and Agriculture: Rome, Italy, 2015.
- Government of Canada. The List of Maximum Residue Limits for Veterinary Drugs in Foods; Government of Canada: Ottawa, ON, Canada, 2017. [Google Scholar]
- JFCRF. Maximum Residue Limits Lists or Agricultural Chemicals in Foods; The Japan Food Chemical Research Foundation: Osaka, Japan, 2017. [Google Scholar]
- WHO. Toxicological Evaluation of Certain Veterinary Drug Residues in Food; WHO: Geneva, Switzerland, 2009; pp. 1–134. [Google Scholar]
- EU. Establishment by the European Community of Maximum Residue Limits (MRLs) for Residues of Veterinary Medicinal Products in Foodstuffs of Animal Origin; EU: Maastricht, The Netherlands, 1991. [Google Scholar]
- Liu, Y.T.; Yu, L.X.; Wang, Z.Y.; Yang, Q.H.; Ai, X.H. Simultaneous determination of seven avermectin residues in aquatic products by modified QuEChERS combined with high-performance liquid chromatography-tandem mass spectrometry. Chin. J. Chromatogr. 2017, 35, 1276–1285. [Google Scholar] [CrossRef]
- Rúbies, A.; Antkowiak, S.; Granados, M.; Companyó, R.; Centrich, F. Determination of avermectins: A QuEChERS approach to the analysis of food samples. Food Chem. 2015, 181, 57–63. [Google Scholar] [CrossRef]
- Lehotay, S.J.; Son, K.A.; Kwon, H.; Koesukwiwat, U.; Fu, W.; Mastovska, K.; Hoh, E.; Leepipatpiboon, N. Comparison of QuEChERS sample preparation methods for the analysis of pesticide residues in fruits and vegetables. J. Chromatogr. A 2010, 1217, 2548–2560. [Google Scholar] [CrossRef]
- Zhang, W.J.; Lian, G.Y.; Guo, X.X.; Yang, X.L.; Song, H. Determination of avermectin residues in 10 foods by Ultra-high performance liquid chromatography-tandem mass spectrometry. Food Sci. 2012, 33, 226–231. [Google Scholar]
- Zheng, W.D.; Hu, J.T.; Yin, W.Y.; Sheng, Y.; Wu, Z.X. Determination of avermectin and ivermectin residues in pork liver by high performance liquid chromatography-tandem mass spectrometry. Food Sci. 2011, 32, 185–188. [Google Scholar]
- Qin, Y.; Jatamunua, F.; Zhang, J.; Li, Y.; Han, Y.; Zou, N.; Shan, J.; Jiang, Y.; Pan, C. Analysis of sulfonamides, tilmicosin and avermectins residues in typical animal matrices with multi-plug filtration cleanup by liquid chromatography–tandem mass spectrometry detection. J. Chromatogr. B 2017, 1053, 27–33. [Google Scholar] [CrossRef] [PubMed]
- Tao, Y.F.; Yu, G.; Chen, D.M.; Pan, Y.H.; Liu, Z.L.; Wei, H.M.; Peng, D.P.; Huang, L.L.; Wang, Y.L.; Yuan, Z.H. Determination of 17 macrolide antibiotics and avermectins residues in meat with accelerated solvent extraction by liquid chromatography–tandem mass spectrometry. J. Chromatogr. B 2012, 897, 64–71. [Google Scholar] [CrossRef] [PubMed]
- Rafidah, I.; Ghanthimathi, S.; Fatimah, A.; Mahyudin, N. Effectiveness of different cleanup sorbents for the determination of avermectins in fish by liquid chromatography tandem mass spectrometry. Anal. Methods 2013, 5, 4172–4178. [Google Scholar] [CrossRef]
- Qin, G.X.; Lao, S.B.; Mo, R.F.; Zhou, Q.F.; He, J.; Yang, Y.X.; Luo, L.H.; Li, T. Determination of Abamectin Residues in Cabbage and Orange by Ultra Performance Liquid Chromatography. Mod. Food Sci. Technol. 2018, 34, 227–231. [Google Scholar]
- Qu, Y.y.; Yong, Y.h.; Yu, Y.; Ji, L.; Chen, B.; Li, T.t. Detection of Abamectin Residues in Rape by HPLC. Pestic. Sci. Adm. 2022, 43, 23–27. [Google Scholar]
- Xiong, Z. HPLC Determination Method for the Avermectin Content in the Vegetable Samples. Shandong Chem. Ind. 2017, 46, 2. [Google Scholar]
- Wu, T.h. Multi-Residues Determination of Abamectin and Emamectin Benzoate in Cucumber and Soil by HPLC-FLD. Guangdong Chem. Ind. 2016, 43, 3. [Google Scholar]
- Berendsen, B.J.; Mulder, P.P. The derivatisation of avermectins and milbemycins in milk: New insights and improvement of the procedure. Anal. Chim. Acta 2007, 585, 126–133. [Google Scholar] [CrossRef] [PubMed]
- Kolberg, D.; Presta, M.; Wickert, C.; Adaime, M.B.; Zanella, R. Rapid and accurate simultaneous determination of abamectin and ivermectin in bovine milk by high performance liquid chromatography with fluorescence detection. J. Braz. Chem. Soc. 2009, 104, 799–800. [Google Scholar] [CrossRef]
- Furlani, R.P.; Dias, F.F.; Nogueira, P.M.; Gomes, F.M.; Tfouni, S.A.; Camargo, M.C. Occurrence of macrocyclic lactones in milk and yogurt from Brazilian market. Food Control. 2015, 48, 43–47. [Google Scholar] [CrossRef]
- Rübensam, G.; Barreto, F.; Hoff, R.B.; Kist, T.L.; Pizzolato, T.M. A liquid–liquid extraction procedure followed by a low temperature purification step for the analysis of macrocyclic lactones in milk by liquid chromatography–tandem mass spectrometry and fluorescence detection. Anal. Chim. Acta 2011, 705, 24–29. [Google Scholar] [CrossRef] [PubMed]
- Xia, X.; Xiao, Z.M.; Huang, Q.S.; Xia, L.J.; Zhu, K.; Wang, X.L.; Shen, J.Z.; Ding, S.Y. Simultaneous determination of avermectin and milbemycin residues in bovine tissue by pressurized solvent extraction and LC with fluorescence detection. Chromatographia 2010, 72, 1089–1095. [Google Scholar] [CrossRef]
- Inoue, K.; Yoshimi, Y.; Hino, T.; Oka, H. Simultaneous determination of avermectins in bovine tissues by LC-MS/MS. J. Sep. Sci. 2009, 32, 3596–3602. [Google Scholar] [CrossRef]
- Li, X.; Wang, M.M.; Zheng, G.Y.; Ai, L.F.; Wang, X.S. Fast and online determination of five avermectin residues in foodstuffs of plant and animal origin using reusable polymeric monolithic extractor coupled with LC-MS/MS. J. Agric. Food Chem. 2015, 63, 4096–4103. [Google Scholar] [CrossRef]
- Chen, J.; Luo, Y.H.; Fu, L.Z. Multi-residue Determination of Avermectin and Ivermectin in Grass Carp Muscle Tissues by HPLC. Chin. J. Vet. Drug 2009, 43, 17–20. [Google Scholar]
- Lopes, R.P.; Reyes, R.C.; Romero-González, R.; Vidal, J.L.M.; Frenich, A.G. Multiresidue determination of veterinary drugs in aquaculture fish samples by ultra high performance liquid chromatography coupled to tandem mass spectrometry. J. Chromatogr. B 2012, 895, 39–47. [Google Scholar] [CrossRef]
- Wang, W.L.; Liu, Y.H.; Zu, X.J.; Ju, S.; Li, X.Y.; Du, X.Y.; Yan, C.M.; Liu, H.J. Sample preparation for avermectin and ivermectin drug residue determination in fish muscle. Chin. J. Anal. Lab. 2015, 34, 475–479. [Google Scholar]
- Xing, L.H.; Leng, K.L.; Zhai, Y.X.; Li, Z.X.; Ma, B. HPLC with fluorescence detection for determination of avermectin and ivermectin residues in Lateolabrax japonicus. Mar. Fish. Res. 2008, 04, 52–57. [Google Scholar]
- Yu, J.; ZHAO, F.J.; Hong, X. Determination of abamectin and ivermectin in aquatic product by HPLC-FD. Chin. J. Health Lab. Technol. 2019, 29, 3. [Google Scholar]
- Zhang, R.; Wang, H.T.; Yao, Y.L.; Duan, H.G. Detection of four avermectin residues in animal foods by pre-column derivatization high performance liquid chromatography. Sci. Insp. Quar. 2008, 8, 52–57. [Google Scholar]
- Xin, Z.; Ai-jun, L.; Li-xue, D.; Tong-tong, Z.; Bai-qin, Z. Determination of Residue of Avermectin and lvermectin in Milk by Ultra Performance Liquid Chromatography Tandem Mass Spectrum. Food Ind. 2018, 39, 325–327. [Google Scholar]
- Gao, H.P.; Zhang, J.L.; Fu, L.I.; Shen, W.J.; Yun, W.Z.; Rong, W.Q. Rapid Determination of Residual Avermectins Pesticides in Eel by Ultra Performance Liquid Chromatography-Tandem Mass Spectrometry. J. Chin. Mass Spectrom. Soc. 2008, 29, 337–342. [Google Scholar]
- FDA. Guidance for Industry Bioanalytical Method Validation; U.S. Department of Health and Human Services: Washington, DC, USA; Food and Drug Administration: Washington, DC, USA; Center for Drug Evaluation and Research (CDER): Washington, DC, USA; Center for Veterinary Medicine (CVM): Washington, DC, USA, 2001. [Google Scholar]
- SAMR; SAC. Emamectin Benzoate Technical Material; Standardization Administration; State Administration for Market Regulation: Beijing, China, 2020; p. 12. [Google Scholar]
- MARA. National Food Safety Standard Determination of Multiple Residues of Avermectin and Ivermectin in Aquatic Products High Performance Liquid Chromatography; Ministry of Agriculture of the People’s Republic of China: Beijing, China; National Health and Family Planning Commission of the People’s Republic of China: Beijing, China, 2013; p. 8. [Google Scholar]
- MARA. National Food Safety Standards Determination of Avermectins Residues in Animal Derived Food by High Performance Liquid Chromatography and Liquid Chromatography-Tandem Mass Spectrometric Method; Ministry of Agriculture of the People’s Republic of China: Beijing, China, 2008; p. 17P;A4. [Google Scholar]
- Giannetti, L.; Giorgi, A.; Necci, F.; Ferretti, G.; Buiarelli, F.; Neri, B. Validation study on avermectine residues in foodstuffs. Anal. Chim. Acta 2011, 700, 11–15. [Google Scholar] [CrossRef] [PubMed]
- Moschou, I.C.; Dasenaki, M.E.; Thomaidis, N.S. Ionization study and simultaneous determination of avermectins and milbemycines in fish tissue by LC-ESI-MS/MS. J. Chromatogr. B 2019, 1104, 134–140. [Google Scholar] [CrossRef] [PubMed]
- Xie, W.-M.; Ko, K.-Y.; Kim, S.-H.; Chang, H.-R.; Lee, K.-S. Determination of abamectin residue in paprika by high-performance liquid chromatography. Korean J. Environ. Agric. 2006, 25, 359–364. [Google Scholar] [CrossRef]
- Li, Z.; Xie, X.C.; Zhan, X.P. Multi-Residues Determination of Abamectin, Emamectin Benzoate and Ivermectin in Vegetables by HPLC-FD. Sci. Agric. Sin. 2010, 43, 3467–3472. [Google Scholar]
- Zhou, X.J.; Zhou, S. Determination of Avermectin Residues in Aquatic Products by ASE-SPE-HPLC-MS/MS. Anhui Agric. Sci. 2014, 42, 7406–7408. [Google Scholar]
- Lu, Z.; Oasis, H.L.B. purification and determination of avermectin residues in frozen shrimp by UPLC-MS/MS. Mod. Instrum. 2011, 17, 66–69. [Google Scholar]
- GB/T 22953-2008; Determination of Ivermectin, Abamectin, Doramectin and Eprinomectin Residues in Fugu Eel and Baked Eel—LC-MS-MS Method. General Administration of Quality Supervision, Inspection and Quarantine of the People’s Republic of China: Beijing, China; Standardization Administration of the People’s Republic of China: Beijing, China, 2008; p. 16.
- Kim, K.; Choi, Y.; Mok, S.; Moon, H.B.; Jeon, J. Optimization of the QuEChERS method for multi-residue analysis of pharmaceuticals and pesticides in aquaculture products. Food Chem. 2023, 399, 133958. [Google Scholar] [CrossRef] [PubMed]
- Zhang, Y.J.; Shen, X.; Li, D.; Li, Q.; Wang, H.J. Derivatization of Avermectin in residues Detection. Chin. J. Vet. Drug 2020, 54, 18–22. [Google Scholar]
- Liu, Y.G.; Ya, S.U.; Han, Q.; Bao, Q.S. Improved Method for Determination of Ivermectin Residues in Cattle, Sheep and Swine Muscle by HPLC. Chin. J. Vet. Drug 2007, 7, 28–31. [Google Scholar]
- Carro, A.M.; García-Rodríguez, D.; Gonzalez-Siso, P.; Lorenzo, R.A. Determination of chemotherapeutic agents in fish and shellfish by matrix solid-phase dispersion and liquid chromatography-tandem mass spectrometry. J. Sep. Sci. 2012, 35, 2866–2874. [Google Scholar] [CrossRef] [PubMed]
- Rodrigues, N.R.; Paula, A.; Souza, F.D.; Rubbo, P.E. Validation of a Method for Analysis of Avermectins Residues in Bovine Milk by HPLC-Fluorescence Detector. SAP 2016, 6, 87–92. [Google Scholar]
- Souza, S.V.C.d.; Lima, J.A.; Teodoro, J.C.; Junqueira, R.G. Validação intralaboratorial de método quantitativo para determinação múltipla de resíduos de avermectinas em leite bovino por cromatografia líquida de alta eficiência com detecção de fluorescência. J. Food Sci. Technol. 2007, 27, 823–836. [Google Scholar] [CrossRef]
- Machado, S.; Rezende, A.R. Development of HPLC-Fluorescence Method for the Determination of Ivermectin Residues in Commercial Milk. J. Exp. Food Chem. 2016, 2, 2. [Google Scholar] [CrossRef]


Disclaimer/Publisher’s Note: The statements, opinions and data contained in all publications are solely those of the individual author(s) and contributor(s) and not of MDPI and/or the editor(s). MDPI and/or the editor(s) disclaim responsibility for any injury to people or property resulting from any ideas, methods, instructions or products referred to in the content. |
© 2023 by the authors. Licensee MDPI, Basel, Switzerland. This article is an open access article distributed under the terms and conditions of the Creative Commons Attribution (CC BY) license (https://creativecommons.org/licenses/by/4.0/).