Article

Development and Validation of a Bioanalytical Method for the Quantification of Nitrated Fatty Acids in Plasma Using LC-MS/MS: Application to Cardiovascular Patients

by
Magy Maged Herz
1,*,
Mohamed Zakaria Gad
2 and
Rasha Sayed Hanafi
1,*
1
Department of Pharmaceutical Chemistry, German University in Cairo, New Cairo 11835, Egypt
2
Department of Biochemistry, German University in Cairo, New Cairo 11835, Egypt
*
Authors to whom correspondence should be addressed.
Separations 2023, 10(2), 87; https://doi.org/10.3390/separations10020087
Submission received: 22 December 2022 / Revised: 19 January 2023 / Accepted: 20 January 2023 / Published: 27 January 2023
(This article belongs to the Section Chromatographic Separations)

Abstract

:
Nitrated fatty acids (NO2-FAs) are a newly discovered class of biologically active compounds with distinct biochemical features that induce physiologically beneficial alterations in transcriptional regulatory protein function, leading to a variety of modulatory and protective actions. The most common NO2-FAs identified in vivo so far are nitro oleic acid (NO2-OA), nitro linoleic acid (NO2-LA) and its structural isomer nitro-conjugated linoleic acid (NO2-cLA). Analytical limitations that compromise accurate quantitation of these endogenous compounds are their low concentrations, compromised stability and different distribution profiles in tissues and biofluids. As a result, reliable analytical methods for the quantitative determination of their endogenous levels are rare. Only NO2-OA was quantified by GC-MS while LC-MS methods are still scarce. In this work, an LC-MS/MS bioanalytical method was developed and validated for the quantification of NO2-OA and NO2-LA in human plasma via a standard addition protocol after protein precipitation, liquid extraction and LC-MS/MS analysis in the negative ion mode. Quantification was performed via multiple reaction monitoring of the transitions m/z 326 > 46 and m/z 324 > 46 for NO2-OA and NO2-LA, respectively, and m/z 269 > 250 for the internal standard heptadecanoic acid. Linear responses were observed for both analytes over the studied range (R2 = 0.9805 and 0.9644 for NO2-OA and NO2-LA, respectively). Sufficient accuracy and precision were also achieved at low, medium and high levels within the linearity range. The limits of quantification of our method (2 nM for both NO2-FAs) were below basal endogenous levels, thereby providing a good tool to accurately measure these NO2-FAs in plasma. We applied the validated method to compare NO2-OA and NO2-LA levels in the plasma of 28 ischemic heart disease (IHD) patients and 18 healthy controls. The levels of NO2-OA were found to be significantly higher in the plasma of patients (21.7 ± 9.8 nM) versus healthy controls (12.6 ± 6 nM) (p-value < 0.01). Whereas the levels of NO2-LA were comparable in both groups (3 ± 1 nM in patients, 3.2 ± 1.7 nM in controls, p-value = 0.87288). The early elevation of NO2-OA in plasma samples, which were collected 2–3 h post myocardial injury, implies the potential use of NO2-OA levels as a biomarker for IHD after further investigation with a larger number of IHD patients. To our knowledge, this is the first comparative study on the levels of NO2-FAs in humans with and without IHD.

Graphical Abstract

1. Introduction

During the last decade, nitrated lipids have attracted the interest of the scientific community as endogenous signaling molecules with regulatory roles in both health and disease. The most prevalent nitrated lipids identified to date are nitro fatty acids (NO2-FAs). These important bioactive molecules are associated with several biological effects, such as anti-inflammatory, anti-hypertensive, anti-thrombotic, cytoprotective and anti-tumorigenic effects [1]. They have been widely detected in several tissues and biofluids with elevated levels during inflammatory conditions [2]. These compounds can be formed from a wide range of fatty acids; however the most common NO2-FAs identified in vivo until now are nitro oleic acid (NO2-OA), nitro linoleic acid (NO2-LA) and nitro-conjugated linoleic acid (NO2-cLA) [1] (Figure 1). They are formed endogenously through a non-enzymatic process in which reactive nitrogen species (RNS) such as nitrite (NO2), nitrogen dioxide (NO2), nitronium cation (NO2+) and peroxynitrite (ONOO) react with unsaturated fatty acids [1,3]. This reaction occurs during several biological processes such as digestion, metabolic stress and inflammatory conditions.
Owing to the strong electro-withdrawing characteristics of the nitro group, these molecules are highly reactive with electrophilic properties. This electrophilic nature results in rapid and reversible Michael addition reactions with nucleophilic cysteine residues of proteins, leading to post-translational protein modifications and some subsequent pleiotropic effects that are attributed to NO2-FAs [5].
Recovery of NO2-FAs from biological samples and their accurate quantification is challenging for several reasons; such as their low endogenous concentrations, stability issues and metabolism, as well as their different distribution among tissues and biofluids [6]. These limitations make them lack specific standardized and reproducible methods for their accurate determination in biological samples. Most research efforts focus on their therapeutic activity [7,8,9,10,11], yet other aspects such as the possibility to consider them biomarkers for inflammatory diseases are not yet addressed due to the previously mentioned analytical limitations.
As a matter of fact, NO2-FAs have a high potential to emerge as a novel class of agents for the regulation of cardiovascular diseases (CVD); given not only their potent effects demonstrated in different disease animal models [2,12,13], but also their modulation of strategically important pathways underlying CVD [14,15,16]. Among all types of CVD, ischemic heart diseases (IHD) rank as the most prevalent and the number one cause of death globally. They manifest clinically as myocardial infarction (MI) and ischemic cardiomyopathy [17]. The discovery of novel biomarkers reflecting these events has always been a compelling area of research to identify at-risk individuals at an early stage and improve their treatment strategies [18,19,20]. Inflammatory conditions encountered in IHD events, which also involve high levels of reactive oxygen species (ROS) as well as compromised antioxidant defense mechanisms, imply the possible involvement of NO2-FAs.
This work aims to develop, optimize and validate a bioanalytical method that accurately quantifies endogenous NO2-FAs in human plasma. The method is applied to determine the levels of NO2-OA and NO2-LA in the plasma of IHD patients in comparison to healthy controls through a targeted lipidomic approach, in an attempt to explore their potential as novel biochemical markers for IHDs. While previous methodologies have been reported for measuring NO2-FAs in biological matrices, endogenous concentrations were not measured through these methods because they are at or near the limits of detection of these methods. The bioanalytical method provided here aims to provide precise and accurate quantification of endogenous NO2-FAs in human plasma through a highly specific and sensitive liquid chromatography tandem mass spectrometry (LC-MS/MS) MRM method, using a standard addition quantification procedure. To our knowledge, this is the first validated LC-MS/MS method for the quantification of endogenous NO2-FAs and the first comparative study of the levels of NO2-FAs in humans with and without IHDs, using a validated bioanalytical method.

2. Materials and Methods

2.1. Standards and Consumables

Oleic acid (OA) (1 g, ≥99%), linoleic acid (LA) (1 g, ≥99%) and heptadecanoic acid (HDA) as an internal standard (1 g, ≥98%) were purchased from Sigma-Aldrich (Schnelldorf, Germany). 9-Nitro oleic acid (50 μg, ≥98%), 10-Nitro linoleic acid (50 μg, ≥95%) and 10-Nitro conjugated linoleic acid (50 μg, ≥98%) were purchased from Cayman (Michigan, USA). HPLC grade acetonitrile (ACN), methanol, glacial acetic acid, ammonium hydroxide and diethyl ether (DEE) were purchased from Sigma-Aldrich (Schnelldorf, Germany). Butylated hydroxy toluene (BHT) was purchased from Loba Chemie (Mumbai, India). 2-mL UPLC vials and 150 μL vial inserts were purchased from Waters (Milford, MA, USA). Potassium EDTA plasma collection tubes were purchased from Kemico (Al Obour, Cairo, Egypt).

2.2. Bioanalytical Method Development

2.2.1. Synthesis of NO2-FAs

Initial development and optimization of the bioanalytical method were performed using in-house synthesized NO2-OA and NO2-LA through a nitroselenation/nitromercuriation reaction previously described by Woodcock et al. [6]. Purification of synthesized NO2-OA was conducted by column chromatography as described by Woodcock et al. [6], whereas NO2-LA was purified by flash purification via the PuriFlash 4100 system using tetrahydrofuran and water to obtain a higher yield.

2.2.2. Optimization of MS Parameters

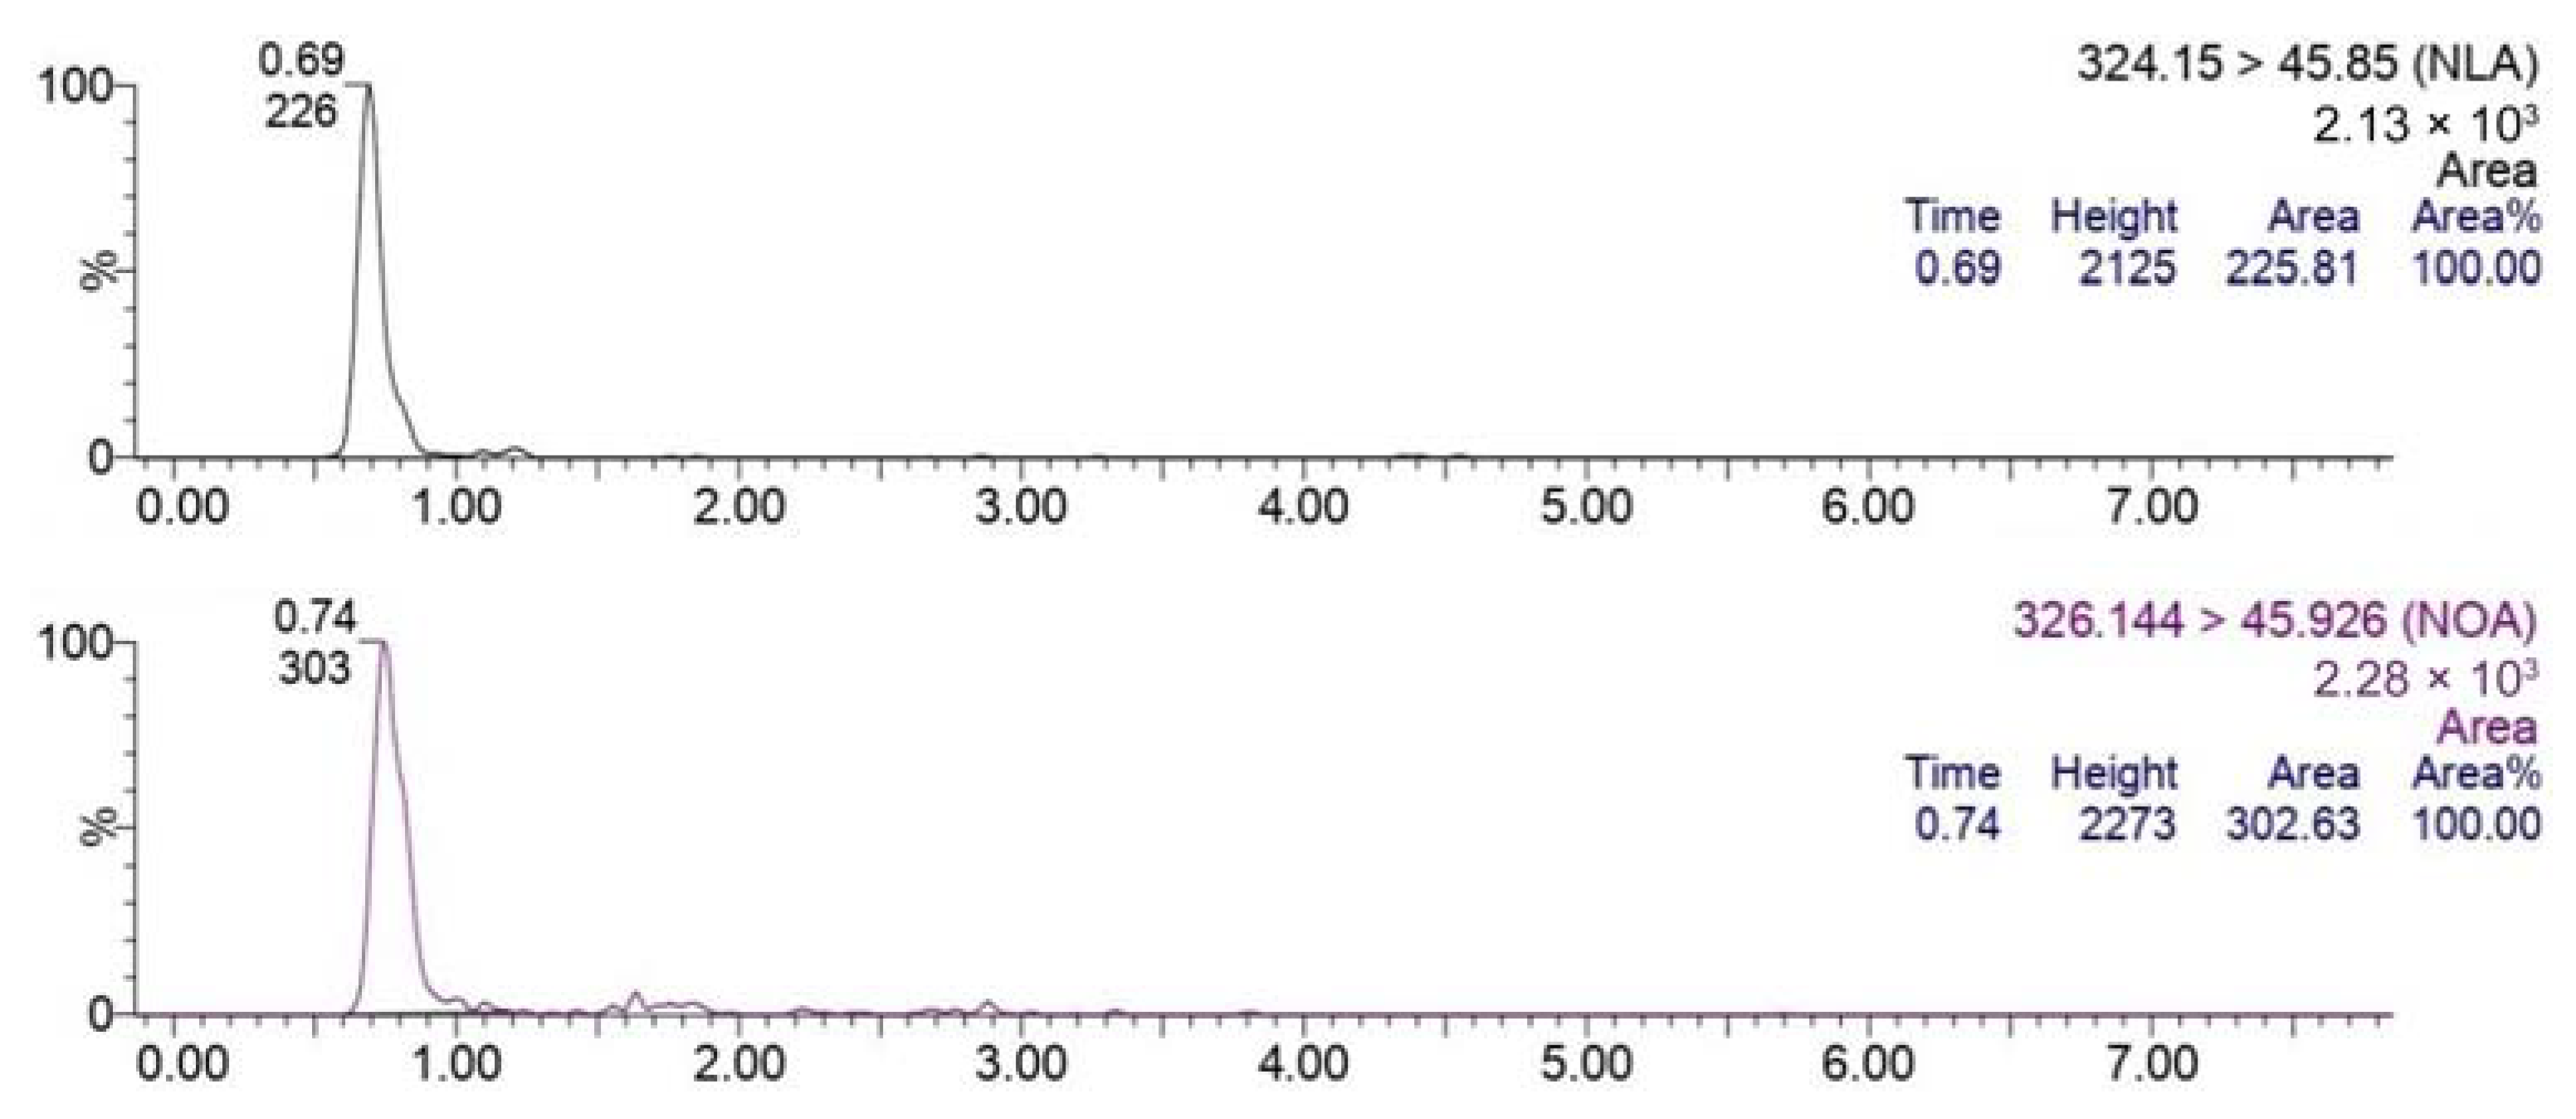
Mass spectrometric analysis was performed using an electrospray ionization triple quadrupole mass spectrometer (Waters Acquity Xevo TQD, Waters, MA, USA). Detection of NO2-FAs was performed in MRM mode, wherein 2 transitions were simultaneously monitored for each NO2-FA (Table 1). Tuning was performed in the negative ion mode by introducing a constant stream of the analytes’ standard solutions in methanol (0.50 μg/mL of standard NO2-OA and NO2-LA and 5.0 μg/mL HDA) into the ion source using a syringe infusion pump. Mass spectrometer parameters, such as capillary and cone voltages, gas flow, mass analyzer parameters and collision energies were tuned to each analyte until optimum conditions for ionization with the highest sensitivity of parents and fragments was achieved (Table 1). The most sensitive transitions in extracted plasma were 326.144 > 46 for NO2-OA and 324.124 > 46 for NO2-LA, which correspond to the loss of the characteristic NO2 group and were later used for quantification (Figure 2).

2.2.3. Liquid Chromatography

Chromatographic separation was performed prior to mass spectrometry using reversed phase (RP) UPLC on an ACQUITY BEH C18 column (130 Å, 1.7 μm, 2.1 mm × 100 mm), at a column temperature of 40 °C, applying a binary mobile phase system (A: 0.05% NH4OH in water, B: 0.05% NH4OH in ACN). Linear gradient elution from 85–100% B in 3 min at a flow rate of 0.3 mL/min was applied with a total runtime of 8 min for washing and conditioning (Table 2).

2.3. Blood Samples Collection

Blood samples were collected from 28 patients with acute myocardial infarction (AMI), recruited from the National Heart Institute (Giza, Egypt) (22 males and 6 females) and aged between 40 and 79 years (56 ± 9.1). Additionally, 18 healthy control samples were collected from 8 males and 10 females who aged between 38 and 70 years (47 ± 9.1). Signed informed consents were obtained from all subjects prior to their inclusion in the study, which was approved by the Ethics Committee at the German University in Cairo (Project ID: PCH-2022-02-MM). Plasma was isolated, by centrifugation at 3000× g for 10 min at 4 °C, and stored at −80 °C until sample preparation procedures were performed.

2.4. Plasma Samples Preparation

Plasma samples were thawed on ice and then each sample was divided into 3 aliquots (150 μL each) for standard addition (Table 3). The extraction method applied in this work was adopted from Lima et al. [21] with few modifications to fit our standard addition protocol. The 3 aliquots of each sample were spiked with 3 μL of 1 μg/mL HDA. The second and third aliquots were then spiked with 3 μL and 6 μL, respectively, of a nitro fatty acid mixture solution that contained 200 nM of each of NO2-OA and NO2-LA. All spiked aliquots were vortexed for 30 s. Deproteinization took place by the addition of 15% (v/v) acetic acid in methanol and vortexing for 1 min followed by incubation at 4 °C for 20 min. Afterwards, 1500 μL of diethyl ether containing the antioxidant 0.02% BHT was added. Samples were then vortexed for 3 min and centrifuged at 4000 g for 15 min at 4° C. A volume of 1275 μL of the upper layer was filtered, transferred to new falcon tubes, concentrated under vacuum at room temperature to complete dryness and stored at −20 °C until analysis. Before UPLC-MS/MS analysis, samples were reconstituted in 30 μL of 1:1 mixture of methanol and isopropanol, vortex mixed and transferred into insert-containing glass vials. The sample extraction and analysis order were randomized from the sample collection order to ensure that no systematic biases are present.

2.5. Method Validation

The optimized bioanalytical method was validated, according to ICH Q2(R1) guidelines, by evaluating 5 parameters which are: linearity, limits of detection and quantification (LOD and LOQ), accuracy, precision and range. Validation was performed in pooled plasma collected from healthy subjects. Five calibration samples were prepared in triplicates for evaluation of linearity over the range 0–60 nM spiked concentrations of NO2-FAs. A statistical t-test was used to define the LOQ as the minimum spiked concentration that results in the lowest statistically significant increase in signal in comparison to background signal of unspiked sample. LODs were estimated from the lowest concentrations detected in plasma with a signal-to-noise ratio of more than 3. QC samples of low, medium and high concentrations within the linear range (10 nM, 35 nM and 50 nM) were prepared in triplicates for the evaluation of accuracy (as % deviation), as well as intra-day and inter-day precision (as percent of relative standard deviation (%RSD). Additionally, the range of the analytical method was derived from the linearity study, where acceptable degrees of linearity, accuracy and precision were achieved.

2.6. Quantification of NO2-FAs

Quantification was performed using a 3-point standard addition method for each and every studied sample. The 3 points were 0 nM, 20 nM and 40 nM spiked concentrations of standard NO2-OA and NO2-LA. For each addition, chromatographic peak areas were integrated and peak area ratios were calculated by dividing the NO2-FA peak area by the internal standard (HDA) peak area. Peak area ratios were then plotted against spiked concentrations and the regression equations and R2 were obtained. Three samples were identified as outliers (data points located outside the whiskers of the box plot) and excluded. The unknown endogenous concentration of each NO2-FA was then calculated via the regression equation of the plotted line from the negative x-intercept (at Y = 0), which was divided by 5, since samples were concentrated 5 times during extraction (Supplementary Tables S1 and S2).

2.7. Statistical Analysis

The Anderson-Darling test for normality and Mann-Whitney U test of significance were performed using Minitab 17®.

3. Results & Discussion

3.1. Bioanalytical Method Development and Optimization

Analytical methods for the quantification of endogenous NO2-FA levels in humans are rare and have been reported by two groups. Baker et al. first reported plasma concentrations of NO2-OA and NO2-LA by LC-MS/MS [22,23] to be 619 ± 52 nM and 79 ± 35 nM, respectively, using 13C-labelled NO2-FA internal standards and a hybrid triple quadrupole linear ion trap MS. In these studies, lipids were eluted using an isocratic solvent system that consists of acetonitrile, water and NH4OH (85:15:0.1). MRM transitions corresponding to the loss of nitrous acid (HNO2) to produce [M-HNO2] anions were monitored. Results of these studies are several orders of magnitude higher than those reported a few years later by the same group [24] wherein gradient elution was applied and mass transitions corresponding to the more characteristic nitrite anion (NO2) were monitored. The later method was not validated, yet its results agree with reports by Tsikas et al. who used a fully validated GC-MS/MS method for the quantification of NO2-OA isomers and demonstrated that NO2-OA occurs in healthy humans’ plasma at concentrations in the picomolar range [25,26]. This large discrepancy implies the necessity of applying proper chromatographic separation prior to MS to prevent the misleading coelution of NO2-FAs in a single peak, as well as the importance of monitoring highly specific mass transitions. Hence, until the present day, NO2-FAs have not been quantified in biological samples through a validated LC-MS/MS method. We believe that having a validated LC-MS method is of great value to enable the more accurate quantification of these compounds, which may not survive the hard derivatization conditions and extensive sample preparation required in GC-MS.
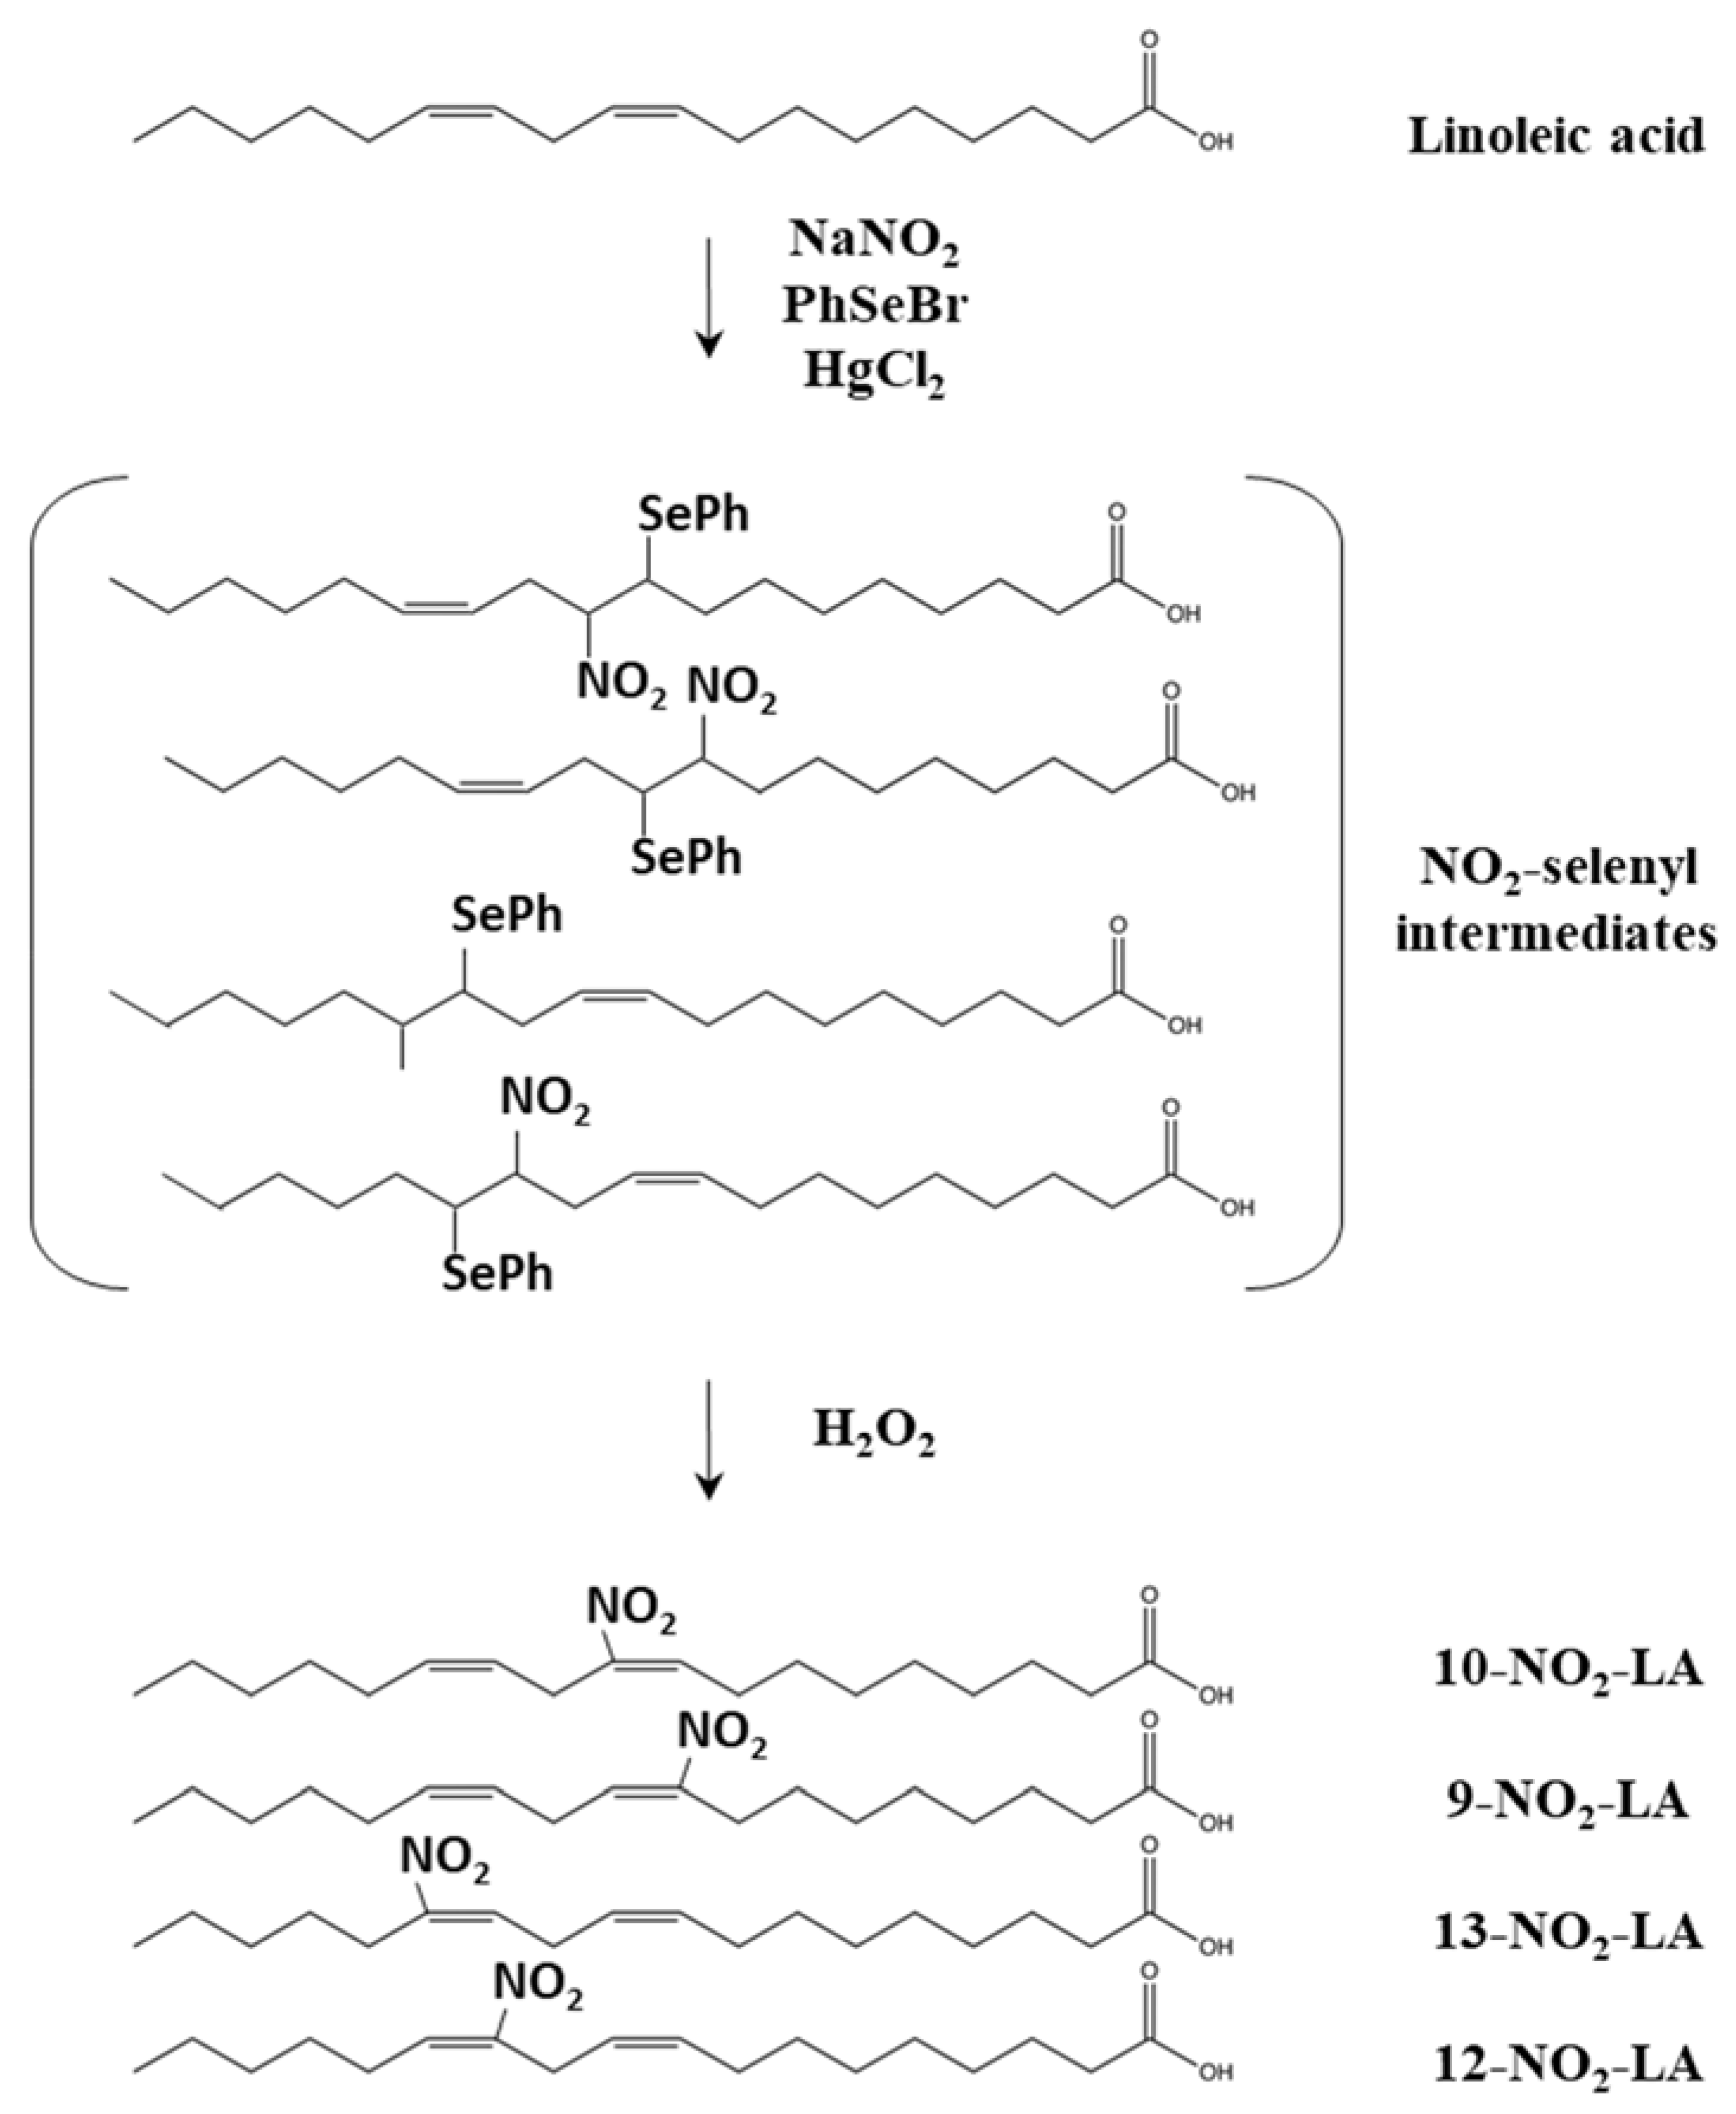
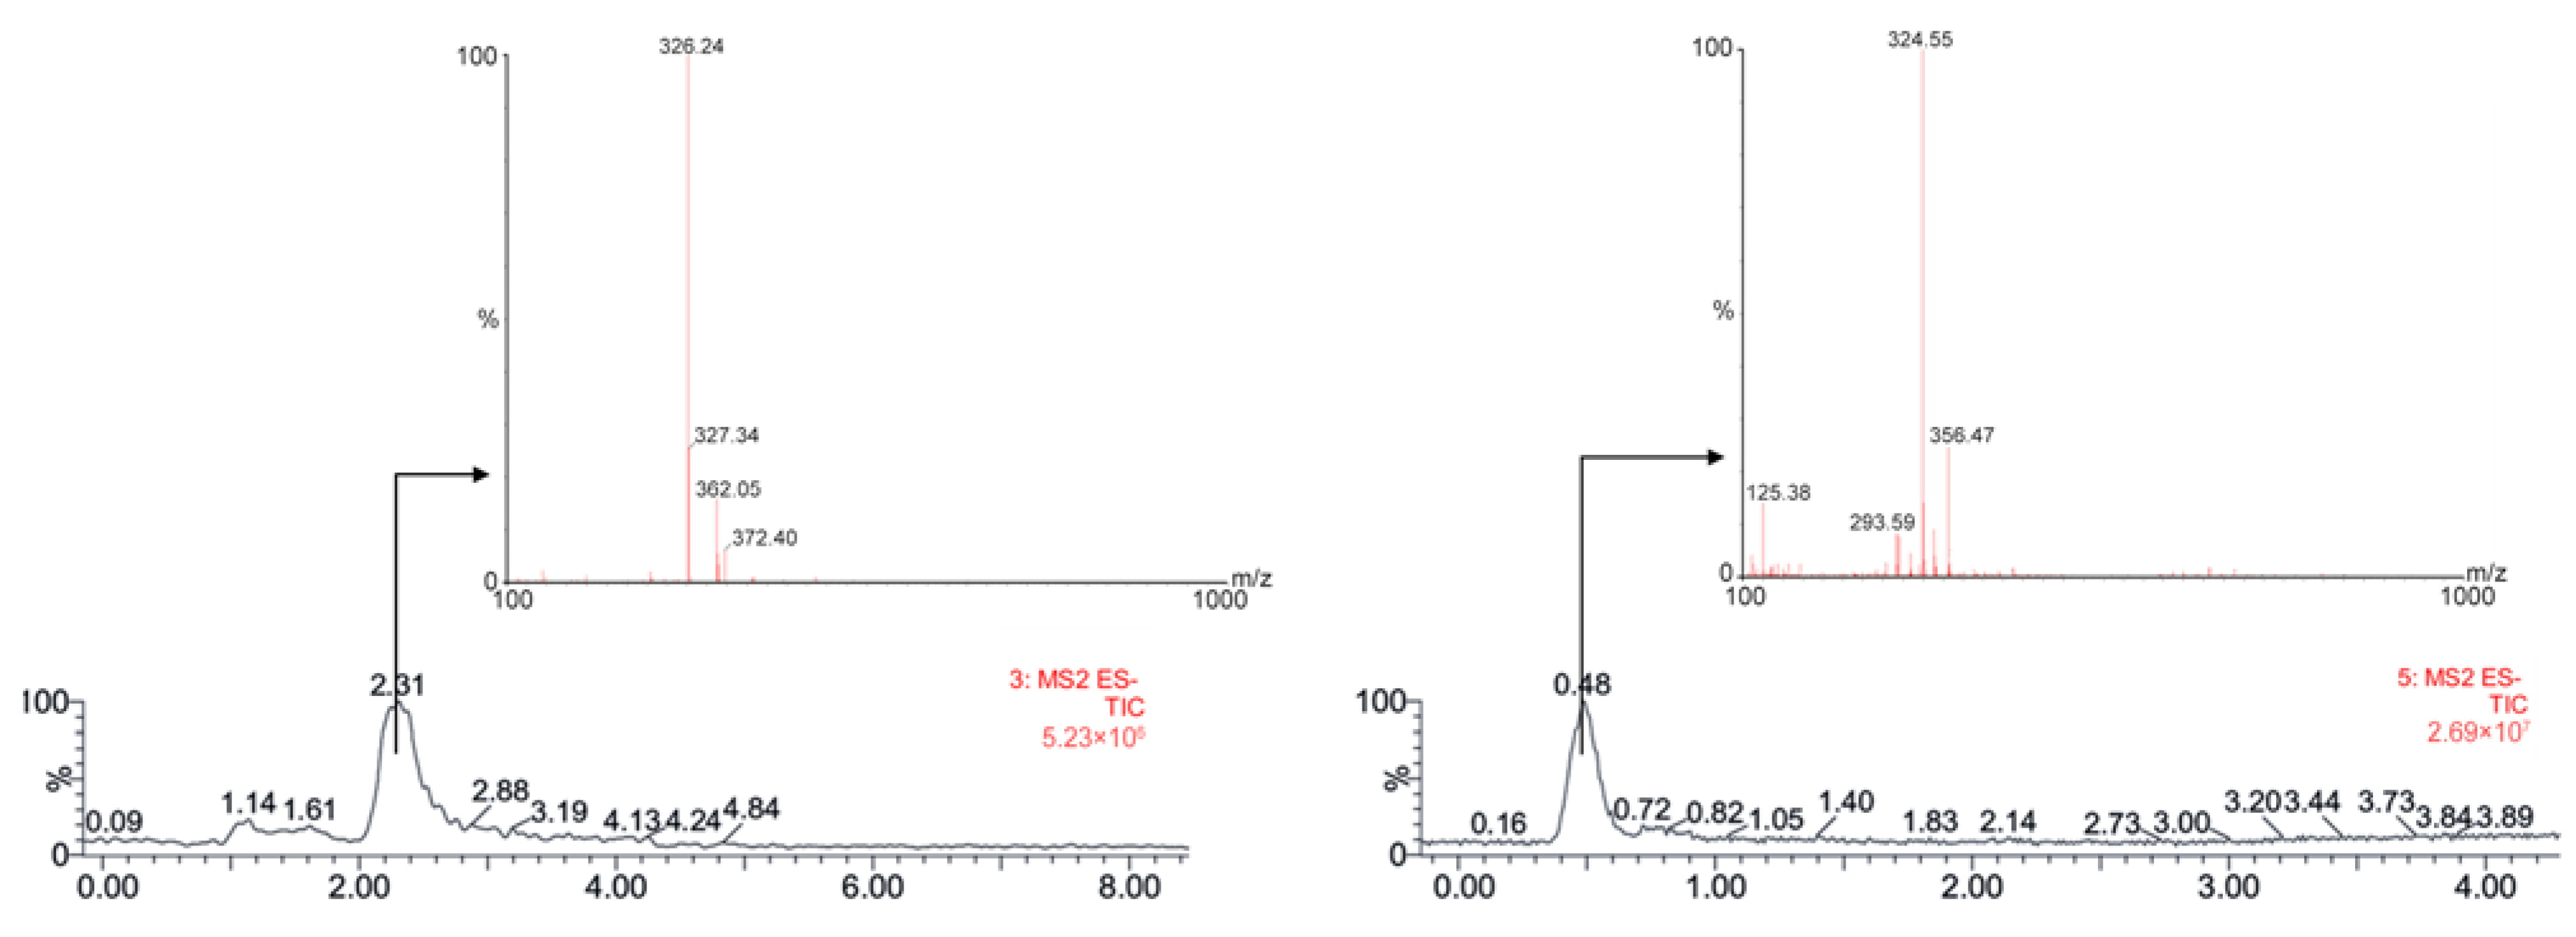
In our study, an LC-MS/MS method was developed and validated using an internal standard. Synthesized NO2-OA and NO2-LA were used for method development whereby unsaturated OA and LA were used as a starting material and their double bonds were activated to nitration through the combination of selenyl and mercurial reagents, leading to the formation of nitro-selenyl intermediates that are then oxidized in a second step to generate the nitroalkenes [6] (Figure 3). This approach generates regioisomers of NO2-FAs in equal proportions. The advantage of this approach is that it does not require much purification and allows for well-defined products (Figure 4). Other approaches have also been described by Woodcock et al. for synthesizing NO2-FAs [6]. These include NO-induced nitration, which is characterized by its high reactivity and low selectivity, as well as the full synthesis approach, which is used when specific isomer synthesis is needed.
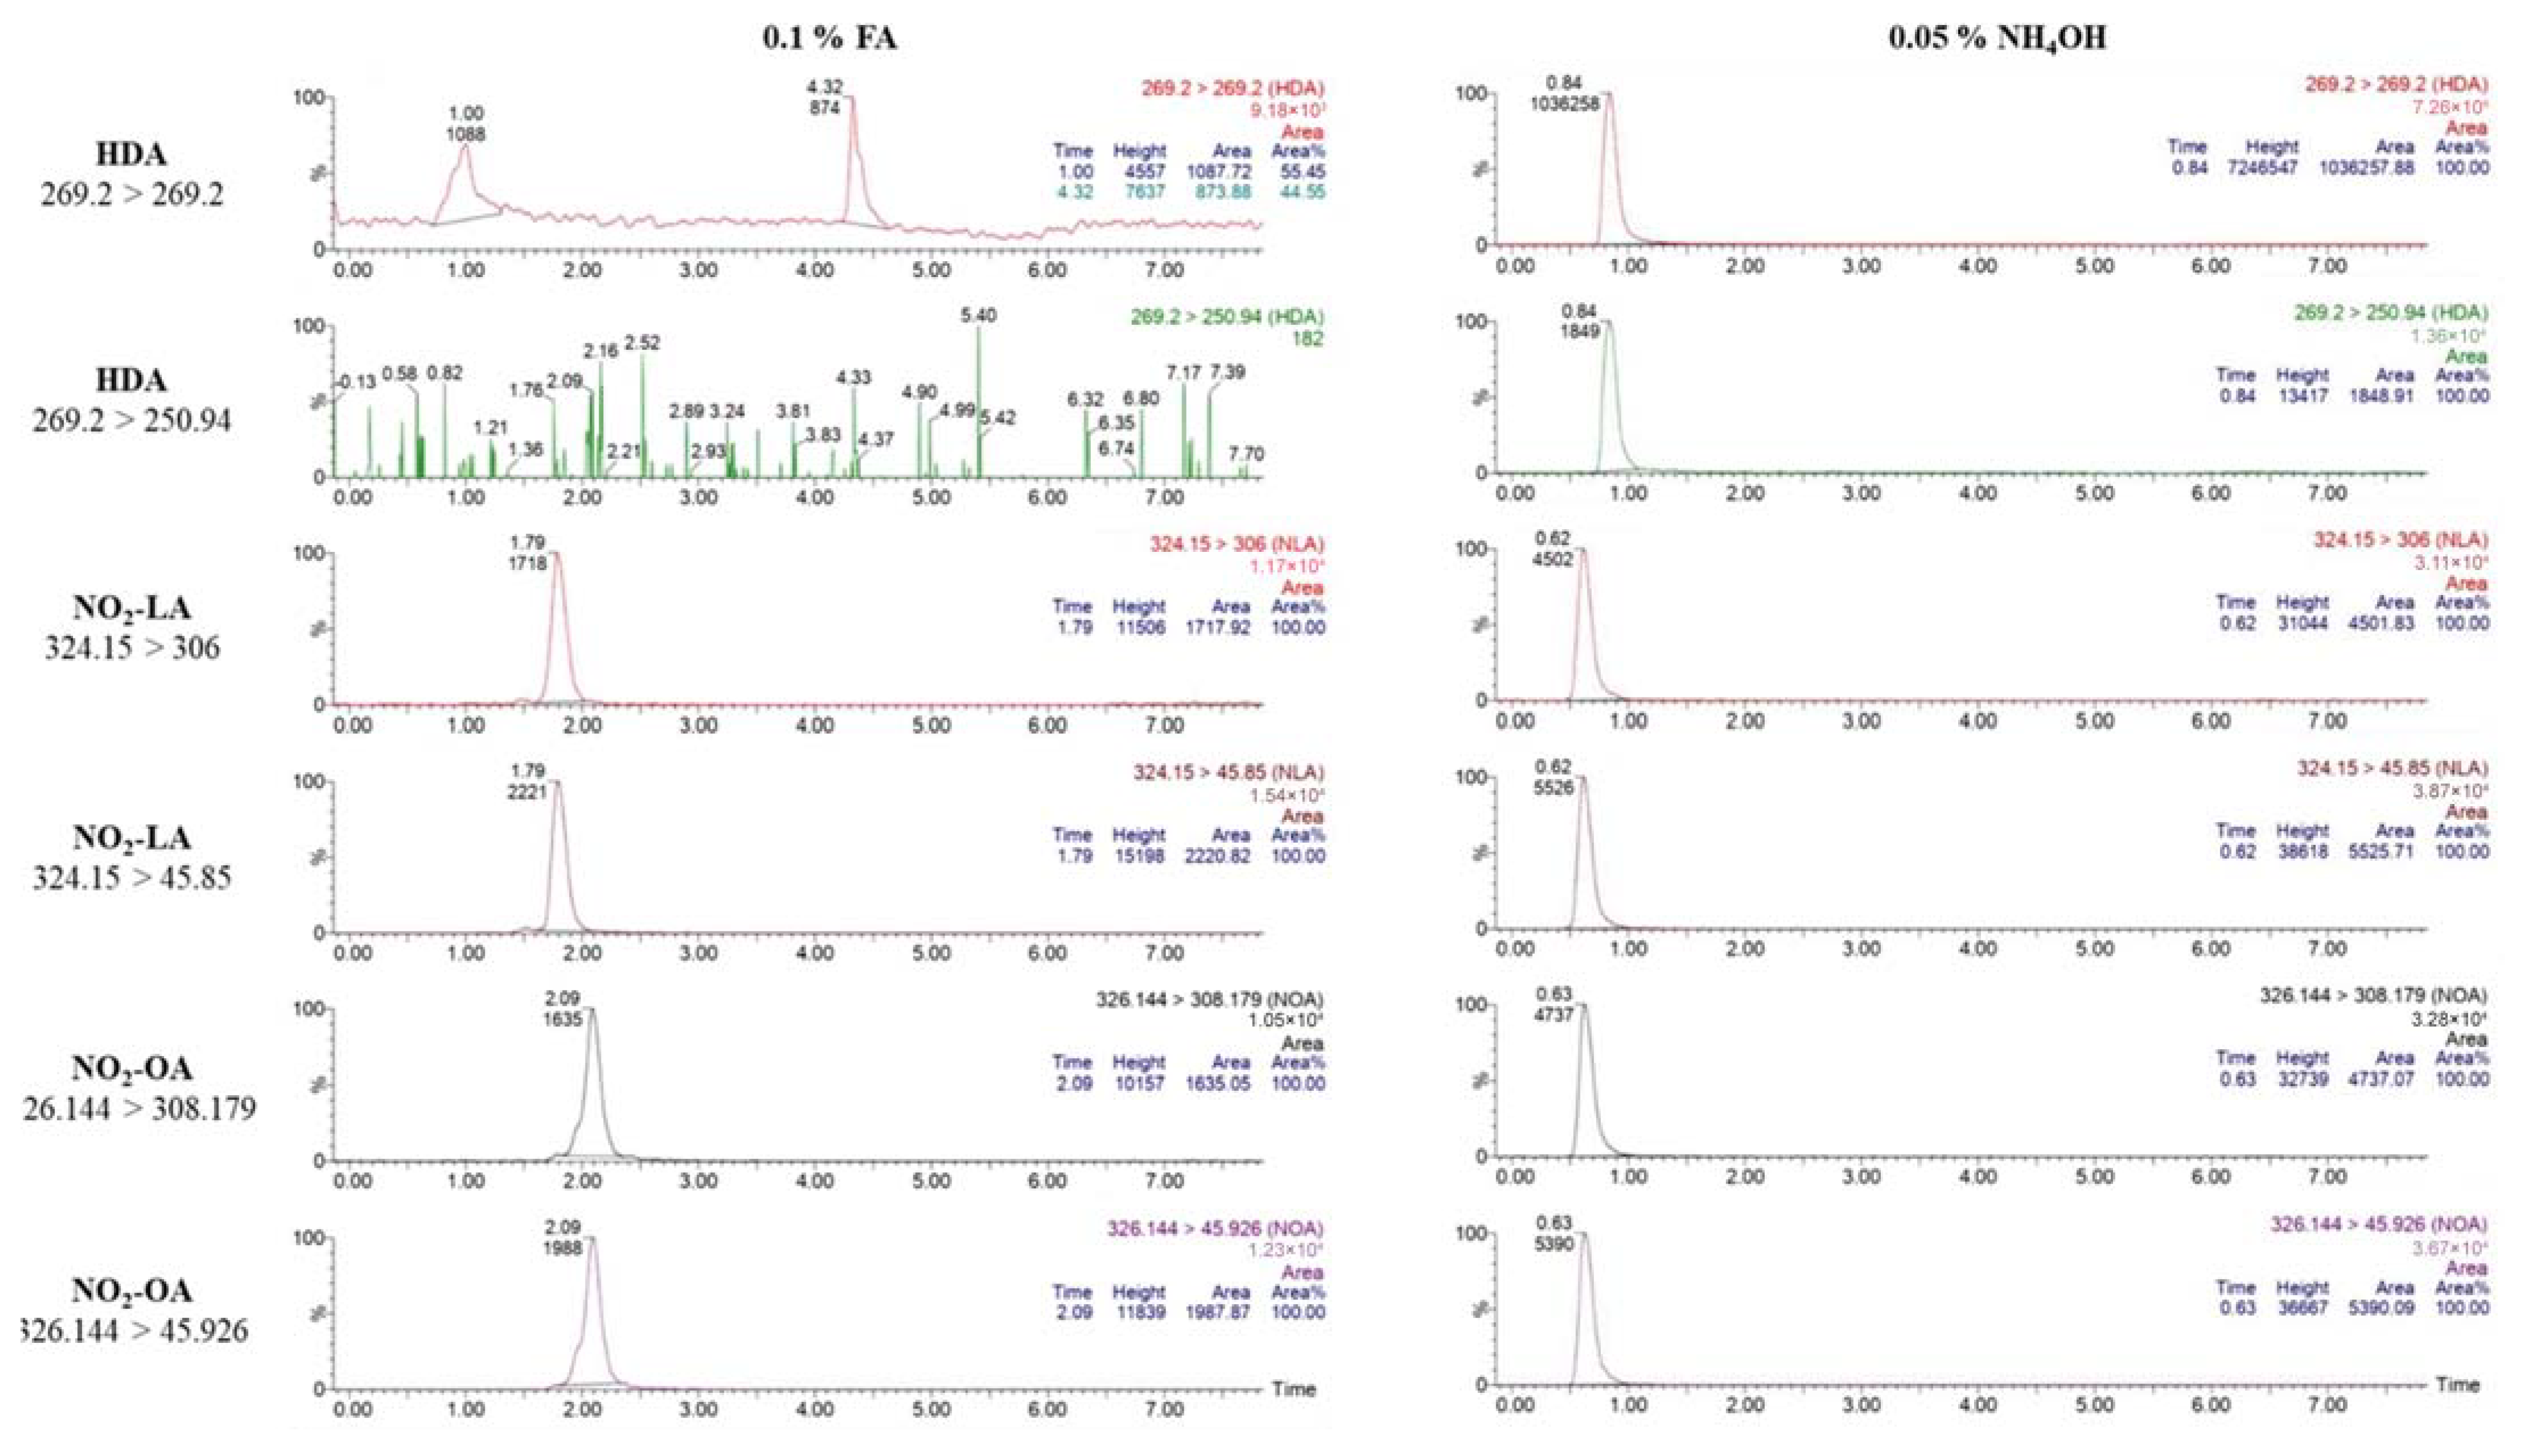
Both acidic (0.1% formic acid) and basic (0.1% ammonium hydroxide) mobile phase additives were tried during UPLC method development in the negative ion mode. Formic acid provided better retention and good peak shapes for the NO2-FAs; as it acts as an ion-pairing agent resulting in pseudo-neutral compounds that can interact with the stationary phase. Nevertheless, it has led to poor ionization and bad peak shapes for had-monitored transitions, as well as low sensitivity for NO2-FAs. On the other hand, NH4OH provided less retention, but much better sensitivities and good peak shapes for all analytes. Accordingly, NH4OH was the selected additive and added at a concentration of 0.05% to achieve better retention (Figure 5).
It is worth noting that NO2-LA and NO2-cLA are structural isomers that have different double bond positions. NO2-LA has a methylene-interrupted diene while NO2-cLA has a conjugated diene (Figure 1). Therefore, they displayed the same fragmentation patterns; and their separation with our UPLC method, using different gradients, was not possible. Even though they displayed limited separation at high concentrations, this separation was not seen at low concentrations (Supplementary Figure S1). Hence, it is likely that all detected peaks of NO2-LA represent both isomers.
The lipid extraction method used herein consists of two major steps: deproteinization with acidified methanol and single-phase extraction with DEE. Deproteinization was achieved through the addition of methanol acidified with 15% (v/v) acetic acid, which disrupts electrostatic forces or hydrogen bonding networks between proteins and lipids, enhances precipitation by reducing protein binding and neutralizes anionic lipids, thus improving their solubility in the organic phase leading to high extraction efficiency [27]. Single phase extraction using DEE was preferred over classical biphasic lipid extraction protocols, such as the Folch method [28] and Bligh and Dyer method [29], since it is simpler and prevents the possible loss of the relatively polar NO2-FAs into the disposed aqueous fraction. The use of methanol and DEE is therefore expected to recover non-polar and relatively polar lipids.
This method of extraction was first reported by Lima et al. for the characterization of linoleic acid nitration in human plasma [21]. The modifications applied here, to fit our standard addition protocol, include the following: (a) HDA and NO2-FAs were spiked directly into plasma before protein precipitation, rather than mixing HDA with the crashing solvent, which has led to analyte loss due to protein binding; (b) after adding the crashing solvent, samples were incubated at 4 °C for 20 min to enhance protein precipitation; (c) after extraction with DEE, a constant volume of the upper layer was used to measure NO2-FAs, rather than the whole organic layer, which was better for obtaining a linear response over the 3 standard addition points. Without these modifications, the response was not linear, and quantification of endogenous NO2-FAs was not possible via standard addition.
The standard addition method used herein has the advantage of using the same matrix of every study sample for the construction of its own calibration curve, thus minimizing the error caused by the matrix effect. On the other hand, it is markedly time-consuming and requires larger amounts of each sample. HDA was used as an internal standard as it can be considered a structural analog to NO2-FAs, having a 17-carbon fatty acid chain (Figure 1). The odd-chain fatty acid HDA (C17:0) is commonly used as a low-cost quantitative internal standard for the determination of fatty acids [30,31], including NO2-FAs [21]. In contrast to even chain fatty acids representing >99% of the total fatty acid plasma concentration in humans, odd-chain fatty acids are not detectable in human plasma [32]. Moreover, the natural variation of odd-chain fatty acid levels within plasma ranges from 0% to 1% [32]. Therefore, this small variation among subjects does not significantly influence its selection as an internal standard and explains its previous common use [21,30,31]. It has also been reported that odd-chain fatty acids are not endogenously synthesized in humans through biosynthetic or metabolic pathways, rather they mainly come from dairy fat [33,34]. As a result, they were assessed in several studies as biomarkers of dairy fat intake, with pentadecanoic acid and HDA being the most widely studied odd-chain fatty acids in this context [33,35]. In those studies, the correlation between dairy fat intake and plasma levels of HDA was found to be very weak [33,35]. It is also worth noting that odd-chain fatty acids are compartmentalized in the tissues [32,36]; thus, variations in their levels that might be present due to long-term intake of dairy fat would be more reflected in adipose tissue rather than plasma [35,37]. In an earlier study by our research group [20], serum metabolite profiling of ST-elevation myocardial infarction (STEMI) patients revealed significant alteration in the levels of 19 metabolites not including odd-chain fatty acids upon comparing the plasma of unstable angina to healthy controls. Therefore, no reports are present to show variations in the levels of HDA in the blood of MI patients as compared to healthy ones; this gives more support to its use as an internal standard in the analysis of NO2-FAs in the blood of those specific patients.

3.2. Bioanalytical Method Validation

The optimized bioanalytical method was validated, following ICH M10 guidelines, for the targeted detection and quantification of NO2-OA and NO2-LA in plasma. This was performed by spiking reference standard NO2-OA and NO2-LA in pooled plasma collected from healthy subjects, followed by lipid extraction and injection into the LC-MS/MS. Linear responses were observed for both analytes over the studied range (0–60 nM spiked concentrations) with R2 values of 0.9805 and 0.9644 for NO2-OA and NO2-LA, respectively, with relatively high y-intercepts observed due to the endogenous NO2-FAs present in plasma (Figure 6, Supplementary Table S3). Due to the unavailability of NO2-FA-free plasma, LOQ was limited by the endogenous background concentration in the particular batch of plasma used in building calibration curves, rather than by method sensitivity. Accordingly, a statistical t-test was used to define the LOQ as the minimum spiked concentration that results in the lowest statistically significant increase in peak area ratios. This approach was previously applied by Strassburg et al. for the quantitative profiling of endogenous oxylipins in human plasma [38]. Using this method, the LOQ was 10 nM for both NO2-FAs (Table 4), implying that endogenous concentrations as low as 2 nM can be quantified with our method; since during extraction samples are concentrated 5 times (Table 3). The calculated limits of quantification of the presented methodology are thus sufficiently below basal endogenous levels of both NO2-OA and NO2-LA, thereby providing an analytical methodology that serves as a tool to accurately measure these NO2-FAs in human plasma. LODs were estimated from the lowest concentrations of NO2-OA and NO2-LA detected in plasma, with a signal-to-noise ratio of more than 3. These correspond to 3.4 and 2.3 nM for NO2-OA and NO2-LA, respectively. During accuracy assays, triplicates of QC samples of low, medium and high concentrations were within ±15–20% of true values. %RSD values did not exceed 15% at the 3 QC levels in either intra- or inter-day precision assays (Supplementary Tables S4 and S5). The matrix effect was not evaluated due to the unavailability of NO2-FA-free plasma; however, it was eliminated by the use of the standard addition method.
As mentioned earlier, NO2-OA isomers have been previously quantified in human plasma via the fully validated stable-isotope dilution GC-MS/MS method [25,26]. In this method, NO2-OA and its 15N-labelled isomers were extracted from acidified plasma (1 mL) by solid-phase extraction (SPE). Analytes in the eluate were then separated through RP-HPLC and then NO2-OA fractions were collected. Subsequently, analytes were extracted from the mobile phase with ethyl acetate and then derivatized to the pentafluorobenzyl (PFB) ester derivatives, which were then analyzed by GC-MS/MS, with a retention time of 18 min. When SPE and HPLC steps were eliminated, there was some deterioration of the analytical performance, in terms of accuracy, precision and sensitivity [26]. This method successfully quantified 9-NO2-OA and 10-NO2-OA in the plasma of healthy humans, yet NO2-LA was not detectable. Our method has the advantage of using lower sample volumes (450 μL VS. 1 mL), eliminating SPE and derivatization steps, as well as detecting both NO2-OA and NO2-LA in plasma samples. On the other hand, our method was not able to quantify isomers separately.

3.3. Application of Validated Method in Plasma Samples of IHD Patients

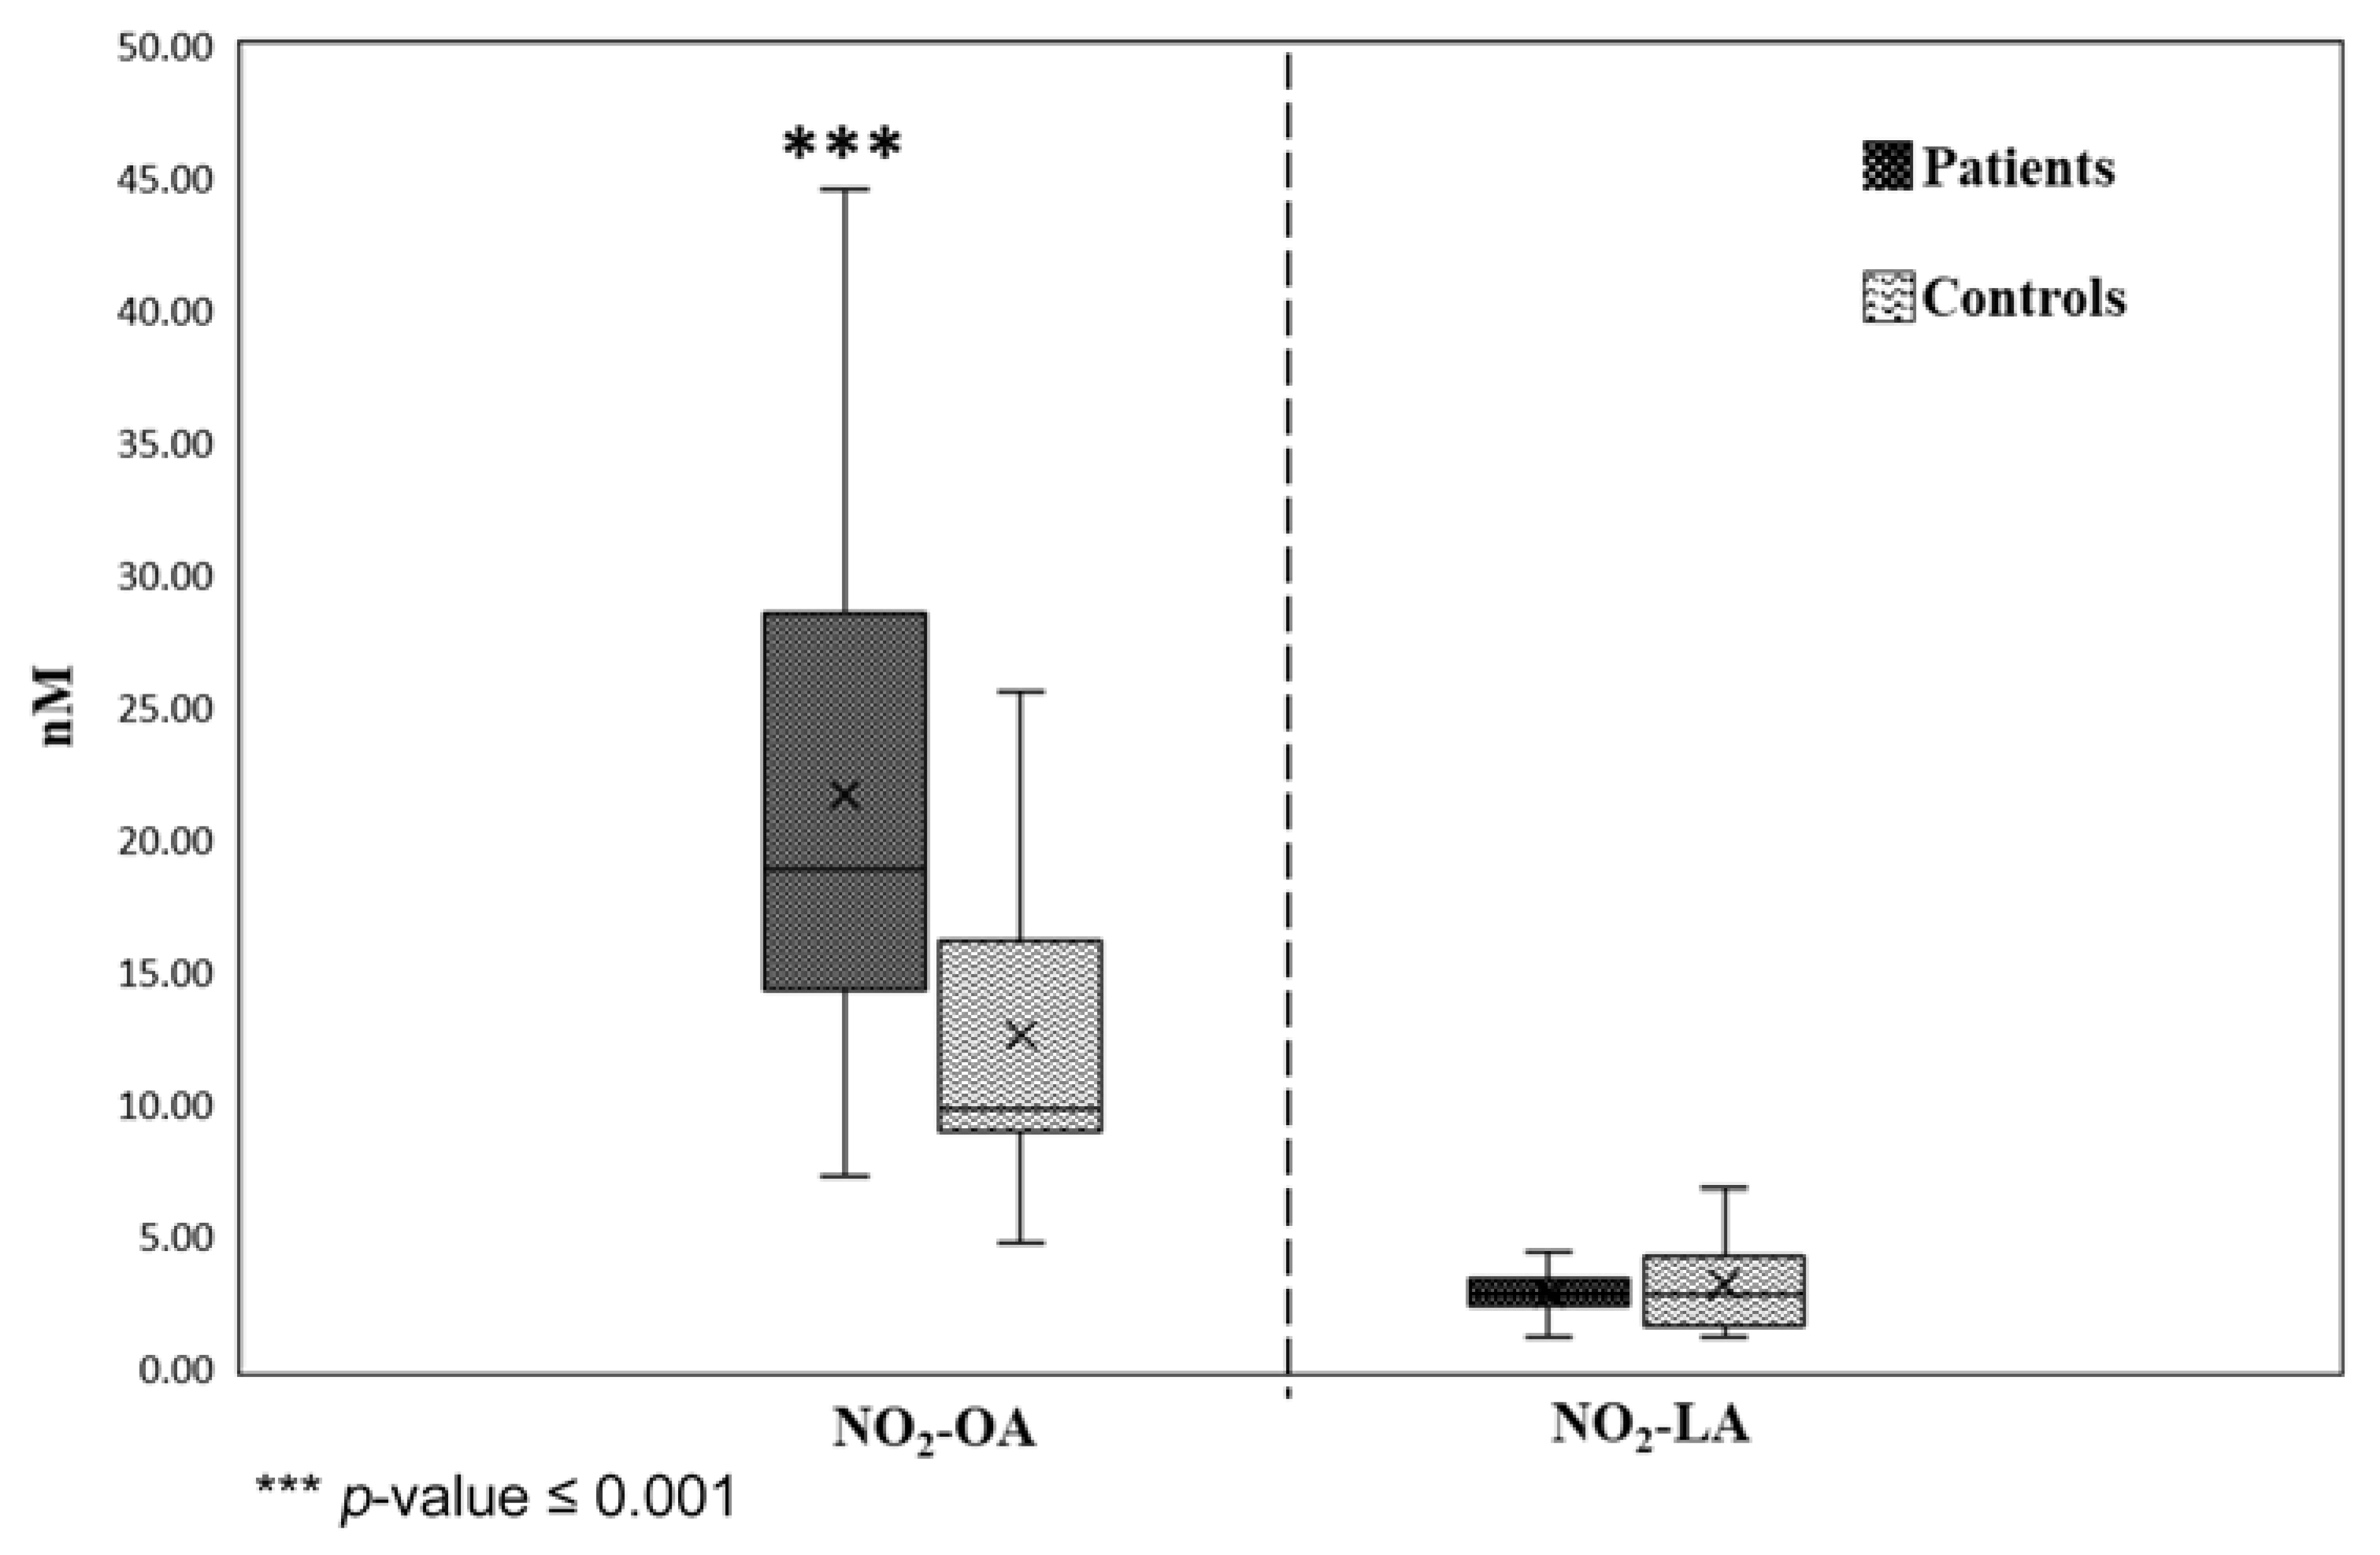
Application of the validated method to plasma samples of AMI patients and healthy controls revealed that the mean concentrations of NO2-OA were 21.7 ± 9.8 nM and 12.6 ± 6 nM, in patients and controls, respectively. Whereas the mean concentrations of NO2-LA were much lower at 2.9 ± 1 nM and 3.2 ± 1.7 in patients and controls, respectively (Figure 7). Since data were not normally distributed, as demonstrated by the Anderson-Darling test for normality, the non-parametric Mann-Whitney U test was performed for significance testing. The obtained p-value for NO2-OA levels was 0.00071, suggesting that concentrations of NO2-OA are significantly higher in patients than in controls. On the other hand, there was no significant difference in the levels of NO2-LA between both groups (p-value = 0.87288). Within patients, no significant difference was found between STEMI and NSTEMI cases (p-values = 0.5892 (NO2-OA) and 0.8181 (NO2-LA)) or between diabetic and non-diabetic ones (p-values = 0.8493 (NO2-OA) and 0.8259 (NO2-LA)).
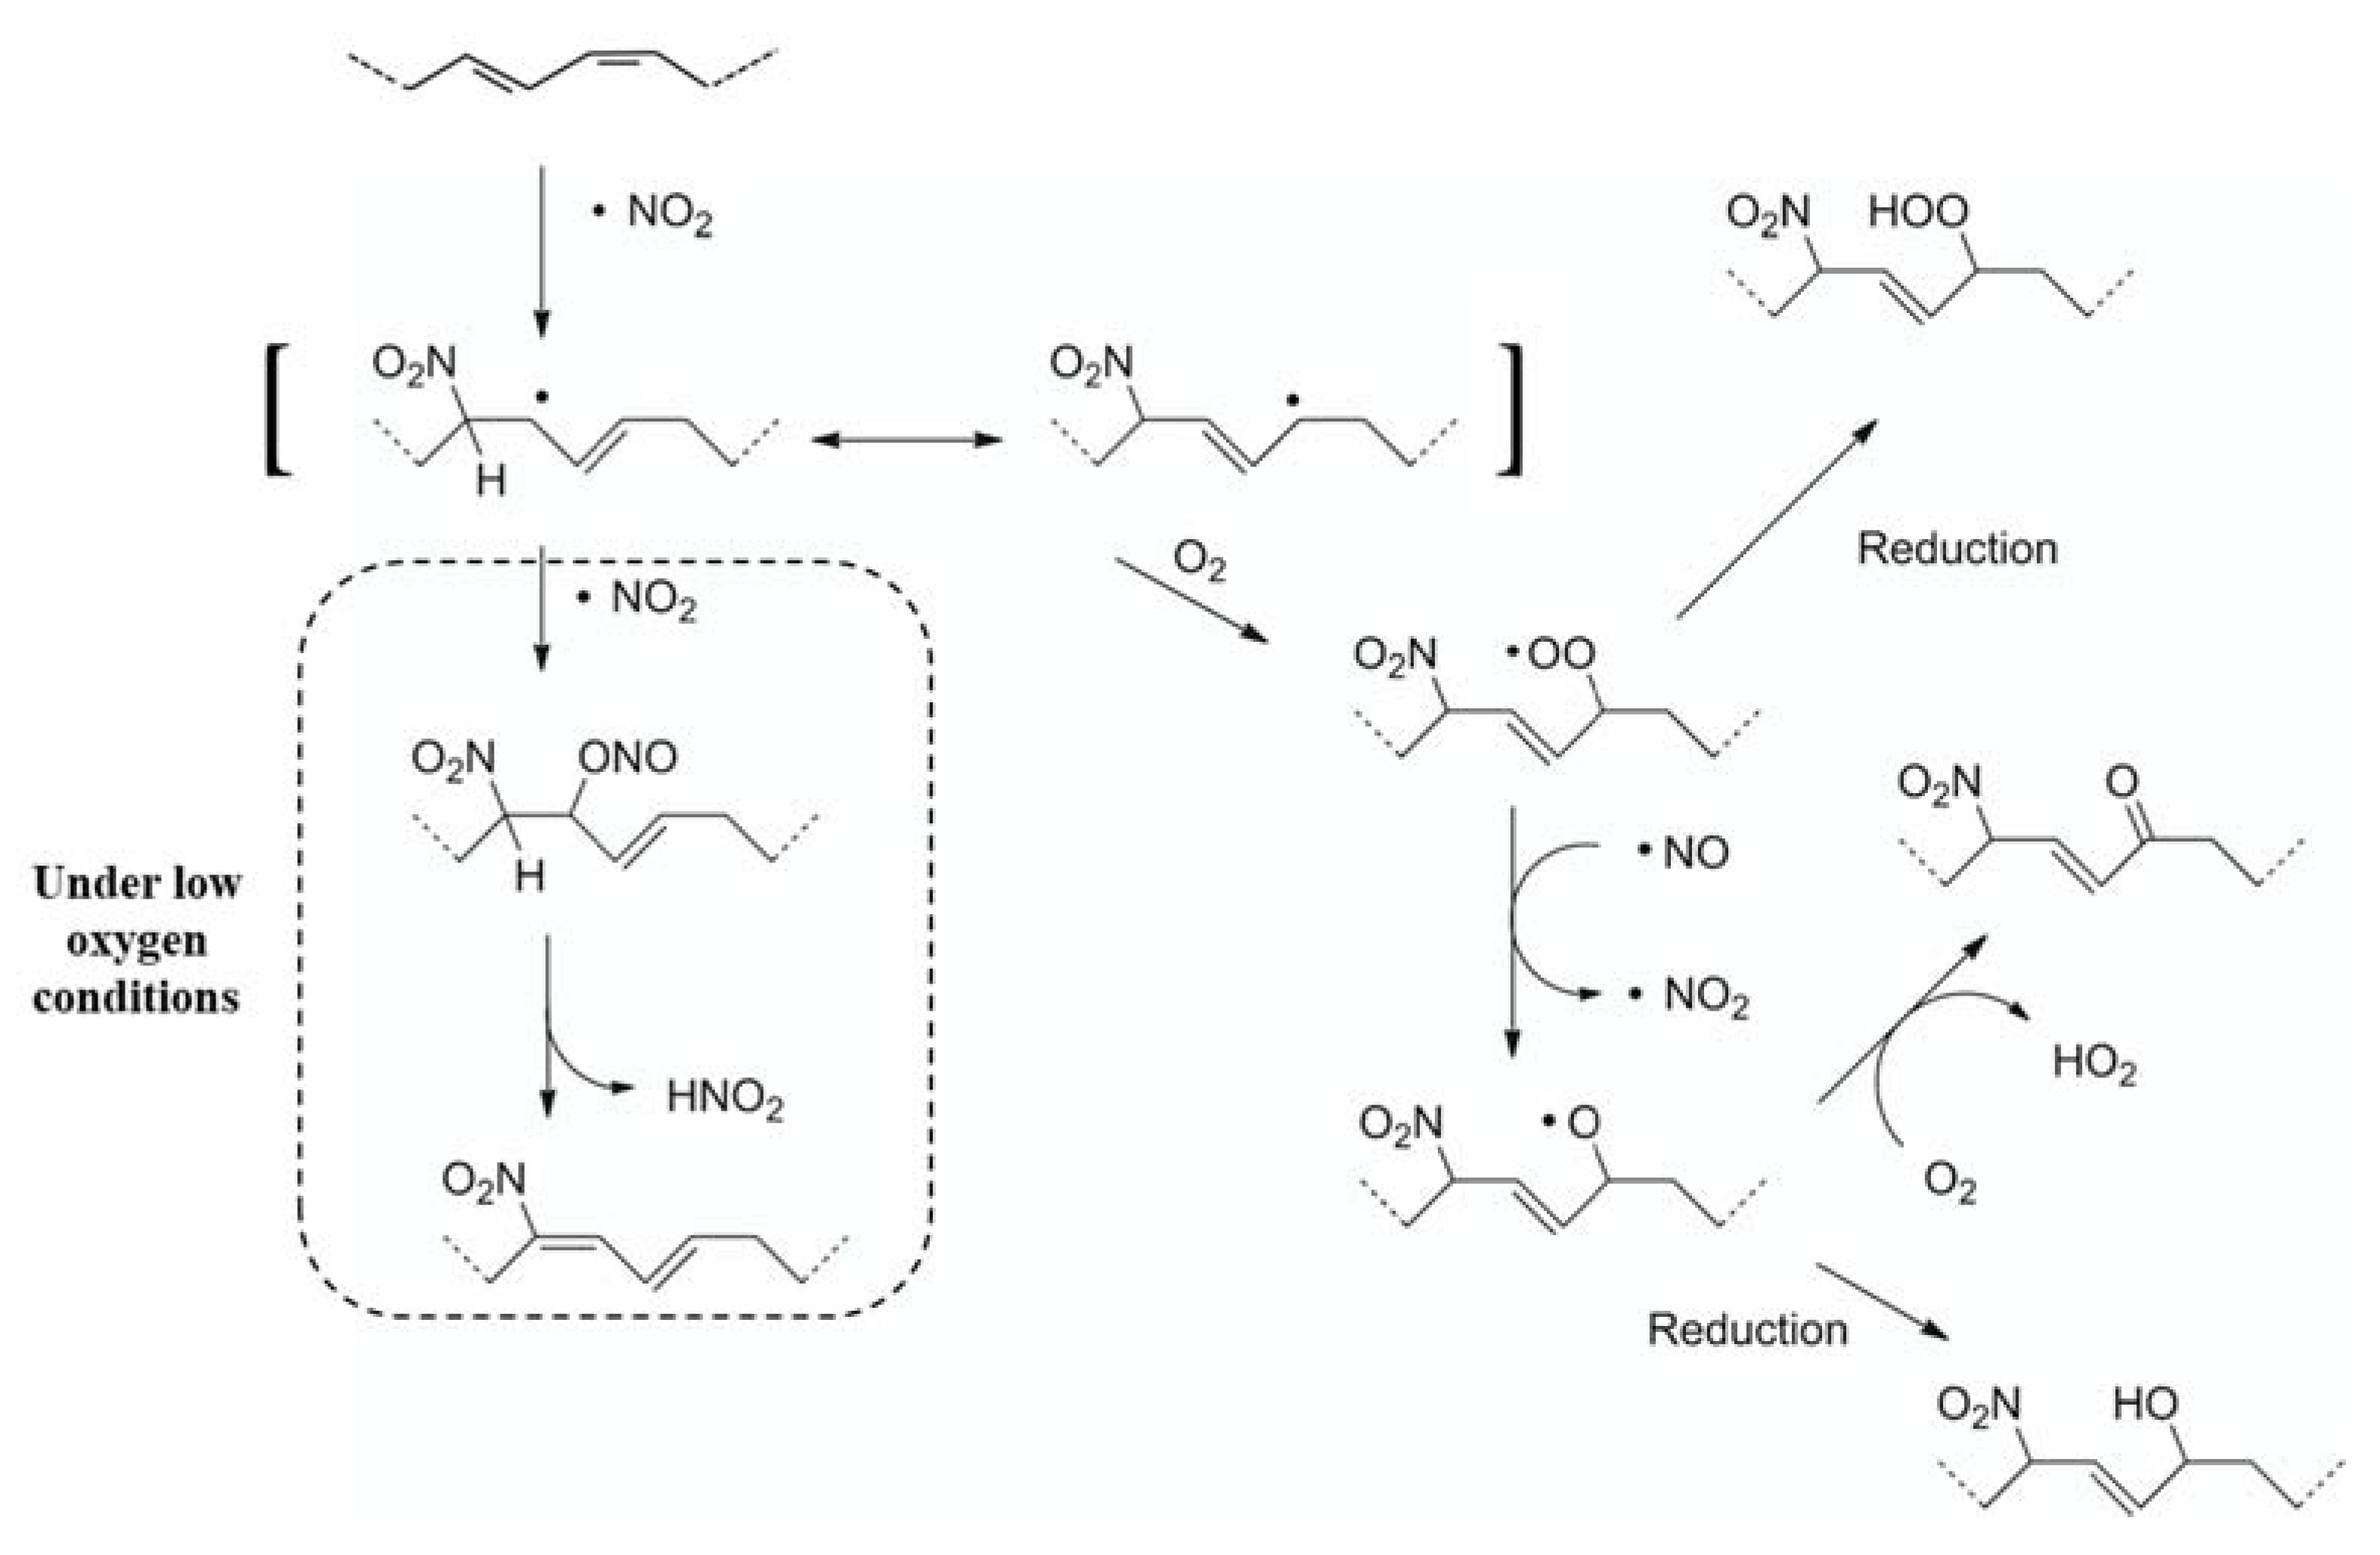
Notably, a number of reports on animal models have demonstrated the formation of NO2-FAs at high nanomolar concentrations by activated inflammatory cells, and both cardiac tissue and mitochondria, following ischemia-reperfusion (I/R) and ischemic preconditioning (IPC) events. A study that was conducted ex-vivo on Langendorff-perfused rat hearts demonstrated that NO2-FAs are generated in the mitochondria of IPC hearts where they activate mitochondrial uncoupling [39], which is known to be cardioprotective [40]. Following these reports, the in vivo generation of both NO2-OA and NO2-LA at concentrations of 9.5 ± 4.7 nM and 17.3 ± 4.7 nM, respectively, was demonstrated inside the cardiac tissue of a murine model of I/R [2]. Notably, both I/R and IPC are characterized by a transient increase in the rates of ROS generation, and elevated rates of RNS production and acidic pH. This environment promotes the formation of NO2-FAs via free radical-mediated nitration of fatty acids, which is enhanced by acidic pH [4]. Detection of NO2-FAs in ischemic hearts was also further explained by the observation that free radical-mediated nitration of FAs occurs preferentially under low oxygen conditions, where nitroalkenes are easily formed, unlike in the presence of oxygen where α-β unsaturated keto derivatives are rather formed (Figure 8). Furthermore, the release of NO2-FAs from their protein adducts was demonstrated in vitro under nitro-oxidative conditions [41]. The findings of this study highlighted the ability of H2O2 and ONOO-, as representative ROS and RNS molecules induced under stress conditions, to oxidize cysteine-adducted NO2-FAs, which is followed by the release of free nitroalkenes. That release may be partly responsible for the increase in NO2-FA content observed under different stress conditions.
Considering these findings, together with the significantly high levels of NO2-OA, we found in AMI patients an observed increase of NO2-OA could be either due to unsaturated fatty acid nitration promoted under stress conditions, or its release from protein adducts. We may also hypothesize that NO2-OA may have leaked from injured myocardial cells. However, there is still not enough evidence for this hypothesis, since NO2-OA might also have been formed in the vascular compartment. It is also worth noting that, our study samples were collected 2–3 h from the onset of chest pain. This timeframe is much faster than the appropriate time for optimum measurement of other currently used biomarkers for MI, which are not reliably detected until at least 4–6 h post myocardial injury, when the disease is already in an irreversible state. Hence, the potential of NO2-OA to be used as a biomarker for ischemic heart diseases is worth further investigations.
Even though cLA was reported as the primary endogenous substrate for fatty acid nitration in vitro and in vivo [42], our study detected NO2-OA in much higher concentrations in plasma. This could be due to the fact that LA, from which NO2-LA and NO2-cLA are formed, is an essential omega-6 fatty acid; because humans cannot incorporate a double bond beyond the ninth carbon of a fatty acid [43]. On the other hand, oleic acid, which is a monounsaturated omega-9 fatty acid, is not essential, and unlike omega-3 and omega-6, it can be synthesized by humans from stearic acid by the action of the delta 9-desaturase enzyme [44].

4. Conclusions

In conclusion our validated bioanalytical method was able to successfully quantify NO2-OA and NO2-LA in plasma through a targeted lipidomic approach, with limits of quantification that are sufficiently below basal endogenous levels. To our knowledge, this is the first validated LC-MS/MS method for the quantification of endogenous NO2-FAs. We view it as an addition to the previously reported GC-MS method as it is shorter, requires lower sample volume and detects both NO2-OA and NO2-LA. In comparison to healthy controls, the levels of NO2-OA were significantly higher in AMI patients, which presents this endogenous molecule as a possible new biomarker for the disease.

Supplementary Materials

The following supporting information can be downloaded at: https://www.mdpi.com/article/10.3390/separations10020087/s1, Figure S1: Unresolved peaks of the structural isomers NO2-LA and NO2-cLA standard solutions in methanol using reversed phase UPLC-MS/MS. Mobile phase: H2O and ACN containing 0.05% NH4OH.; Table S1: Quantification of endogenous NO2-OA and NO2-LA in IHD patients’ plasma by standard addition method.; Table S2: Quantification of endogenous NO2-OA and NO2-LA in healthy controls’ plasma by standard addition method.; Table S3: Results of the linearity study of NO2-OA and NO2-LA in plasma; Table S4: % deviations of peak area ratios of NO2-OA and NO2-LA from true values for evaluating accuracy; Table S5: % RSDs of peak area ratios of NO2-OA and NO2-LA for evaluating intra- and inter-day precision.

Author Contributions

Conceptualization, M.Z.G. and R.S.H.; project administration, M.Z.G. and R.S.H.; supervision, M.Z.G. and R.S.H.; writing—review and editing, M.Z.G. and R.S.H.; resources, M.Z.G. and R.S.H.; funding acquisition, R.S.H. and M.M.H.; methodology, R.S.H.; formal analysis, M.M.H.; investigation, M.M.H.; validation, M.M.H.; visualization, M.M.H.; writing original draft, M.M.H. All authors have read and agreed to the published version of the manuscript.

Funding

This research received no external funding.

Data Availability Statement

Data are contained within the article and Supplementary Material.

Acknowledgments

This research was partially supported by the German University in Cairo.

Conflicts of Interest

The authors declare no conflict of interest.

References

  1. Melo, T.; Montero-Bullón, J.F.; Domingues, P.; Domingues, M.R. Discovery of Bioactive Nitrated Lipids and Nitro-Lipid-Protein Adducts Using Mass Spectrometry-Based Approaches. Redox Biol. 2019, 23, 101106. [Google Scholar] [CrossRef] [PubMed]
  2. Rudolph, V.; Rudolph, T.K.; Schopfer, F.J.; Bonacci, G.; Woodcock, S.R.; Cole, M.P.; Baker, P.R.S.; Ramani, R.; Freeman, B.A. Endogenous Generation and Protective Effects of Nitro-Fatty Acids in a Murine Model of Focal Cardiac Ischaemia and Reperfusion. Cardiovasc. Res. 2010, 85, 155–166. [Google Scholar] [CrossRef] [Green Version]
  3. Schopfer, F.J.; Khoo, N.K.H. Nitro-Fatty Acid Logistics: Formation, Biodistribution, Signaling, and Pharmacology. Trends Endocrinol. Metab. 2019, 30, 505–519. [Google Scholar] [CrossRef]
  4. Schopfer, F.J.; Cipollina, C.; Freeman, B.A. Formation and Signaling Actions of Electrophilic Lipids. Chem. Rev. 2011, 111, 5997–6021. [Google Scholar] [CrossRef] [PubMed] [Green Version]
  5. Grippo, V.; Mojovic, M.; Pavicevic, A.; Kabelac, M.; Hubatka, F.; Turanek, J.; Zatloukalova, M.; Freeman, B.A.; Vacek, J. Electrophilic Characteristics and Aqueous Behavior of Fatty Acid Nitroalkenes. Redox Biol. 2021, 38, 101756. [Google Scholar] [CrossRef] [PubMed]
  6. Woodcock, S.R.; Bonacci, G.; Gelhaus, S.L.; Schopfer, F.J. Nitrated Fatty Acids: Synthesis and Measurement. Free Radic. Biol. Med. 2013, 59, 14–26. [Google Scholar] [CrossRef] [Green Version]
  7. Khoo, N.K.; Schopfer, F.J. Nitrated Fatty Acids: From Diet to Disease. Curr. Opin. Physiol. 2019, 9, 67–72. [Google Scholar] [CrossRef]
  8. Schopfer, F.J.; Vitturi, D.A.; Jorkasky, D.K.; Freeman, B.A. Nitro-Fatty Acids: New Drug Candidates for Chronic Inflammatory and Fibrotic Diseases. Nitric Oxide 2018, 79, 31–37. [Google Scholar] [CrossRef]
  9. Kelley, E.E.; Baust, J.; Bonacci, G.; Golin-Bisello, F.; Devlin, J.E.; Croix, C.M.S.; Watkins, S.C.; Gor, S.; Cantu-Medellin, N.; Weidert, E.R.; et al. Fatty Acid Nitroalkenes Ameliorate Glucose Intolerance and Pulmonary Hypertension in High-Fat Diet-Induced Obesity. Cardiovasc. Res. 2014, 101, 352–363. [Google Scholar] [CrossRef] [Green Version]
  10. Jobbagy, S.; Tan, R.J. Nitrolipids in Kidney Physiology and Disease. Nitric Oxide Biol. Chem. 2018, 78, 121–126. [Google Scholar] [CrossRef]
  11. Rom, O.; Xu, G.; Guo, Y.; Zhu, Y.; Wang, H.; Zhang, J.; Fan, Y.; Liang, W.; Lu, H.; Liu, Y.; et al. Nitro-Fatty Acids Protect against Steatosis and Fibrosis during Development of Nonalcoholic Fatty Liver Disease in Mice. EBioMedicine 2019, 41, 62–72. [Google Scholar] [CrossRef] [PubMed] [Green Version]
  12. Rudolph, T.K.; Rudolph, V.; Edreira, M.M.; Cole, M.P.; Bonacci, G.; Schopfer, F.J.; Woodcock, S.R.; Franek, A.; Pekarova, M.; Khoo, N.K.H.; et al. Nitro-Fatty Acids Reduce Atherosclerosis in Apolipoprotein E-Deficient Mice. Arterioscler. Thromb. Vasc. Biol. 2010, 30, 938–945. [Google Scholar] [CrossRef] [PubMed]
  13. Zhang, J.; Villacorta, L.; Chang, L.; Fan, Z.; Hamblin, M.; Zhu, T.; Chen, C.S.; Cole, M.P.; Schopfer, F.J.; Deng, C.X.; et al. Nitro-Oleic Acid Inhibits Angiotensin II-Induced Hypertension. Circ. Res. 2010, 107, 540–548. [Google Scholar] [CrossRef] [PubMed] [Green Version]
  14. Trostchansky, A.; Rubbo, H. Nitrated Fatty Acids: Mechanisms of Formation, Chemical Characterization, and Biological Properties. Free Radic. Biol. Med. 2008, 44, 1887–1896. [Google Scholar] [CrossRef] [PubMed]
  15. Freeman, B.A.; Baker, P.R.S.; Schopfer, F.J.; Woodcock, S.R.; Napolitano, A.; D’Ischia, M. Nitro-Fatty Acid Formation and Signaling. J. Biol. Chem. 2008, 283, 15515–15519. [Google Scholar] [CrossRef] [Green Version]
  16. Mollenhauer, M.; Mehrkens, D.; Rudolph, V. Nitrated Fatty Acids in Cardiovascular Diseases. Nitric Oxide Biol. Chem. 2018, 78, 146–153. [Google Scholar] [CrossRef]
  17. Khan, M.A.; Hashim, M.J.; Mustafa, H.; Baniyas, M.Y.; Al Suwaidi, S.K.B.M.; AlKatheeri, R.; Alblooshi, F.M.K.; Almatrooshi, M.E.A.H.; Alzaabi, M.E.H.; Al Darmaki, R.S.; et al. Global Epidemiology of Ischemic Heart Disease: Results from the Global Burden of Disease Study. Cureus 2020, 12, e9349. [Google Scholar] [CrossRef]
  18. Dalos, D.; Spinka, G.; Schneider, M.; Wernly, B.; Paar, V.; Hoppe, U.; Litschauer, B.; Strametz-Juranek, J.; Sponder, M. New Cardiovascular Biomarkers in Ischemic Heart Disease—GDF-15, a Probable Predictor for Ejection Fraction. J. Clin. Med. 2019, 8, 1–11. [Google Scholar] [CrossRef] [Green Version]
  19. Hanafi, R.S.; Lämmerhofer, M. Quality-by-Design Approach for Development of Aqueous Headspace Microextraction GC-MS Method for Targeted Metabolomics of Small Aldehydes in Plasma of Cardiovascular Patients. Anal. Chim. Acta 2022, 1221, 340176. [Google Scholar] [CrossRef]
  20. Ali, S.E.; Farag, M.A.; Holvoet, P.; Hanafi, R.S.; Gad, M.Z. A Comparative Metabolomics Approach Reveals Early Biomarkers for Metabolic Response to Acute Myocardial Infarction. Sci. Rep. 2016, 6, 1–14. [Google Scholar] [CrossRef] [Green Version]
  21. Lima, É.S.; Di Mascio, P.; Rubbo, H.; Abdalla, D.S.P. Characterization of Linoleic Acid Nitration in Human Blood Plasma by Mass Spectrometry. Biochemistry 2002, 41, 10717–10722. [Google Scholar] [CrossRef] [PubMed]
  22. Baker, P.R.S.; Lin, Y.; Schopfer, F.J.; Woodcock, S.R.; Groeger, A.L.; Batthyany, C.; Sweeney, S.; Long, M.H.; Iles, K.E.; Baker, L.M.S.; et al. Fatty Acid Transduction of Nitric Oxide Signaling: Multiple Nitrated Unsaturated Fatty Acid Derivatives Exist in Human Blood and Urine and Serve as Endogenous Peroxisome Proliferator-Activated Receptor Ligands. J. Biol. Chem. 2005, 280, 42464–42475. [Google Scholar] [CrossRef] [Green Version]
  23. Baker, P.R.S.; Schopfer, F.J.; Sweeney, S.; Freeman, B.A. Red Cell Membrane and Plasma Linoleic Acid Nitration Products: Synthesis, Clinical Identification, and Quantitation. Proc. Natl. Acad. Sci. USA 2004, 101, 11577–11582. [Google Scholar] [CrossRef] [Green Version]
  24. Rudolph, V.; Schopfer, F.J.; Khoo, N.K.H.; Rudolph, T.K.; Cole, M.P.; Woodcock, S.R.; Bonacci, G.; Groeger, A.L.; Golin-Bisello, F.; Chen, C.S.; et al. Nitro-Fatty Acid Metabolome: Saturation, Desaturation, β-Oxidation, and Protein Adduction. J. Biol. Chem. 2009, 284, 1461–1473. [Google Scholar] [CrossRef] [Green Version]
  25. Tsikas, D.; Zoerner, A.; Mitschke, A.; Homsi, Y.; Gutzki, F.M.; Jordan, J. Specific GC-MS/MS Stable-Isotope Dilution Methodology for Free 9- and 10-Nitro-Oleic Acid in Human Plasma Challenges Previous LC-MS/MS Reports. J. Chromatogr. B Anal. Technol. Biomed. Life Sci. 2009, 877, 2895–2908. [Google Scholar] [CrossRef] [PubMed]
  26. Tsikas, D.; Zoerner, A.A.; Mitschke, A.; Gutzki, F.M. Nitro-Fatty Acids Occur in Human Plasma in the Picomolar Range: A Targeted Nitro-Lipidomics GC-MS/MS Study. Lipids 2009, 44, 855–865. [Google Scholar] [CrossRef] [PubMed]
  27. Saini, R.K.; Prasad, P.; Shang, X.; Keum, Y.S. Advances in Lipid Extraction Methods—A Review. Int. J. Mol. Sci. 2021, 22, 13643. [Google Scholar] [CrossRef] [PubMed]
  28. Folch, J.; Lees, M.; Sloane Stanley, G.H. A Simple Method for the Isolation and Purification of Total Lipids from Animal Tissues. J. Biol. Chem. 1957, 226, 497–509. [Google Scholar] [CrossRef] [PubMed]
  29. Bligh, E.G.; Dyer, W.J. A Rapid Method of Total Lipid Extraction and Purification. Can. J. Biochem. Physiol. I 1959, 37, 911–917. [Google Scholar] [CrossRef]
  30. Li, M.J.; Xiao, H.; Qiu, Y.X.; Huang, J.H.; Man, R.Y.; Qin, Y.; Xiong, G.H.; Peng, Q.H.; Jian, Y.Q.; Peng, C.Y.; et al. Identification of Potential Diagnostic Biomarkers of Cerebral Infarction Using Gas Chromatography-Mass Spectrometry and Chemometrics. RSC Adv. 2018, 8, 22866–22875. [Google Scholar] [CrossRef] [PubMed] [Green Version]
  31. Persson, X.M.T.; Błachnio-Zabielska, A.U.; Jensen, M.D. Rapid Measurement of Plasma Free Fatty Acid Concentration and Isotopic Enrichment Using LC/MS. J. Lipid Res. 2010, 51, 2761–2765. [Google Scholar] [CrossRef] [Green Version]
  32. Jenkins, B.; West, J.A.; Koulman, A. A Review of Odd-Chain Fatty Acid Metabolism and the Role of Pentadecanoic Acid (C15:0) and Heptadecanoic Acid (C17:0) in Health and Disease. Molecules 2015, 20, 2425–2444. [Google Scholar] [CrossRef] [PubMed] [Green Version]
  33. Pranger, I.G.; Corpeleijn, E.; Muskiet, F.A.J.; Kema, I.P.; Singh-Povel, C.; Bakker, S.J.L. Circulating Fatty Acids as Biomarkers of Dairy Fat Intake: Data from the Lifelines Biobank and Cohort Study. Biomarkers 2019, 24, 360–372. [Google Scholar] [CrossRef] [PubMed] [Green Version]
  34. Yakoob, M.Y.; Shi, P.; Willett, W.C.; Rexrode, K.M.; Campos, H.; Orav, E.J.; Hu, F.B.; Mozaffarian, D. Circulating Biomarkers of Dairy Fat and Risk of Incident Diabetes Mellitus Among Men and Women in the United States in Two Large Prospective Cohorts. Circulation 2016, 133, 1645–1654. [Google Scholar] [CrossRef] [PubMed] [Green Version]
  35. Slim, M.; Ha, C.; Vanstone, C.A.; Morin, S.N.; Rahme, E.; Weiler, H.A. Evaluation of Plasma and Erythrocyte Fatty Acids C15:0, t-C16:1n-7 and C17:0 as Biomarkers of Dairy Fat Consumption in Adolescents. Prostaglandins Leukot. Essent. Fat. Acids 2019, 149, 24–29. [Google Scholar] [CrossRef]
  36. Shibata, R.; Gotoh, N.; Kubo, A.; Kanda, J.; Nagai, T.; Mizobe, H.; Yoshinaga, K.; Kojima, K.; Watanabe, H.; Wada, S. Comparison of Catabolism Rate of Fatty Acids to Carbon Dioxide in Mice. Eur. J. Lipid Sci. Technol. 2012, 114, 1340–1344. [Google Scholar] [CrossRef]
  37. Jenkins, B.; Aoun, M.; Feillet-Coudray, C.; Coudray, C.; Ronis, M.; Koulman, A. The Dietary Total-Fat Content Affects the In Vivo Circulating C15:0 and C17:0 Fatty Acid Levels Independently. Nutrients 2018, 10, 1646. [Google Scholar] [CrossRef] [Green Version]
  38. Strassburg, K.; Huijbrechts, A.M.L.; Kortekaas, K.A.; Lindeman, J.H.; Pedersen, T.L.; Dane, A.; Berger, R.; Brenkman, A.; Hankemeier, T.; Van Duynhoven, J.; et al. Quantitative Profiling of Oxylipins through Comprehensive LC-MS/MS Analysis: Application in Cardiac Surgery. Anal. Bioanal. Chem. 2012, 404, 1413–1426. [Google Scholar] [CrossRef] [Green Version]
  39. Nadtochiy, S.M.; Baker, P.R.S.; Freeman, B.A.; Brookes, P.S. Mitochondrial Nitroalkene Formation and Mild Uncoupling in Ischaemic Preconditioning: Implications for Cardioprotection. Cardiovasc. Res. 2009, 82, 333–340. [Google Scholar] [CrossRef] [PubMed] [Green Version]
  40. Demine, S.; Renard, P.; Arnould, T. Mitochondrial Uncoupling: A Key Controller of Biological Processes in Physiology and Diseases. Cells 2019, 8, 795. [Google Scholar] [CrossRef] [Green Version]
  41. Padilla, M.N.; Mata-Pérez, C.; Melguizo, M.; Barroso, J.B. In Vitro Nitro-Fatty Acid Release from Cys-NO2-Fatty Acid Adducts under Nitro-Oxidative Conditions. Nitric Oxide Biol. Chem. 2017, 68, 14–22. [Google Scholar] [CrossRef] [PubMed]
  42. Bonacci, G.; Baker, P.R.S.; Salvatore, S.R.; Shores, D.; Khoo, N.K.H.; Koenitzer, J.R.; Vitturi, D.A.; Woodcock, S.R.; Golin-Bisello, F.; Cole, M.P.; et al. Conjugated Linoleic Acid Is a Preferential Substrate for Fatty Acid Nitration. J. Biol. Chem. 2012, 287, 44071–44082. [Google Scholar] [CrossRef] [PubMed] [Green Version]
  43. Whelan, J.; Fritsche, K. Linoleic Acid. Adv. Nutr. 2013, 4, 311. [Google Scholar] [CrossRef] [PubMed] [Green Version]
  44. Granado-Casas, M.; Mauricio, D. Oleic Acid in the diet and what it does: Implications for diabetes and its complications. In Bioactive Food as Dietary Interventions for Diabetes; Academic Press: New York, NY, USA, 2019; pp. 211–229. [Google Scholar]
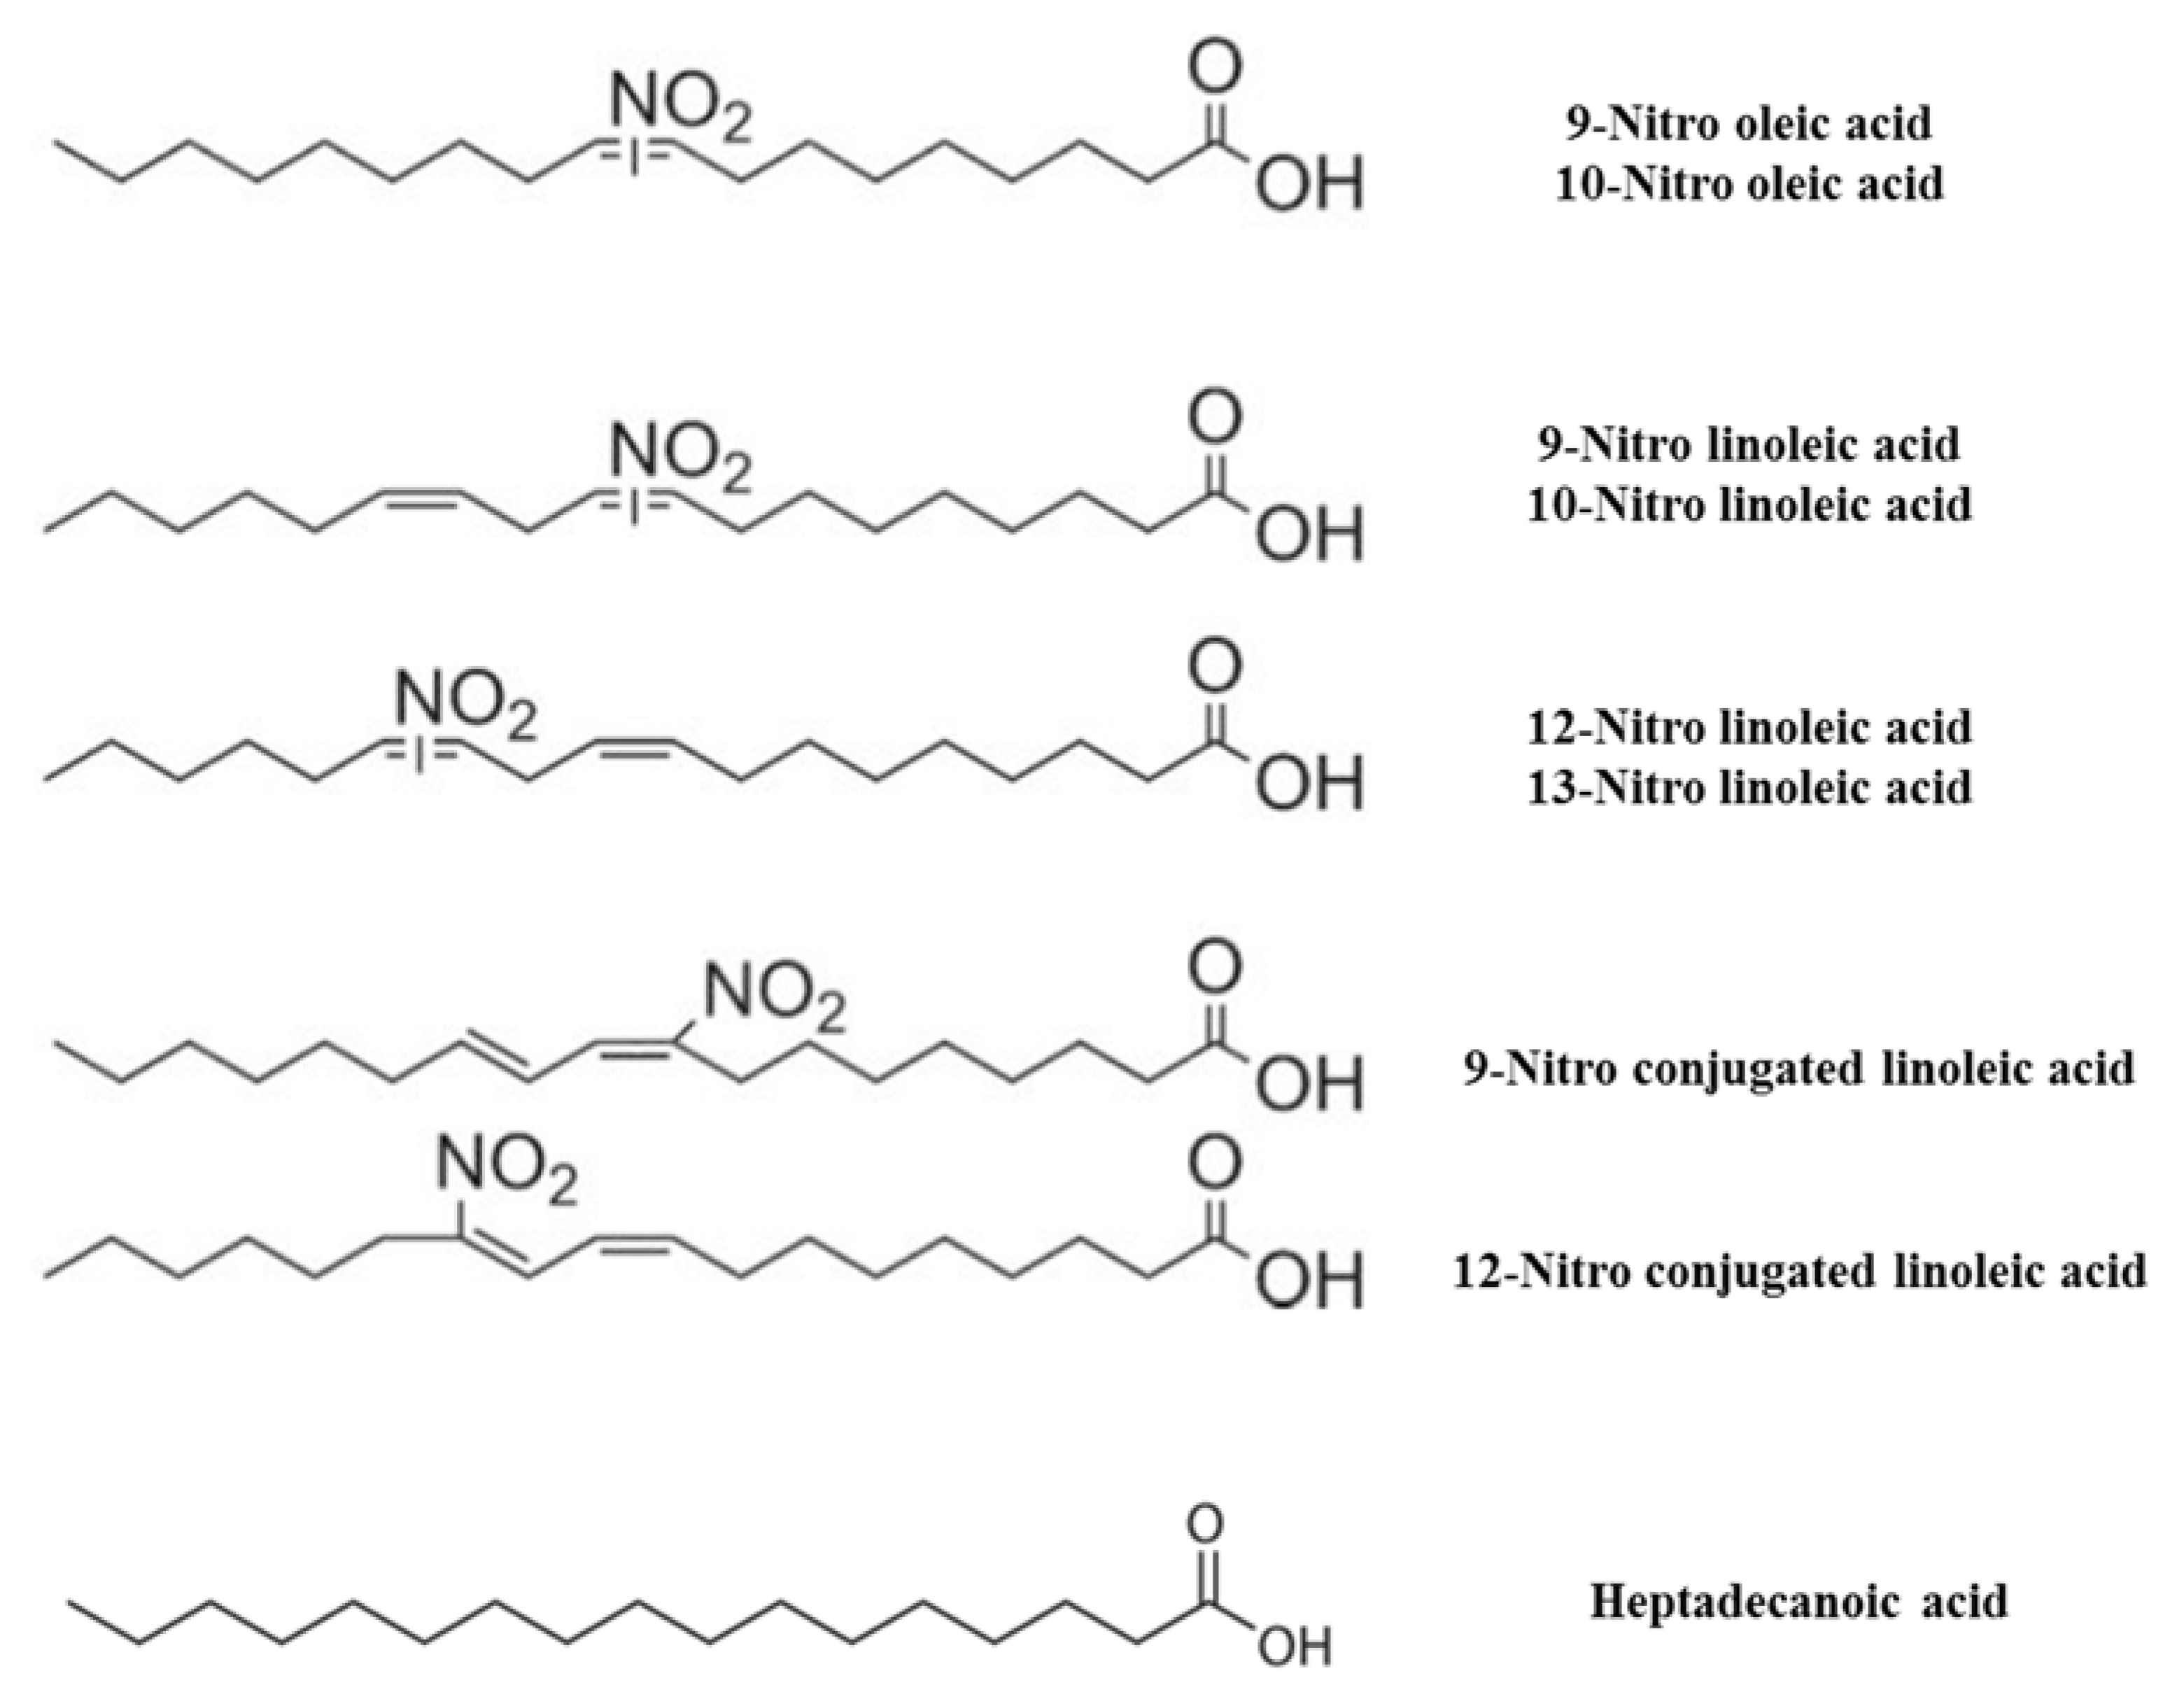
Figure 1. Structures of nitro oleic, nitro linoleic and nitro-conjugated linoleic acid with their positional isomers and structural analog heptadecanoic acid, which was used as an internal standard. Adapted with permission from Ref. [4], 2011, copyright Schopfer, F.J.
Separations 10 00087 g001
Figure 2. Mass transitions used for quantification of NO2-LA (top) and NO2-OA (bottom) in extracted plasma using reversed phase UPLC-MS/MS, mobile phase: H2O and ACN containing 0.05% NH4OH.
Separations 10 00087 g002
Figure 3. Synthesis of NO2-LA via nitro selenation/nitromercuriation reaction, which involves 2 steps: double bond activation and oxidation, and yields an equimolar distribution of nitrated regioisomers.
Separations 10 00087 g003
Figure 4. Full scans and mass spectra in the negative ion mode for synthesized NO2-OA (right) and NO2-LA (left) after purification.
Separations 10 00087 g004
Figure 5. Retention and sensitivity of NO2-OA, NO2-LA and HDA on reversed phase UPLC-MS/MS using acidic (right) and basic (left) mobile phase additives.
Separations 10 00087 g005
Figure 6. Calibration curves of NO2-OA and NO2-LA in pooled plasma, in the presence of HDA as an internal standard, to assess linearity over a concentration range of 0–60 nM spiked NO2-FAs. Each calibration point is the average of 3 datapoints. Error bars represent a ± standard error of the mean.
Separations 10 00087 g006
Figure 7. Plasma NO2-OA and NO2-LA levels in IHD patients and healthy controls. Significant difference is observed in NO2-OA levels (p-value = 0.00071), whereas no significant difference was found in NO2-LA levels (p-value = 0.87288). Within each box, × represents the mean and the horizontal line represents the median.
Separations 10 00087 g007
Figure 8. Formation of nitroalkenes under low and high oxygen conditions. Adapted with permission from Ref. [4]. Copyright 2011, F. J. Schopfer.
Separations 10 00087 g008
Table 1. Monitored transitions for NO2-OA, NO2-LA and HDA and their MS ionization parameters in negative ion MRM mode.
CompoundParent (m/z)Daughter (m/z)Cone Voltage (V)Collision Energy (V)
NO2-OA326.144345.92632510
326.1443308.1792258
NO2-LA324.150045.85002510
324.1500306.0000258
HDA269.2000269.2000455
269.2000250.94004522
Table 2. Linear gradient applied for NO2-FAs separation on RP-UPLC-MS/MS.
Time (Min)Flow Rate (ml/Min)Mobile Phase A (%)
H2O + 0.05% NH4OH
Mobile Phase B (%)
ACN + 0.05% NH4OH
Initial0.30015.085.0
0.500.30015.085.0
3.500.3000.0100.0
4.000.3000.0100.0
4.500.30015.085.0
8.000.30015.085.0
Table 3. Plasma lipid extraction and standard addition protocol for the quantification of NO2-FAs in plasma.
Aliquot 1
(0 nM)
Aliquot 2
(20 nM)
Aliquot 3
(40 nM)
Plasma150 μL150 μL150 μL
IS (1 μg/mL)3 μL3 μL3 μL
Vortex30 s30 s30 s
NO2-FAs (200 nM of NO2-OA and NO2-LA)0 μL3 μL6 μL
Vortex30 s30 s30 s
Acidified MeOH150 μL147 μL144 μL
Vortex1 min1 min1 min
Incubate (4 °C)20 min20 min20 min
0.02% BHT in DEE1500 μL1500 μL1500 μL
Vortex3 min3 min3 min
Centrifuge
(4 °C, 4000 rpm)
15 min15 min15 min
Filter1275 μL1275 μL1275 μL
Concentrate under vacuum, no heat
Reconstitute in 30 μL of MeOH/IPA
Table 4. Limits of quantification of NO2-OA and NO2-LA in plasma, estimated from the lowest statistically significant increase in response.
NO2-OANO2-LA
Spiked conc. (nM)010010
Peak area ratio *0.170 ± 0.0220.224 ± 0.0120.030 ± 0.0010.064 ± 0.012
T-test (p-value)0.009970.01671
LOQ (nM)10 nM10 nM
* Average of 3 replicates ± standard deviation.
Disclaimer/Publisher’s Note: The statements, opinions and data contained in all publications are solely those of the individual author(s) and contributor(s) and not of MDPI and/or the editor(s). MDPI and/or the editor(s) disclaim responsibility for any injury to people or property resulting from any ideas, methods, instructions or products referred to in the content.