Abstract
Plants of the genus Echinop (Asteraceae) are traditional medicinal plants used to treat several GIT ailments, owing to their diverse bioactive secondary metabolites, including sesquiterpenoids, triterpenoids, phytosterols, phenolics, flavonoids, alkaloids, and essential oils. Echinops erinaceus Kit Tan is a wild perennial herb of the genus Echinops which is endemic to Oman, Saudi Arabia, and Yemen. Currently, there are no previous reports exploring its anti-ulcer and anti-inflammatory effects. Additionally, few reports have described the chemical profile of E. erinaceus Kit Tan. In the current study, the CHCl3 fraction of the aerial parts of the plant was subjected to chromatographic isolation and spectroscopic identification via 1D and 2D NMR, and MS. The plant afforded two new compounds, designated erinaceolic acid (E3) and erinaceoside (E5), in addition to five known compounds, namely taraxasterol acetate (E1), taraxasterol (E2), apigenin (E4), stigmasterol-3-O-β-D-glucoside (E6), and speranskoside (E7). The evaluation of the gastric ulcer protective activity of the total extract and successive fractions of E. erinaceus, using the in vivo ethanol-induced ulcer in rats model, revealed the significant effect of the tested extracts and fractions on the percentage of gastric ulcer protection and ulcer index (500 mg/kg) compared to antodine (20 mg/kg). The tested extracts and fractions also reduced the stomach contents of TNF-α and reduced IL-6 as compared to the untreated group. Histopathological examination of the gastric mucosal tissues of rats supportedprevious results. In addition, the main subfractions and their isolates were assessed for their in vitro anti-inflammatory activity against COX-2 and 15-LOX enzymes. The new compounds erinaceolic acid (E3) and speranskoside (E7) exhibited strong inhibition against COX-2 (3.41 and 2.62 µg/mL) and 15-LOX (10.05 and 5.51 µg/mL), respectively. A molecular docking study was performed to reveal the binding interaction modes of the most active compounds against the binding sites of COX-2 (PDB ID 3LN1) and 15-LOX (PDB ID 1LOX) proteins. Speranskoside (E7) showed a dual binding affinity better than that of the cocrystallized references, celecoxib and (2E)-3-(2-oct-1-yn-1-ylphenyl)acrylic acid (RS7) against both enzymes. This study shed a light on the potential use of E. erinaceus in the protection and treatment of gastric ulcers.
1. Introduction
Inflammation is one of the compulsive pathological conditions that result from a wide range of etiological aspects, such as diabetes, rheumatic, respiratory, chronic bowel, immune-mediated, cardiovascular, and chronic kidney disorders. Peptic ulcers are one of the most painful and bothersome inflammatory disorders and are mostly due to Helicobacter pylori infection and the use of NSAIDs [1,2]. In folk medicine, peptic ulcers are treated with several species from various plant families, mostly without scientific evidence. That said, some clinical trials have proved that herbal medicines such as Aloe vera juice and the rhizome of several Coptis spp. (syn. Coptidis rhizome) are effective treatments for gastric ulcers [3,4].
Plants of the genus “Echinops” were used traditionally to treat GIT disorders such as constipation [5], and have been shown to possess other related biological activities, such as antiulcer, antidiarrheal, and spasmolytic activities [5,6,7], which may be attributed to their bioactive classes, including alkaloids, phenolic compounds, phytosterols, terpenoids, and essential oils [8]. The anti-inflammatory activities of the different extracts of several Echinops species have been described in the literature [9,10,11]. In a previous study by our research group, the preliminary screening of different extracts of the aerial parts of the Saudi wild medicinal plant E. erinaceus against COX-1, COX-2, and 15-LOX enzymes has been described. The ethyl acetate (EtOAc) and chloroform (CHCl3) fractions exhibited promising inhibitory activity against 15-LOX (IC50 2.2 μm and 2.9 μm, respectively) [12]. Additionally, chemical and biological investigations of the CHCl3 extract of the same plant led to the isolation of diverse phytochemical classes, including unsaturated fatty acid esters (such as methyl and ethyl oleate), pseudoguaiane sesquiterpenes (such as erinaceosin), benzofurans (such as loliolide), phenolics (such as E-p-coumaric acid and 5,7,3`,5`-tetrahydroxy flavanone), and abscisic alcohol derivatives (such as erinaceol) [13]. Biological evaluations of the extracts and/ or bioactive compounds from this plant showed antioxidant, cytotoxic, and antimicrobial activities [13]. Additionally, the anti-inflammatory activity of taraxasterol acetate isolated from E. echinatus Roxb. and E. spinosus was reported against carrageenan and formaldehyde-induced inflammations in animal models [14]. Likewise, apigenin isolated from the whole E. echinatus Roxb. showed in vitro antifungal effects against the conidia of Alternaria tenuissima (Kunz. ex Pers.) [14]. The sesquiterpene glycoside, macrochaetoside A and B, and the triterpenoid cyclostenol from E. macrochaetus Boiss. showed cytotoxic activity towards three cancer cell lines, including MCF-7, HEPG-2, and HCT-116 [15]. The hexane extract of the E. spinosissimus Turra subsp. Spinosus was shown to accumulate β-sitosterol (44.97%) and stigmasterol (34.95%) of the total phytosterol content, and was demonstrated to have antibacterial activity against a panel of Gram-positive and Gram-negative bacteria using the diffusion disc and broth micro-dilution assays [16].
Therefore, the present study aimed to isolate and structurally characterize further phytochemicals from the bioactive CHCl3 fraction of E. erinaceus. Moreover, in vivo assessment of the protective effect of the total methanol extract and successive fractions of E. erinaceus against ethanol-induced gastric ulcers in rats, including estimation of the gastric contents of TNF-α and IL-6, was carried out. Additionally, in vitro evaluation of the inhibitory activity of the main bioactive CHCl3 fractions and their isolated compounds against the pro-inflammatory enzymes, COX-2 and 15-LOX, using in vitro and in silico methods, was performed. Furthermore, in silico prediction of the pharmacokinetics and drug-likeness properties of the investigated compounds were discussed.
2. Materials and Methods
2.1. Plant Material
The aerial parts of Echinops erinaceus Kit Tan were collected from the local desert in Riyadh, Saudi Arabia in March 2018. The plant was identified as mentioned before [12,13]. The powdered plant was extracted and fractionated according to the method reported previously [12,13].
2.2. General Experimental Procedures
The solvents of analytical grade and sephadex LH-20 were purchased from Sigma-Aldrich (St. Louis, MO, USA). Silica gel 60 type A (70–230 mesh), and RP-Silica gel (25–40 µm) were obtained from Merck (Darmstadt, Germany). The pump of MPLC RHSY Synchronous Metering Pump was purchased from Fluid Metering, Inc (Palo Alto, CA, USA). TLC plates were visualized by spraying with a 10% methanolic solution of vanillin-sulfuric acid (H2SO4), followed by heating to 100 °C. The 1D and 2D NMR were obtained on a Bruker UltraShield Plus 500 MHz spectrometer (Bruker, Fällanden, Switzerland) at 500 MHz for 1H and 125 MHz for 13C-NMR, while HRESIMS spectra were acquired on a UPLC RS Ultimate 3000-Q in negative- or positive-ion mode. Optical activity was measured on a Perkin-Elmer Model 341 LC polarimeter (PerkinElmer, Waltham, MA, USA) at ambient temperature.
2.3. Isolation and Purification of Compounds from the CHCl3 Fraction
The CHCl3 (40 g) fraction was subjected to column chromatography (CC) over silica gel (850 g). Elution was achieved with gradient elution, using a mixture of CHCl3-MeOH with increasing polarity from 100:0 to 0:100 v/v, and fractions of 150 mL were collected. Similar fractions were combined together based on TLC monitoring to give a total of fourteen major fractions. Fraction-1 (1.2 g) was purified by chromatography on Si gel columns using a mixture of ethyl acetate/n-hexane (0:100 to 10:90) followed by an RP-18 column (iso-propanol-water, (6–4 till 10–0), v/v) to yield compound E1 (53 mg). Fraction-2 (0.2 g) was treated similarly to Fraction-1 to yield compound E2 (53 mg). The Fraction-3 (1.0 g) was subjected to Si gel column chromatography eluted with n-hexane-ethyl acetate (1:9 → 1:1, v/v) to give nine subfractions (Fractions-3 I-IX). Subfraction Fraction-3-III was purified by re-chromatography on a Si RP-18 column (MeOH-H2O, 3:7, v/v) to give compound E3 (15 mg). The Fraction-4 (1.0 g) was chromatographed using a Si gel RP-18 column (methanol-water, 3:7 to 6:4, v/v) to give six main fractions (Fractions-4-I-VI). Fraction-4-III (300 mg) afforded compound E4 (40 mg) and compound E5 (18 mg) by purification on a sephadex LH-20 column, and on RP-18 using MeOH-H2O (4–6 to 10–0, v/v). Fraction-5 (1.5 g) was subjected to chromatography on Si gel column eluted with EtOAc/n-hexane (10–100%) followed by MeOH/EtOAc (10–100%) to yield six subfractions (Fractions-5-I-VI). Fraction-5-VI (700 mg) was purified on a Si gel column using 5% MeOH/CHCl3 and afforded compound E6 (100 mg). Fraction-6 (2.2 g) was purified on a sephadex LH-20 column to yield compound E7 (20 mg). The isolation procedure of compounds is outlined in flowcharts S1–S3.
2.4. In Vivo Anti-Ulcer Assay
2.4.1. Animals
Acute Toxicity Assay
Twenty Swiss mice (20–30 g) of both sexes were fasted overnight and provided with water. Mice were randomly divided into four groups of five animals each. The crude methanol extract was administered via oral gavage. The procedure was repeated for further higher doses of 10, 50, 200, and 500 mg/kg, and the mice were observed for any mortality for 48 h.
Anti-Ulcer Assay
Forty Sprague Dawley male rats (140–150 g) for the anti-ulcer assay and Swiss mice (20–30 g) both sex for the acute toxicity assay were provided by the animal house of the National Research Centre (Cairo, Egypt). The animal experiments were performed according to the laboratory guidance of the recommendations of the health Guide for the Care and Use of Laboratory Chemicals and Animals with ethical approval number: MP (2255) and MP (3086).
2.4.2. Induction of Gastric Ulcer and Preparation of Tissue Homogenate
Anti-ulcer activity was evaluated in an ethanol-induced gastric ulcer model in rats according to the method described before [17]. The animals were fasted for 24 h with free access to water. Rats were randomly assorted into eight groups of five rats. Group I (control gp) was composed of normal rats that received saline vehicle (1ml/kg). Rats in Group II (ethanol control) received a single intragastric dose of absolute ethanol (1 mg/kg). Group III received a single intragastric dose of ethanol + antodine (20 mg/kg, Sigma-Aldrich, St. Louis, MO, USA). Groups IV-VIII received a single intragastric dose of ethanol + a single intragastric dose (500 mg/ kg) of the five crude extracts of E. erinaceus separately. Rats were given treatments and antodine 1 hr before ulcer induction by oral gavage.
The stomach was placed in ice-cold phosphate buffer (pH 7.4) to prepare the 20% homogenate using a tissue homogenizer (MPW−120, Bit-Lab Medical instruments, Poland). Homogenized tissues were centrifuged at 4000 rpm/min for 10 min at 4οC using a cooling centrifuge (Laboratory Centrifuge, 2K15, B. Braun Sigma Co., Melsungen, Germany). The supernatant was collected and stored at −80 °C and then used for estimation of the gastric contents of tumor necrosis factor-α, TNF-α, and interleukin-6, IL-6 (SinoGeneClon Biotech Co., Ltd., Hangzhou, China).
2.4.3. Determination of Gastric Ulcer Index (UI) and Percentage of Inhibition
At the end of the experiment, the animals were euthanized under deep ether anesthesia 1 h post ethanol instillation. Following immediate laparotomy, the stomachs were excised, opened along the greater curvature, and rinsed with normal saline to remove gastric contents and blood clots. Stomachs were blotted dry and macroscopically inspected for gross gastric injury (expressed as ulcer index) [18]. The overall total diameter of ulcers in one stomach divided by factor 10 was designated as the ulcer index (UI) [19]. The percentage of protection was calculated by the following formula:
[(UI ethanol control—UI treated)/UI ethanol control] × 100
2.4.4. Determination of Gastric Content of TNF-α and IL-6
The gastric contents of TNF-α and IL-6 were determined using ELISA (Enzyme-Linked Immunosorbent Assay) kit and the results were calculated by following the manufacturer’s instructions (NOVA kit, Beijing, China). Standards and samples were pipetted into wells with immobilized antibodies specific for rat TNF-α and IL-6 and then incubated. TMB (tetramethylbenzidine) substrate solution was added to the wells; color developed proportionally to the amount of TNF-α and IL-6 bound. Color development was then discontinued (using Stop Solution) and its intensity was measured at 450 nm.
2.5. In Vitro COX-2 and 15-LOX Enzyme Assay
The in vitro ability of the test compounds to inhibit the COX-2 enzyme was determined using a COX-2 inhibitor screening assay kit (catalog number k547, Biovision, Waltham, MA, USA), and their ability to inhibit 15-LOX enzymes (IC50 values, μg/mL) was determined using a human recombinant enzyme assay kit (catalog no 760700, Cayman Chemical, Ann Arbor, MI, USA) according to the manufacturer’s instructions. The test samples were dissolved in DMSO and tested at concentrations ranging from 500 to 0.25 µg/mL in a final volume of 1 mL, or in the vehicle (DMSO, 1.0%). Stock solutions were freshly prepared before use, and buffer solution (0.1M Tris HCl, pH, 7.4) was used. Nordihydroguairetic acid (NDGA) was used as a positive control for the COX-2/15-LOX inhibition assays. The samples were tested at twelve different concentrations (0.25, 0.5, 1, 2, 3.9, 7.8, 15.6, 31.25, 62.5, 125, 250, 500 μg/mL) in a final volume of 210 Ml in a triplicate manner. The concentration of the test compound which caused 50% inhibition (IC50) was calculated from the concentration–response curve using GraphPad Prism software, version 5 (San Diego, CA. USA). The 15-LOX was determined by measuring the increase in absorbance at 490 nm using a Microplate reader (Biotek, Winooski, VT, USA) [20,21].
2.6. Docking Study
2.6.1. Protein-Ligand Docking
Marvinsketch (https://chemaxon.com/ accessed on 27 June 2022), ADME prediction web tool (http://www.swissadme.ch/ accessed on 27 June 2022), PASS prediction web tool (http://www.way2drug.com/PASSOnline/index.php accessed on 25 April 2022). PyRx software, via AutoDock Vina 4.2 version and Discovery Studio Visualizer software, 2021 version, were used to generate the scoring functions (binding affinities) and visualization of the protein–ligand interactions involving non-bonding polar and hydrophobic interactions was accomplished using ChimeraX 1.3 software version. The ligand–protein interactions were investigated using COX-2 (PDB ID: 3LN1) [22] and 15-LOX (PDB ID: 1LOX) proteins [23]. The calculated binding free energies (E) and the binding interactions within the active site of different studied targets were determined.
2.6.2. Molecular Docking Analysis
The molecular docking analysis was performed as previously described [23,24]. The conformation of the molecule ligands within the appropriate target binding site of COX-2 (PDB: 3LN1) and 15-LOX (PDB: 1LOX) was accomplished using PyRx virtual screening tool software and Autodock 4 and Autodock Vina (The Scripps Research Institute, La Jolla, CA, USA) and Pymol v2.5.2 (Schrodinger, New York, NY, USA). Discovery Studio 2021 (Dassault Systemes, Vélizy-Villacoublay, France) was used to determine the manner of the contact and to visualize it in two dimensions, while UCSF ChimeraX 1.3 (San Francisco, CA, USA) was utilized to depict the molecules and interaction residues in three dimensions.
2.7. Statistical Analysis
The results were expressed as the mean ± S.D, and statistical comparisons were carried out using one-way analysis of variance (ANOVA) followed by Tukey’s multiple comparisons test. GraphPad Prism software, version 5 (Graph Pad Inc., San Diego, CA, USA) was used for all statistical tests. The difference was considered significant when p < 0.05 for the anti-ulcer assay.
3. Results and Discussion
3.1. Identification of the Isolated Compounds
3.1.1. Identification of Compounds E1 and E2
The 1H- and 13C-NMR spectra of E1 (Table S1, Figures S1 and S2) suggested a pentacyclic triterpenoid which was confirmed as taraxasterol acetate by comparison with the published data [25]. The 1H- and 13C-NMR spectra of compound E2 (Table S1, Figures S3 and S4) had a great similarity to that of E1. The major differences between the two compounds were the absence of the acyl group in E1 (δH 1.98, δC 21.8 and 171.5) and the upfield shift of the oxymethine signal of C-3 (δH 3.19, s; δC 79.0) in E2. Thus, E2 was identified as taraxasterol [25].
3.1.2. Identification of Compound E3
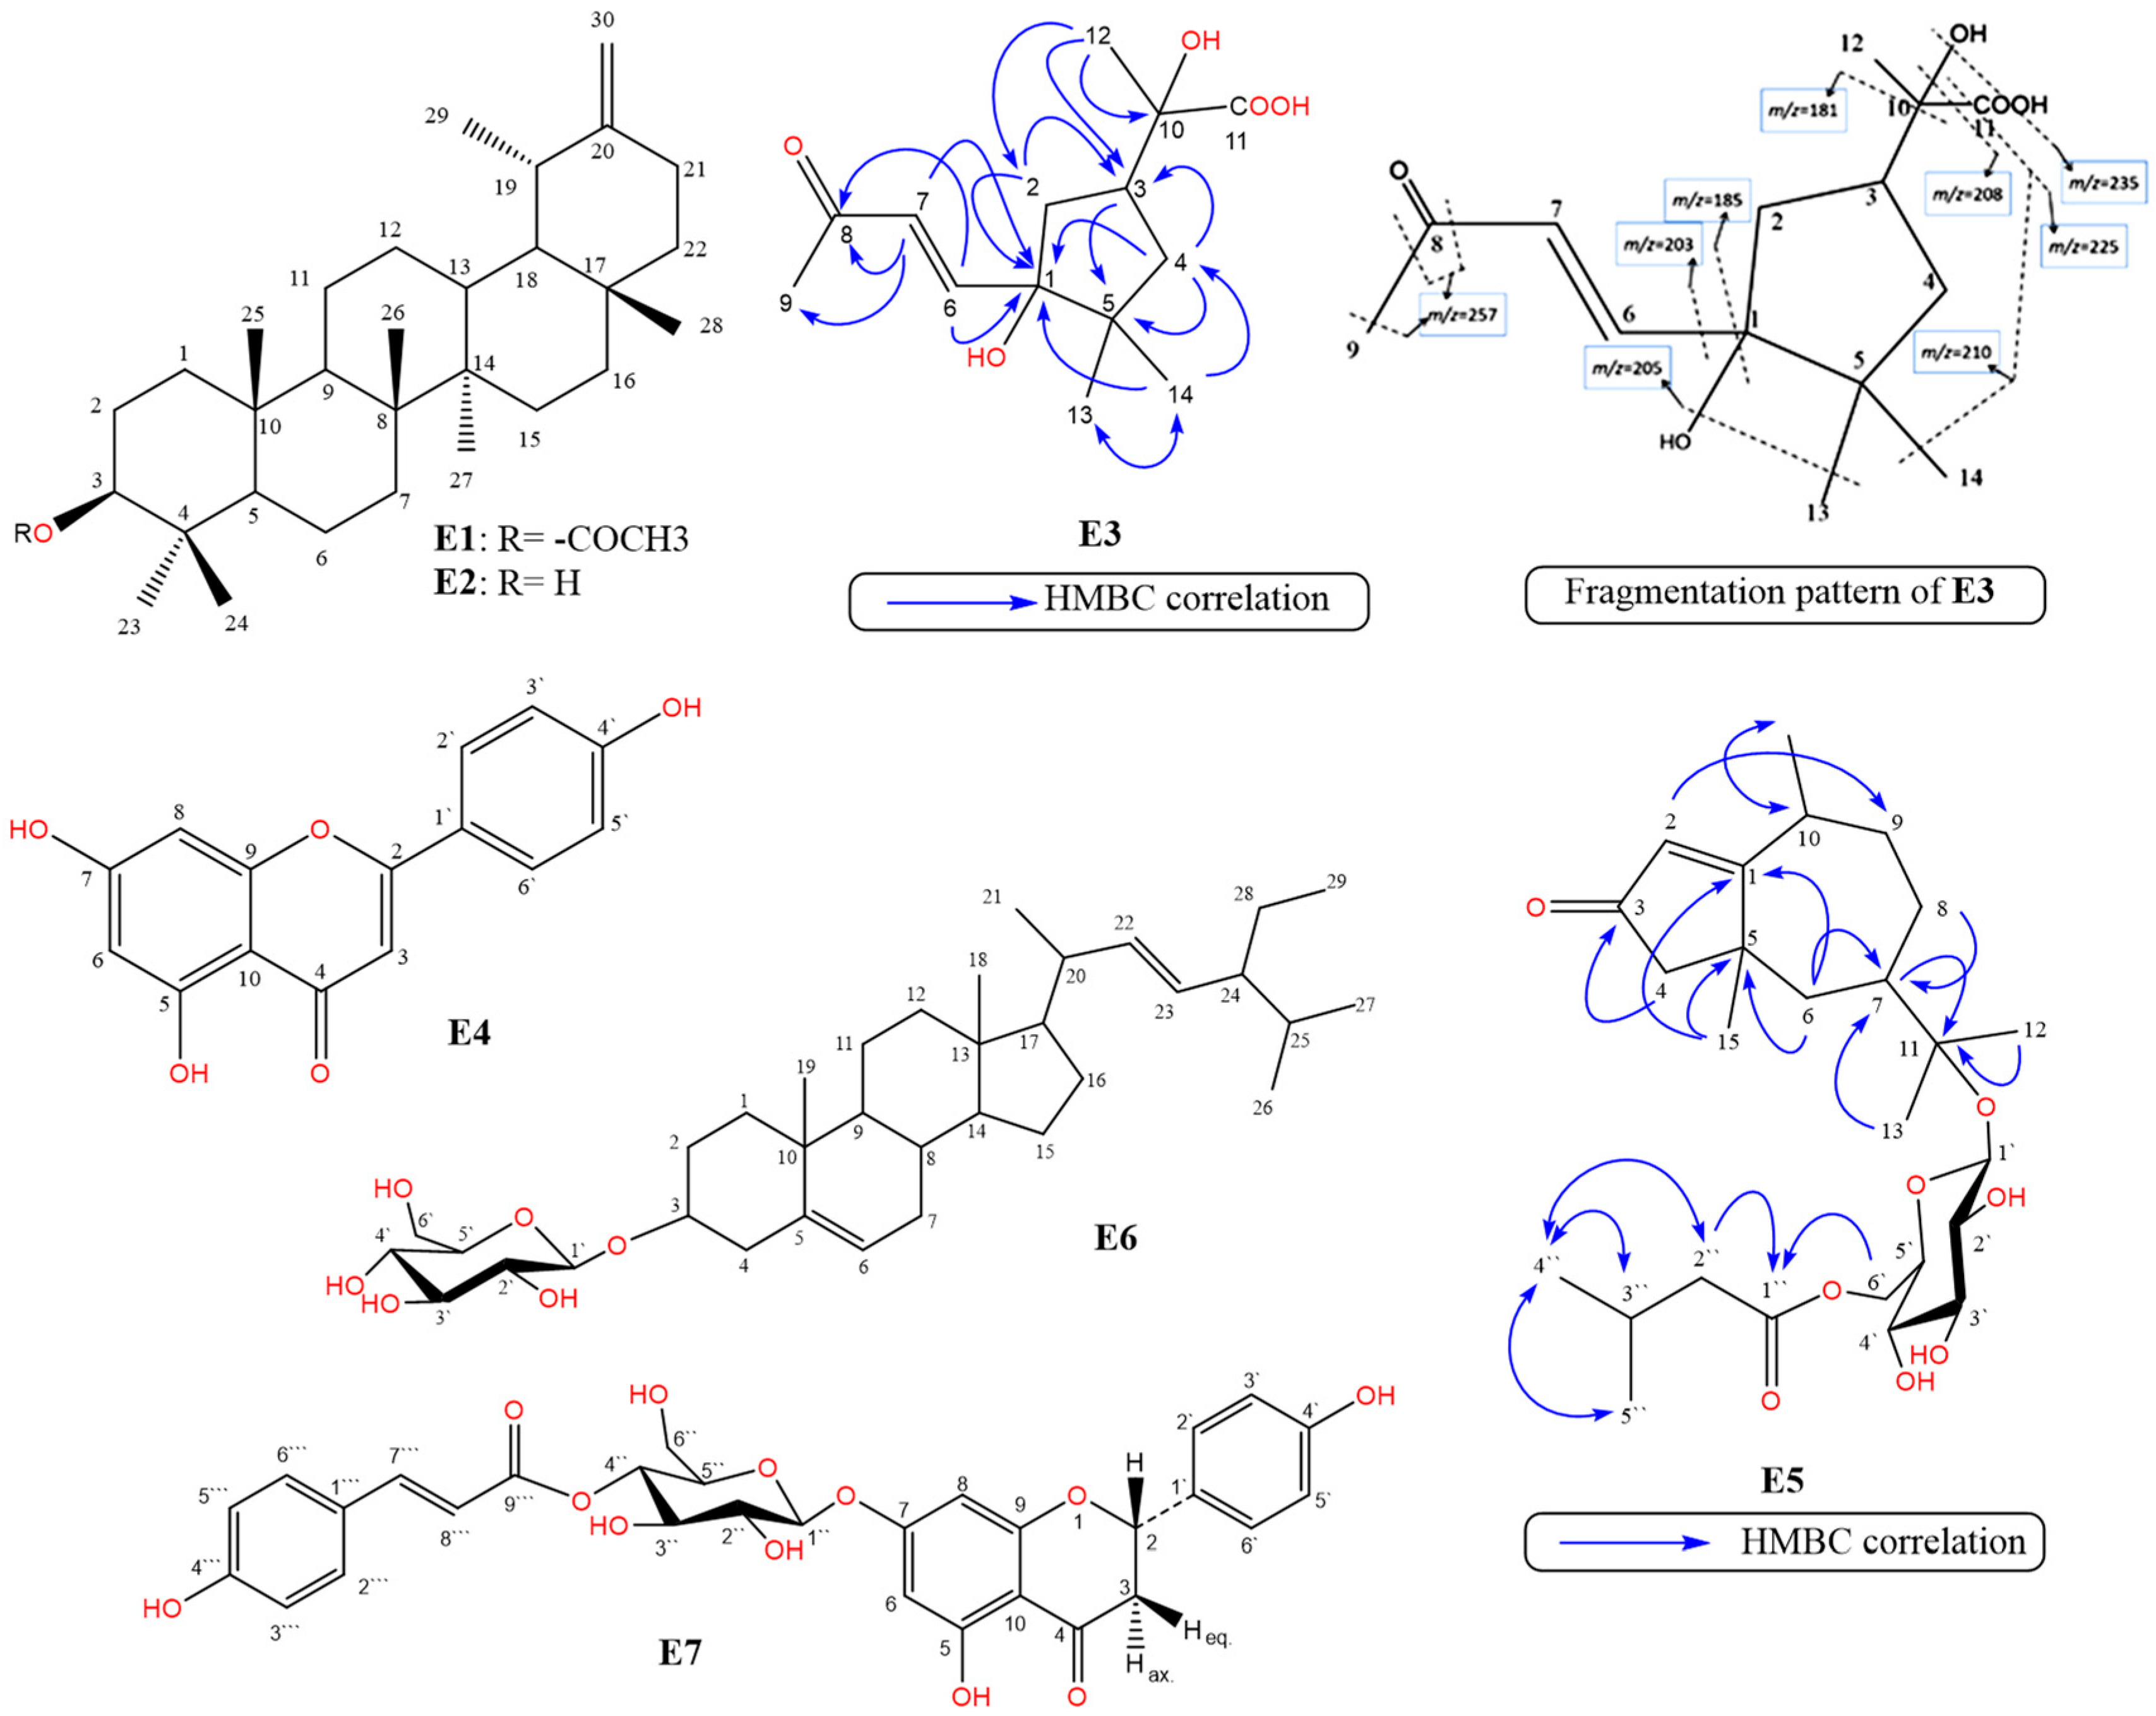
Compound E3 was isolated as colorless needles (m.p. 230–233 °C; – 23.3, c -0.02, CH3OH). Compound E3 was analysed and identified from the 1D, 2 DNMR and MS spectral data (Table 1, Figures S5–S12). The molecular formula was deduced as C14H22O5 based on the [M]+ ion at m/z 270.1467 [M+] (calcd. 270.3250) in HRESIMS (Table S2, Figure S12). The 1H-NMR, APT, DEPT, and HSQC spectra data of E3 (Table 1, Figures S5–S9) showed the presence of fourteen carbon signals. The presence of a cyclopentane ring system was evident from the presence of five aliphatic carbon signals distinguished into the following: an oxygenated carbon at δC 71.4 (C-1), a methine carbon signal at δC 64.9 (δH 3.68, C-3), two methylenes at δC 41.2 (δH 2.23 and 1.58, C-2) and 48.0 (δH 1.51 and 1.21, C-4), and a quaternary aliphatic carbon at δC 36.6 (C-5). The 1H-NMR spectrum of E3 displayed two trans olefinic protons at δH 7.11 (d, J = 15.8 Hz, H-6) and 6.10 (d, J = 15.8 Hz, H-7) of an α, β-unsaturated carbonyl residue. It also showed a downfield methyl singlet at δH 2.22 (δC 28.0, H-9), which was correlated in the HMBC spectrum (Figure S10) with a ketonic group at δC 201.0 (C-8) and with the olefinic carbons at δC 146.2 (C-6) and 134.3 (C-7). Moreover, the HMBC correlations of the proton signal at δH 6.10 (H-7) with the ketonic group (C-8)and with the adjacent carbons—including δC 146.2 (C-6), 28.0 (C-9), and 71.4 (C-1)—confirmed the presence of a 3-oxobut-1-en-1-yl side chain at C-1 of the cyclopentane ring, similar to the side chain in the closely related compound 4-hydroxy-3,5,5-trimethyl-4-[(1E)-3-oxobut-1-en-1-yl] cyclohex-2-en-1-one [26].

Table 1.
NMR spectral data for the compound E3 in CD3OD.
The previous spectral data (Table 1, Figures S5–S12) confirmed the presence of an undescribed cyclopentane ring system attached to a side chain. Further connectivity of the cyclopentane ring system with the side chain was confirmed from the very long-range or non-standard HMBC correlations (nJH-C n > 3) (Figure 1 and Figure S10) [27]. The presence of a 2-hydroxy propionic side chain at C-3 was confirmed by comparison with the side chain in 2-hydroxy-2-(p-tolyl)propanoic acid [28]. The relative configuration of E3 was determined by analysis of its NOESY spectrum and from the determination of the coupling constants (Figure S11). In particular, the NOESY correlations of δHH H-7/H-2 and H-14/H-4 indicated their α-configuration, and those between H-6/H-13, H-6/H-2, H-12/H-3, H-12/H-4, H-13/H-2, and H-13/H-12 indicated their β-configuration. Finally, the structure of compound E3 was established and confirmed by mass fragmentation as E-2-hydroxy-2-(3-hydroxy-4,4-dimethyl-3-(3-oxobut-1-en-1-yl) cyclopentyl)-propanoic acid and was named erinaceolic acid. To the best of our knowledge, this is the first report of this compound from nature.
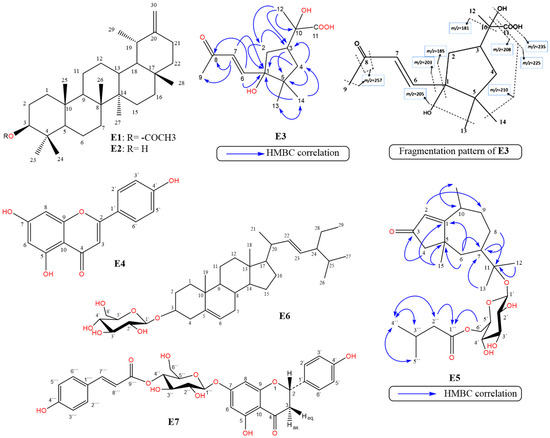
Figure 1.
Chemical structures of compounds E1–E7, HMBC correlations of E3 and E5, and mass fragmentation pattern of E3: Taraxasterol acetate (E1), Taraxasterol (E2), erinaceolic acid (E3), apigenin (E4), erinaceoside (E5), stigmasterol-3-O-β-D-glucoside (E6), and naringenin-7-O-β-D-(4″-trans-p-coumaroyl) glucoside (E7).
3.1.3. Identification of Compound E4
Compound E4 was identified as apigenin by comparing its 1H-NMR and APT spectra with a similar reported structure (Figures S13 and S14) [29].
3.1.4. Identification of Compound E5
Compound E5 was isolated as yellow amorphous powder (– 235.5, c. 0.24, CH3OH). Compound E5 was identified from the detailed study of its 1D, 2 DNMR and MS spectral data (Table 2, Figures S15–S21). The molecular formula was deduced as C26H42O8 based on the [M+H] + ion at m/z 483.2975 [M+H] + (calcd. 483.2913) in HRESIMS (Table S3, Figure S21). From the 1H- and 13C-NMR spectral data, the result of acid hydrolysis and positive test for sugar and/or glycoside revealed the presence of one sugar moiety, identified as β-D-glucose. The 1H-, 13C-NMR, APT, DEPT, and HMBC spectra (Table 2, Figures S15–S20) of E5 revealed the presence of twenty six carbon signals ascribed to the presence of a basic skeleton of a pseudoguaiane sesquiterpene [30], one glucose moiety and an isovaleroyl moiety. However, the presence of an α,β-unsaturated cyclopentenone ring in the pseudoguaiane skeleton was suggested based on the presence of a ketonic group at δC 202.5 (C-3), an endocyclic olefinic bond at δC 125.9 (C-2, δH 5.76 s), and a quaternary carbon signal at δC 180.2 (C-1), and was confirmed by the 3J- and 4J- HMBC correlations of H-2 with C-4, C-5, and C-9. The presence of two methyl singlets at δH 1.14 (δC 23.3, H-12) and 1.16 (δC 25.3, H-13), which were correlated in the HMBC spectrum to the oxygenated quaternary carbon at δC 80.9 (C-11) and the methine carbon at δC 42.6 (C-7), indicated the presence of a hydroxy-isopropyl group attached to C-7. The presence of a β-glucose moiety was evident from the proton signal at δH 4.45 (d, J= 7.4 Hz) which was correlated in the HSQC spectrum with anomeric carbon at δC 99.1 (C-1`). This was further confirmed by the presence of four oxygenated methines at δC 75.3 (C-3`), 75.7 (C-2`), 78.5 (C-5`), and 72.5 (C-4`), and a methylene at δC 65.4 (C-6`). The downfield chemical shift of C-11 (δC 80.9) and the HMBC correlation between C-11 and to the anomeric proton (Table 2, Figure S20) confirmed the position of the glycosylation site at C-11. An isovalerate moiety was evident from the existence of five proton/carbon signals, including two methyl doublets at 0.91 (6H, J= 6.4 Hz, δC 23.3, H-4``/ H-5``), a methylene at δH 2.12 (2H, d, J = 6.6 Hz, δC 44.6, H-2``), a methine at δH 2.01 (m), δC 27.2, H-3``, and finally an ester carbonyl group at δC 174.8 (C-1``) [15]. The acylation position at C-6` was evident from the downfield shift of C-6 (δC 65.4) and further confirmed by the 3J-HMBC correlation of the H2-6` of the sugar moiety (δH 3.97 and 4.42) with C-1`` (δC 174.8). From the aforementioned findings, the structure of E5 was confirmed as Δ1(2), 3-oxo-pseudoguaien-11-β-D-glucopyranosyl-6`-isovalerate or ambrosanoli-1(2)-en-3-oxo-11-O-[6`-O-isovaleryl-β-D-glucopyranoside], which was named erinaceoside, a new natural compound.

Table 2.
NMR spectral data for the compound E5 in CD3OD.
3.1.5. Identification of Compound E6
Comparison of the spectral data of E6, including 1H-NMR, APT, COSY, HSQC, and HMBC (Table S4 and Figures S22–S26) with those published in the literature [31,32,33] confirmed this compound’s assignment as stigmasterol-3-O-β-D-glucoside. It is worth noting that compounds E-1, E-2, E4 and E6 were identified for the first time from E. erincaeus (Figure 1).
3.1.6. Identification of Compound E7
Compound E7 was obtained as a buff solid (m.p. 253 °C). It had a molecular formula of C30H28O12 deduced from the 13C-NMR, APT, and DEPT spectra and from the pseudomolecular ion peak at m/z 603.1423 [M+Na]+ (calcd. 603.1478) in positive HRESIMS mode, and 579.1503 [M-H]− (calcd. 579.1502), and 615.1271 [M+ Cl]− (calcd. 615.1269) in negative HRESIMS mode. The result of acid hydrolysis and the spectral data (1H-, 13C-NMR, APT, and DEPT) of E7 (Table 3, Figures S27–S33) revealed the presence of one sugar moiety, a phenolic, and a flavanone skeleton identified as β-D-glucose, trans-p-coumaric acid and naringenin. The flavanone part was identified as naringenin, based on the 1H-NMR spectrum (Table 3, Figure S27) which showed the presence of six aromatic protons, including two meta-coupled protons at δH 6.18 (d, J= 2.5 Hz, H-6) and 6.20 (d, J = 2.2 Hz, H-8) of the A-ring of the flavanone moiety, two pairs of doublet protons of para-substituted aromatic rings at δH 7.34 (d, J= 8.1, 2H, H-2`/H-6`), and 6.80 (d, J= 8.2 Hz, 2H, H-3`/H-5`) of the B-ring. In addition, three signals resonating at δH 5.50 (dd, Jax. = 12.6, 2.05 Hz), 3.42 (m), and 2.75 (br.d, Jeq.= 17.0 Hz) were assigned to H-2, H-3ax, and HB-3eq. protons, respectively, of the C-ring [29,34]. The presence of a 7-O-β-glucosyl substitution was evident from the HMBC correlation between the proton signal at δH 5.13 (H-1``) and that at C-7 (δC 165.3). The phenolic acid moiety was identified as trans-p-coumaric acid from the pair of ortho-coupled protons at δH 7.57 (d, J= 8.57, Hz, 2H, H-2```/H-6```) and 6.80 (d, J= 8.2 Hz, 2H, H-3```/H-5```, H-7```) of the para-substituted benzene ring observed, and from the carbon signals resonances at δc 166.1 (C-9```), 160.1 (C-4```), 145.3 (C-7```), 130.6 (C-2```/C-6```), 125.3 (C-1```), 115.4 (C-3```/C-5```), and 114.3 (C-8```) [35]. The presence of a coumaric acid moiety was further confirmed by the presence of a characteristic fragment at m/z 273.0734 [M—coumaroyl glucose + 2H] (calcd. 273.0763), coincident with C14H19O5• (Table S5, Figures S32 and S33). Thus, the structure of E7 was confirmed as naringenin-7-O-β-D-(4``-trans-p-coumaroyl) glucoside (speranskoside), isolated for the first time from the Asteraceae family, but reported before from Speranskia tuberculata (Euphorbiaceae) [36,37].

Table 3.
NMR spectral data of compound E7 in DMSO-d6.
3.2. Biological Activities of the Main Fractions and Isolates from E. erinaceus
3.2.1. Acute Toxicity Test
Screening of the toxic effect of increased oral doses of the total MeOH extract revealed that the extract was non-toxic up to 500 mg/kg of body weight. The observation of the animals revealed no lethal effects and behavioral signs of toxicity at the tested doses, indicating that LD50 was greater than 50 mg/kg, with low toxicity in short-term use on the E. erinaceus crude methanol extract. Thus, the dose (500 mg/ kg, body weight) was selected for the in vivo experiments and the plant was categorized as safe.
3.2.2. In Vivo Anti-Ulcer Activity of Crude Extracts
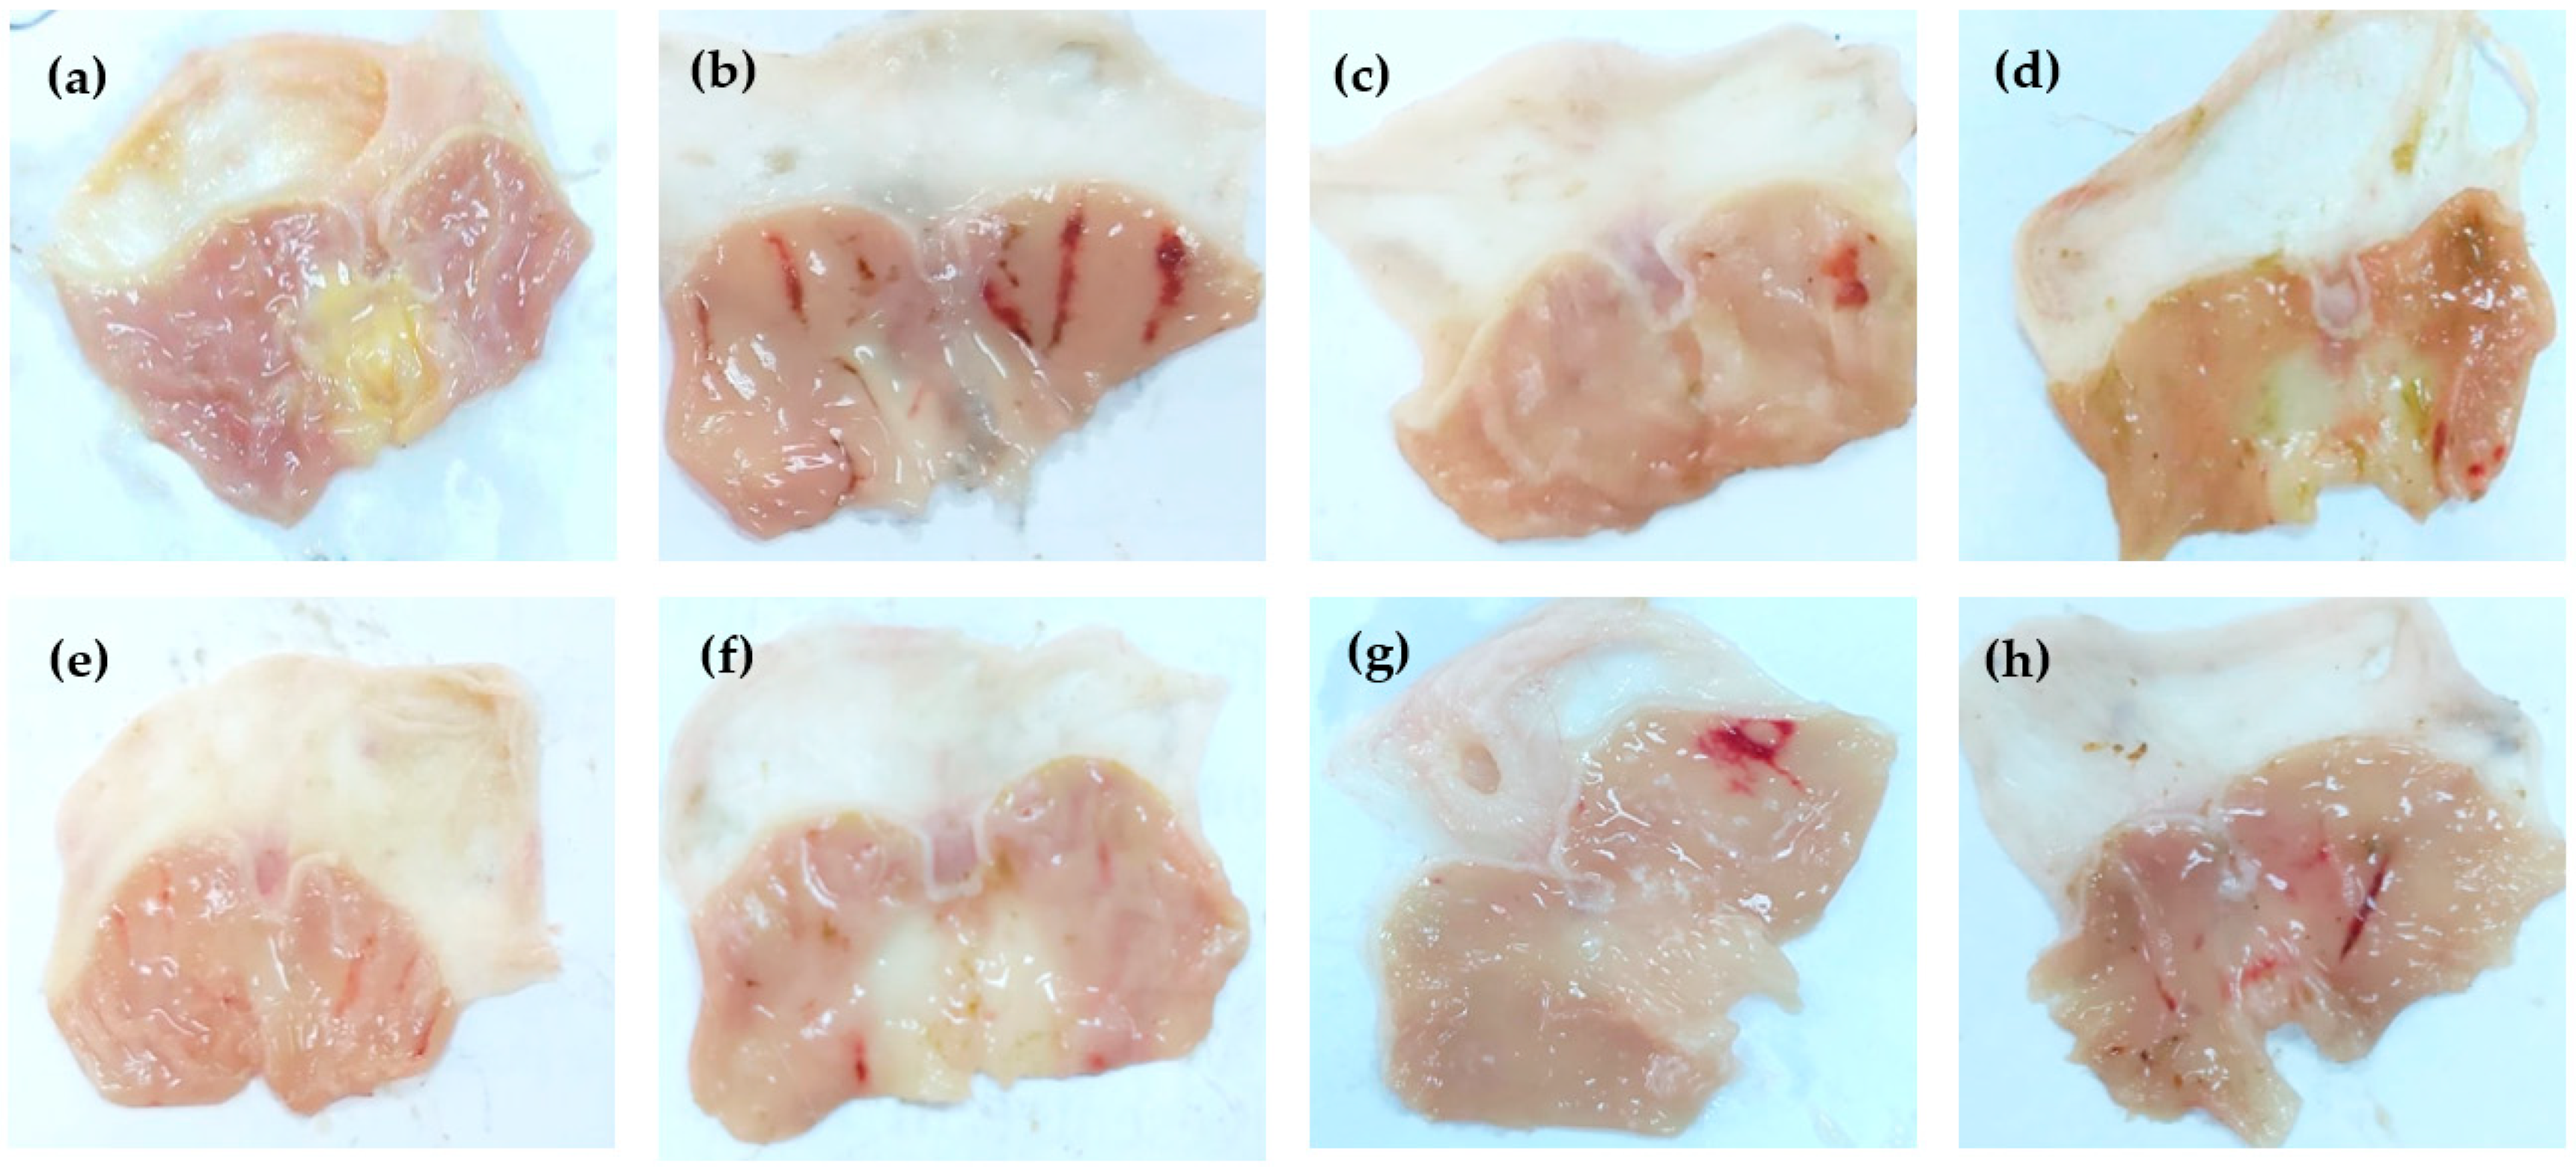
Based on the biologically guided procedure, the effect of five extracts of E. erinaceus on the ethanol-induced gastric ulcer rat model was evaluated to select promising fraction(s) for further phytochemical investigations (Table 4). Oral administration of absolute ethanol produced multiple mucosal lesions in the rat stomach. The results indicated that pre-treatment with antodine (the reference standard) and crude E. erinaceus extracts decreased ethanol-induced gastric mucosal injuries. The percentage of the ulcer protection was increased significantly (p < 0.05) in rats pre-treated with antodine (20 mg/Kg), MeOH, n-hexane (Hex), CHCl3, EtOAc, and the remaining aqueous (ReAq) extracts at a dose of 500 mg/Kg compared to the ethanol control group (63%, 71%, 73%, 72%, 67%, and 64%, respectively) (Table 4 and Figure 2). Remarkably, the ulcer protection of rats pre-treated with all tested extracts showed better results than antodine. TNF-α (tumor necrosis factor-α) and IL-6 (interleukin-6), the proinflammatory cytokines that contribute to various immunologic and inflammatory responses, were assessed [38,39]. The administration of ethanol produced an elevation in the stomach contents of TNF-α and IL-6 by 1.3 and 27-folds, respectively, compared to normal control values (Figures S34 and S35). Treatment with antodine reduced the stomach contents of TNF-α and IL-6 by 22 % and 55%, respectively, as compared to the ethanol group. However, the treatment with the different tested extracts (MeOH, n-Hex, CHCl3, EtOAc, and ReAq) decreased the stomach contents of TNF-α by 24%, 25%, 36%, 28%, and 21%, and reduced IL-6 gastric content by 54%, 74%, 94 %, 81%, and 35%, respectively, as compared to the ethanol group (Table 4).

Table 4.
Effect of the different extracts of E. erinaceus (500 mg/ kg) on ethanol-induced ulcers and on the gastric contents of TNF-α and IL-6.
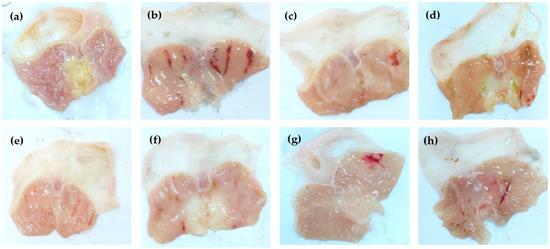
Figure 2.
Gross appearance of gastric mucosa of rats treated with; saline (a), ethanol 1 mL (b), ethanol + antodine 20 mg/kg (c), ethanol+ MeOH extract (d), ethanol+ n-Hex extract (e), ethanol+ CHCl3 extract (f), ethanol+ EtOAc extract (g), and ethanol+ ReAq extract (h), using an oral dose of 500 mg extract/kg.
3.2.3. Histopathological Examination
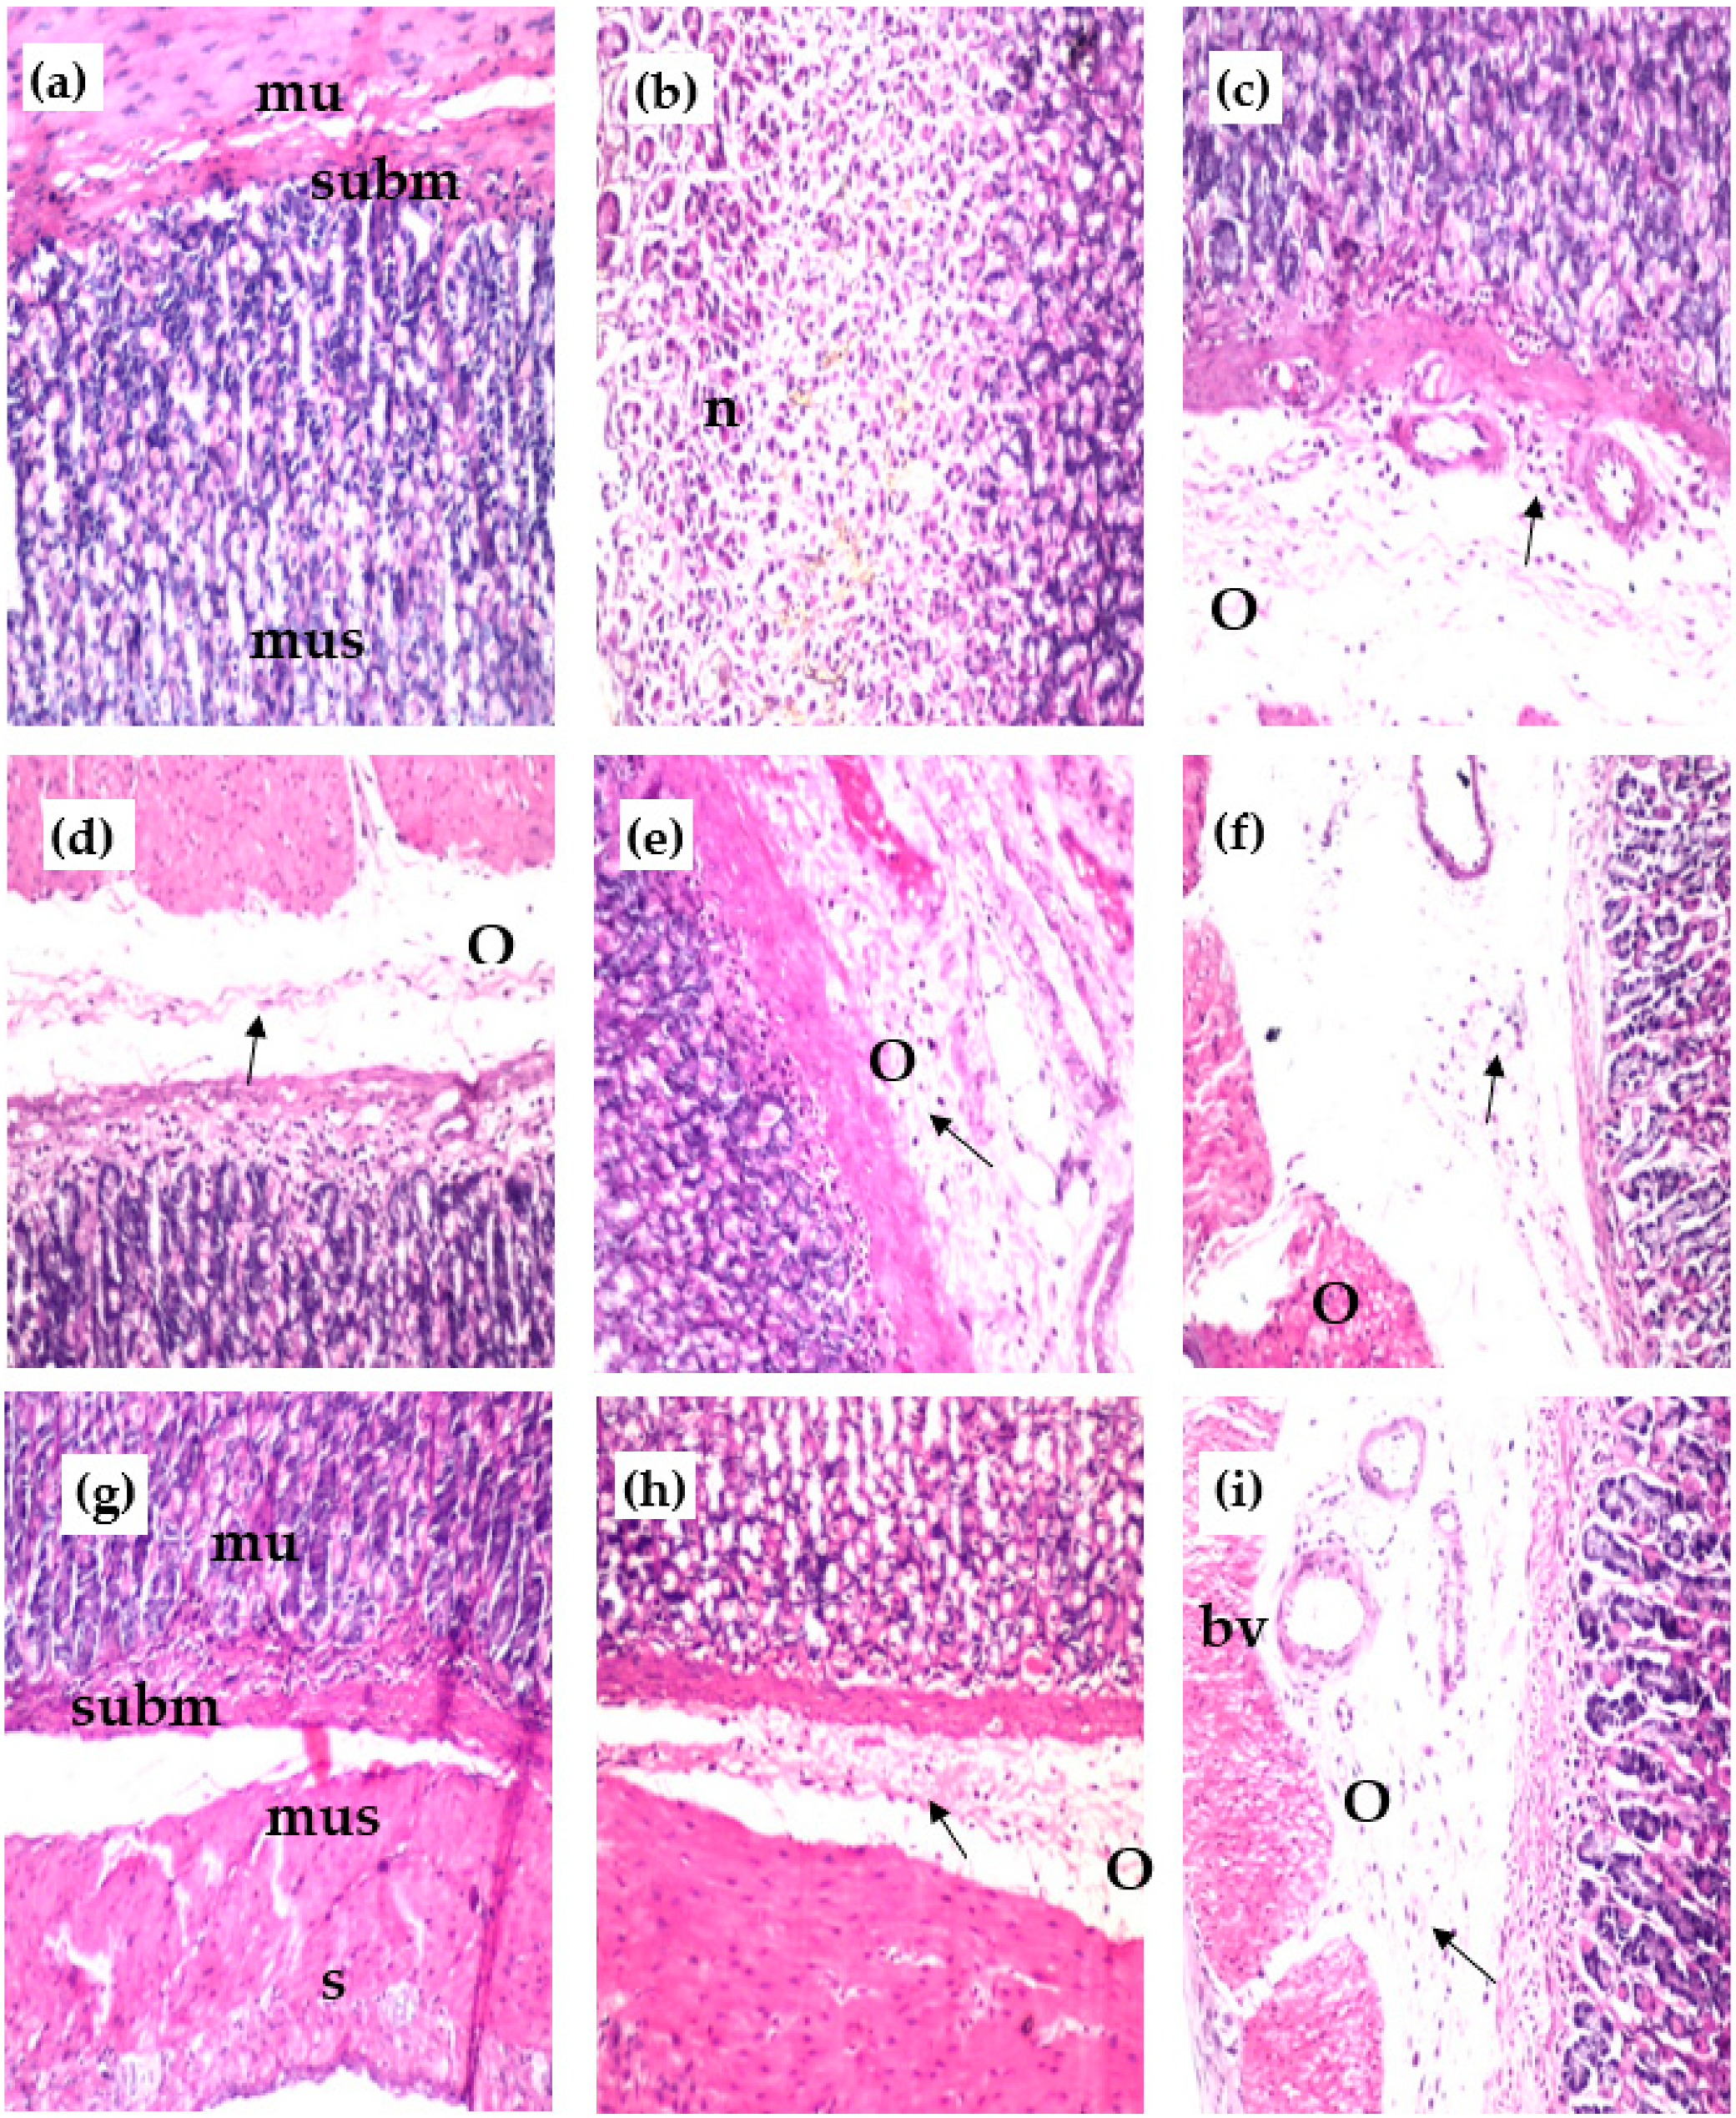
The control group showed normal structure of the mucosal layer (mu) with glandular structure and lamina propria, as well as the underlying submucosa (subm) and the muscularis (mus) (Figure 3a). However, the group with ethanol-induced ulcers showed focal necrosis (n), which was detected in the glandular structure of the mucosal layer (Figure 3b) and associated with inflammatory cells’ (arrow) infiltration of the lamina propria of the mucosa, as well as edema (o) in the underlying submucosa and later, dilated blood vessels (Figure 3c). The group with ethanol-induced ulcers treated with reference drug showed few inflammatory cells infiltrating (arrow) the lamina propria and associated with edema (o) in the submucosa (Figure 3d). The group of ethanol-induced ulcer rats treated with MeOH extract showed edema (o), inflammatory cell infiltration (arrow), and dilatated blood vessels (Figure 3e). The group of ethanol-induced ulcer rats treated with n-Hex extract showed edema (o) with a few inflammatory cells’ infiltration (arrow) detected in the submucosa (Figure 3f). The group of rats with ethanol-induced ulcers treated with CHCl3 extract showed the best result, with no histopathological alteration in the mucosa (mu), submucosa (subm), muscularis (mus), and serosa (s) as recorded in (Figure 3g). The group of rats with ethanol-induced ulcers treated with EtOAc extract showed few inflammatory cells’ (arrow) infiltration, and edema (o) was detected in the submucosa (Figure 3h). The group of rats with ethanol-induced ulcers treated with ReAq extract showed edema (o), inflammatory cells’ infiltration (arrow) and dilated blood vessels in the submucosa (Figure 3i).
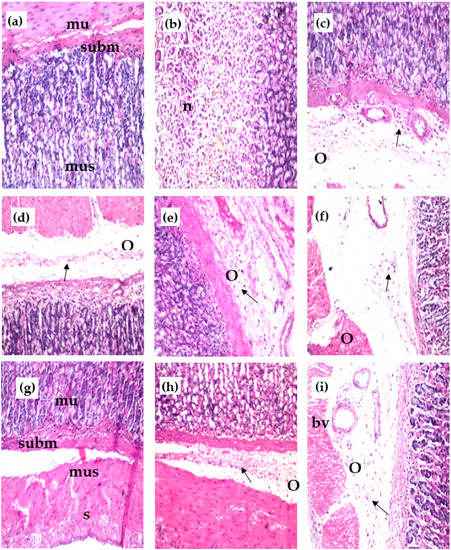
Figure 3.
Effect of the various extracts of E. erinaceus on the histological structure of the gastric mucosa of different treated rats’ groups stained with H & E stain (×40); (a) control group of normal rats; (b,c) ethanol-induced ulcer group; (d) ethanol-induced group + antodine; (e) ethanol-induced group + MeOH ext; (f) ethanol-induced group + n-Hex. ext. (g) ethanol-induced group + CHCl3 ext. (h) ethanol-induced group + EtOAc ext. (i) ethanol-induced group + ReAq ext. mucosa = mu, submucosa = subm, muscularis = mus, serosa = s, focal necrosis = n, oedema = o, inflammatory cells = arrow.
3.2.4. In Vitro Anti-Inflammatory Activity of Isolated Compounds
In our previous research [12], the CHCl3 extract showed remarkable anti-inflammatory activity. In the current study, the isolated compounds and their fractions were tested for enzyme-inhibitory activity on COX-2 and 15-LOX enzymes. A bio-guided fractionation of the CHCl3 extract revealed that Fraction 6 showed strong activity, with IC50 of 4.51± 0.78 and 12.95 ± 1.23 µg/mL, respectively. In addition, compound E7 isolated from the same fraction was the most active inhibitor against COX-2 and 15-LOX enzymes, with IC50 of 2.62 ± 0.71 and 5.51 ± 0.76 µg/mL, respectively, compared to the reference standard, nordihydroguairetic acid (NDGA). Although, compound E3 displayed significant inhibitory activity against COX-2, with an IC50 of 3.41 ± 0.65 µg/mL. However, compounds E2 and E6 showed moderate inhibitory activity against COX-2 with IC50 of 6.54 ± 0.86 and 8.19 ± 0.93 µg/mL, respectively, (Table 5).

Table 5.
IC50 and binding free energies of cyclooxygenase-2 (COX-2) and 15-lipoxygenase (15-LOX)-inhibitory activities of the selected sub-fractions and isolated compounds (E1–E7) from E. erinaceus.
3.3. Docking Study
3.3.1. PASS and ADME Predictions of the Isolated Compounds
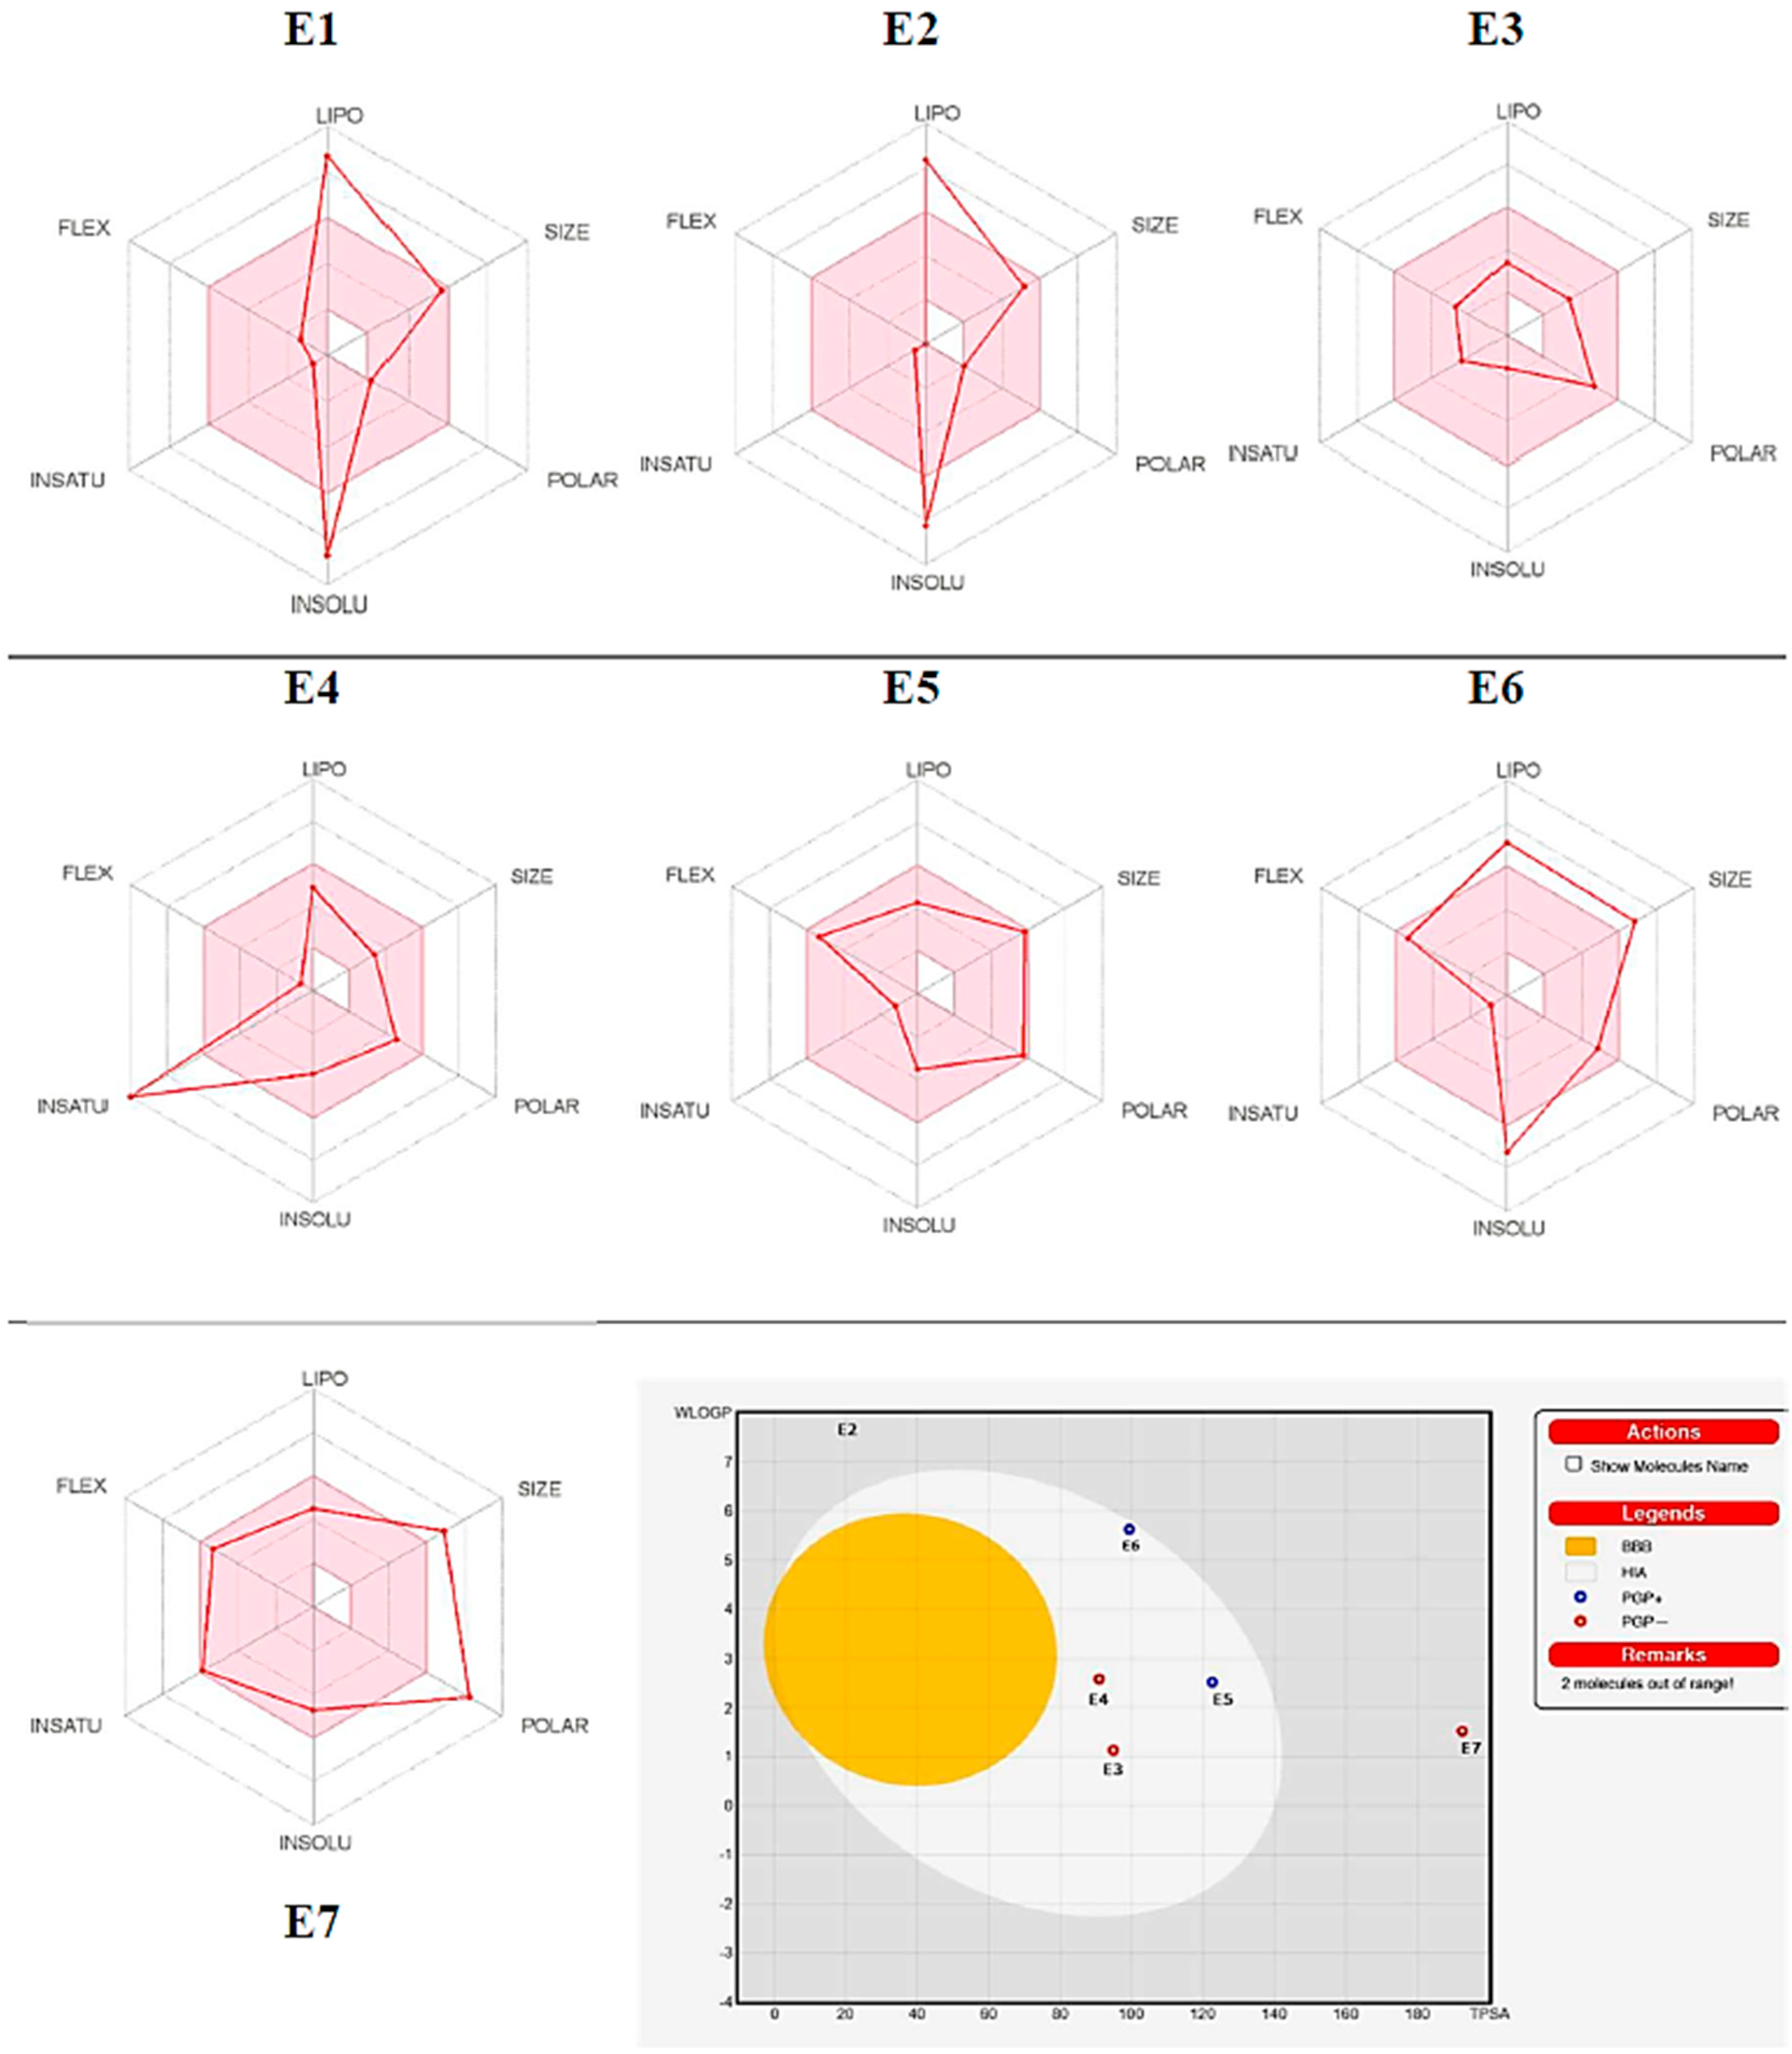
The SMILES format of isolated compounds was chosen using the Marvinsketch program and simulated by using the PASS and ADME prediction web tools [40,41,42]. The PASS tool predicted several biological activities, such as anti-inflammatory, anticancer, antioxidant, anti-ulcerative, and antiosteoporosis/antiarthritic activities. The isolated compounds (E1–E7) displayed significant “Pa” values ranging from (0.595–0.749; 0.524–0.960; 0.240–0.991; 0.406–0.749; and 0.296–0489) potential, respectively, for the above-mentioned biological activities (Table 6). Therefore, all compounds exhibited significant excellent anti-inflammatory, antineoplastic, and good antioxidant properties alongside excellent anti-ulcerative and antiosteoporosis/antiarthritic activities, except for compounds E5 and/or E6, from data analysis (Table 6). The ADME prediction web tool was used to predict the physicochemical, pharmacokinetic, and drug-likeness properties of the isolated compounds. The results showed that tested compounds (E1–E7) showed a bioactivity score range of 0.17–0.56, which fulfilled all the drug-likeness rules without any violations; the synthetic accessibility range was 2.96–7.93, which showed an explicit synthetic route. The lipophilicity values of the compounds showed that they have variable solubility in water. In addition, skin permeation, absorption, distribution, and metabolism were analyzed by using Swiss-ADME software, recorded in Table 6. The BOILED-Egg method was used to predict the ability of the tested compounds for GI absorption and passive diffusion through the blood–brain barrier (BBB) [43]. The BOILED-Egg prediction results (Figure 4) showed that compounds E3–E6 have GI absorption properties with poor diffuse through the BBB, and that they have good permeability value for skin permeability parameters (log Kp) [44]. Compounds E1–E4 & E7 showed no response to glycoprotein (P-gp) which has a significant role in drug absorption and distribution. Compound E4 inhibited CYP1A2, CYP2D6, and CYP3A4, and E5 inhibited CYP3A4, resulting in drug–drug interactions and adverse effects [40]. The findings revealed that four out of the seven compounds fulfilled the oral drug ability of Lipinski’s rule of five (RO5), while three slightly met the criteria of RO5. Conversely, two of the compounds were predicted to be mutagen, while the remaining two are predicted to be safe for the body.

Table 6.
In silico physicochemical and pharmacokinetics of the major compounds E1–E7.
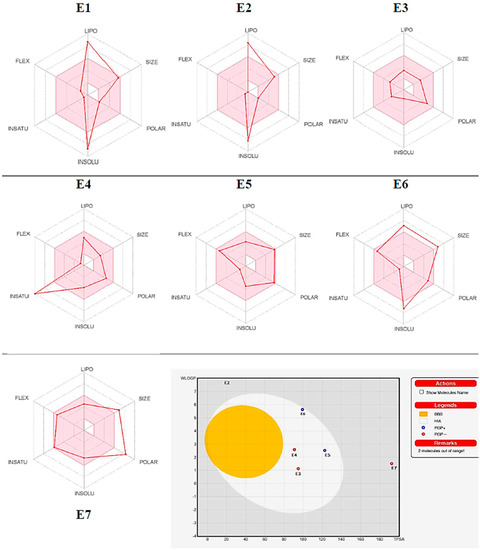
Figure 4.
Bioavailability radar representations and predicted BOILED-Egg diagram of compounds E1–E7.
3.3.2. In Silico Molecular Docking Study of Isolated Compounds
To understand the inhibitory effects of the secondary metabolites from E. erinaceus on the pro-inflammatory enzymes, compounds (E1–E7) isolated from the plant were docked on nonhuman counterparts of COX-2 (PDB ID: 3LN1), and 15-LOX (PDB ID: 1LOX).
Interactions with COX-2
All tested compounds interacted with the COX-2 enzyme and docked inside the 3LN1 receptor. Most of these compounds exhibited binding poses that were similar to that of celecoxib, through binding with the formation of an H-bond with Gln178, His75, and Tyr341 residues, except E2 and E5 [45,46]. However, they displayed hydrophobic interactions with Arg106, Arg499, and Ser339 residues, except for E1 and E2. The protein–ligand interactions observed in the representative docking poses of tested compounds are summarized in Table S6 and in Figure 5, Figures S36 and S37.
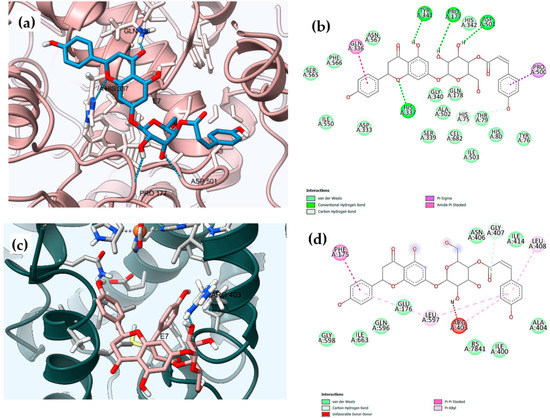
Figure 5.
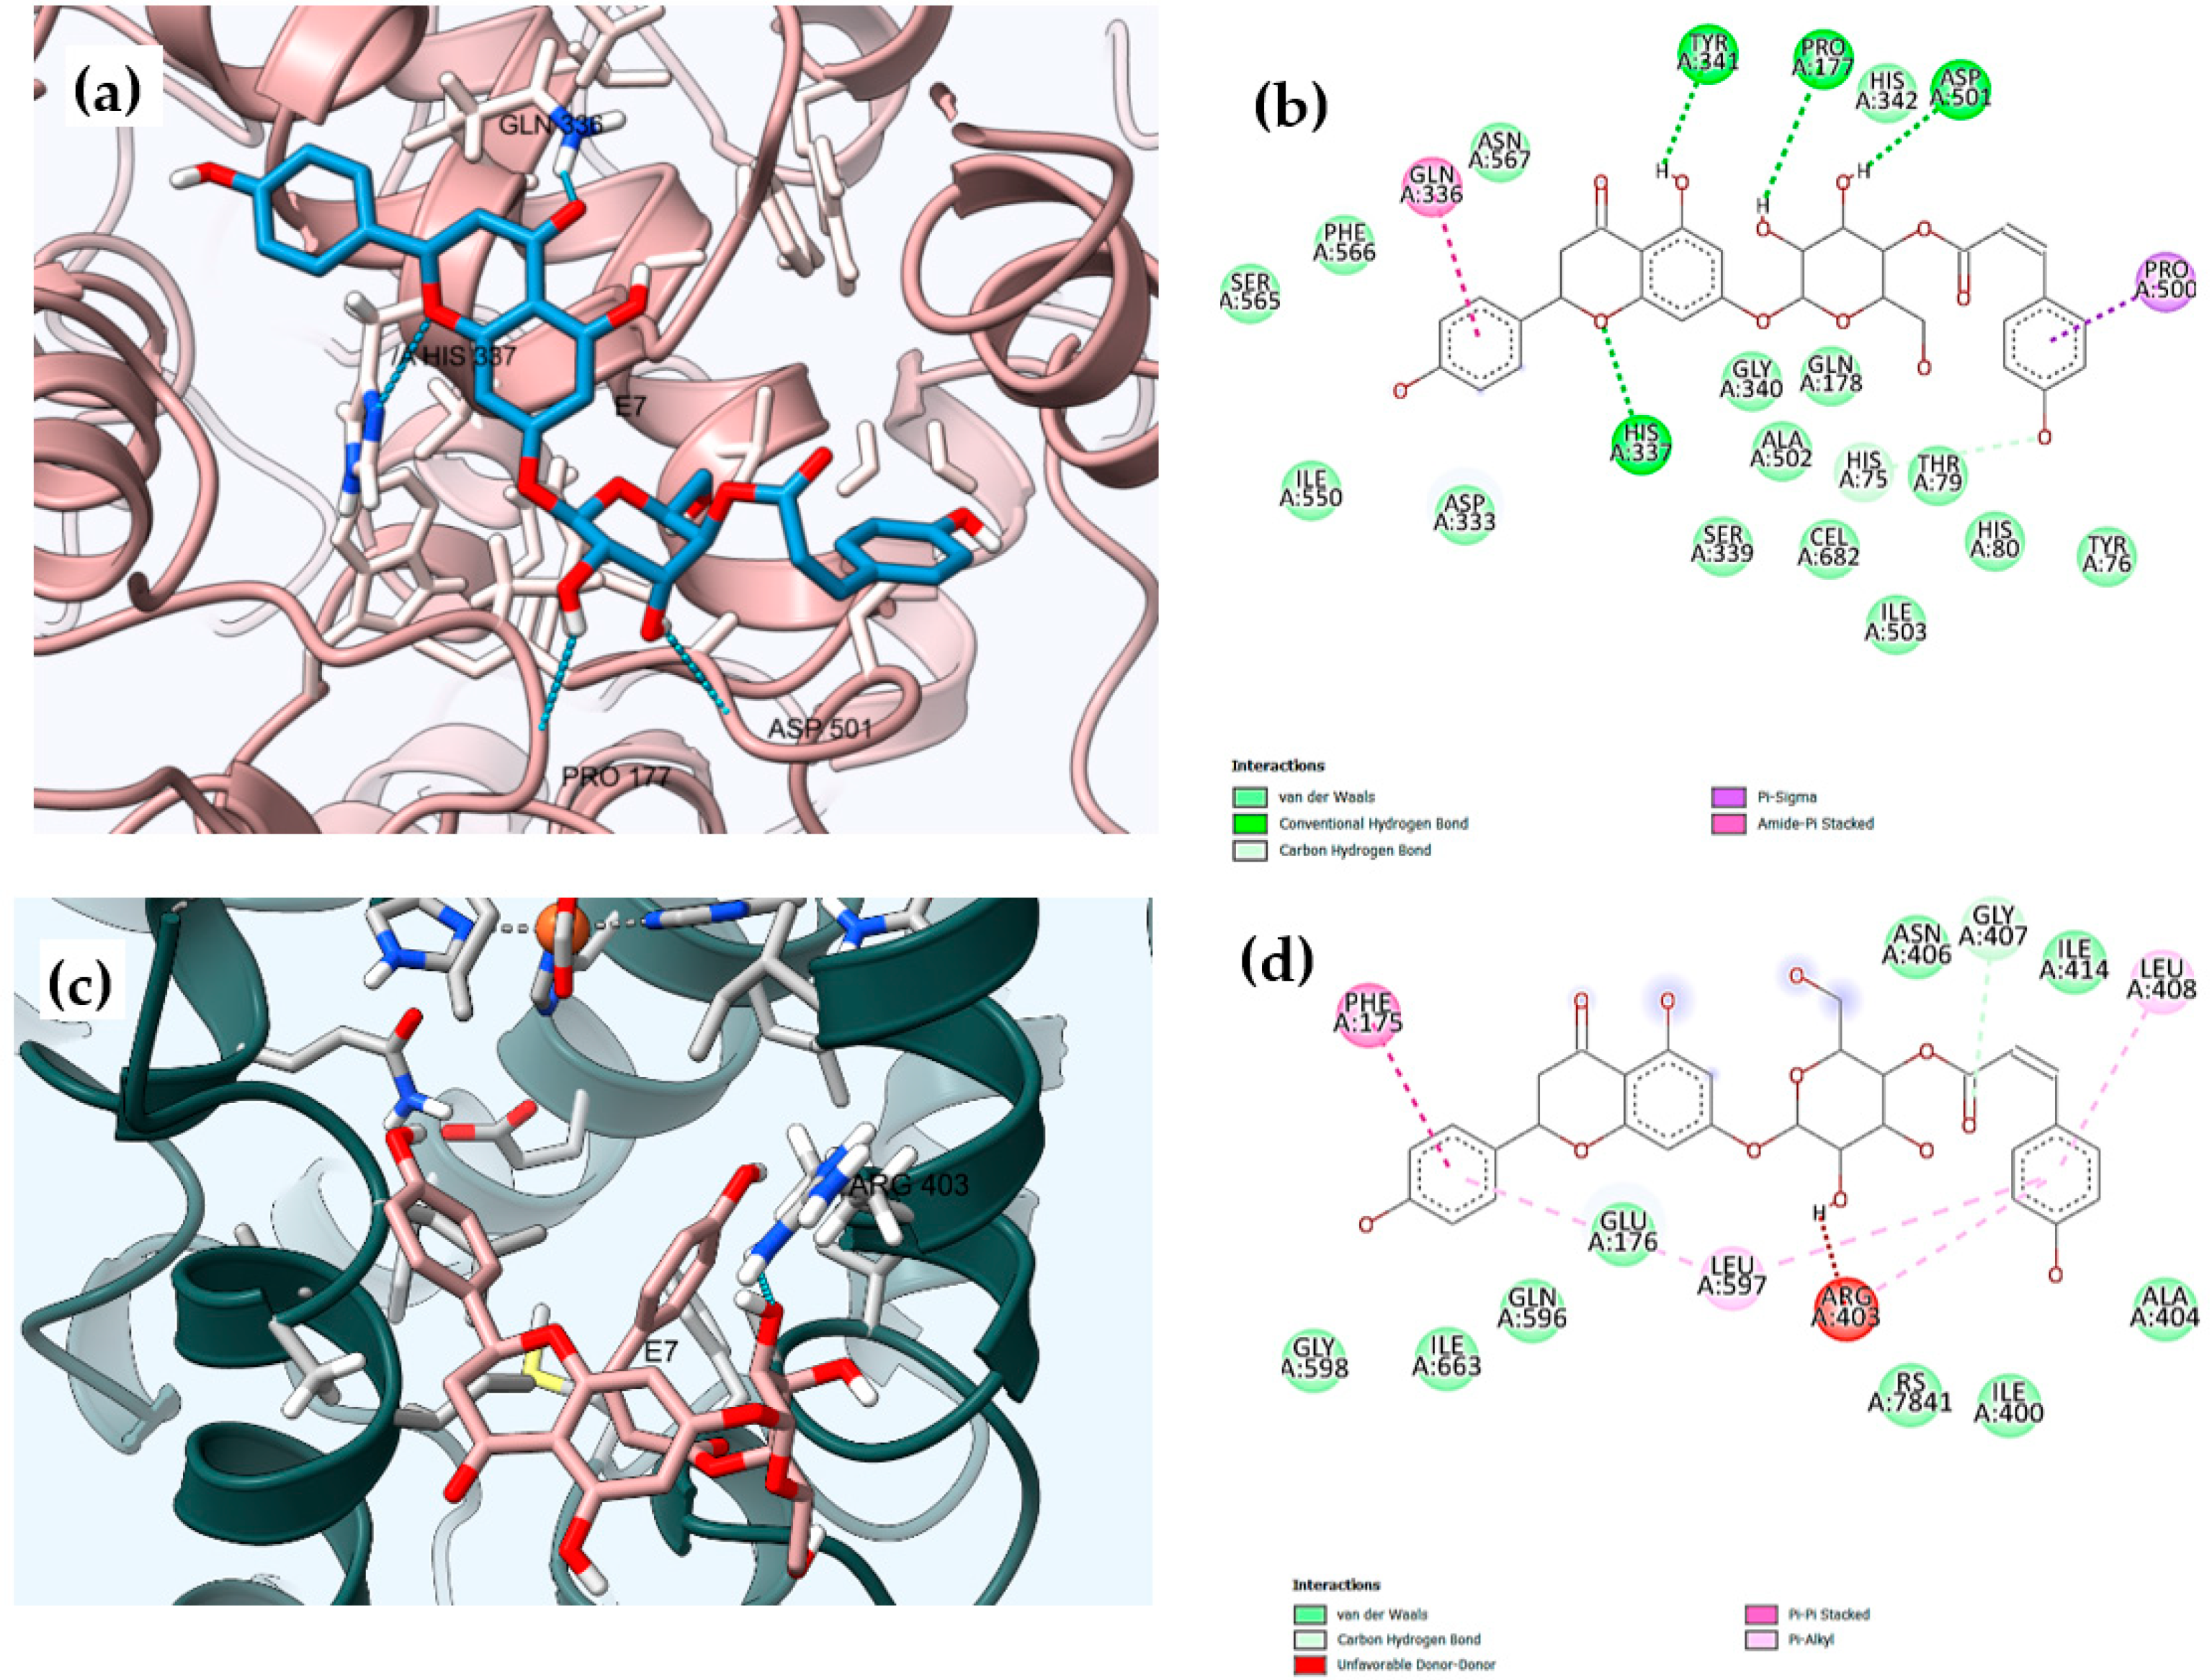
Three-dimensional (3D) and two-dimensional (2D) molecular binding interactions of the dual inhibitor compound E7 with: (a,b) cyclooxygenase-2, COX-2 (PDB: ID 3LN1), (Dimensions X:25.000, Y:21.2305, Z:24.7079); and (c,d) 15-lipooxygense, 15-LOX (PDB ID: 1LOX), (dimensions X:20.6138, Y: 18.9027, Z:26.9761).
Compound E7 had the highest consensus score value (−9.2 Kcal/mol) with the formation of six H-bonds between the hydroxyl groups with His75 and Tyr341, Asp501, His337, Pro177, and Thr79 amino acids. Benzene rings of the coumaroyl and flavanone moieties adopt poses with the formation of amide-π stacked and π-σ bonds with Gln336 and Pro500, respectively. The hydrophobic affinity of the residues was found in the hydrophobic channel of the active site, which interacted with Gln178, His75, and Ser339 residues (Table S6, Figure 5a,b) [45,46,47].
On the other hand, compounds E1, E3–E6 also yielded good binding free energies (kcal/mol) within COX-2, showing H-bond interactions with the His75, His337, 342, Gln178 Asn567, Gln336, Gly340, Pro177, and Thr79 residues. While E2 did not form hydrogen bonds with the crucial amino acids in the catalytic pocket, E2–E5 compounds did not form π -bonds with crucial amino acids at the hydrophobic binding site (Table S6, Figure S36).
Interactions with 15-LOX
The results of docking with 15-LOX revealed that the analyzed compounds (E1–E7) showed binding affinity (−8.3, −9.0, −6.1, −7.4, −7.1, −7.6, and −7.7 Kcal/mol, respectively) greater than or the same as the co-crystalized ligand, RS7 (2E)-3-(2-oct-1-yn-1-ylphenyl)acrylic acid, −6.2 Kcal/mol), as shown in Table 5.
Compound E7 was placed in the active center of the enzyme in a curved conformation with the coumaroyl moiety oriented in the vicinity of Arg403, Gly407, Leu408, and Leu597, and the ring B of naringenin moiety placed near Phe175 (Table S6, Figure 5c,d). One H-bond was formed between the H atom of the sugar group linked to the flavanone moiety and the O atoms of the peptide bonds of Arg403, and the second H-bond was formed between the carbonyl group of the coumaroyl moiety with H atoms of Gly407; meanwhile, two hydrogen bonds and two benzene ringsparticipate in π-π interactions with Arg403, Gly407, Leu408, Leu597, and Phe175. In addition, hydrophobic interactions with Ala404, and Ile414 also contribute to complex stabilization, and confirmed the greatest inhibitory activity of the in vitro study of 15-LOX, with an IC50 of 5.51 ±0.76 (Table 5 and Table S6, Figure 5c,d).
The hydrophilic compound E5 showed a great binding affinity with Gly407, Gly598, and Gln596, as inferred by the high docking score of −7.1 Kcal/mol when compared to the control, RS7 (−6.2 Kcal/mol). This could be explained by the presence of three H-bonds of two carbonyl groups (C=O) and one hydroxy (-OH) group. Additionally, the presence of the glucose and isovalerate moieties improved the capacity for interaction with the hydrophobic binding site of 15-LOX with Ala404, Arg403, Gly407, Ile663, and Leu408 as shown in Table S6 and Figure S37.
Additionally, the active compound E3 had the same binding energy (−6.1 Kcal/mol) as the co-crystalized ligand (RS7= −6.2 Kcal/mol) in the 15-LOX active site. This can be explained by the two hydrogen bonds formed between the carboxylic group with Arg403 and Asn406, and the presence of the hydrophobic interactions with Ala404, His545, Ile414, Ile663, Leu408, Leu597, and Phe175. In addition, no π-π interactions were observed in this case, which explained the low binding free energy of E3, and consequently the in vitro 15-LOX enzyme assay results (IC50 10.05± 0.96 µg/mL) (Table 5 and Table S6, Figure S37).
Regarding the virtual interactions, E1, E2, and E6 also showed interaction with the hydrophobic binding site of the 15-LOX enzyme through the presence of acetoxy (-OCOCH3), hydroxy (-OH), and glucose-methyl groups (-CH3), respectively (Table S6, Figure S37). These results were comparable to the previously published data of the arachidonic binding site which revealed the importance of the binding interactions of the acidic ends of the tested compounds with Arg403, Gly407, and Leu408, and the absence of catalytic residues 353–361 for the 15-LOX-inhibitory activity [23,48].
4. Conclusions
In this study, two undescribed terpenoid derivatives (erinaceolic acid, E3 and erinaceoside, E5), a rare flavanone glycoside derivative (speranskoside, E7), together with two known taraxastane-type triterpenes (taraxasterol acetate, E1 and taraxasterol, E2), one flavone (apigenin, E4), and one steroidal glycoside (stigmasterol-3-O-β-D-glucoside, E6), were isolated and characterized by spectroscopic methods, including 2D NMR and HRESIMS experiments. The total extract and successive fractions of E. erinaceus, especially the CHCl3 fraction, alleviated ethanol-induced gastric ulcers in rats. The different extracts of E. erinaceus are shown to be highly safe for human use as anti-inflammatory and antiulcerogenic remedies. The results of the in vitro and in silico studies indicated that the new molecules (E3 and E5) and the other isolated known compounds (E1, E2, E4, E6, and E7) could be promising inhibitors of COX-2 and 15-LOX enzymes and may contribute to the obtained in vivo antiulcer effect. However, more pharmacological and pharmacokinetic experiments are needed to establish their use in the prophylaxis and treatment of gastric ulcers.
Supplementary Materials
The following supporting information can be downloaded at: https://www.mdpi.com/article/10.3390/separations10020076/s1, Tables S1 and S4: NMR spectroscopic data for the compounds E1 and E2 and E6.; Tables S2, S3, and S5: HR-ESI-MS spectral data of compounds E3, E5, and E7.; Table S6: Docking of compounds against 15-LOX and COX-2 enzymes.; Flowchart S1-S3: Extraction, fractionation, and purification procedures of compounds (E1–E7).; Figure S1–S33: 1D- and 2D NMR, HR-ESI-MS spectral data of compounds E1–E7.; Figure S34–S34: Effect of the tested extracts on gastric contents of TNF-α and IL-6.; Figure S36: 3D and 2D molecular interactions of E1-E7 with COX-2.; Figure S37: 3D and 2D molecular interactions of E1, E2, E4, and E6 compounds with 15-LOX enzyme. The full spectral data, including the NMR and HRESIMS spectra, and the results of the in silico study. References [49,50] are cited in the Supplementary Material.
Author Contributions
Conceptualization, E.A.-S. and M.M.E.-S.; fractionation and isolation of the compounds, S.H.S.; Identification of the compounds, S.H.S., F.M.A.B. and E.A.-S.; Molecular docking and writing of original draft, S.H.S.; Writing, review and editing, E.A.-S., M.M.E.-S., O.D.E.-G., and F.M.A.B.; in vitro & in vivo biological activities performance, A.I.F., M.H.A. and S.H.S. All authors have read and agreed to the published version of the manuscript.
Funding
This study is supported via funding from Prince Sattam bin Abdulaziz University project number (PSAU/2023/R/1444).
Data Availability Statement
The data presented in this study are available in the Supplementary Materials at https://www.mdpi.com/article/10.3390/separations10020076/s1.
Acknowledgments
The authors acknowledged Amani Awaad, for her kind cooperation in suggesting the title plant for this study, as well as Abeer A. Salama for performing the biological study at Pharmacology Department, National Research Center, Dokki, Egypt.
Conflicts of Interest
The authors declare that they have no known competing financial interests or personal relationships that could have appeared to influence the work reported in this paper.
References
- Lanas, Á.; Carrera-Lasfuentes, P.; Arguedas, Y.; García, S.; Bujanda, L.; Calvet, X.; Ponce, J.; Perez-Aísa, Á.; Castro, M.; Muñoz, M.; et al. Risk of upper and lower gastrointestinal bleeding in patients taking nonsteroidal anti-inflammatory drugs, antiplatelet agents, or anticoagulants. Clin. Gastroenterol. Hepatol. 2015, 13, 906–912.e902. [Google Scholar] [CrossRef]
- Partipilo, M.L.; Woster, P.S. The role of Helicobacter pylori in peptic ulcer disease. Pharmacotherapy 1993, 13, 330–339. [Google Scholar] [PubMed]
- Mani, E.; Neelesh, M.; Sourabh, K.; Gaurav, M. Treatment and Replenishment of G.I. Tract with Combined Regimen Therapy (CRT) of Allopathic (PPIs) and Ayurvedic (Aloe Vera) Medicine in Peptic Ulcer Disease to Counteract Relapse. J. Gastrointest. Dig. Syst. 2015, 5, 1000272. [Google Scholar]
- Wang, J.; Wang, L.; Lou, G.H.; Zeng, H.R.; Hu, J.; Huang, Q.W.; Peng, W.; Yang, X.B. Coptidis Rhizoma: A comprehensive review of its traditional uses, botany, phytochemistry, pharmacology and toxicology. Pharm. Biol. 2019, 57, 193–225. [Google Scholar] [CrossRef] [PubMed]
- Asadi Rad, A.; Najafzadeh-Varzi, H.; Farajzadeh-Sheikh, A. Evaluation of Anti-ulcer Activity of Echinops persicus on Experimental Gastric Ulcer Models in Rats. Vet. Res Forum 2010, 1, 188–191. [Google Scholar]
- Alharbi, K.; El-Ashmawy, I. The Antidiarrheal Activity and Phytoconstituents of Some Methanol Extracts from Asteraceae family. Merit Res. J. Med. Med. Sci. 2015, 3, 347–352. [Google Scholar]
- Shibeshi, W.; Shiferie, F. In vivo antidiarrheal and ex-vivo spasmolytic activities of the aqueous extract of the roots of Echinops kebericho Mesfin (Asteraceae) in rodents and isolated guinea-pig ileum. Int. J. Pharm. Pharm. Sci. 2013, 2, 110–116. [Google Scholar]
- Abdallah, H.; Ezzat, S.; Dine, R.; Abdel-sattar, E.; Abdel-Naimc, A. Protective effect of Echinops galalensis against CCl4-induced injury on the human hepatoma cell line (Huh7). Phytochem. Lett. 2013, 6, 73–78. [Google Scholar] [CrossRef]
- Dashti, F.; Hadinedoushan, H.; Asadi, M. The Effect of Methanol Extract of Echinops lasiolepis on TNF-α Production in LPS-activated J774 A.1 Mouse Macrophages. J. Med. Lab. Sci. 2016, 3, 20–25. [Google Scholar]
- Abdulrasool, A.A.; Fahmi, Z.M.; Khadeem, E.J. A relative assess on wound healing and anti scar activity of crude Echinops heterophyllus extract and some of its bioactive fractions. Int. J. Pharm. Pharm. Sci. 2013, 5, 468–475. [Google Scholar]
- Singh, B.; Gambhir, S.S.; Pandey, V.B.; Joshi, V.K. Anti-inflammatory activity of Echinops echinatus. J. Ethnopharmacol. 1989, 25, 189–199. [Google Scholar] [CrossRef] [PubMed]
- Sweilam, S.H.; Abdel Bar, F.M.; ElGindi, O.D.; El- Sherei, M.M.; Abdel-Sattar, E.A. Chemical and In Vitro Anti-inflammatory Assessment of Echinops erinaceus. Trop. J. Nat. Prod. Res. 2021, 5, 715–719. [Google Scholar]
- Sweilam, S.H.; Abdel Bar, F.M.; Foudah, A.I.; Alqarni, M.H.; Elattal, N.A.; El-Gindi, O.D.; El-Sherei, M.M.; Abdel-Sattar, E. Phytochemical, Antimicrobial, Antioxidant, and In Vitro Cytotoxicity Evaluation of Echinops erinaceus Kit Tan. Separations 2022, 9, 447. [Google Scholar] [CrossRef]
- Singh, U.; Pandey, V.; Singh, K.; Singh, R. Antifungal activity of some new fiavones and fiavone glycosides of Echinops echinatus . Canad. J. Bot. 2011, 66, 1901–1903. [Google Scholar] [CrossRef]
- Zamzami, T.A.; Abdallah, H.M.; Shehata, I.A.; Mohamed, G.A.; Alfaifi, M.Y.; Elbehairi, S.E.I.; Koshak, A.E.; Ibrahim, S.R.M. Macrochaetosides A and B, new rare sesquiterpene glycosides from Echinops macrochaetus and their cytotoxic activity. Phytochem. Lett. 2019, 30, 88–92. [Google Scholar] [CrossRef]
- Bouattour, E.; Fakhfakh, J.; Frikha-Dammak, D.; Jabou, K.; Mohamed, D.; Jarraya, R. Hexane Extract of Echinops spinosissimus Turra subsp. spinosus from Tunisia: A Potential Source of Acetylated Sterols—Investigation of its Biological Activities. Chem. Biodivers. 2016, 13, 1674–1684. [Google Scholar] [CrossRef] [PubMed]
- Ode, O.J.; Asuzu, O.V. Investigation of Cassia singueana leaf extract for antiulcer effects using ethanol-induced gastric ulcer model in rats. Int. J. Plant Anim. Environ. Sci. 2011, 2011, 1–7. [Google Scholar]
- Abdel-Salam, O.; Sleem, A.; Medhat, D.; Salama, R.; Morsy, F.; Farrag, A.R.; Yassen, N. Methylene Blue Protects against Acidified Sodium Taurocholate-Induced Gastric Mucosal Damage. React. Oxyg. Species 2019, 7, 93–105. [Google Scholar] [CrossRef]
- Khare, S.; Asad, M.; Dhamanigi, S.S.; Prasad, V.S. Antiulcer activity of cod liver oil in rats. Indian J. Pharmacol. 2008, 40, 209–214. [Google Scholar] [CrossRef]
- Abdel-Aziz, A.A.M.; El-Azab, A.S.; Abou-Zeid, L.A.; ElTahir, K.E.H.; Abdel-Aziz, N.I.; Ayyad, R.R.; Al-Obaid, A.M. Synthesis, anti-inflammatory, analgesic and COX-1/2 inhibition activities of anilides based on 5,5-diphenylimidazolidine-2,4-dione scaffold: Molecular docking studies. Eur. J. Med. Chem. 2016, 115, 121–131. [Google Scholar] [CrossRef]
- Al-Suwaidan, I.A.; Alanazi, A.M.; El-Azab, A.S.; Al-Obaid, A.M.; ElTahir, K.E.H.; Maarouf, A.R.; Abu El-Enin, M.A.; Abdel-Aziz, A.A.-M. Molecular design, synthesis and biological evaluation of cyclic imides bearing benzenesulfonamide fragment as potential COX-2 inhibitors. Part 2. Bioorg. Med. Chem. Lett. 2013, 23, 2601–2605. [Google Scholar] [CrossRef] [PubMed]
- Oniga, S.D.; Pacureanu, L.; Stoica, C.I.; Palage, M.D.; Crăciun, A.; Rusu, L.R.; Crisan, E.L.; Araniciu, C. COX Inhibition Profile and Molecular Docking Studies of Some 2-(Trimethoxyphenyl)-Thiazoles. Molecules 2017, 22, 1507. [Google Scholar] [CrossRef] [PubMed]
- Tsolaki, E.; Eleftheriou, P.; Kartsev, V.; Geronikaki, A.; Saxena, A.K. Application of Docking Analysis in the Prediction and Biological Evaluation of the Lipoxygenase Inhibitory Action of Thiazolyl Derivatives of Mycophenolic Acid. Molecules 2018, 23, 1621. [Google Scholar] [CrossRef]
- Heidarpoor Saremi, L.; Ebrahimi, A.; Lagzian, M. Identification of new potential cyclooxygenase-2 inhibitors: Insight from high throughput virtual screening of 18 million compounds combined with molecular dynamic simulation and quantum mechanics. J. Biomol. Struct. Dyn. 2021, 39, 1717–1734. [Google Scholar] [CrossRef]
- Mahato, S.B.; Kundu, A.P. 13C NMR Spectra of pentacyclic triterpenoids—A compilation and some salient features. Phytochemistry 1994, 37, 1517–1575. [Google Scholar] [CrossRef]
- PubChem Compound Record. Available online: https://pubchem.ncbi.nlm.nih.gov/compound/5280662. (accessed on 2 June 2022).
- Araya-Maturana, R.; Pessoa-Mahana, H.; Weiss-López, B. Very Long-Range Correlations (nJC,H n > 3) in HMBC Spectra. Nat. Prod. Commun. 2008, 3, 445–450. [Google Scholar] [CrossRef]
- PubChem Compound Record. Available online: https://pubchem.ncbi.nlm.nih.gov/compound/155520. (accessed on 2 June 2022).
- Harborne, J.B. The Flavonoids: Advances in Research Since 1986. J. Chem. Educ. 1994, 72, A73. [Google Scholar] [CrossRef]
- Atta-Ur-Rahman; Ahmad, V.U. 13C-NMR of Natural Prodacts: Volume 1 Monoterpenes and Sesquiterpenes, 1st ed.; Springer: Boston, MA, USA, 1992; Volume 1, p. X, Compound no. 966. [Google Scholar]
- Kojima, H.; Sato, N.; Hatano, A.; Ogura, H. Sterol glucosides from Prunella vulgaris. Phytochemistry 1990, 29, 2351–2355. [Google Scholar] [CrossRef]
- Ridhay, A.; Noor, A.; Soekamto, N.; Harlim, T.; Altena, I. A stigmasterol glycoside from the root wood of Melochia umbellata (Houtt) Stapf Var. degrabrata K. Indones. J. Chem. 2012, 12, 100–103. [Google Scholar] [CrossRef]
- Oliveira, J.; Bernardi, D.; Balbinot, R.; Cabral, M.R.; Zanqueta, É.; Endo, E.; Filho, B.; Nakamura, T.; Figueiredo, M.; Ruiz, A.; et al. New cadinene-sesquiterpene from Chromolaena laevigata (lam.) R. M. King & H. Rob (Asteraceae) aerial parts and biological activities View supplementary material. Nat. Prod. Res. 2020, 1, 1–8. [Google Scholar] [CrossRef]
- Nessa, F.; Ismail, Z.; Mohamed, N.; Haris, M.R.H.M. Free radical-scavenging activity of organic extracts and of pure flavonoids of Blumea balsamifera DC leaves. Food Chem. 2004, 88, 243–252. [Google Scholar] [CrossRef]
- Fenz, R.; Galensa, R. Identification of 1-O-trans-p-coumaroylglycerol as an indicator of maize in beer. Z. Lebensm. Unters. Forsch. 1989, 188, 314–316. [Google Scholar] [CrossRef]
- Li Yan-Mei, Z.Y.-Y.; Yun-Bai, F.; Xuan, W.; Li-Ning, C. Flavonoids from Speranskia tuberculata. J. Chin. Pharm. Sci. 1997, 6, 70–74. [Google Scholar]
- Yuan, W.; Li, S.; Ownby, S.; Zhang, Z.; Wang, P.; Zhang, W.; Beasley, R.S. Flavonoids, coumarins and triterpenes from the aerial parts of Cnidoscolus texanus. Planta Med. 2007, 73, 1304–1308. [Google Scholar] [CrossRef] [PubMed]
- Sun, Y.; Li, Q.; Gui, H.; Xu, D.-P.; Yang, Y.-L.; Su, D.-F.; Liu, X. MicroRNA-124 mediates the cholinergic anti-inflammatory action through inhibiting the production of pro-inflammatory cytokines. Cell Res. 2013, 23, 1270–1283. [Google Scholar] [CrossRef]
- Aziz, N.; Detels, R.; Quint, J.J.; Gjertson, D.; Ryner, T.; Butch, A.W. Biological variation of immunological blood biomarkers in healthy individuals and quality goals for biomarker tests. BMC Immunol. 2019, 20, 33. [Google Scholar] [CrossRef]
- Foudah, A.I.; Alqarni, M.H.; Alam, A.; Salkini, M.A.; Ross, S.A.; Yusufoglu, H.S. Phytochemical Screening, In Vitro and In Silico Studies of Volatile Compounds from Petroselinum crispum (Mill) Leaves Grown in Saudi Arabia. Molecules 2022, 27, 934. [Google Scholar] [CrossRef]
- Filimonov, D.A.; Lagunin, A.A.; Gloriozova, T.A.; Rudik, A.V.; Druzhilovskii, D.S.; Pogodin, P.V.; Poroikov, V.V. Prediction of the Biological Activity Spectra of Organic Compounds Using the Pass Online Web Resource. J. Heterocycl. Chem. 2014, 50, 444–457. [Google Scholar] [CrossRef]
- Daina, A.; Michielin, O.; Zoete, V. SwissADME: A free web tool to evaluate pharmacokinetics, drug-likeness and medicinal chemistry friendliness of small molecules. Sci. Rep. 2017, 7, 42717. [Google Scholar] [CrossRef]
- Daina, A.; Zoete, V. A BOILED-Egg to Predict Gastrointestinal Absorption and Brain Penetration of Small Molecules. ChemMedChem 2016, 11, 1117–1121. [Google Scholar] [CrossRef]
- Bojarska, J.; Remko, M.; Breza, M.; Madura, I.D.; Kaczmarek, K.; Zabrocki, J.; Wolf, W.M. A Supramolecular Approach to Structure-Based Design with A Focus on Synthons Hierarchy in Ornithine-Derived Ligands: Review, Synthesis, Experimental and in Silico Studies. Molecules 2020, 25, 1135. [Google Scholar] [CrossRef] [PubMed]
- Haleem, A.; Hussein, M.; Khames, A.; El-Adasy, A.-B.; Atalla, A.; Abdel-Rady, M.; Hassan, M.; Nemr, M.; Elshaier, Y. Design, synthesis and biological evaluation of new 2-aminothiazole scaffolds as phosphodiesterase type 5 regulators and COX-1/COX-2 inhibitors. RSC Adv. 2020, 10, 29723–29736. [Google Scholar] [CrossRef]
- Ahmadi, M.; Bekeschus, S.; Weltmann, K.-D.; von Woedtke, T.; Wende, K. Non-steroidal anti-inflammatory drugs: Recent advances in the use of synthetic COX-2 inhibitors. RSC Med. Chem. 2022, 13, 471–496. [Google Scholar] [CrossRef] [PubMed]
- Polo, E.; Acosta-Quiroga, K.; Rojas-Peña, C.; Rodríguez Núñez, Y.; Duarte, Y.; Brito, I.; Cisterna, J.; Gutiérrez, M. Molecular modeling and structural analysis of some tetrahydroindazole and cyclopentanepyrazole derivatives as COX-2 Inhibitors. Arab. J. Chem. 2021, 15, 103540. [Google Scholar] [CrossRef]
- Gillmor, S.A.; Villaseñor, A.; Fletterick, R.; Sigal, E.; Browner, M.F. The structure of mammalian 15-lipoxygenase reveals similarity to the lipases and the determinants of substrate specificity. Nat. Struct. Biol. 1997, 4, 1003–1009. [Google Scholar] [CrossRef]
- Khalilov, L.M.; Khalilova, A.Z.; Shakurova, E.R.; Nuriev, I.F.; Kachala, V.V.; Shashkov, A.S.; Dzhemilev, U.M. PMR and 13C NMR Spectra of Biologically Active Compounds. XII. Taraxasterol and Its Acetate from the Aerial Part of Onopordum acanthium. Chem. Nat. Compd. 2003, 39, 285–288. [Google Scholar] [CrossRef]
- Mouffouk, S.; Haba, H.; Lavaud, C.; Christophe, L.; Benkhaled, M. Chemical constituents of Centaurea omphalotricha Coss. & Durieu ex Batt. & Trab. Rec. Nat. Prod. 2012, 6, 292–295. [Google Scholar]
Disclaimer/Publisher’s Note: The statements, opinions and data contained in all publications are solely those of the individual author(s) and contributor(s) and not of MDPI and/or the editor(s). MDPI and/or the editor(s) disclaim responsibility for any injury to people or property resulting from any ideas, methods, instructions or products referred to in the content. |
© 2023 by the authors. Licensee MDPI, Basel, Switzerland. This article is an open access article distributed under the terms and conditions of the Creative Commons Attribution (CC BY) license (https://creativecommons.org/licenses/by/4.0/).

