Article

Preparation of Fe3O4-Reduced Graphene-Activated Carbon from Wastepaper in the Dispersive Solid-Phase Extraction and UHPLC-PDA Determination of Antibiotics in Human Plasma

1
Department of Pharmacy, University “G. d’Annunzio” of Chieti-Pescara, I-66100 Chieti, Italy
2
Department of Agricoltural Environmental and Food Science (DiAAA), University of Molise, via De Sanctis, I-86100 Campobasso, Italy
*
Author to whom correspondence should be addressed.
Separations 2023, 10(2), 115; https://doi.org/10.3390/separations10020115
Submission received: 16 January 2023 / Revised: 31 January 2023 / Accepted: 1 February 2023 / Published: 7 February 2023

Abstract

:
In this work, a sorbent was prepared from wastepaper samples enriched with iron oxide particles and graphene oxide and used in the solid phase extraction of antibiotics. The precursor underwent a carbothermal reduction to promote the formation of paramagnetic phases useful for the recovery of the sorbent during the analysis, and to disperse and fix graphene and the iron oxide in a durable way throughout the cellulose structure. Characterizations were carried out to evaluate the composition (Raman, XRD and EDX) and the morphological structure (SEM) of the material. A UHPLC-PDA method was developed for the simultaneous determination of antibiotics from different drug families (carbapenems, fluoroquinolones, β-lactams) using a 120 SB-C 18 poroshell column (50 × 2.1 mm I.D., 2.7 um particle size) and a mobile phase consisting of 10 mM acetate buffer at pH 5 (Line A) and acetonitrile (Line B) both containing 0.1% of triethylamine. A gradient elution was used for the separation of the analytes, while for the quantitative analysis each analyte was determined at its maximum wavelength. Several experiments were carried out to evaluate the influence of different parameters involving the dispersive magnetic solid phase extraction of these analytes. Samples were extracted using 25 mg of sorbent at pH 5 and desorbed in 5 min using methanol. We report herein on some of the outstanding advantages of using carbon-based sorbent, such as lower toxicity, scalability, improved absorption capacity, target selectivity and stability in acidic medium. Moreover, from the results obtained it is evident that, despite the use of some recycled materials, the performances obtained were comparable or even superior to the methods reported in the literature.

1. Introduction

Nowadays, the amount of waste produced is constantly increasing and finding a second life for those potentially valuable substances that are destined for landfills is becoming a challenge, for the good of society and the environment, especially with approaches as environmentally friendly as possible. In this area, the paper industry and its entire supply chain annually produces a quantity of cellulose-based waste, originating from wood pulp and cotton, which cannot be recycled due to the structural changes of the same material in the various recovery cycles [1,2,3].
Cellulose was, remarkably, considered the most abundant organic compound derived primarily from biomass and, from an industrial commercialization standpoint, the most common biopolymer that has been used for centuries. For this reason, it can be considered a cheap and easily available material [4].
Cellulose possesses a complex reticular structure, and it is because of this that cellulose-based materials extracted from waste potentially have excellent chemical–physical properties such as high porosity, high specific surface area, excellent stability, and the possibility of establishing different bonds thanks to the presence of hydroxyl and carboxyl groups [5,6].
Carbon is the most used material among the absorbents. According to the protocol of synthesis, a variety of carbons are available with different particle shapes and dimensions. In general, they are made very easily by low-cost methods, resulting in renewable samples [7,8]. Cellulose-based materials, processed through calcination in different environmental conditions, can become both excellent carbon adsorbents and useful supports capable of trapping other materials, fixing them in its three-dimensional structure in a physical way and obtaining various composites [9,10].
Since its discovery, graphene (G) has gained the interest of the entire scientific community due to its possible applications in the production of new materials with clearly superior performance. In the field of analytical chemistry, it has found significant applications as a sorbent to be used in solid phase extraction, since G has a huge surface area and can make π- π interactions due to electron delocalization [11]. These properties give graphene a great affinity for carbon-based aromatic cyclic compounds. Reduced graphene (rG) is universally recognized as a non-polar and hydrophobic sorbent that can be applied in the extraction of apolar analytes. On the other hand, graphene oxide (GO), thanks to the presence of several hydroxyl and carboxyl groups, is considered a polar and hydrophilic sorbent to be used in the extraction of polar analytes [12,13]. An important issue to take into consideration when G is used as a sorbent packed in SPE cartridges is the high back pressure and the clogging of the packed bed, which inevitably leads to the aggregation of the G sheets. To overcome these problems, graphene-based magnetic materials have been developed for use in dispersive magnetic solid-phase extraction (d-MSPE). Over the last few years, more and more articles have been published using dMSPE as a sample preparation technique using graphene-based magnetic nanocomposite materials [14,15].
In general, G, GO and rG can be considered excellent adsorbents as they are very light, cheap, and have large surfaces and reduced analysis times. On the other hand, they often fail to be selective towards some individual analytes and can be considered toxic for the environment, as there is currently no system that allows for their recovery and disposal at the end of their lifecycle [16,17,18].
Typically, in a dMSPE there are more steps, the first being an extraction, where the sorbent material is placed in contact with the matrix containing the analytes and dispersed using mechanical agitation or ultrasound, followed by a separation step where the sorbent is removed from the matrix using an external magnetic field and the supernatant is discarded. After the loading there is the desorption step, in which the adsorbent material is put in contact with a suitable solvent and stirred, then the sorbent is recovered using an external magnetic field and the supernatant can be analyzed as it is or evaporated, under a gentle nitrogen steam, and after having been reconstituted it is analyzed [19].
Compared to dispersive solid-phase extraction (dSPE), dMSPE has several advantages including the exceptional separating capacity of the materials used, which allows the recovery of the sorbent by applying an external magnetic field, so avoiding further centrifugation steps and leading to a shorter time analysis [20].
Iron oxide, therefore, acts both as an adsorbent and, more importantly, as a paramagnetic material, useful for isolating the adsorbed sample and then releasing it when subjected to suitable conditions.
Several studies have been conducted on the adsorption of pharmacologically active ingredients by materials containing GO, rG and iron oxide. In particular, analyses were carried out for the capture of some of the more abundant environmental pollutants, such as tetracyclines, the main antibiotics used in animal husbandry, and fluoroquinolones, obtaining good results with regard to their adsorption [21,22,23].
In this work, we developed a simple preparation method of an efficient sorbent to be used in dMSPE for the UHPLC-PDA analysis of antibiotics in human plasma. The adsorbent material was obtained to further advance the operative approach introduced in a previous work, from iron oxide, paper waste, and a simple carbothermal reaction [24], adding GO to enhance the final properties of the samples.
Wastepaper has been used as a carbon source in the carbothermal reaction, which is required to reduce graphene and form Fe3O4 in situ, but also to more evenly absorb and distribute and homogenously trap both iron oxide and GO. To evaluate the effect of the graphene oxide proportions used in the various prepared materials, the sorbents were characterized by thermogravimetric analysis, SEM-EDX, XRD and Raman spectroscopy.
Finally, to test the efficacy of this Fe3O4-rG-activated carbon material, a dMSPE-UHPLC-PDA method was developed for the analysis of antibiotics with different chemical–physical characteristics to evaluate their performance.

2. Materials and Methods

2.1. Chemical and Reagents

Metronidazole (CAS: 443-48-1), meropenem (CAS: 96036-03-02), levofloxacin (CAS: 100986- 85-4), cefoperazone (CAS: 62893-20-3) and piperacillin (CAS: 61477-96-1), used as internal standard, were obtained from Santa Cruz Biotechnology (Dallas, TX, USA). Ferric chloride, ammonium acetate, sodium dihydrogen phosphate and sodium hydrogen phosphate, methanol and acetonitrile were purchased from Carlo Erba Reagenti (Milan, Italy). Graphene oxide aqueous solution was purchased from Graphenea (Donostia San Sebastian, Spain). Double-distilled water was obtained from Millipore MilliQ Plus water treatment system (Millipore Bedford Corp., Bedford, MA, USA). Stock solutions were obtained by weighing exactly 25 mg of each standard and solubilizing them in a 25 mL volumetric flask with a mixture of water and methanol (75/25 v/v). Working solutions were obtained by dilution of the stock solutions using Milli-Q water. All chemicals were of analytical grade and used as received.

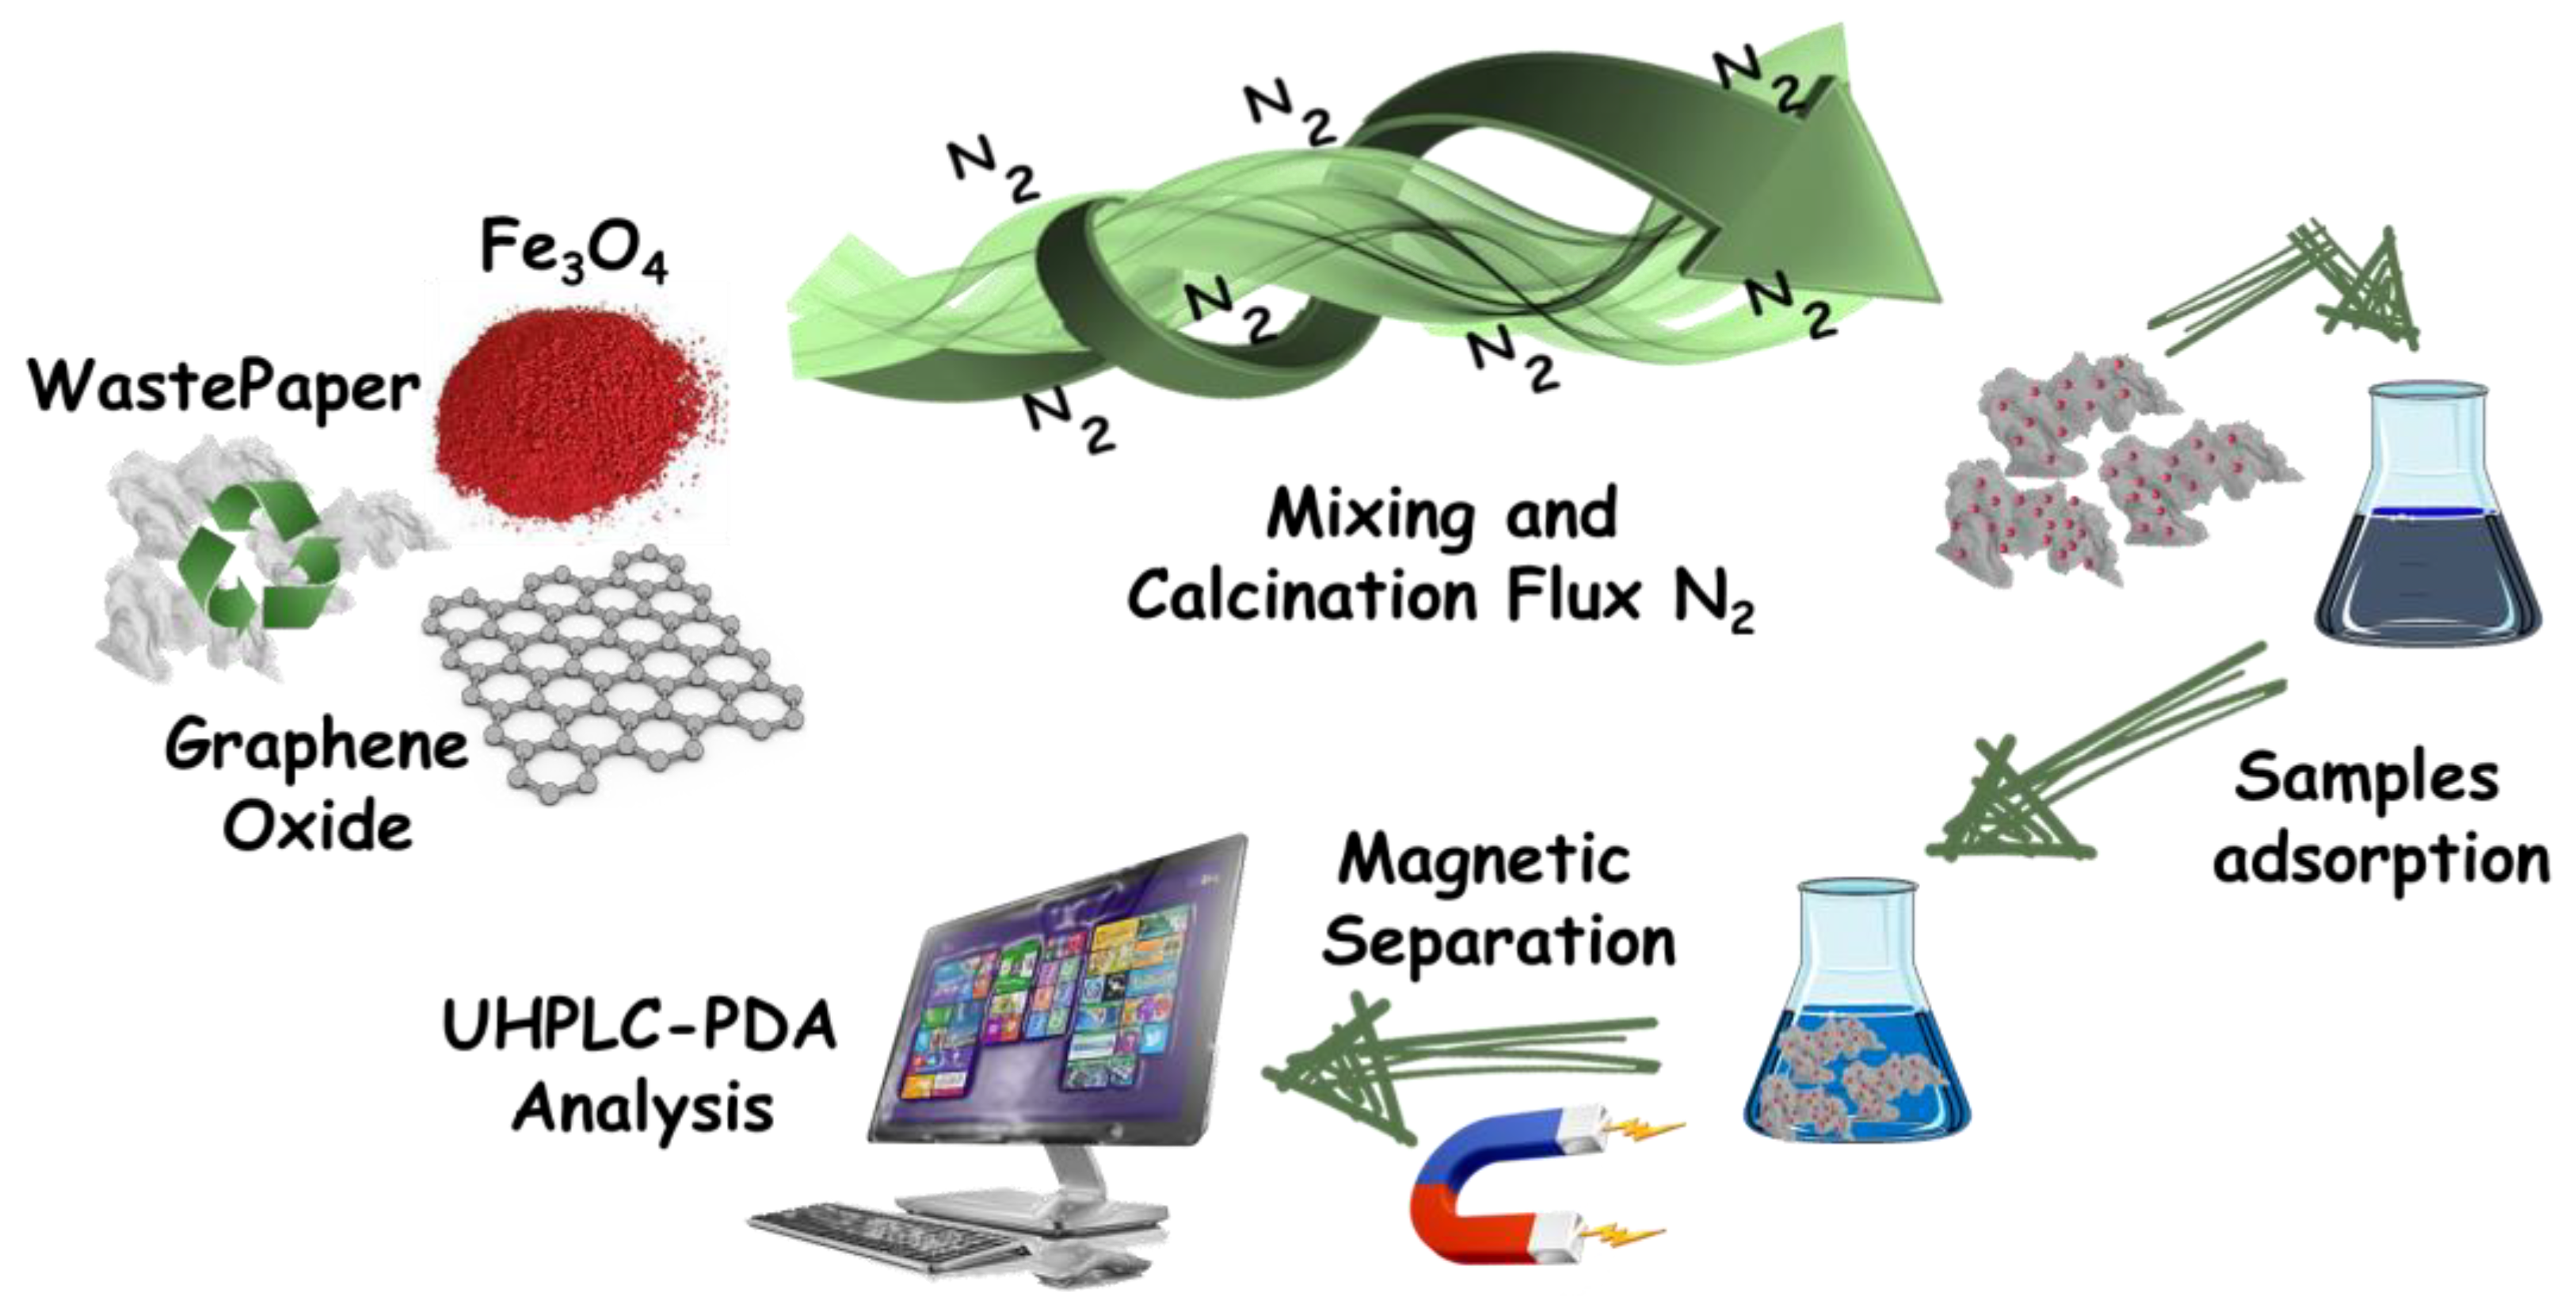
2.2. Preparation of “Fe3O4-rG-Activated Carbon” Sorbent

Fe3O4 particles were formed in situ during calcination from Fe2O3 particles. Briefly, to obtain the Fe2O3 particles, 10 mL of 6 M sodium hydroxide solution were added dropwise to 10 mL of a 2 M ferric chloride solution under vigorous stirring at 70°C until the color changed from yellow to brick red, indicating the formation of Fe (OH)3. The solution obtained was placed in the oven for 3 days at 100 °C, and the final product (Fe2O3) was washed several times to ensure the elimination of excess sodium. The wastepaper was cut into small pieces, washed with water and methanol, and finally put in an oven at 90 °C for 24 h. Next, 2.5 g of Fe2O3, 10 g of wastepaper previously washed and dried, and 375 mg of GO were dispersed in 200 mL of distilled water and stirred for 12 h at 50 °C to form a colloidal stock solution. The precipitate was washed with water and methanol and dried at 80 °C. Several samples were prepared using the same procedure, but changing the amount of GO (125, 250, 375 mg, respectively). Finally, the sorbent was obtained by calcination at 800 °C for 1 h using a ramp of 5 °C per minute under a nitrogen atmosphere. The obtained raw powder was ground using a ball miller, equipped with zirconia jars and spheres, for one hour and twenty minutes, taking breaks every 10 min in order not to overheat the samples.

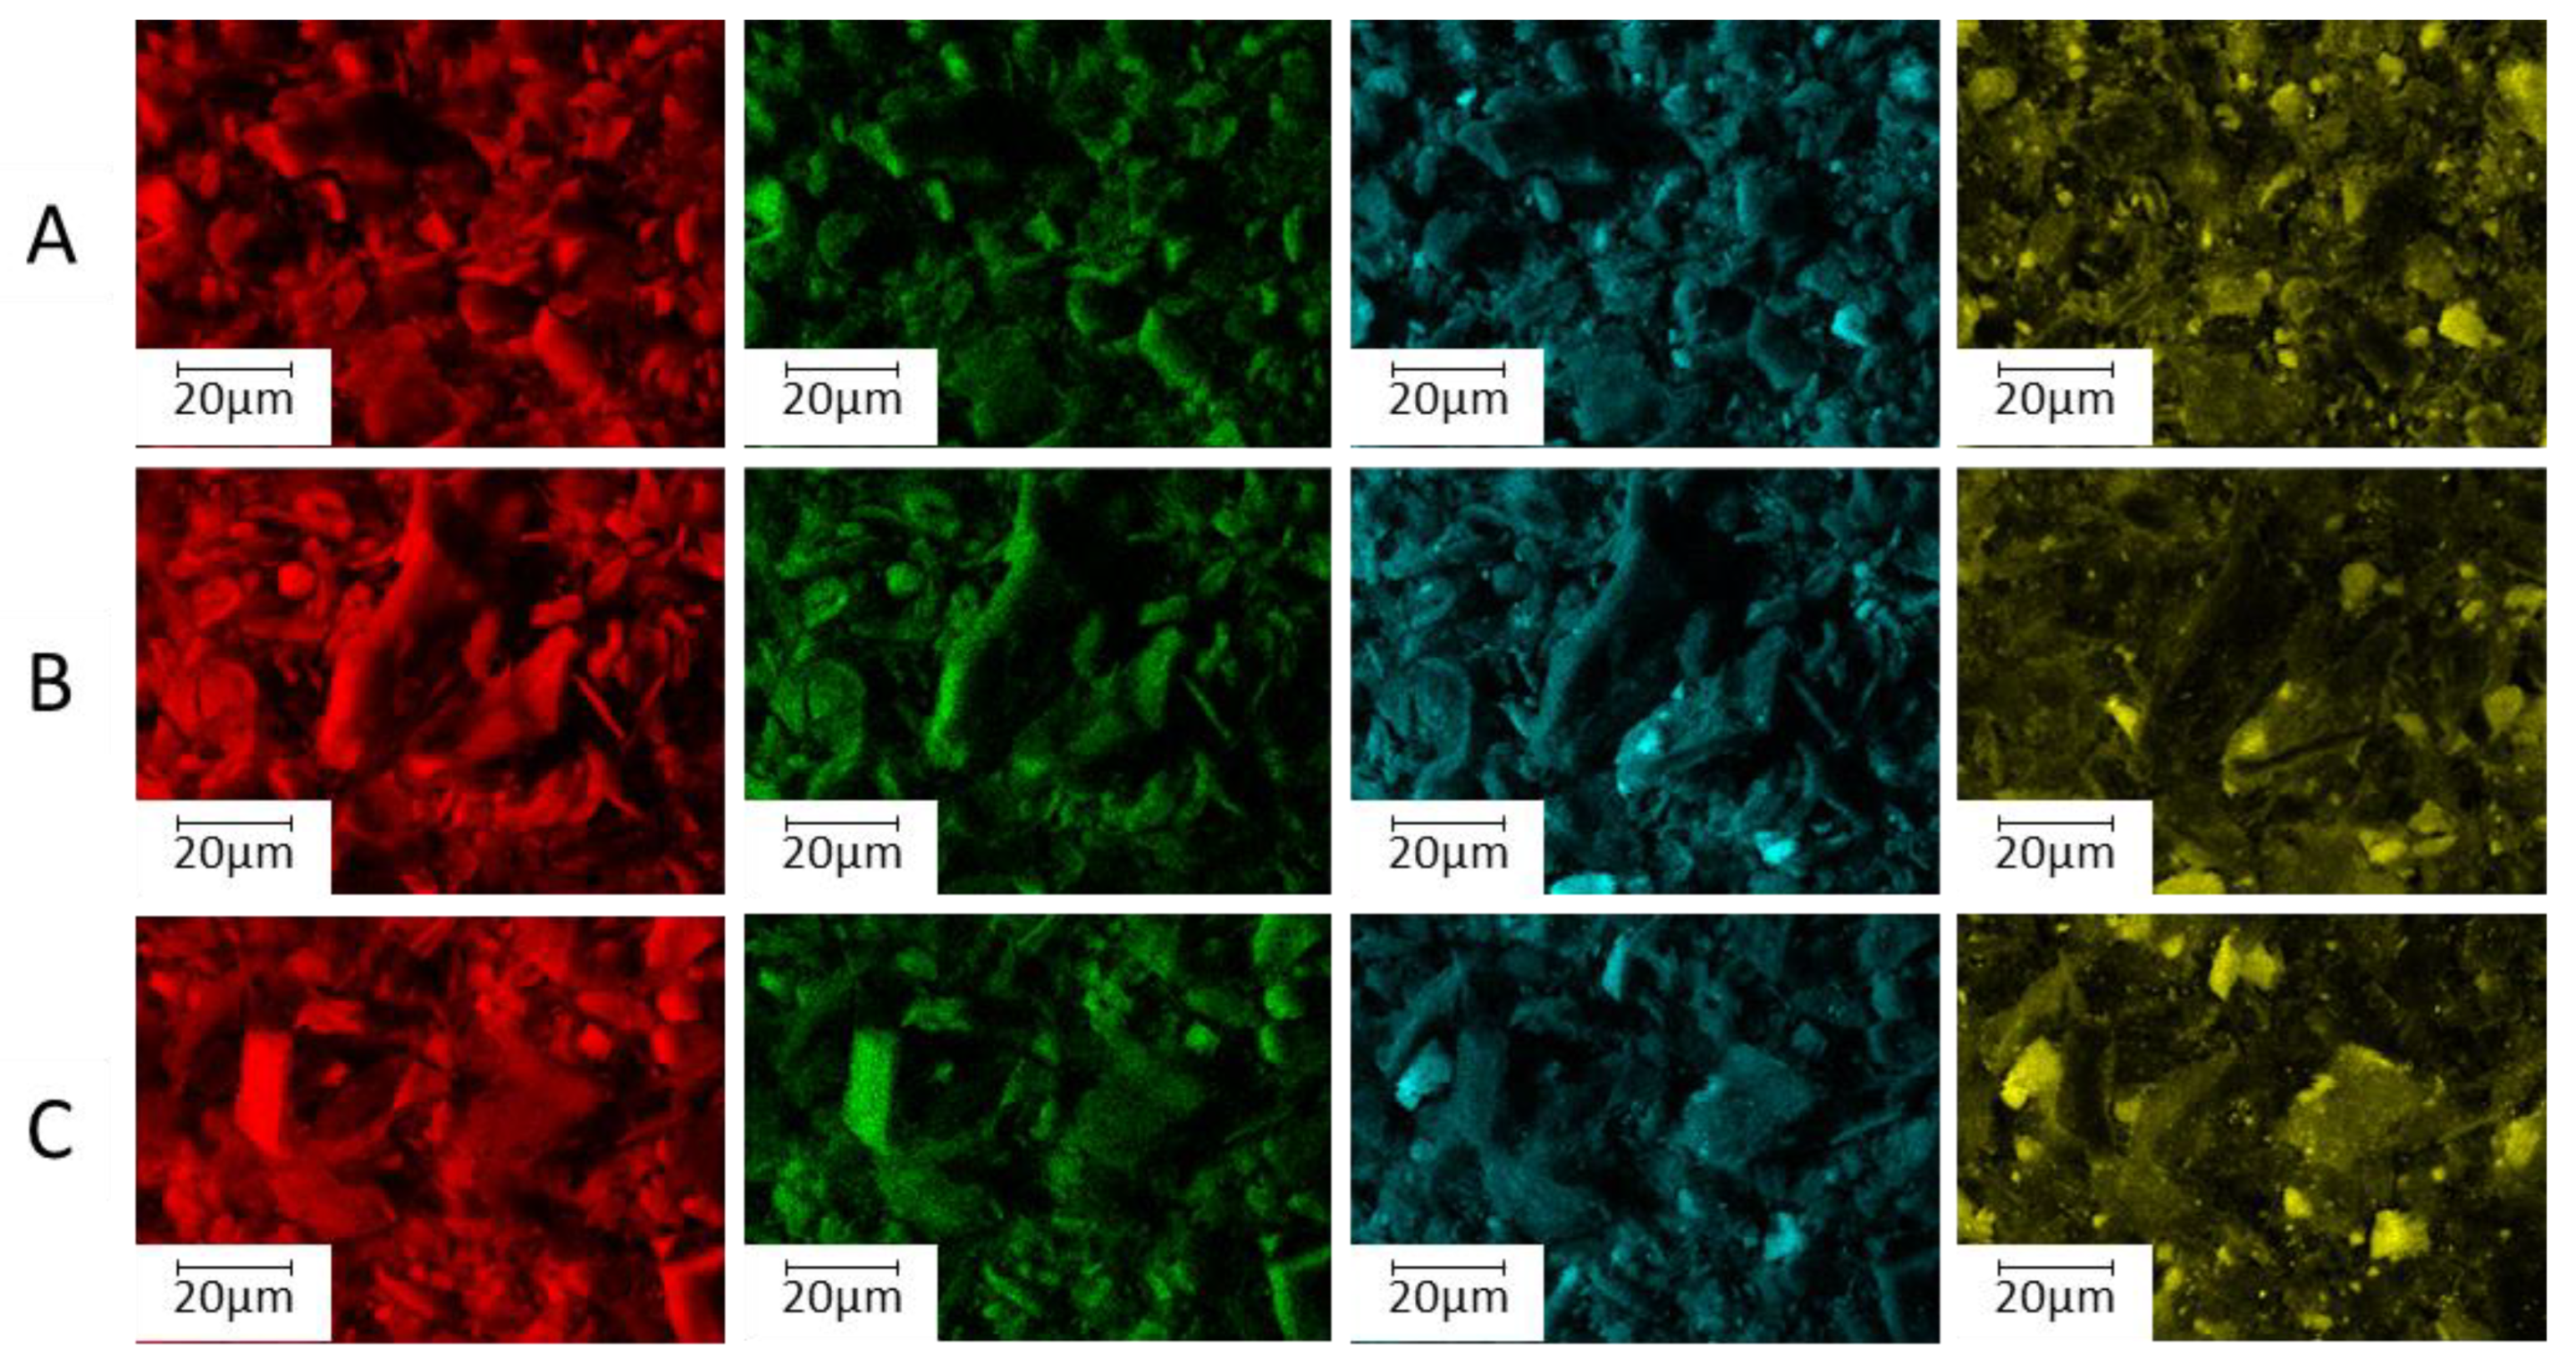
2.3. Characterization

To confirm the title of the GO used, a proper amount of aqueous solution of GO was added to Ultrapure MilliQ water (electric resistance > 18.2 MΩ/cm) from a Millipore Corp. model Direct-Q 3 system, and bath ultrasonicated for 10 min (37 kHz, 180 W; Elmasonic P60H; Elma). The GO suspension was further diluted with water to 30 µg/mL and the concentration was checked spectrophotometrically by using a Varian Cary 100 BIO UV-Vis spectrophotometer. The UV–Vis absorption spectrum was recorded in the wavelength range of 200–800 nm after background subtraction.
Material morphology and EDX elemental analysis were performed via SEM images using the Phenom XL Desktop apparatus, in backscatter mode at 2500× optical magnification set at 15 KV accelerating voltage, using Phenom ProSuite software.
A TA SDT650 with TRIOS data software was used for the thermogravimetric analyses. Each sample was heated in an atmosphere environment with a flow of 20 mL/min, with a rate of 5 °C/min to 900 °C and with a final isotherm of 15 min.
The Raman spectroscopy analyses were collected using a Horiba XploRA™ PLUS Raman microscope (HORIBA ITALIA Srl, Roma, Italy) with a 50×_VIS objective and 532 nm edge laser, using Labspec6 spectroscopy suite software.
X-ray powder diffraction (XRPD) data were collected by a Bruker D2 Phaser benchtop diffractometer (Bruker Italy Srl, Milano, Italy) with a Cukα radiation source and a PSD detector. The patterns were collected in the air with a step size of 0.02° and a counting time of 0.5 s per step in the angular range of 5–70°, using a PMMA sample holder.

2.4. Dispersive Solid Phase Extraction Procedure

The blank plasma samples were purchased from Sigma Aldrich Ltd. (Milano, Italia). At the same time, real blood samples were taken from patients at the “SS. Annunziata” hospital in Chieti (Italy) as routine TDM without requiring extra visits from clinicians. Plasma (1 mL) was obtained starting from whole blood, containing EDTA as an anticoagulant, by centrifugation at 1800 g for 10 min at 4 °C. A total of 1 mL of trichloroacetic acid was added to 1 mL of plasma and centrifuged at 6000 g, the supernatant obtained was diluted to 5 mL with acetate buffer at pH 5, and subsequently subjected to dMSPE. A total of 25 mg of Fe3O4-AC-rG (375 mg) was added, and the solution was stirred for 5 min. Subsequently, using an external magnetic field through a neodymium magnet, the sorbent was recovered and the solution discharged. The analytes were desorbed from the Fe3O4-AC-rG (375 mg) using 1 mL of acetonitrile, and by means of a neodymium magnet the sorbent material was removed from the solution. The obtained solution was evaporated to dryness under a gentle steam of nitrogen, reconstituted with 50 µL of a solution of acetate buffer and acetonitrile (75:25 v/v), and 8 µL was injected.

2.5. Chromatographic Conditions

The analyses were carried out by using an ultrahigh-performance liquid chromatography system (ACQUITY H-Class, Waters S.p.A., Milano, Italy). The instrument was equipped with a column heater, a degassing unit coupled with a quaternary pump (ACQUITY), a UPLC sample manager (ACQUITY), and a Waters 2996 photodiode array detector. The analytes were separated using a 120 SB-C 18 poroshell column (50 × 2.1 mm I.D., 2.7 um particle size). The mobile phases used were 10 mM acetate buffer at pH 5 (Line A) and acetonitrile (Line B) both containing 0.1% of triethylamine, using a gradient elution. The initial composition of the mobile phase was 98% A and 2% B, in 3.5 min the percentage of B increased up to 25%, then in 4.5 min the percentage of B increased up to 90% and then returned in 0.1 min to the initial composition followed by 2 min of reconditioning to the initial conditions. The total run time was 10 min. Each analyte was determined at its maximum wavelength.

3. Results and Discussions

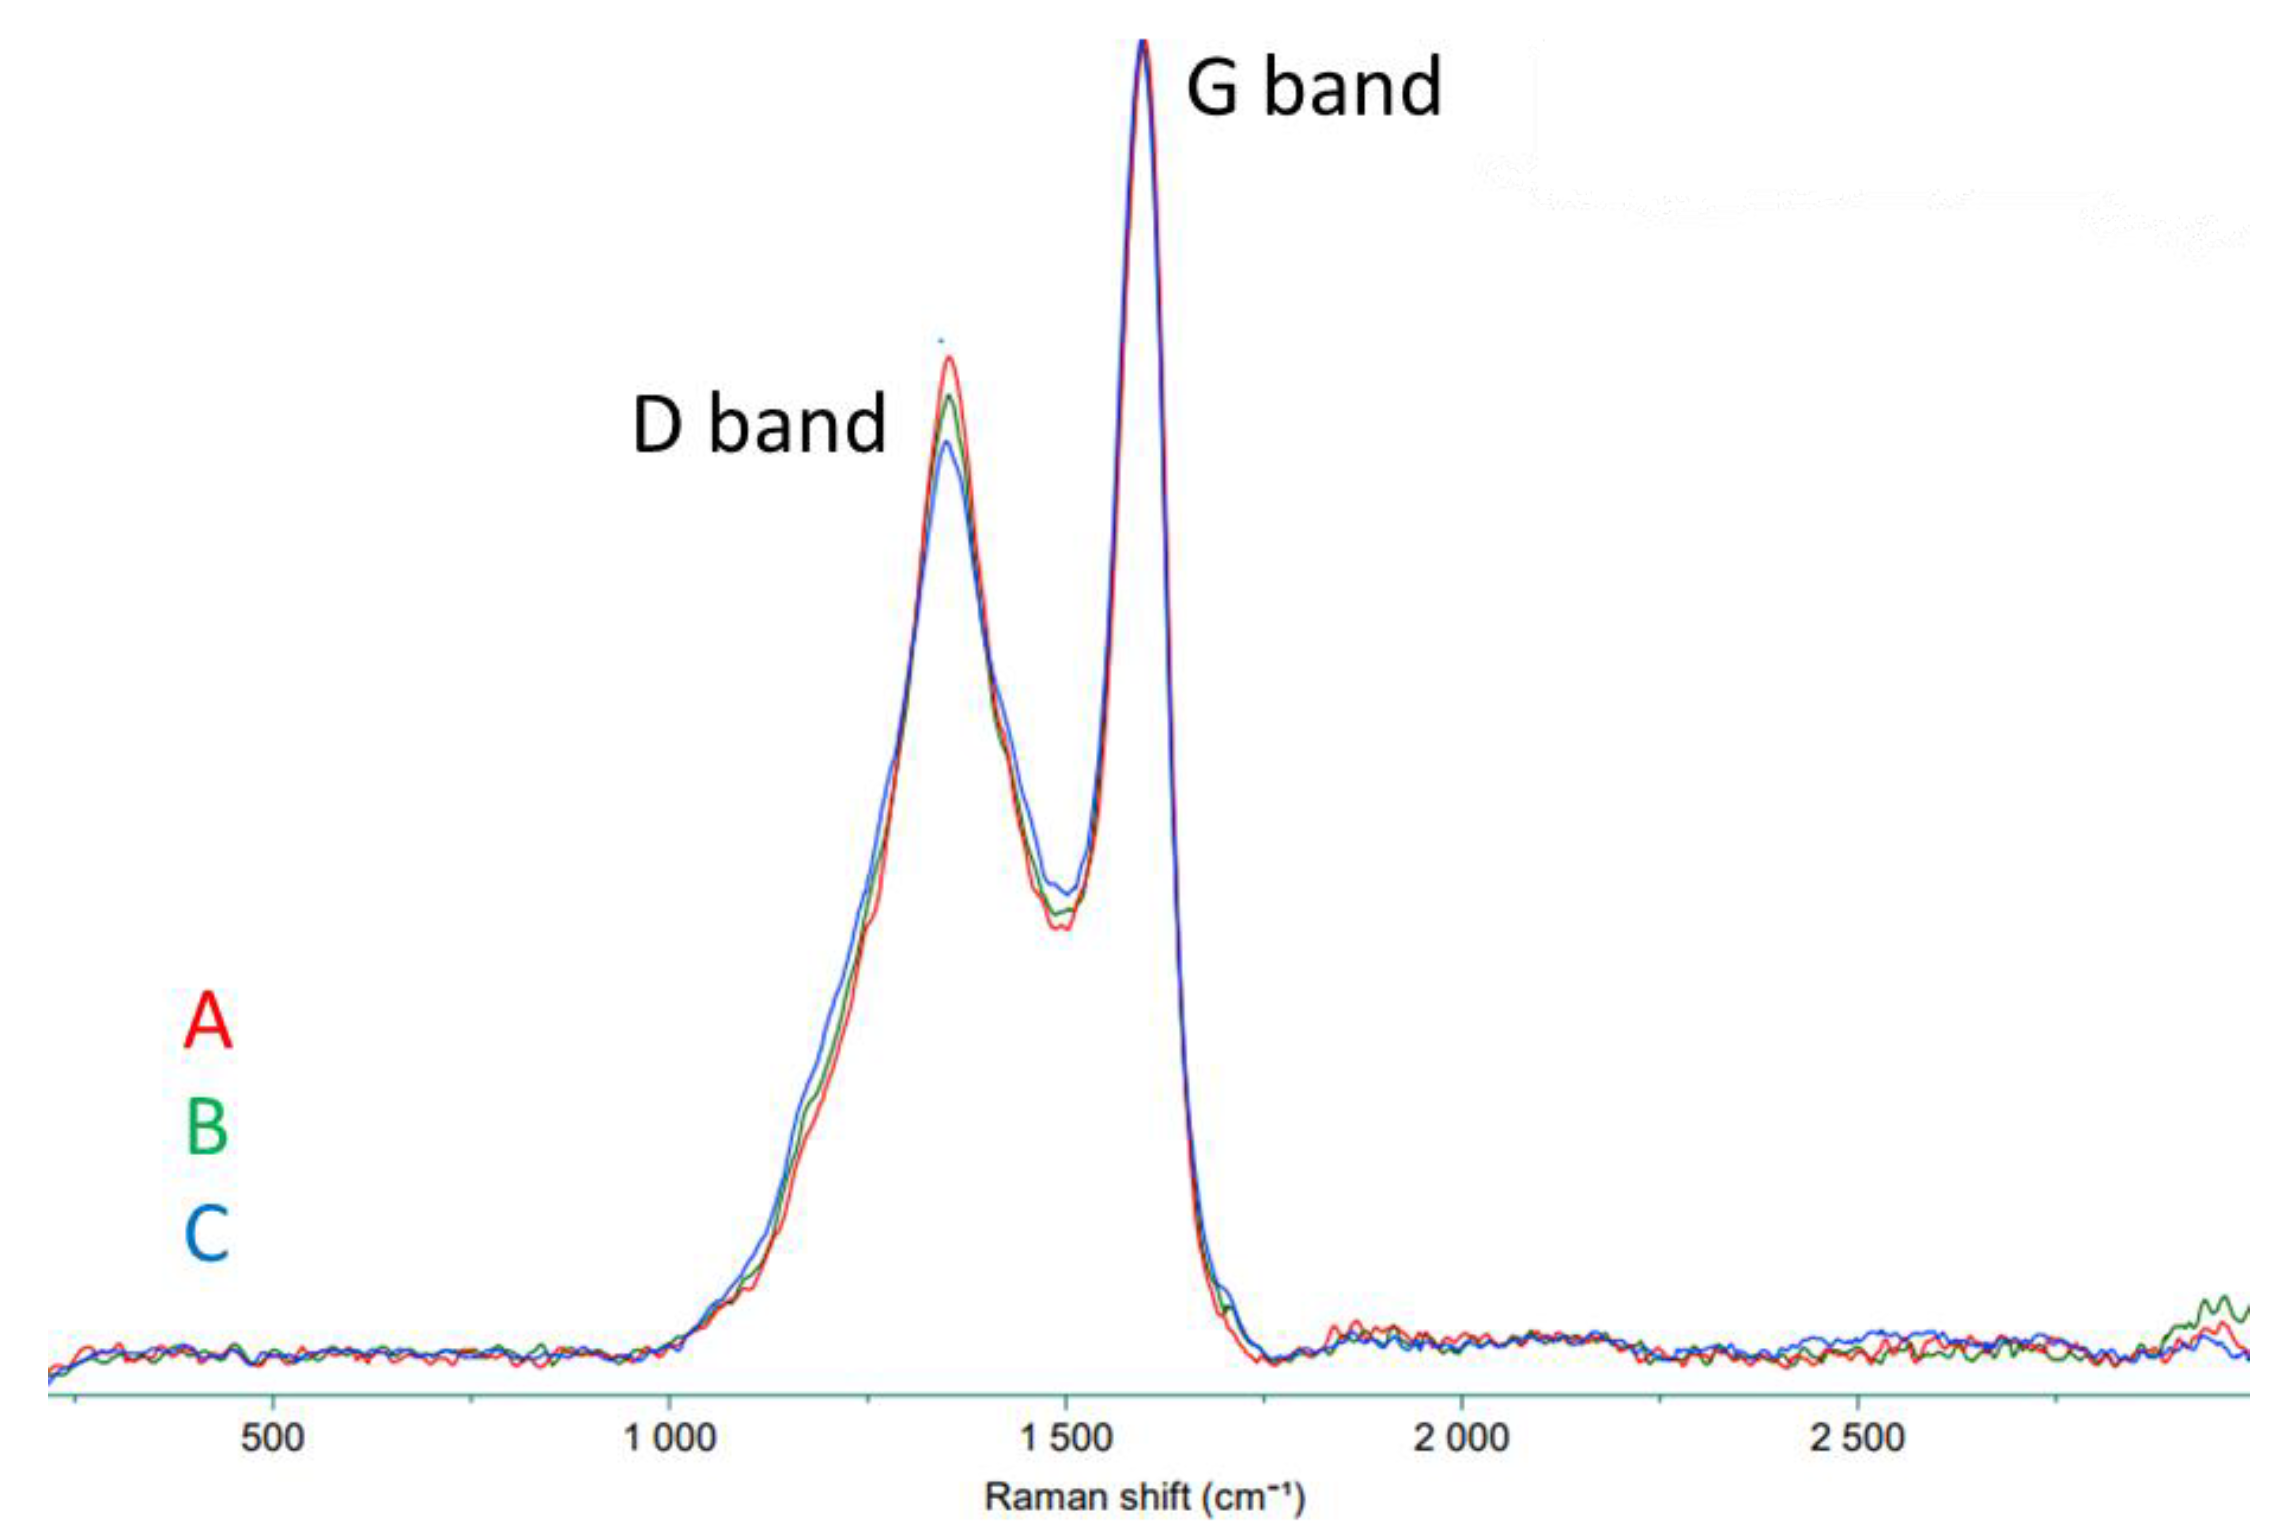
3.1. Characterization of the Sorbent

The preparation of the carbonaceous material based on GO and Fe3O4 has been the subject of various studies. Each sought to create a mixture capable of exploiting the performance of GO together with the magnetic properties of iron oxide achieved through different operational strategies. Figure 1 schematically presents the operational phases involved in the work.
A solution containing GO was characterized to confirm its concentration and then added to colloidal solutions of wastepaper and Fe2O3 [25]. As reported in Figure 2, the UV–Vis spectra of diluted GO suspension showed a characteristic absorption peak at 230 nm, which can be attributed to the π-π* transitions for aromatic C-C bonds and a shoulder at 290–300 nm being the fingerprint of n-π* transitions of carbonyl groups. The UV absorbance was read at λmax of 230 nm and the concentration of the GO dispersed in water was obtained from a validated concentration–absorbance calibration plot.
The porous and absorbent structure of the cellulose made it possible to absorb the iron oxide and the GO dispersed together, leaving only the aqueous part of the solutions on the outside, which was then removed from the sample by simple heating on a heated plate. Once the physical entrapment occurred, the impregnated waste papers were subjected to calcination in a nitrogen flow to favor the synthesis of Fe3O4 (vs. Fe2O3), using the carbon present in the paper as a reducing agent.
The calcination parameters were optimized by carrying out a thermal analysis of the degradation, as shown in Figure 3. The thermal protocol included an initial isotherm at 50 °C for about 10 min, followed by a ramp of 5 °C/min until the final temperature of 900 °C. All samples showed the same behavior during the increase in temperature.
Three stages were distinguishable during the degradation kinetics: the first at about 200/250 °C, characterized by the initial recombination/depolymerization reactions, the second, very fast, up to 350 °C and related to the initial pyrolysis with the formation of CO2 and CO, and the final stage up to 600 °C, relatively speaking slower than the previous one, and where the carbothermic reaction went to completion with the formation of the activated sample. In this latter phase, the iron oxide with paramagnetic properties was formed.
The SEM images (Figure 4) revealed that all samples are heterogeneous in size and formed by fragments of different dimensions. Through the energy dispersion X-ray mapping analysis (Figure 5), it was possible to observe a homogeneous distribution of the various constituents.
The phases in the samples were identified by X-ray diffraction. The patterns (Figure 6) present diffraction peaks that match very well with the reported data of magnetite (JCPDS No. 19-0629), showing that the method developed herein is convenient for obtaining the target phase. The high background in the region located around the 20–25° 2θ angle, due to diffuse scattering, could indicate the presence of amorphous phases such as carbon.
The graphitization of carbon was observed using Raman spectroscopy (Figure 7), through the study of the two characteristic peaks defined D (carbon sp3) and G (carbon sp2) detected at about 1330 and 1590 cm−1, respectively. The materials with a smaller amount of GO resulted in less intense D bands, and this difference was observable in the different intensities of the respective peaks, which grow proportionally with the increasing the quantity of GO. Both the G-band and D-band suggested that the samples have an overall composition largely consisting of amorphous carbon, probably due to the low calcination temperature. In fact, it is usually reported that ordered structures more similar to graphene can be obtained if the pyrolysis is performed above 800 °C [26,27,28].

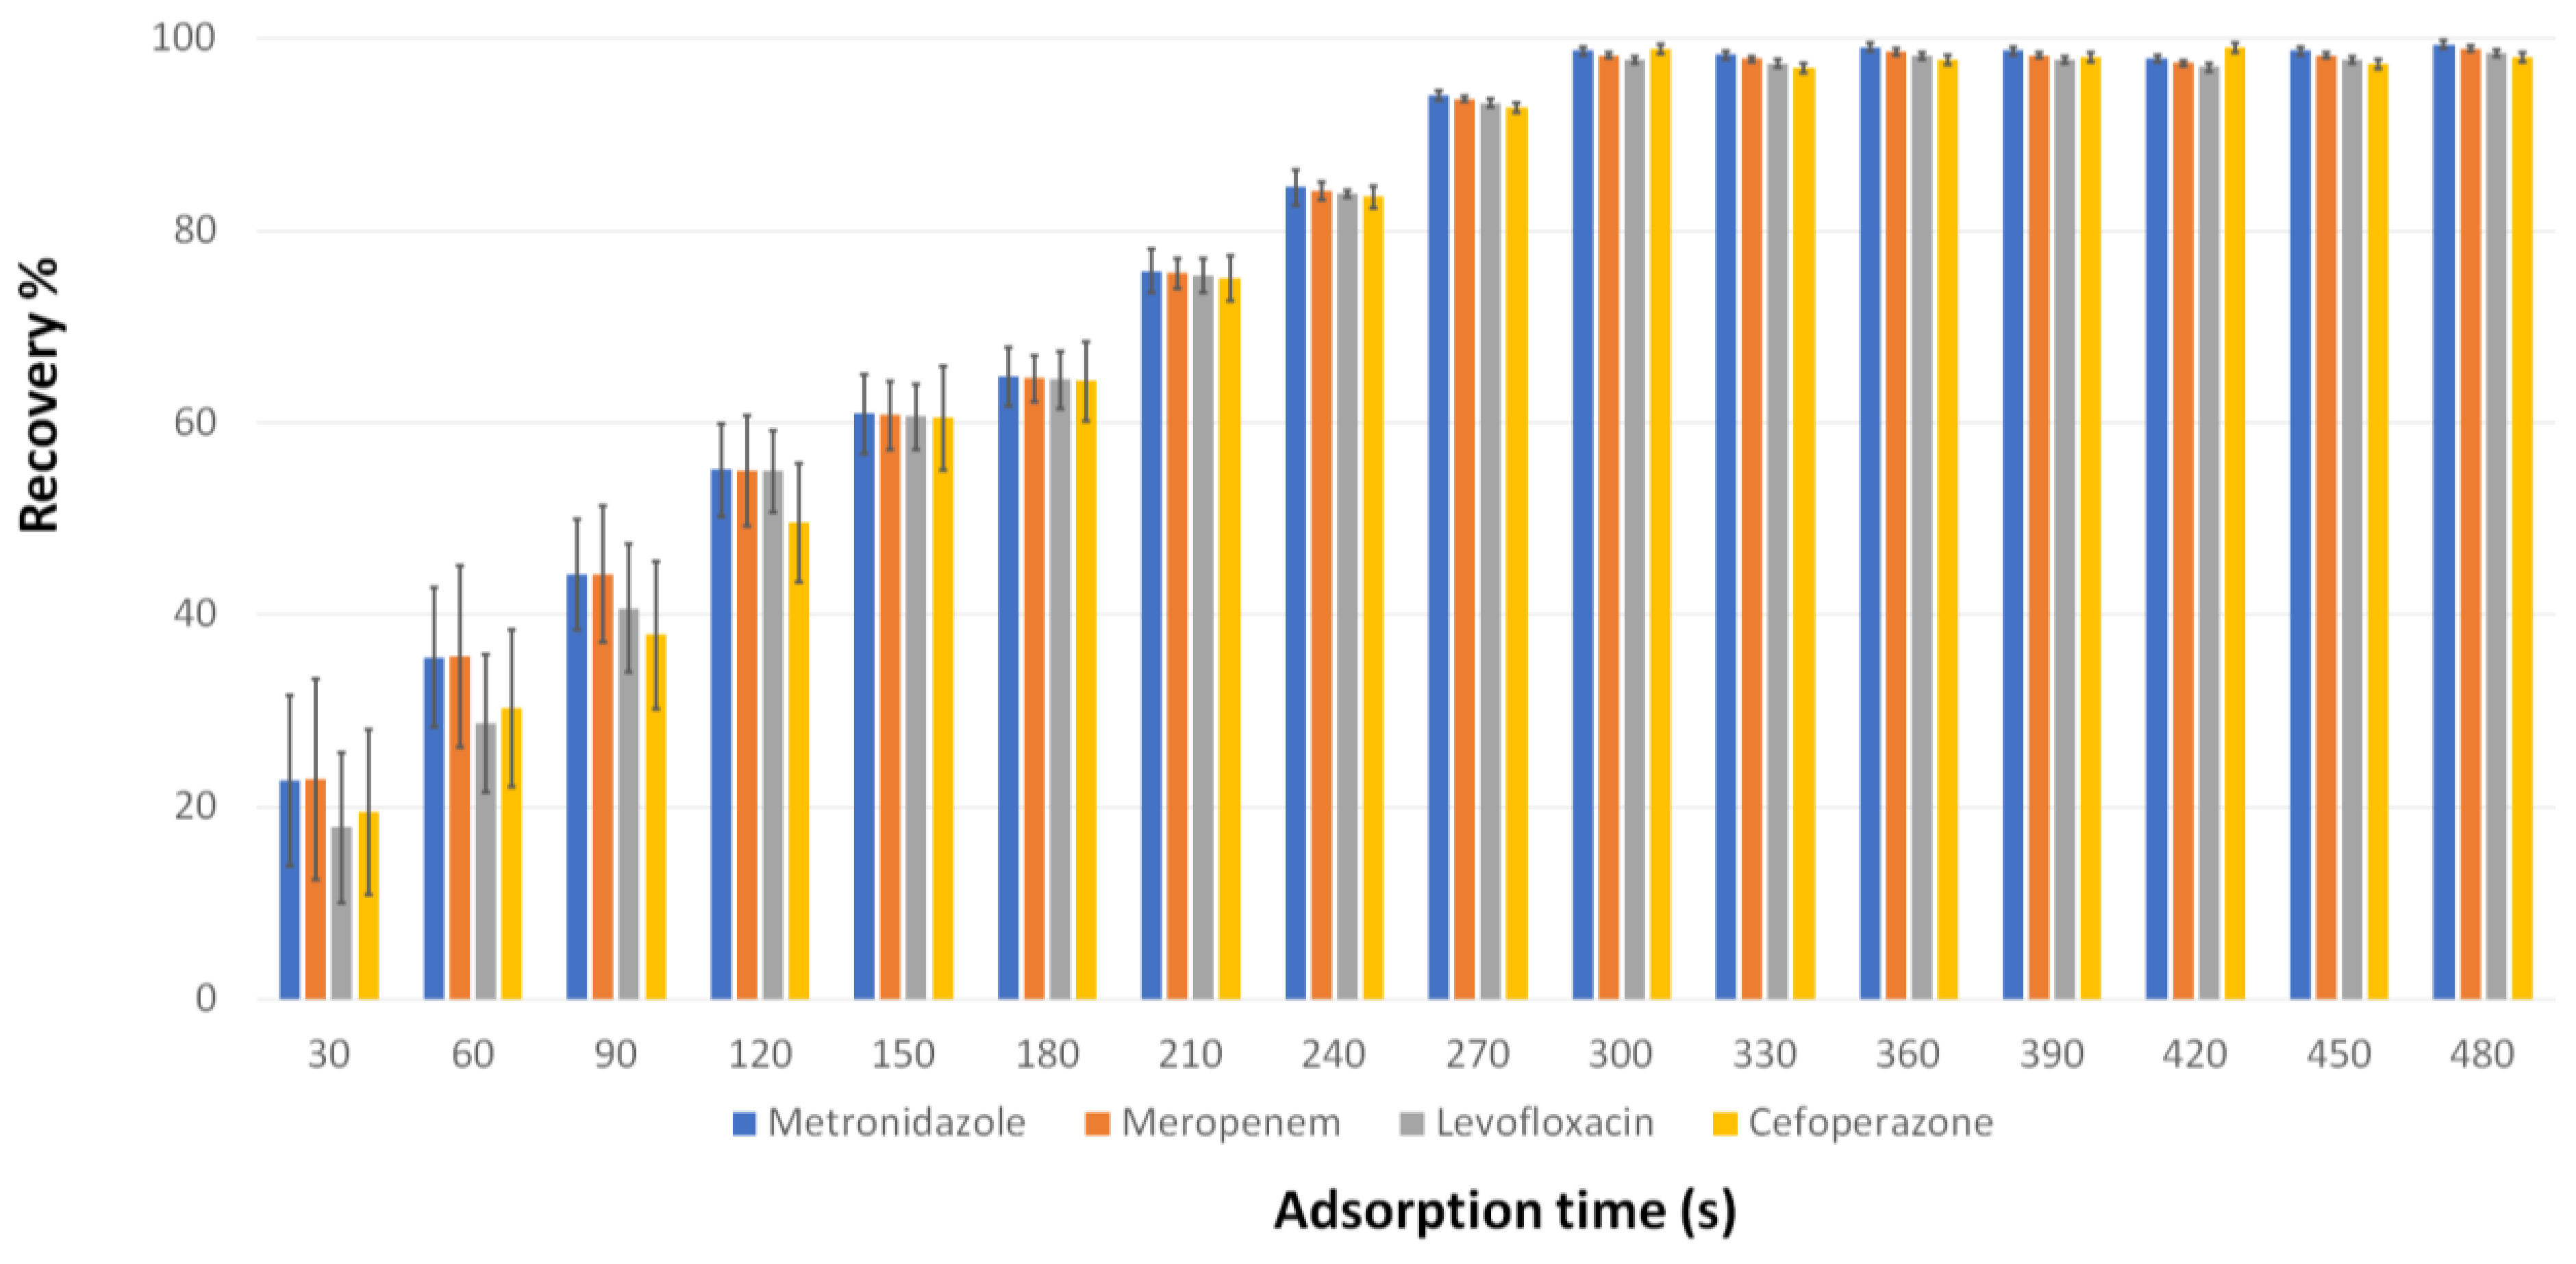
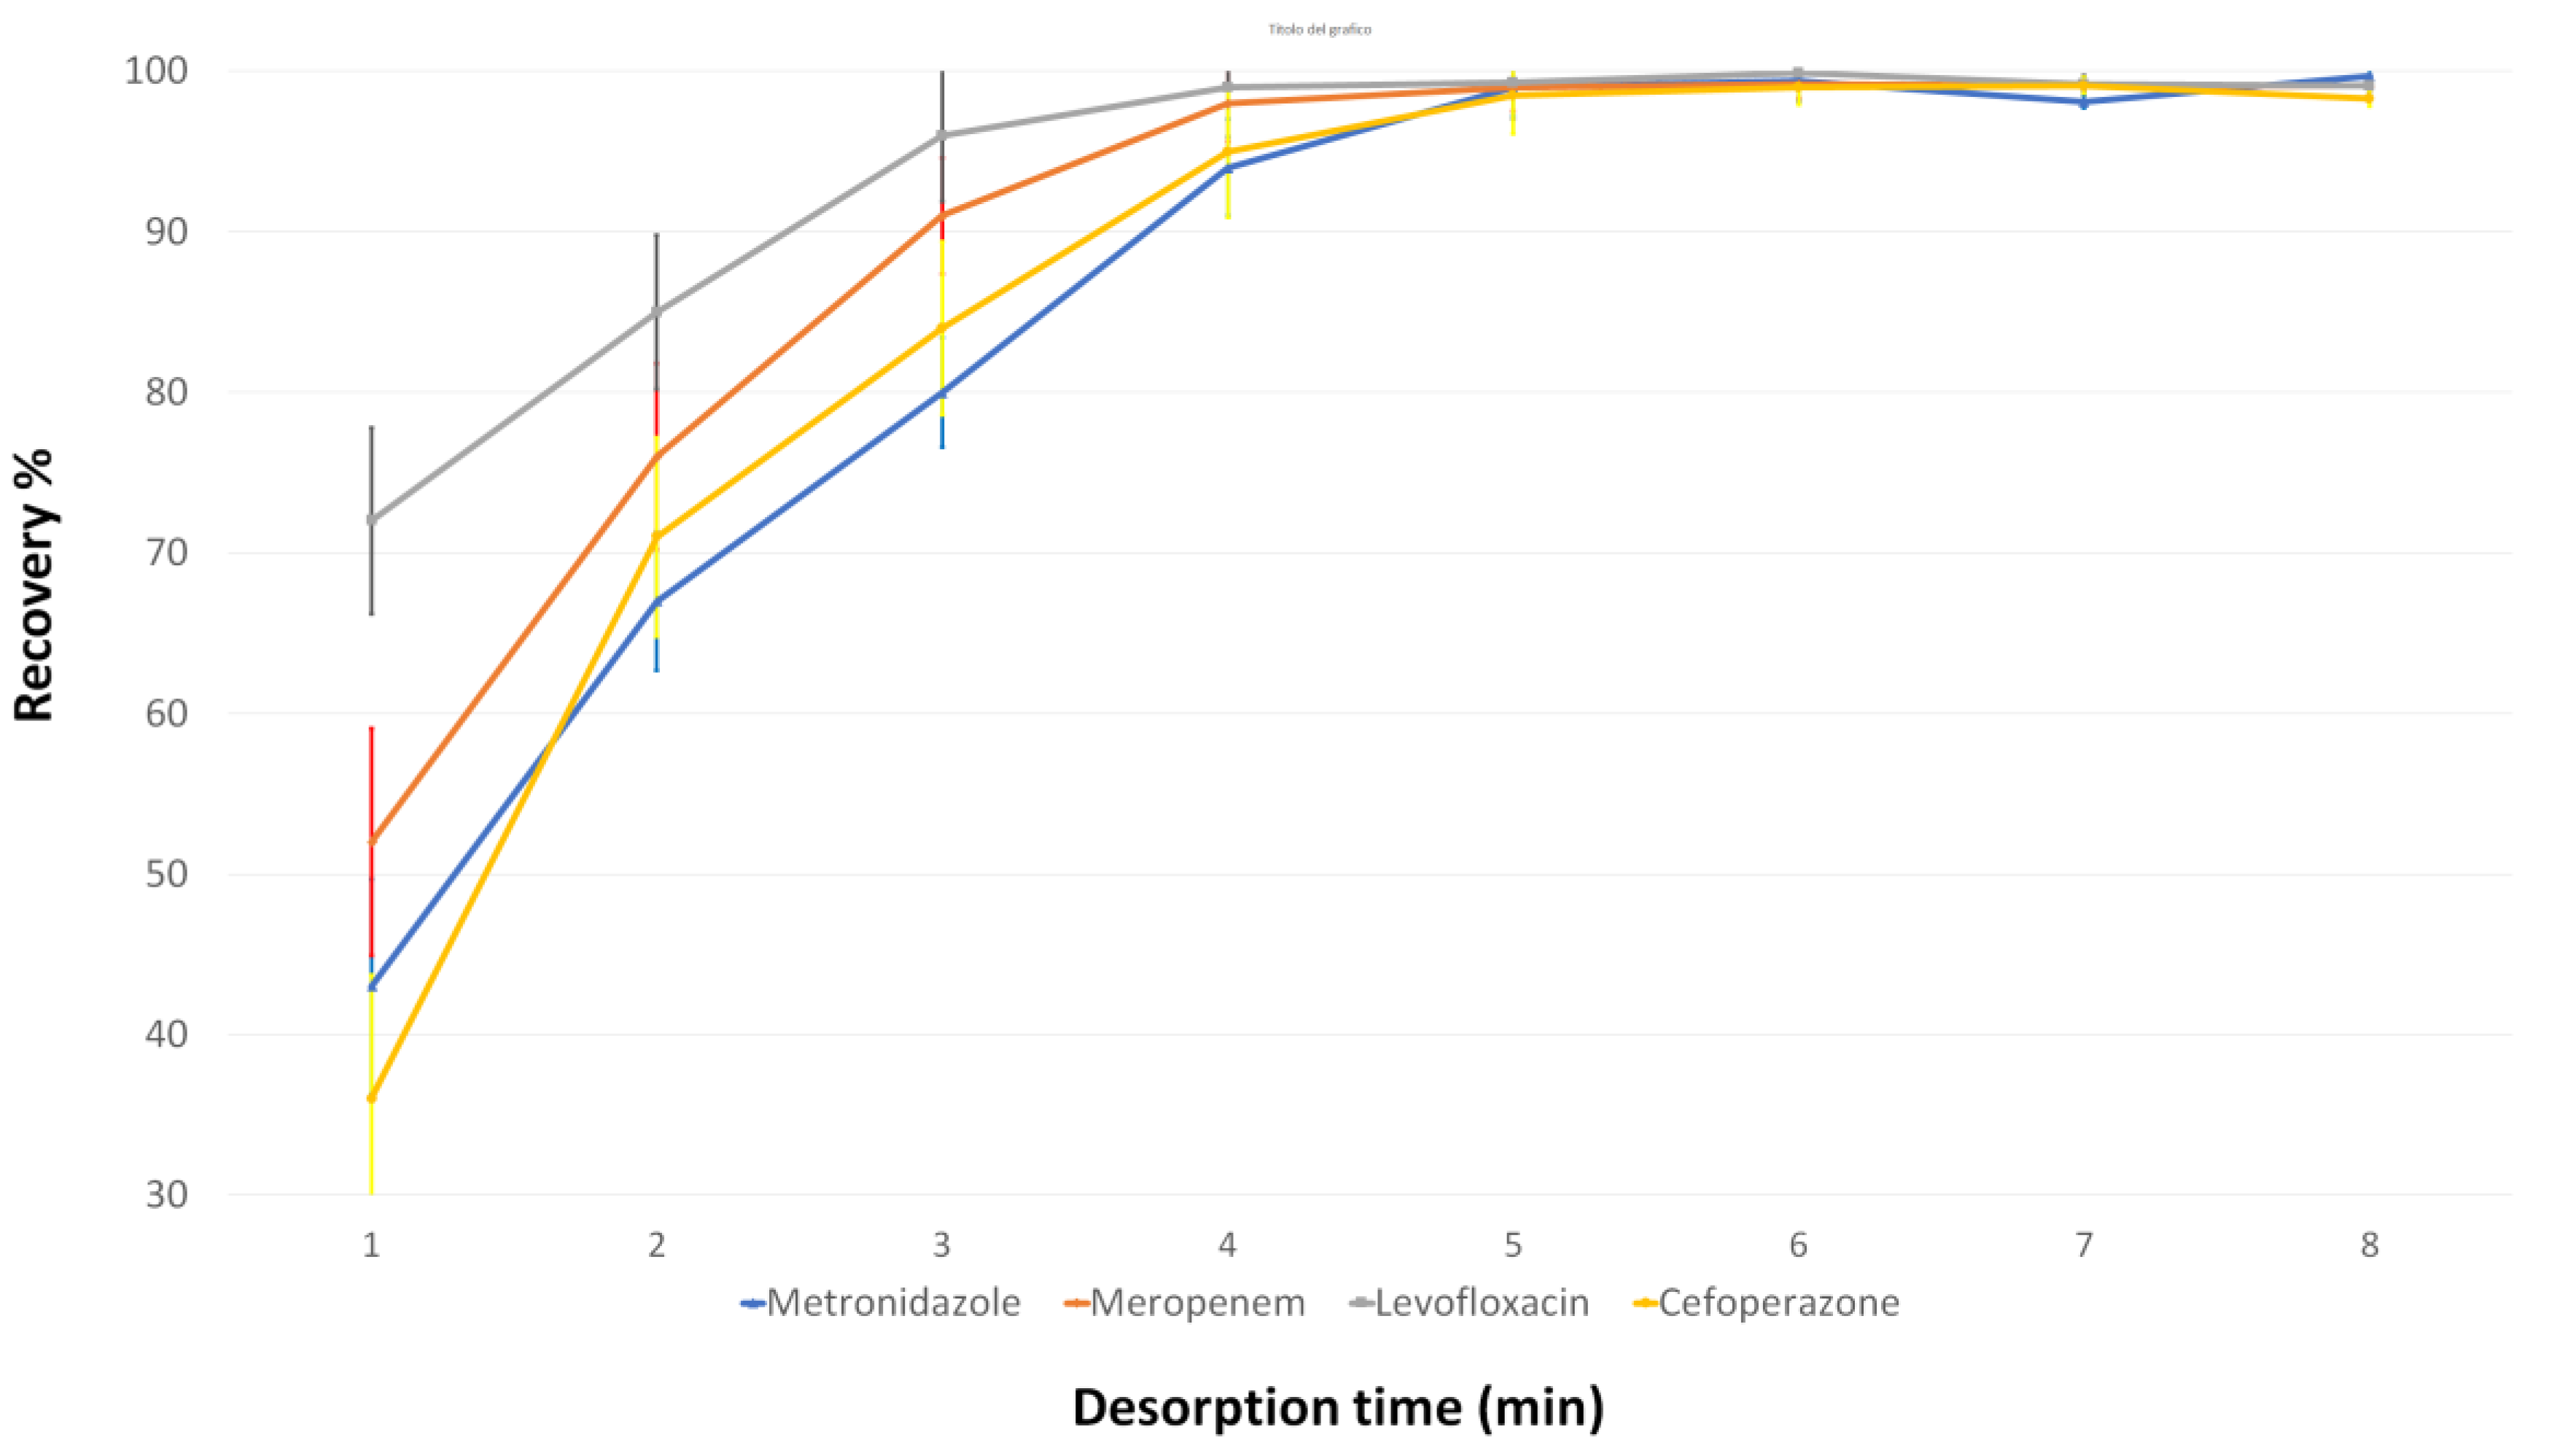
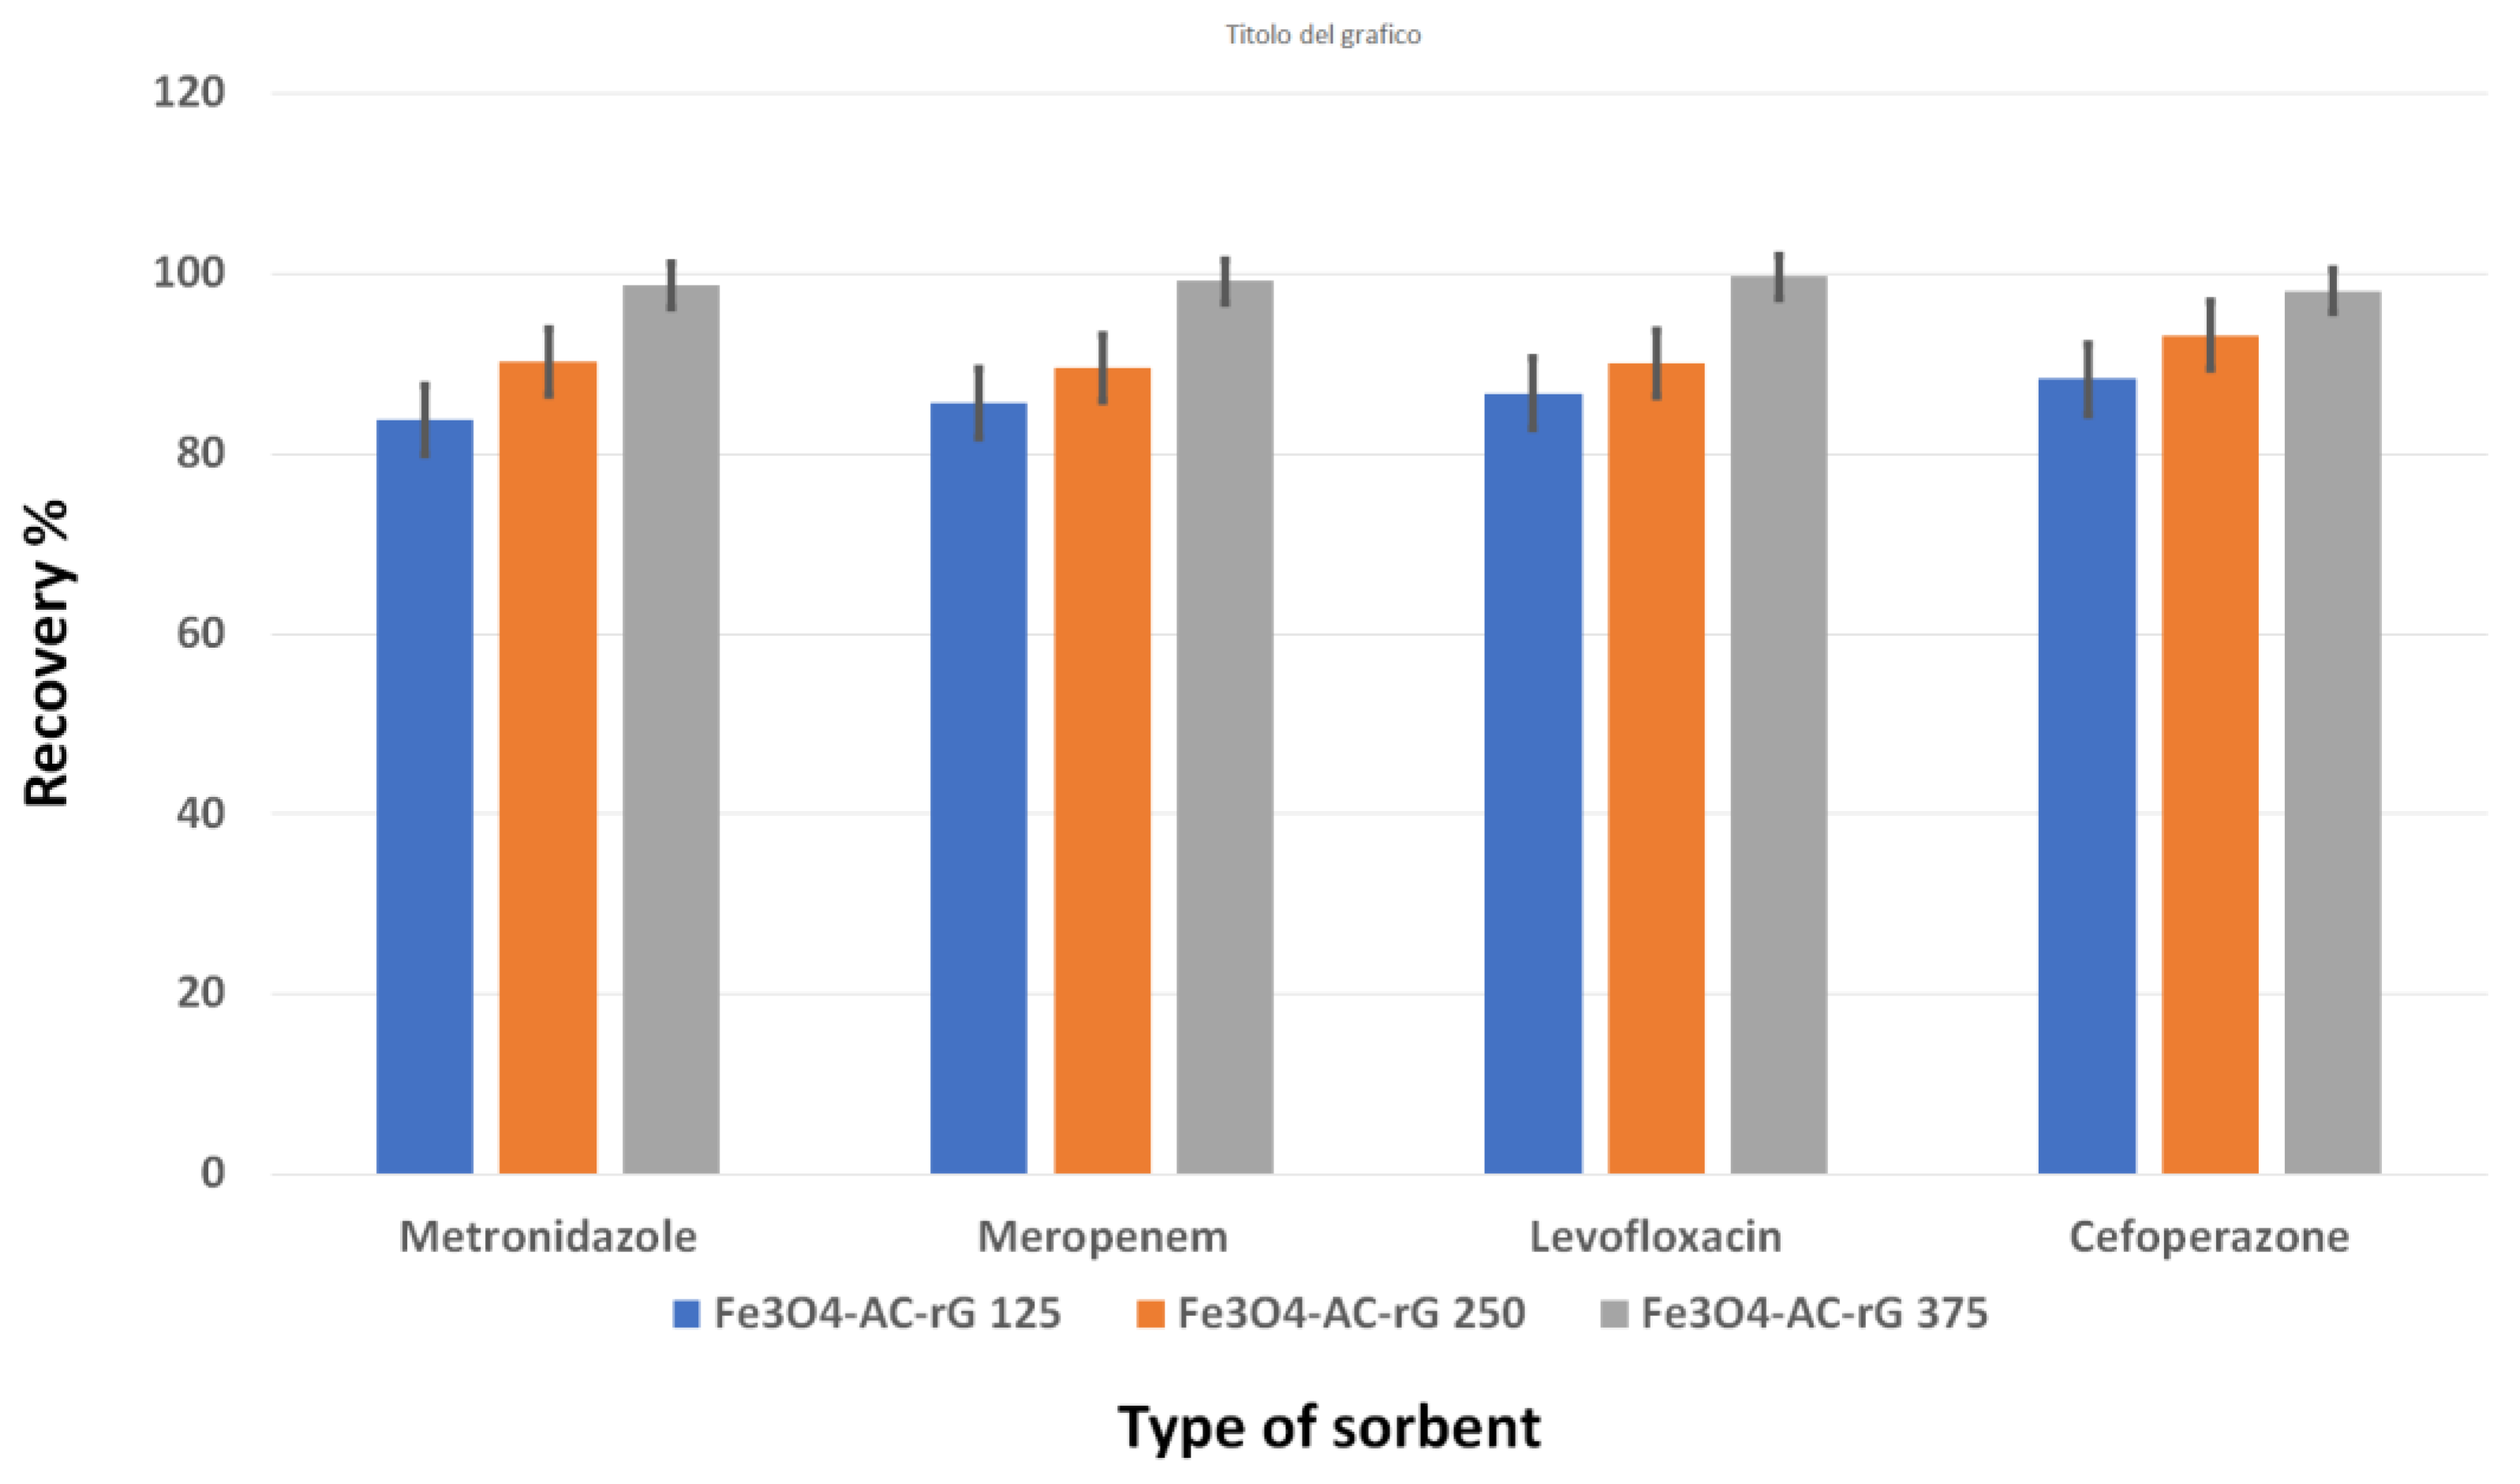
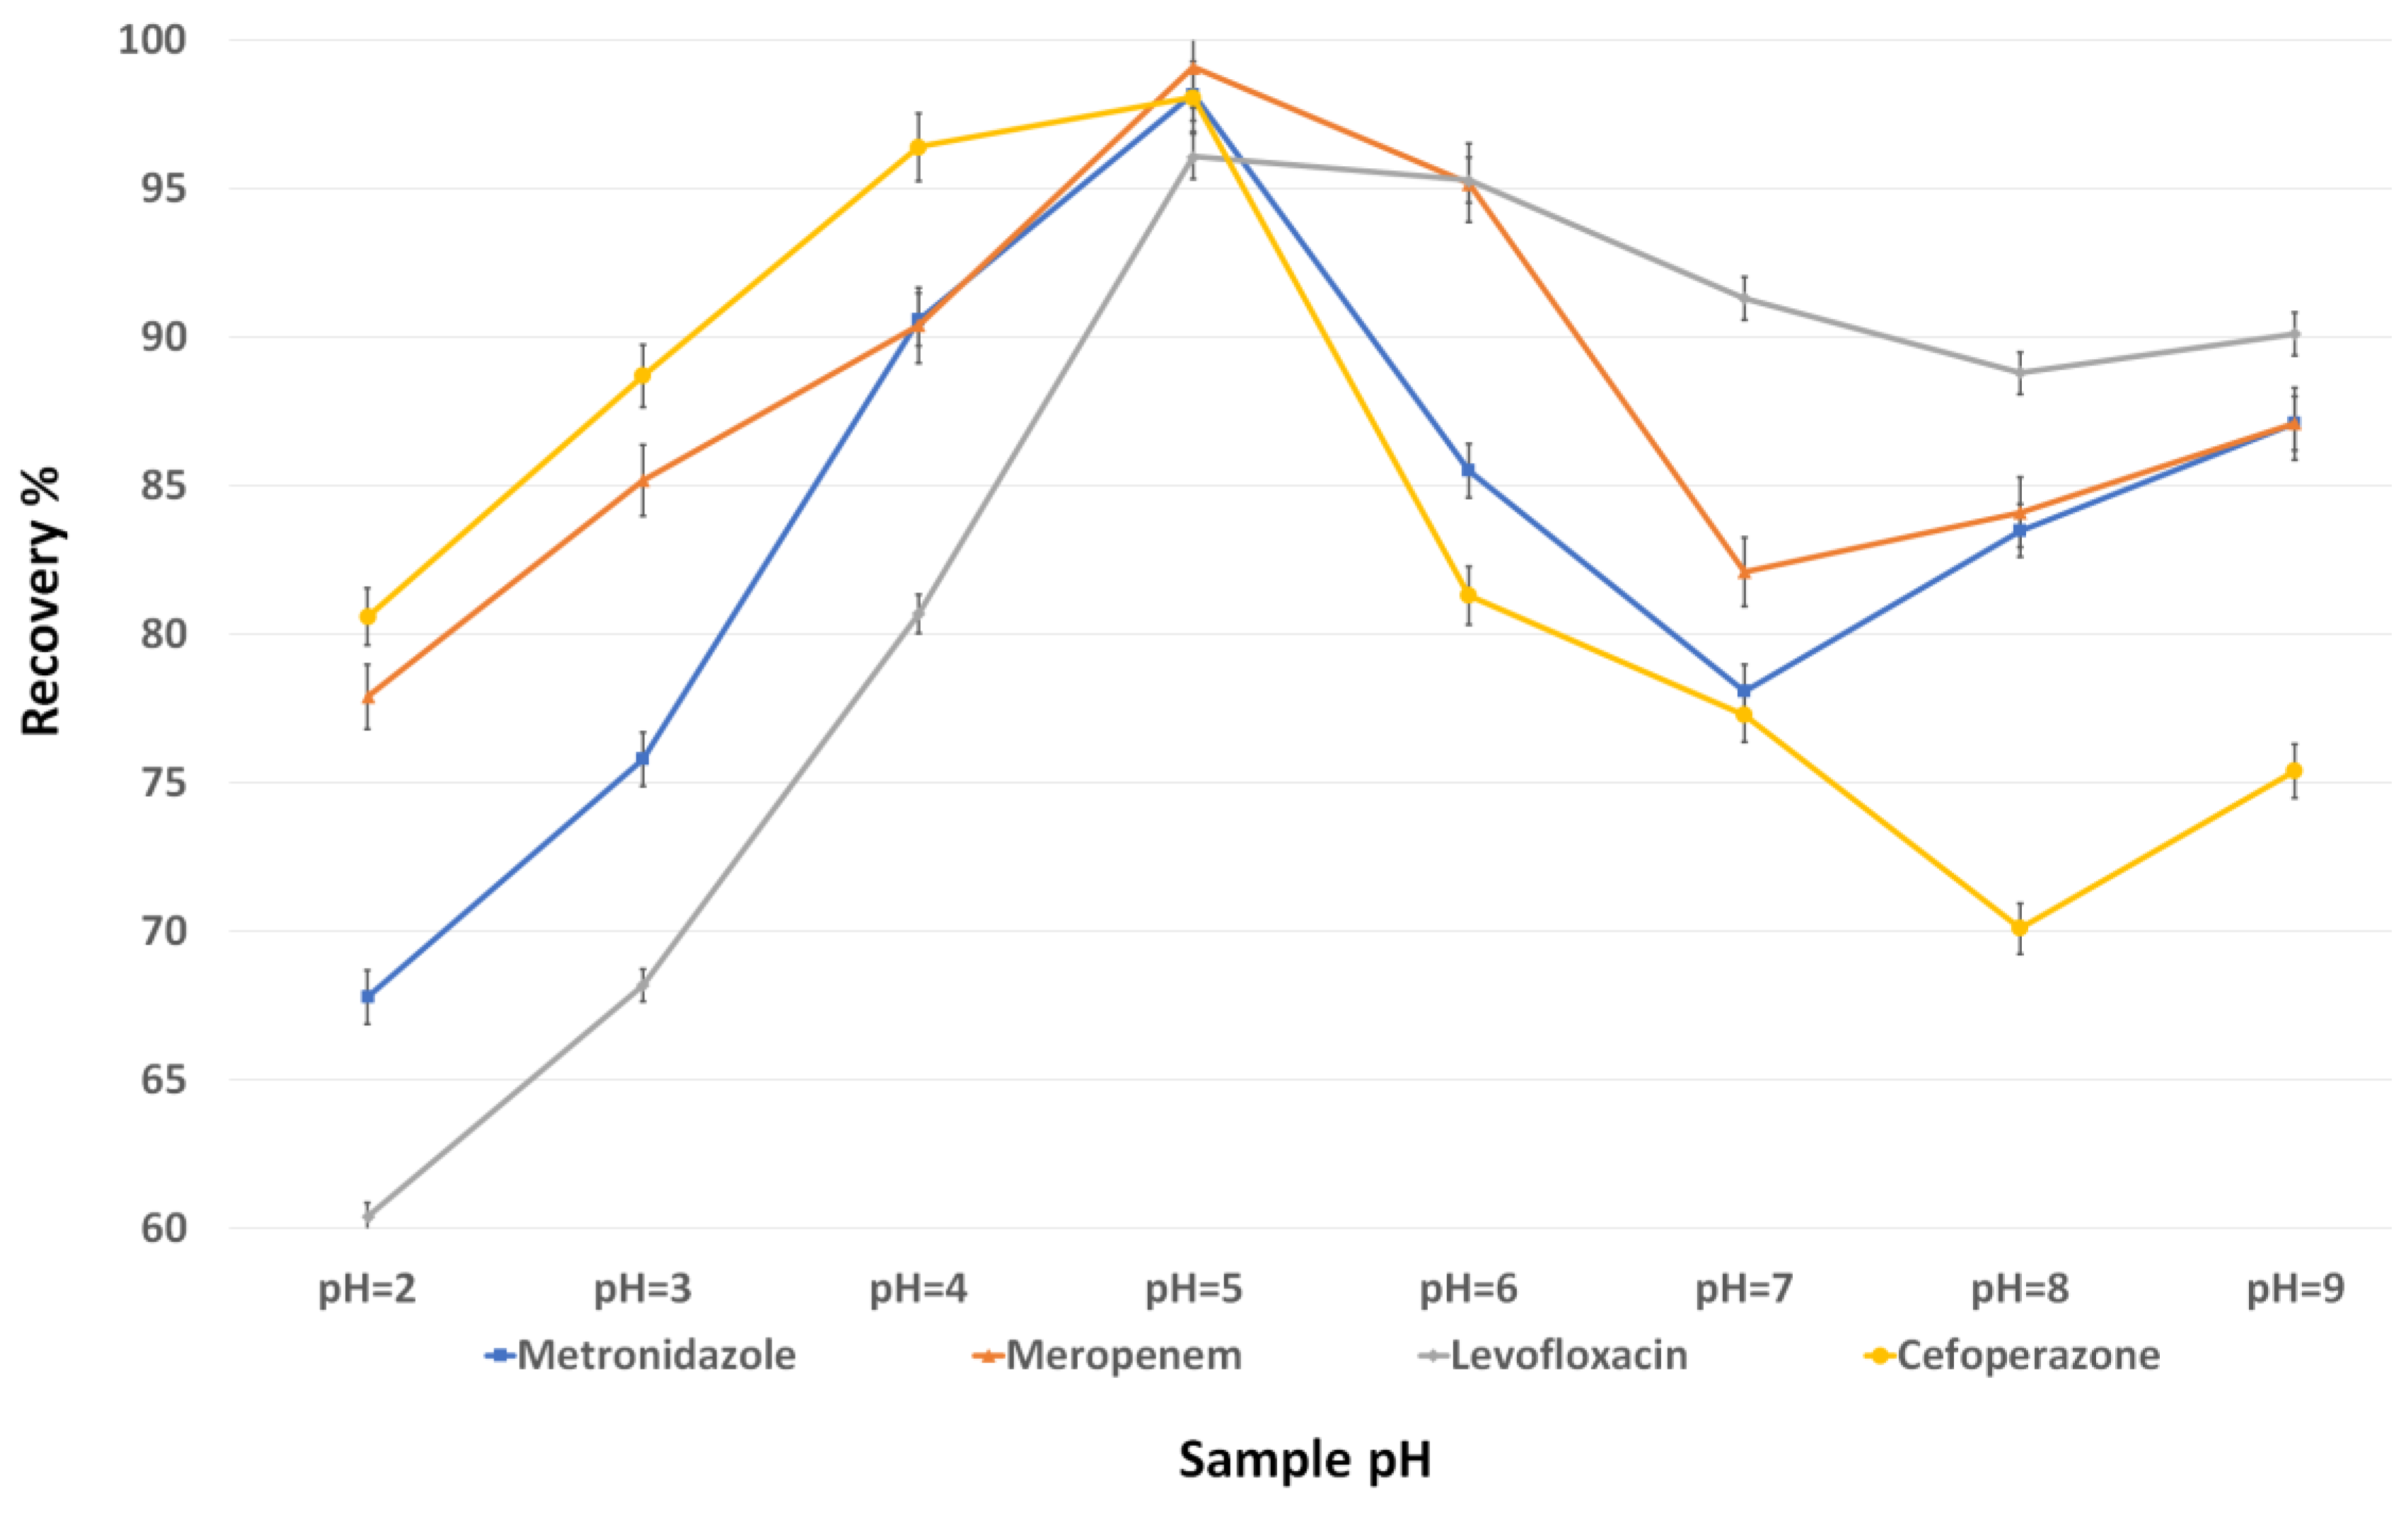
3.2. Evaluation of the d-MSPE Conditions

To evaluate the GO effects on the parameters that greatly influence the d-MSPE, several experiments were carried out to evaluate the amount of sorbent material necessary for the adsorption of all the analytes, the time required for their adsorption, the pH of the sample to be extracted, and finally the time necessary for the desorption of the analytes. For these experiments, standard solutions at a concentration of 1 µg/mL were used. From the results shown in Figure 8, it is evident that, as the amount of graphene increases, the recovery of the analytes (the adsorption capacity) also increases. Consequently, the Fe3O4-rG-AC (375 mg) was chosen as the sorbent for further experiments.
Then, the time necessary for the adsorption of the analytes was estimated. A total of 5 min was enough to guarantee the adsorption of the analytes, and increasing the adsorption time beyond 5 min did not bring any improvement. As further confirmation of the successful adsorption, the supernatant remaining after the adsorption step was not discarded but analyzed to confirm the absence of analytes. The results are reported in Figure 9.
Although the main interactions of the prepared sorbent are hydrophobic, it should not be underestimated that graphene has a point of zero charge (PZC) at a pH between 6 and 7 which makes it capable of electrostatic interactions. For this reason, different pH values between 3 and 9 were investigated using recovery as a response. As can be seen in Figure 10, the best results were obtained at pH 5. In fact, at pH 5 the analytes are found in the neutral form and few in the protonated form; consequently, the analytes are adsorbed through hydrophobic and π-π interactions, although there is also a small contribution of electrostatic interactions as demonstrated by various publications [29,30,31].
The time required for desorption was finally evaluated and, as shown in Figure 11, a plateau is reached after 5 min; a shorter desorption time would be insufficient for the analytes to desorb from the surface of the sorbent, causing a decrease in the recovery of the analytes, while a desorption for more than 5 min would bring no improvement.

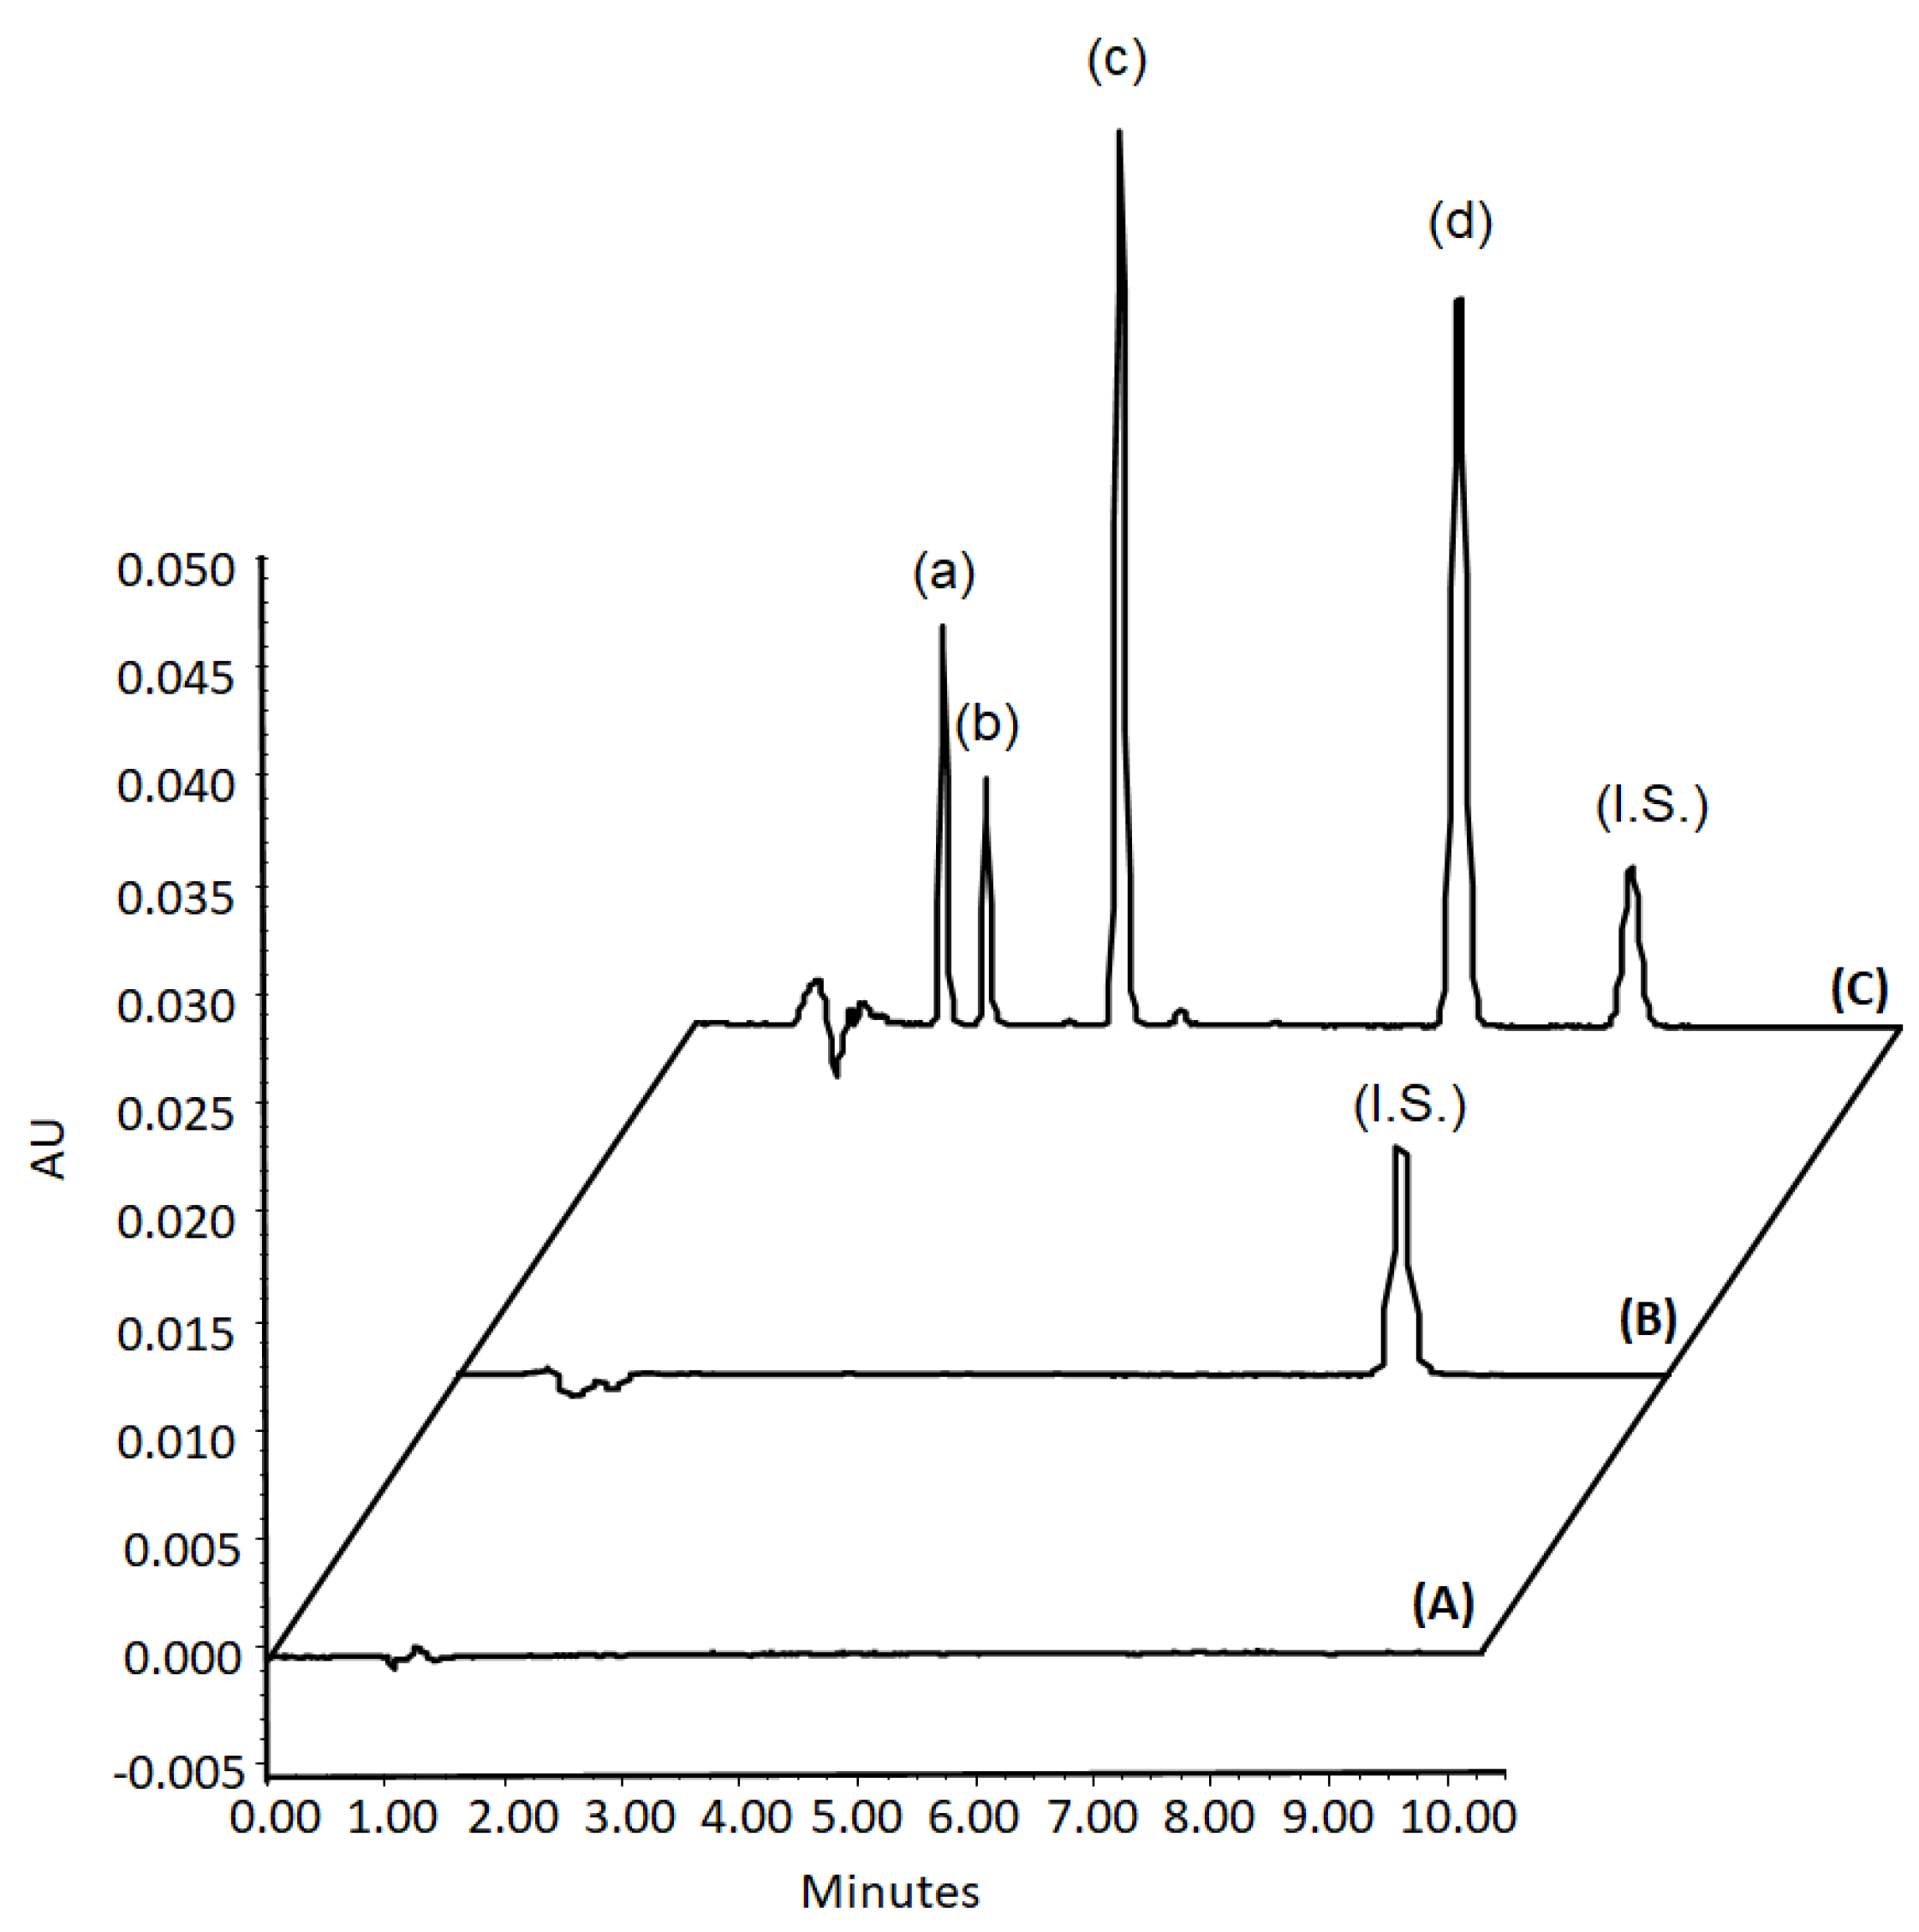
3.3. Method Validation

Before being applied to the analysis of real samples, the method was validated in accordance with the guidelines of the European Medicines Agency (EMA) [32]. The first parameter that was evaluated was the selectivity, i.e., the ability of the method to distinguish among different analytes or interferents present in the matrix. Six lots of blank plasma from different sources were used, extracted, and analyzed to evaluate the selectivity. No signal was found at the retention time of the analytes or the internal standard. Chromatograms are reported in Figure 12.
Limits of detection (LOD) and quantification (LOQ) were evaluated as signal-to-noise ratios. The limits of detection and quantification were 0.0002 µg/mL and 0.001 µg/mL for all the antibiotics, respectively. Accuracy and precision were assessed by the analysis of the lower limit of quantification (LOQ) and the quality control samples (QCs). Five samples per level at a minimum of four concentration levels are covering the calibration curve range: the LOQ, within three times the LOQ (low QC), at around 30–50% of the calibration curve range (medium QC), and at least at 75% of the upper calibration curve range (high QC) were used to evaluate precision and accuracy in the same day (intra-day precision and accuracy) and for five consecutive days (inter-day precision and accuracy). The results reported in Table 1 show that the precision (RSD%) and accuracy (BIAS%) values fall within those set by the guidelines. Linearity was evaluated by constructing a calibration curve for each analyte in the range of 10–0.001 µg/mL. Calibration curves were constructed using a least square linear regression for which the concentration was the independent variable and the ratio of the area of the analyte to that of the internal standard was the dependent variable (response). The statistical analysis of the concentration–response ratios proved in all cases that linear correlation was the best model in the concentration range studied, with a mean correlation coefficient (r2) > 0.9993. Carry-over was evaluated by analyzing an extracted blank after a sample extracted at a concentration equal to the upper concentration limit. No signal was found at the retention times of the analytes and of the internal standard, and this result suggests that no carry-over effect is present within the investigated concentration range. The dilution integrity was evaluated by preparing samples at concentrations higher than the upper limit of quantification, and subsequently diluting the sample with blank matrix to bring the final concentration into the calibration range and carrying out no fewer than five determinations per dilution factor.

3.4. Comparison with Existing Methods in the Literature

Given the amount of antibiotics that are present and used, it is difficult to find methods in the literature that show results on the same analytes as ours. However, it is possible to make at least a partial comparison with methods that employed some of these analytes, excluding those methods which are specific for a single analyte. The comparison is shown in Table 2, and the parameters that have been taken into consideration are the instrumental configuration, the sample preparation technique, the sensitivity expressed as the limit of quantification (LOQ), the run time and the analytes determined.

4. Conclusions

An Fe3O4-rG-Activated carbon-based sorbent was successfully obtained by carbothermal reaction, achieving in situ reduction of graphene and the formation of activated carbon and magnetic particles. The obtained material was used as a sorbent in magnetic dispersive solid phase extraction, obtaining a rapid adsorption of the analytes which, once eluted, were analyzed by UHPLC-PDA. In this work, some of the outstanding advantages of using a carbon-based sorbent are reported, among which it is worth mentioning lower toxicity, scalability, improved absorption capacity, target selectivity and stability in an acidic medium. It is important to underline that it was possible to obtain comparable or even superior results by using abundant and cheap waste raw materials which were made even more high-performing by combining waste with a little amount of graphene. The use of the cellulose support has made it possible to trap graphene and iron oxide in a homogeneous and lasting way, guaranteeing better efficiency of the system over time. This kind of approach can be applied not only to the analysis of antibiotics, but more generally to the adsorption of pollutants using sorbents that have reached the end of their cycle and which could no longer be recycled.

Author Contributions

Conceptualization, V.F. and P.B.; methodology, V.F. and P.B.; software, S.F.; validation, V.F. and P.B.; formal analysis, V.F., P.B., V.C., N.B., S.P. and P.A.; investigation, G.C., S.F., V.F. and P.B.; resources, G.C. and S.F.; data curation, V.F. and P.B.; writing—original draft preparation, V.F. and P.B.; writing—review and editing, S.F. and G.C.; visualization, P.A., G.C. and S.F.; supervision, V.F. and P.B.; project administration, V.F., P.B. and S.F.; funding acquisition, G.C., S.F. and V.F. All authors have read and agreed to the published version of the manuscript.

Funding

P.B. received funding for his post from MUR (Ministry for Universities and Research) under the act PON “Ricerca e Innovazione” 2014–2020, “Linea di Attività: Azioni IV.6 Green—contratti di ricerca su tematiche ‘Green’—D.M. 1062 del 10/08/2021” grant number ‘CUP D55F21003080005’.

Data Availability Statement

The data presented in this study are available on request from the corresponding author.

Acknowledgments

The authors would like to thank Pietro Di Profio, Fontana Antonella, Francesco Stoppa, Gianluigi Rosatelli and Wates Spa for making part of their equipment available (Raman, SEM–EDX, XRD and SDT650).

Conflicts of Interest

The authors declare no conflict of interest.

References

  1. Economides, D.G.; Vlyssides, A.G.; Simonetis, S.I.; Philippakopoulou, T.L. Reuse of effluent from a wastepaper wash-deinking process. Environ. Pollut. 1998, 103, 229–237. [Google Scholar] [CrossRef]
  2. Rafiaani, P.; Kuppens, T.; Van Dael, M.; Azadi, H.; Lebailly, P.; Van Passel, S. Social sustainability assessments in the biobased economy: Towards a systemic approach. Renew. Sustain. Energy Rev. 2017, 82, 1839–1853. [Google Scholar] [CrossRef]
  3. Sionkowska, A. Current research on the blends of natural and synthetic polymers as new biomaterials: Review. Prog. Polym. Sci. 2011, 36, 1254–1276. [Google Scholar] [CrossRef]
  4. Ummartyotin, S.; Manuspiya, H. A critical review on cellulose: From fundamental to an approach on sensor technology. Renew. Sustain. Energy Rev. 2015, 41, 402–412. [Google Scholar] [CrossRef]
  5. Li, M.; Du, H.; Kuai, L.; Huang, K.; Xia, Y.; Geng, B. Scalable Dry Production Process of a Superior 3D Net-Like Car-bon-Based Iron Oxide Anode Material for Lithium-Ion Batteries. Angew. Chem. Int. Ed. 2017, 56, 12649–12653. [Google Scholar] [CrossRef]
  6. Yu, J.; Zhang, D.; Zhu, S.; Chen, P.; Zhu, G.-T.; Jiang, X.; Di, S. Eco-friendly and facile one-step synthesis of a three dimensional net-like magnetic mesoporous carbon derived from wastepaper as a renewable adsorbent. RSC Adv. 2019, 9, 12419–12427. [Google Scholar] [CrossRef]
  7. Khandaker, T.; Hossain, M.S.; Dhar, P.K.; Rahman, S.; Hossain, A.; Ahmed, M.B. Efficacies of Carbon-Based Adsorbents for Carbon Dioxide Capture. Processes 2020, 8, 654. [Google Scholar] [CrossRef]
  8. Madima, N.; Mishra, S.B.; Inamuddin, I.; Mishra, A.K. Carbon-based nanomaterials for remediation of organic and inorganic pollutants from wastewater. A review. Environ. Chem. Lett. 2020, 18, 1169–1191. [Google Scholar] [CrossRef]
  9. Gupta, N.; Kaur, G.; Sharma, V.; Nagraik, R.; Shandilya, M. Increasing the efficiency of reduced graphene oxide obtained via high temperature electrospun calcination process for the electrochemical detection of dopamine. J. Electroanal. Chem. 2022, 904, 115904. [Google Scholar] [CrossRef]
  10. Sun, H.; Feng, J.; Feng, J.; Sun, M.; Feng, Y.; Sun, M. Carbon aerogels derived from waste paper for pipette-tip solid-phase extraction of triazole fungicides in tomato, apple and pear. Food Chem. 2022, 395, 133633. [Google Scholar] [CrossRef] [PubMed]
  11. Shi, C.Y.; Meng, J.R.; Deng, C.H. Enrichment and detection of small molecules using magnetic graphene as an adsorbent and a novel matrix of MALDI-TOFMS. Chem. Commun. 2012, 48, 2418–2420. [Google Scholar] [CrossRef]
  12. Liu, Q.; Shi, J.B.; Sun, J.T.; Wang, T.; Zeng, L.X.; Jiang, G.B. Graphene and graphene oxide sheets supported on silica as versatile and high-performance adsorbents for solid-phase extraction. Angew. Chem. Int. Ed. Engl. 2011, 123, 5913–5917. [Google Scholar] [CrossRef] [PubMed]
  13. Sitko, R.; Zawisza, B.; Malicka, E. Graphene as a new sorbent in analytical chemistry. Trends Analyt. Chem. 2013, 51, 33–43. [Google Scholar] [CrossRef]
  14. Ferrone, V.; Carlucci, M.; Ettorre, V.; Cotellese, R.; Palumbo, P.; Fontana, A.; Siani, G.; Carlucci, G. Dispersive magnetic solid phase extraction exploiting magnetic graphene nanocomposite coupled with UHPLC-PDA for simultaneous determination of NSAIDs in human plasma and urine. J. Pharm. Biomed. Anal. 2018, 161, 280–288. [Google Scholar] [CrossRef]
  15. Ferrone, V.; Todaro, S.; Carlucci, M.; Fontana, A.; Ventrella, A.; Carlucci, G.; Milanetti, E. Optimization by response surface methodology of a dispersive magnetic solid phase extraction exploiting magnetic graphene nanocomposite coupled with UHPLC-PDA for simultaneous determination of new oral anticoagulants (NAOs) in human plasma. J. Pharm. Biomed. Anal. 2020, 179, 112992. [Google Scholar] [CrossRef]
  16. Hong, C.H.; Kim, M.W.; Zhang, W.L.; Moon, I.J.; Choi, H.J. Fabrication of smart magnetite/reduced graphene oxide composite nanoparticles and their magnetic stimuli-response. J. Colloid Interface Sci. 2016, 481, 194–200. [Google Scholar] [CrossRef]
  17. Gupta, J.; Prakash, A.; Jaiswal, M.K.; Agarrwal, A.; Bahadur, D. Superparamagnetic iron oxide-reduced graphene oxide nanohybrid-a vehicle for targeted drug delivery and hyperthermia treatment of cancer. J. Magn. Magn. Mater. 2018, 448, 332–338. [Google Scholar] [CrossRef]
  18. Chandrasekaran, S.; Hur, S.H.; Kim, E.J.; Rajagopalan, B.; Babu, K.F.; Senthilkumar, V.; Chung, J.S.; Choi, W.M.; Kim, Y.S. Highly-ordered maghemite/reduced graphene oxide nanocomposites for high-performance photoelectrochemical water splitting. RSC Adv. 2015, 5, 29159–29166. [Google Scholar] [CrossRef]
  19. Li, N.; Jiang, H.-L.; Wang, X.; Wang, X.; Xu, G.; Zhang, B.; Wang, L.; Zhao, R.-S.; Lin, J.-M. Recent advances in graphene-based magnetic composites for magnetic solid-phase extraction. Trends Anal. Chem. 2018, 102, 60–74. [Google Scholar] [CrossRef]
  20. Feng, Y.; Sun, M.; Sun, M.; Feng, J.; Sun, H.; Feng, J. Extraction performance-structure relationship of polyamidoamine dendrimers on silica for online solid-phase extraction of organic pollutants. J. Chromatogr. A 2022, 1673, 463132. [Google Scholar] [CrossRef]
  21. Zou, S.-J.; Chen, Y.-F.; Zhang, Y.; Wang, X.-F.; You, N.; Fan, H.-T. A hybrid sorbent of α-iron oxide/reduced graphene oxide: Studies for adsorptive removal of tetracycline antibiotics. J. Alloys Compd. 2021, 863, 158475. [Google Scholar] [CrossRef]
  22. Rostamian, R.; Behnejad, H. A comprehensive adsorption study and modeling of antibiotics as a pharmaceutical waste by graphene oxide nanosheets. Ecotoxicol. Environ. Saf. 2018, 147, 117–123. [Google Scholar] [CrossRef] [PubMed]
  23. Wang, X.; Yin, R.; Zeng, L.; Zhu, M. A review of graphene-based nanomaterials for removal of antibiotics from aqueous environments. Environ. Pollut. 2019, 253, 100–110. [Google Scholar] [CrossRef] [PubMed]
  24. Ferrone, V.; Bruni, P.; Canale, V.; Sbrascini, L.; Nobili, F.; Carlucci, G.; Ferrari, S. Simple synthesis of Fe3O4@activated carbon from wastepaper for dispersive magnetic solid-phase extraction of non-steroidal anti-inflammatory drugs and their UHPLC-PDA determination in human plasma. Fibers 2022, 10, 58. [Google Scholar] [CrossRef]
  25. Tong, Y.; Liu, X.; Zhang, L. Green construction of Fe3O4@GC submicrocubes for highly sensitive magnetic dispersive solid-phase extraction of five phthalate esters in beverages and plastic bottles. Food Chem. 2018, 277, 579–585. [Google Scholar] [CrossRef]
  26. Schuepfer, D.B.; Badaczewski, F.; Guerra-Castro, J.M.; Hofmann, D.M.; Heiliger, C.; Smarsly, B.; Klar, P.J. Assessing the structural properties of graphitic and non-graphitic carbons by Raman spectroscopy. Carbon 2020, 161, 359–372. [Google Scholar] [CrossRef]
  27. Yamagishi, T.; Yamauchi, S.; Suzuki, K.; Suzuki, T.; Kurimoto, Y.; Takayama, T.; Sakai, Y. Mössbauer and Raman spectroscopic characterization of iron and carbon in iron-loaded Japanese cypress charcoal. J. Wood Sci. 2020, 66, 1–7. [Google Scholar] [CrossRef]
  28. Sereshti, H.; Bakhtiari, S. Three-dimensional graphene/Fe3O4-based magnetic solid phase extraction coupled with high performance liquid chromatography. RSC Adv. 2016, 6, 75757–75765. [Google Scholar] [CrossRef]
  29. Zappacosta, R.; Di Giulio, M.; Ettorre, V.; Bosco, D.; Hadad, C.; Siani, G.; Di Bartolomeo, S.; Cataldi, A.; Cellini, L.; Fontana, A. Liposome induced exfoliation of graphite to few layer graphene dispersion with antibacterial activity. J. Mater. Chem. B 2015, 3, 6520–6527. [Google Scholar] [CrossRef]
  30. Cong, H.P.; Ren, X.C.; Wang, P.; Yu, S.H. Macroscopic Multifunctional Graphene-Based Hydrogels and Aerogels by a Metal Ion Induced Self-Assembly Process. ACS Nano 2012, 6, 2693–2703. [Google Scholar] [CrossRef]
  31. The European Medicines Agency. Guideline on Bioanalytical Method Validation 2011 EMEA/CHMP/EWP/192217/2009. 2011. Available online: https://www.ema.europa.eu/en/bioanalytical-method-validation-scientific-guideline (accessed on 15 January 2023).
  32. Cohen-Wolkowiez, M.; White, N.R.; Bridges, A.; Beanjamin, D.K., Jr.; Kashube, A.D.M. Development of a liquid chromatography-tandem mass spectrometry assay of six antimicrobials in plasma for pharmacokinetic studies in premature infants. J. Chromatogr. B 2011, 879, 3497–3506. [Google Scholar] [CrossRef] [PubMed]
  33. Ferrone, V.; Cotellese, R.; Di Marco, L.; Bacchi, S.; Carlucci, M.; Cichella, A.; Raimondi, P.; Carlucci, G. Meropenem, levofloxacin and linezolid in human plasma of critical care patients: A fast semi-automated micro-extraction by packed sorbent UHPLC-PDA method for their simultaneous determination. J. Pharm. Biomed. Anal. 2017, 140, 266–273. [Google Scholar] [CrossRef] [PubMed]
  34. Cairoli, S.; Simeoli, R.; Tarchi, M.; Dionisi, M.; Vitale, A.; Perioli, L.; Dionisi-Vici, C.; Goffredo, B.M. A new HPLC–DAD method for contemporary quantificationof 10 antibiotics for therapeutic drug monitoring of critically ill pediatric patients. Biomed. Chromatogr. 2020, 34, e4880. [Google Scholar] [CrossRef] [PubMed]
  35. Xie, F.; Liu, L.; Wang, Y.; Peng, Y.; Li, S. An UPLC-PDA assay for simultaneous determination of seven antibiotics in human plasma. J. Pharm. Biomed. Anal. 2022, 210, 114558. [Google Scholar] [CrossRef] [PubMed]
  36. Rao, Z.; Dang, Z.-L.; Bin Li, B.; Zhu, L.; Qin, H.-Y.; Wu, X.-A.; Wei, Y.-H. Determination of Total and Unbound Meropenem, Imipenem/Cilastatin, and Cefoperazone/Sulbactam in Human Plasma: Application for Therapeutic Drug Monitoring in Critically Ill Patients. Ther. Drug Monit. 2020, 42, 578–587. [Google Scholar] [CrossRef] [PubMed]
Figure 1. Schematic representation of the work steps.
Separations 10 00115 g001
Figure 2. UV–Vis spectra of 30 µg/mL GO suspension in water.
Separations 10 00115 g002
Figure 3. TG and DTA curves in N2 atmosphere.
Separations 10 00115 g003
Figure 4. SEM images after grinding in bead milling. (A) represents the sample made with the least amount of GO, (B) represents the intermediate one and (C) represents the one with the highest concentration.
Separations 10 00115 g004
Figure 5. EDX images of prepared sorbent samples from low (A) to high (C) GO content ((A) represents the sample made with the least amount of GO, (B) represents the intermediate one and (C) represents the one with the highest concentration).
Separations 10 00115 g005
Figure 6. XRD patterns of all samples from low (red curve) to high (orange curve) GO content.
Separations 10 00115 g006
Figure 7. Raman spectra of the prepared Fe3O4-rG-activated carbon sorbents. Color code A: Fe3O4-rG-activated carbon (375 mg), B: Fe3O4-rG-activated carbon (250 mg), C: Fe3O4-rG-activated carbon (125 mg).
Separations 10 00115 g007
Figure 8. Evaluation of the adsorption capacity of the three prepared sorbents as a function of recovery.
Separations 10 00115 g008
Figure 9. Effect of adsorption time on recovery.
Separations 10 00115 g009
Figure 10. Effect of sample pH on the recovery.
Separations 10 00115 g010
Figure 11. Effect of desorption time on the recovery.
Separations 10 00115 g011
Figure 12. Chromatograms obtained from the analysis of a blank sample extracted (A), blank samples spiked with the internal standard extracted (B) and blank plasma spiked with the analytes and the I.S. extracted (C), (a) metronidazole, (b) meropenem, (c) levofloxacin and (d) cefoperazone.
Separations 10 00115 g012
Table 1. Intra-day and inter-day values of the proposed method.
Analyte Amount Added (µg mL–1)Intra-Day Inter-Day
Accuracy
(BIAS%)
Precision
(RSD%)
Accuracy
(BIAS%)
Precision
(RSD%)
Metronidazole0.00103.132.811.795.27
0.0025−4.014.27−4.636.98
0.50 3.123.883.886.53
10.0 5.035.056.167.90
Meropenem0.0010−2.763.50−3.146.08
0.00250.432.230.674.60
0.50 0.762.431.064.84
10.0 −1.542.75−1.685.21
Levofloxacin0.00102.743.653.436.26
0.00250.892.511.224.93
0.50 −0.402.05−0.324.39
10.0 −0.181.92−0.064.24
Cefoperazone0.00102.423.453.046.03
0.0025−3.123.72−3.576.34
0.50 −4.864.79−5.657.59
10.0 −0.822.31−0.824.69
Table 2. Comparison with methods present in the literature for the quantification of antibiotics in human plasma.
AnalytesSample
Preparation
InstrumentationRun Time
(min)
LOQ (µg/mL)Ref
MET, MER,P.P.1HPLC-MS/MS50.01[32]
MER, LEVMEPS 2UHPLC-PDA50.01[33]
MER, LEVP.P.HPLC-PDA201[34]
MER, CEFP.P.UHPLC-PDA50.3–0.6[35]
MER-CEFP.P.HPLC-MS50.05[36]
MET, MER, LEV, CEFd-MSPEUHPLC-PDA100.001This method
1 Protein precipitation; 2 Micro extraction with packed sorbent.
Disclaimer/Publisher’s Note: The statements, opinions and data contained in all publications are solely those of the individual author(s) and contributor(s) and not of MDPI and/or the editor(s). MDPI and/or the editor(s) disclaim responsibility for any injury to people or property resulting from any ideas, methods, instructions or products referred to in the content.

