Article

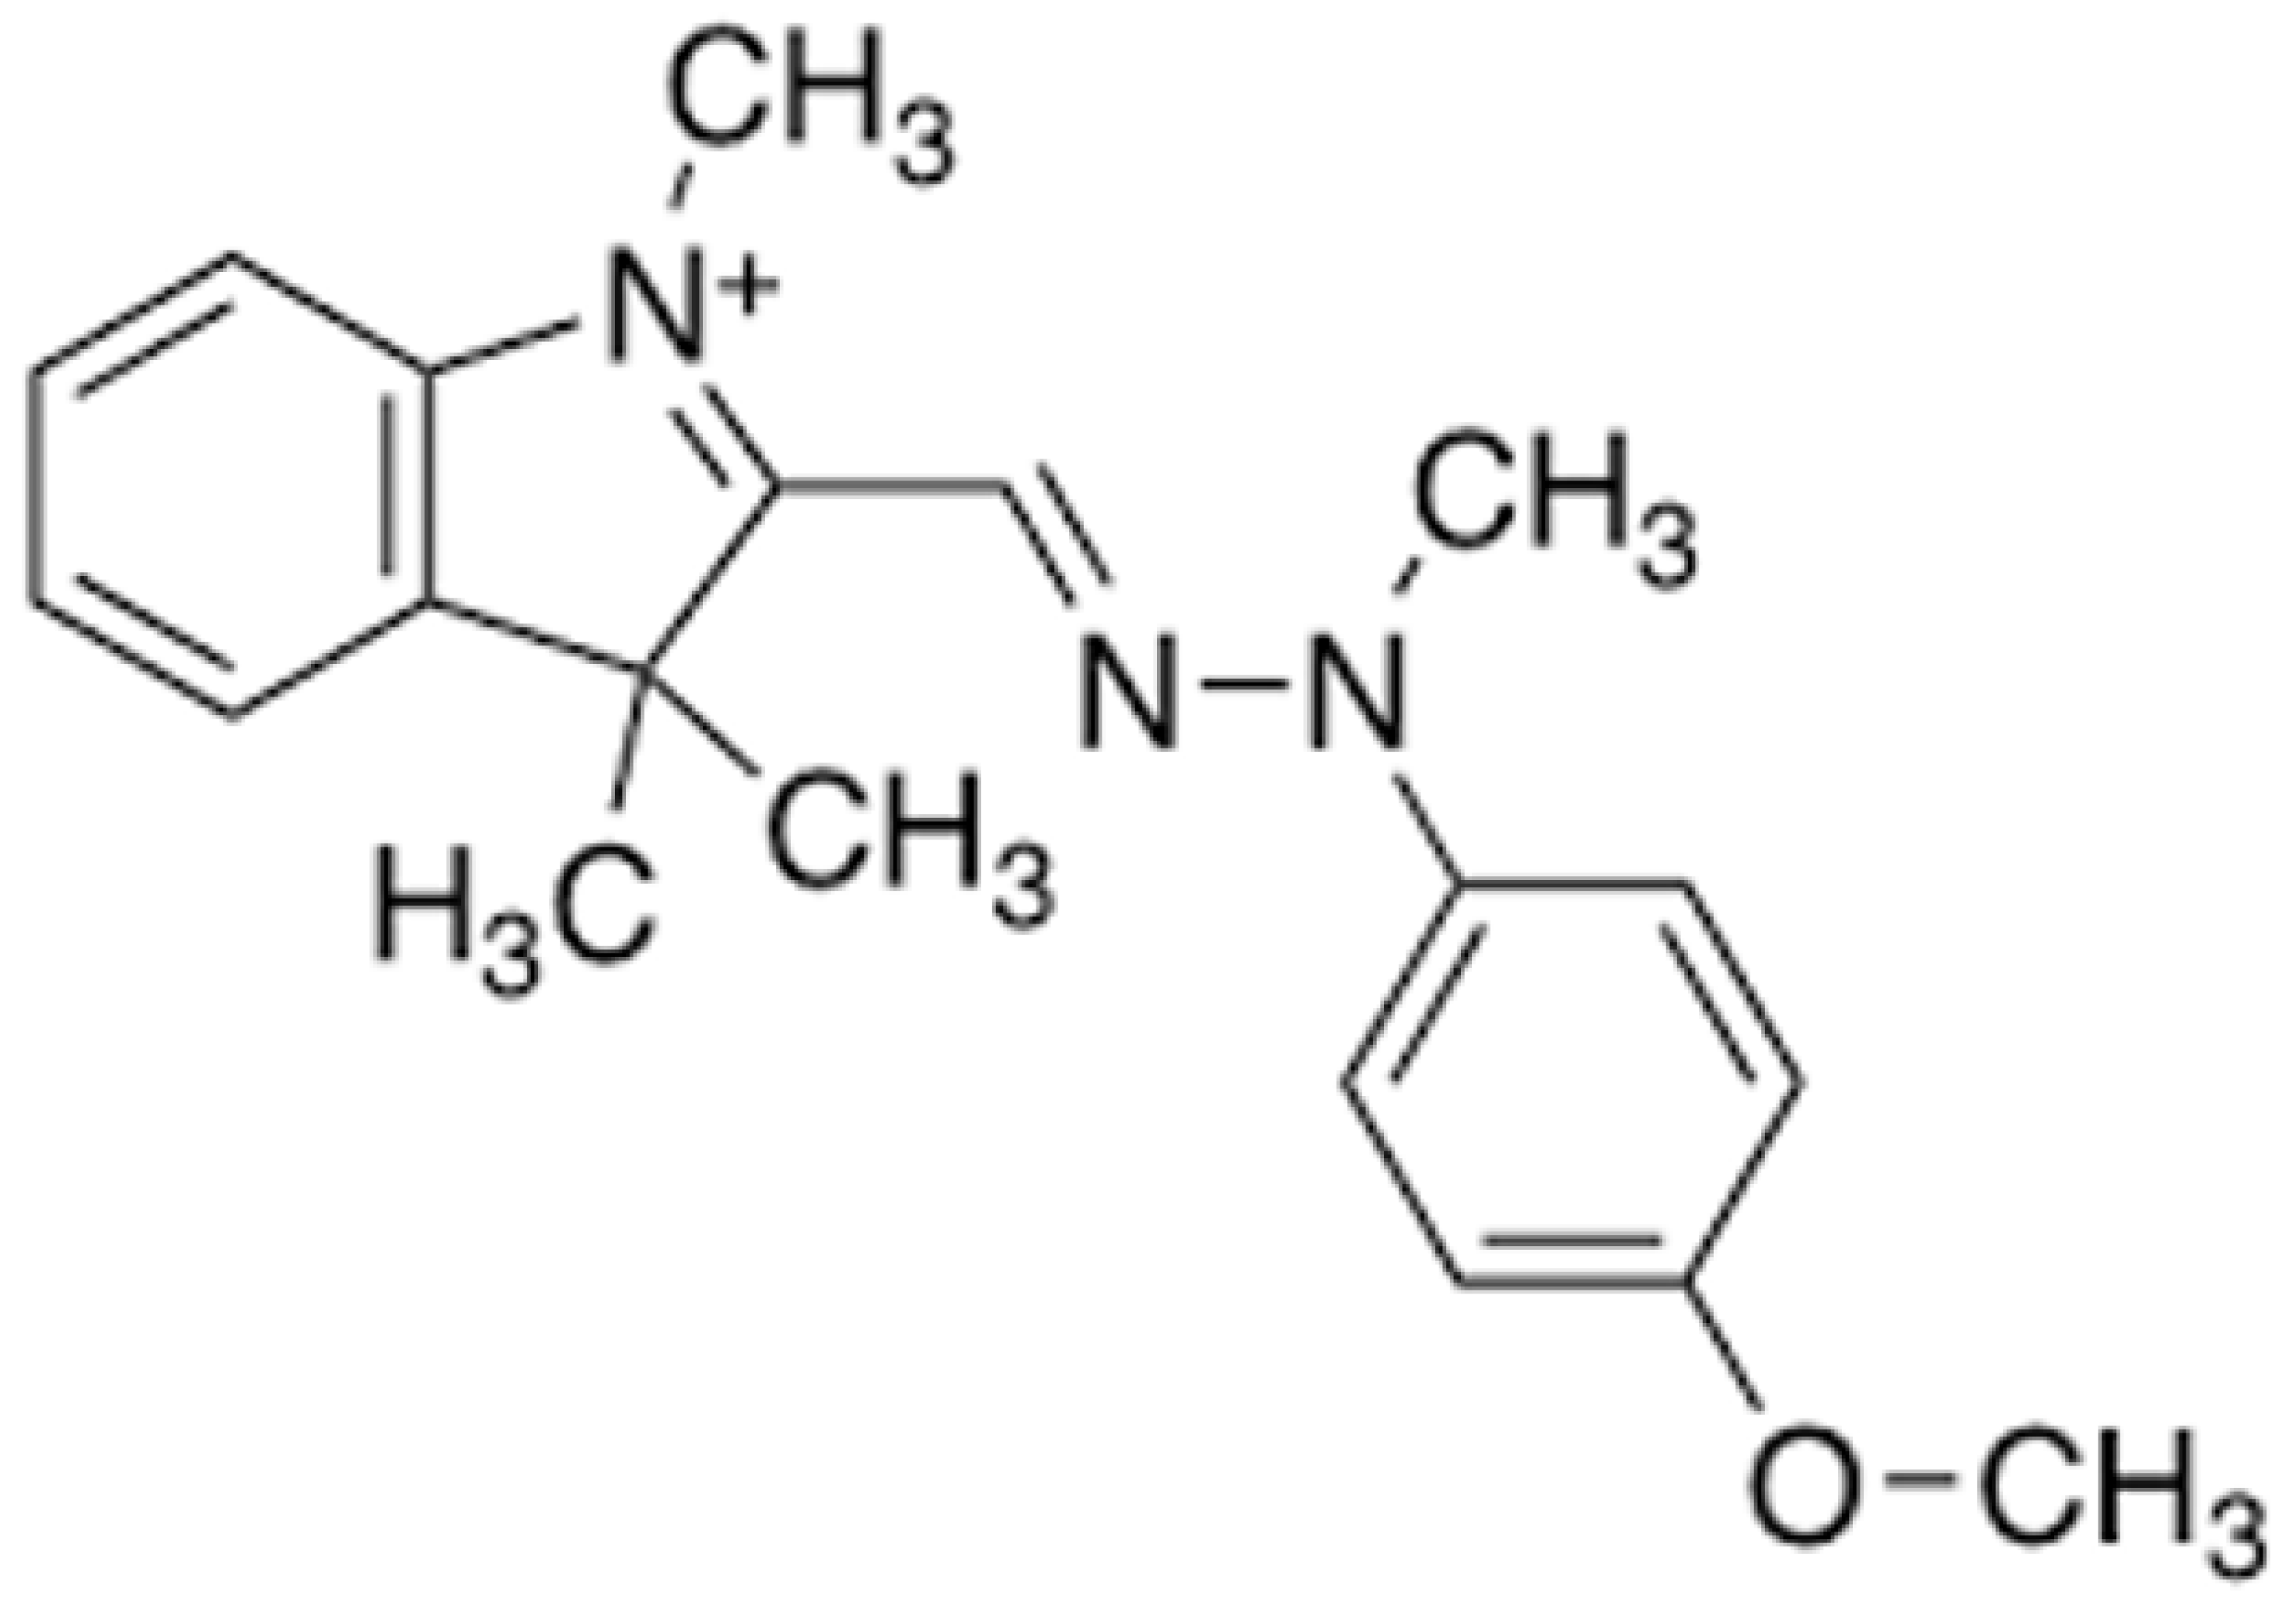
Adsorption, Modeling, Thermodynamic, and Kinetic Studies of Acteray Golden Removal from Polluted Water Using Sindh Clay and Quartz as Low-Cost Adsorbents

1
Nano and Biomaterials Lab, Department of Chemistry, University of Agriculture, Faisalabad 38040, Pakistan
2
Institute of Nanoscience and Nanotechnology (ION2), Universiti Putra Malaysia, Serdang 43400, Selangor, Malaysia
3
Center of Excellence in Catalysis for Bioenergy and Renewable Chemicals (CBRC), Faculty of Science, Chulalongkorn University, Pathumwan, Bangkok 10330, Thailand
4
Department of Chemistry, The University of Lahore, Lahore 53700, Pakistan
5
Chemistry Department, College of Science, King Saud University, Riyadh 1145, Saudi Arabia
6
Department of Chemical Engineering, Pohang University of Science and Technology (POSTECH), Gyeongbuk, Pohang 37673, Republic of Korea
*
Author to whom correspondence should be addressed.
Separations 2023, 10(10), 538; https://doi.org/10.3390/separations10100538
Submission received: 29 June 2023 / Revised: 3 October 2023 / Accepted: 9 October 2023 / Published: 11 October 2023
(This article belongs to the Special Issue Removal of Emerging Pollutants and Environmental Analysis)

Abstract

:
Due to growing environmental awareness and demands, many efforts were implemented for the transformation of waste materials into highly efficient adsorption capacity materials. In this work, efforts were made to convert the Sindh clay and quartz into an efficient composite for dye removal from polluted water. The synthesized composites were characterized using FT-IR, BET, SEM, and XRD. The synthesized composite showed a crystalline structure with specific characteristics, including a specific surface area of 7.20 m2/g and a pore diameter of 3.27 nm. The formation of iron cyanide hydrate (2030 cm−1) and iron oxides (418 cm−1) were depicted through Fourier transform infrared spectroscopy analysis. The micrographs obtained show that the unmodified quartz sample has a flattened and elongated shape compared to the modified quartz sample, which has aggregated and coarse morphology. The effects of several factors, such as temperature, contact time, and initial dye concentration, were studied. Kinetic models were also applied to determine the probable route of the adsorption process. For adsorption equilibrium analysis, the Dubinin–Radushkevich, Langmuir, Freundlich, Temkin, and Harkin–Juraisotherm models were employed. The Freundlich isotherm model and pseudo-first-order model best described the adsorption of dyes onto the clay composites. R2 values were close to 1 or more than 0.9, showing which equation fits the experimental data. The produced composite demonstrated good reusability, maintaining over 90% of the adsorption capacity after five reaction cycles without the need for reactivation.

1. Introduction

Over the last few decades, the globe has seen the negative results of unrestrained development of many human activities, such as manufacturing, agriculture, transportation, and urbanization. Increased quality of life and higher consumer demand have exacerbated pollution of the atmosphere and soil due to toxic waste disposal [1,2,3,4]. Emerging pollutants include a broad range of man-made products (such as pesticides, beauty products, personal and domestic care products, and medications, among others) that are used globally and are essential for modern society. It has been demonstrated that between 1930 and 2020, global anthropogenic chemical output rose from 1 to 500 million tons per year. The global outflow of wastewater into rivers, lakes, and oceans exceeds 500 billion m3/year, contaminating 5500 billion m3 of water every year. The water quality is suffering balanced corrosion due to countless heavy metals (generally cations) and dyes produced in the atmosphere from industrial fabrication activities, which have been established to be extremely poisonous [5]. Although synthetic dyes are carcinogenic and toxic, their discharge without adequate treatment might have a negative impact on soil, wildlife, and receiving water sources [4,6,7,8,9]. As per the World Bank, industrial wastewater comprises around 17–20% of sewage contamination. Minerals of clay are hydrous aluminum silicates with different concentrations of Mg, Fe, alkali, and alkaline metals. Clay minerals are used in animal feeds, pharmaceuticals, wastewater treatments, paints, and food preparations. Quartz is a hard and crystalline mineral with the highest percentage purity of 99.9% and is composed of chains of silica. In quartz, the atoms are cross-linked in a bed of tetrahedrons of silicon and oxygen, giving an overall formula of SiO2.
There are several types of dyes developed for the dyeing of acrylics, wool, nylon, leather dyeing paper, food, cosmetics, and silk. Some sustainable chemical and physical techniques that comprise photolysis and photocatalytic processes have been developed for the treatment of wastewater. Wastewater treatment is a practice used to eliminate contaminants from wastewater or liquid waste and transform it into sewage that can be resumed to the water cycle with adequate influence on the surroundings or recycled for numerous purposes. Contaminants in wastewater are separated, transformed, or shattered down throughout the handling process. Wastewater from fabric staining industries is a substantial source of environmental pollution [10].
A variety of approaches, including flocculation and coagulation, ozonation or oxidation, photocatalytic degradation, micellar-enhanced ultrafiltration, membrane separation, electrochemical degradation, and adsorption, have been used for water treatment [11,12]. Among all techniques, adsorption has popularity over traditional techniques because of less investment, flexibility of design, insensitivity to lethal pollutants, and ease of operation. Earlier studies have reported a variety of adsorbents, such as ion-exchange resins, clays, activated carbon, and zeolites. The adsorption using activated carbon is known as an effective approach, but natural minerals are cheap and easily available, e.g., quartz; however, very few studies have been conducted to test its efficiency. Adsorption is a common industrial separation process used to purify effluent media. It is a liquid phase process that allows a solid substance to selectively transmit mass by removing dissolved components from an aqueous solution, bringing the dissolved solute to the surface. Adsorption is particularly useful in the textile, leather, dyeing, plastics, food, cosmetics, and paper sectors, where water recovery is critical [13]. Clays are hydrous inorganic materials that are widely characterized as “minerals that constitute the colloid portion of soils, fossils, rocks, and water and may be made of combinations of fine-grained clay particles and clay-sized grains of other minerals in the rock, carbonate, and metal oxides”. Typically, these clay materials are used in their original state without being chemically altered [14].
Recently, multi-layered hydroxides, metal–organic frameworks (MOFs), and nanomaterials have gained attention owing to their applications for the removal of pollutants from wastewater [15,16,17,18]. MOFs can be used as an efficient adsorbent for the adsorption of toxic dyes from water due to favorable surface area and porosity, which allows for the distribution of active components on the framework [16]. For example, ZIF-8@ZIF-67 was produced as an adsorbent for the adsorption of organic dyes that successfully absorbed the maximum adsorption efficiency of 143.26 mg/g and was reusable for up to four renewal cycles [15].
A tri-metallic layered double hydroxide (NiZnAl-LDHs) adsorbent was derived for the removal of rhodamine B (Rh-B) and methyl orange (MO). The NiZnAl-LDH showed the removal of Rh-B and MO at 210 min contact time with an adsorption efficiency of 38.03 mg/g for Rh-B and 32.67 mg/g for that of MO [16].
Bentonite–cobalt doped bismuth ferrite nanoparticles (BFO NPs) were derived using a cost-effective solvothermal process for the removal of methyl orange (MO) [17]. The results showed that the synthesized BFO NPs depicted up to 92% MO were degraded in 60 min under solar irradiation [17]. In another example, titanium-doped calcium bismuth ferrites were successfully synthesized using the co-precipitation method and used as photocatalysts to degrade the moxifloxacin antibiotic [18]. The titanium-doped calcium bismuth ferrites nanoparticles showed 89.16% moxifloxacin degradation after irradiation using a catalyst dosage of 1.5 g/L for 60 min. In addition, the synthesized adsorbent was able to remove the moxifloxacin antibiotic for up to four cycles in yields greater than 70% [18].
Several environmental parameters, such as the types and quantities of ions, ionic strength, solution pH, temperature, and dye class, all influence the adsorption process. Temperature affects the dynamic adsorption of metal ions, the stability, and the alteration of surface complexation structures of diverse metal precipitates. Natural raw and modified clays have demonstrated promising results as adsorbents for the removal of different metals, chemical compounds, and coloring agents [14]. Unfortunately, a significant portion of this waste is discarded, causing air, water, or soil pollution that threatens ecological balance. There is a lack of research addressing waste utilization of silica and clay for adsorption studies. Therefore, the primary purpose of this research was to investigate the composite formation of silica and clay for the effective utilization of detailed adsorption mechanisms and processes. The synthesized composite was characterized using FT-IR, BET, SEM, and XRD. Langmuir, Freundlich, Dubinin–Radushkevich, Temkin, and Harkin–Juraisotherm models were employed for the detailed adsorption equilibrium analysis. Pseudo-first and second-order models were applied to evaluate the adsorption of dyes using the produced composites.

2. Materials and Methods

2.1. Materials

Acteray Golden 741 dye (shade) was purchased from the Local Dye Market, Faisalabad, Pakistan and structure of the dye has been presented in Figure 1. It was used without any modification. Sindh clay (500 g) and quartz (500 g) were also collected from the local industry of Faisalabad city. Sindh clay contained SiO2 (44.22%), Al2O3 (32.11%), Fe2O3 (0.39%) and TiO2 (0.91%). All chemical substances used in this work were of analytical quality (Sigma Aldrich, St. Louis, MI, USA), comprising 0.1 M dil. HCl solutions, Nitric acid, 0.1 M NaOH, and a pH 7 buffer solution. To produce the necessary solutions, deionized water was utilized.

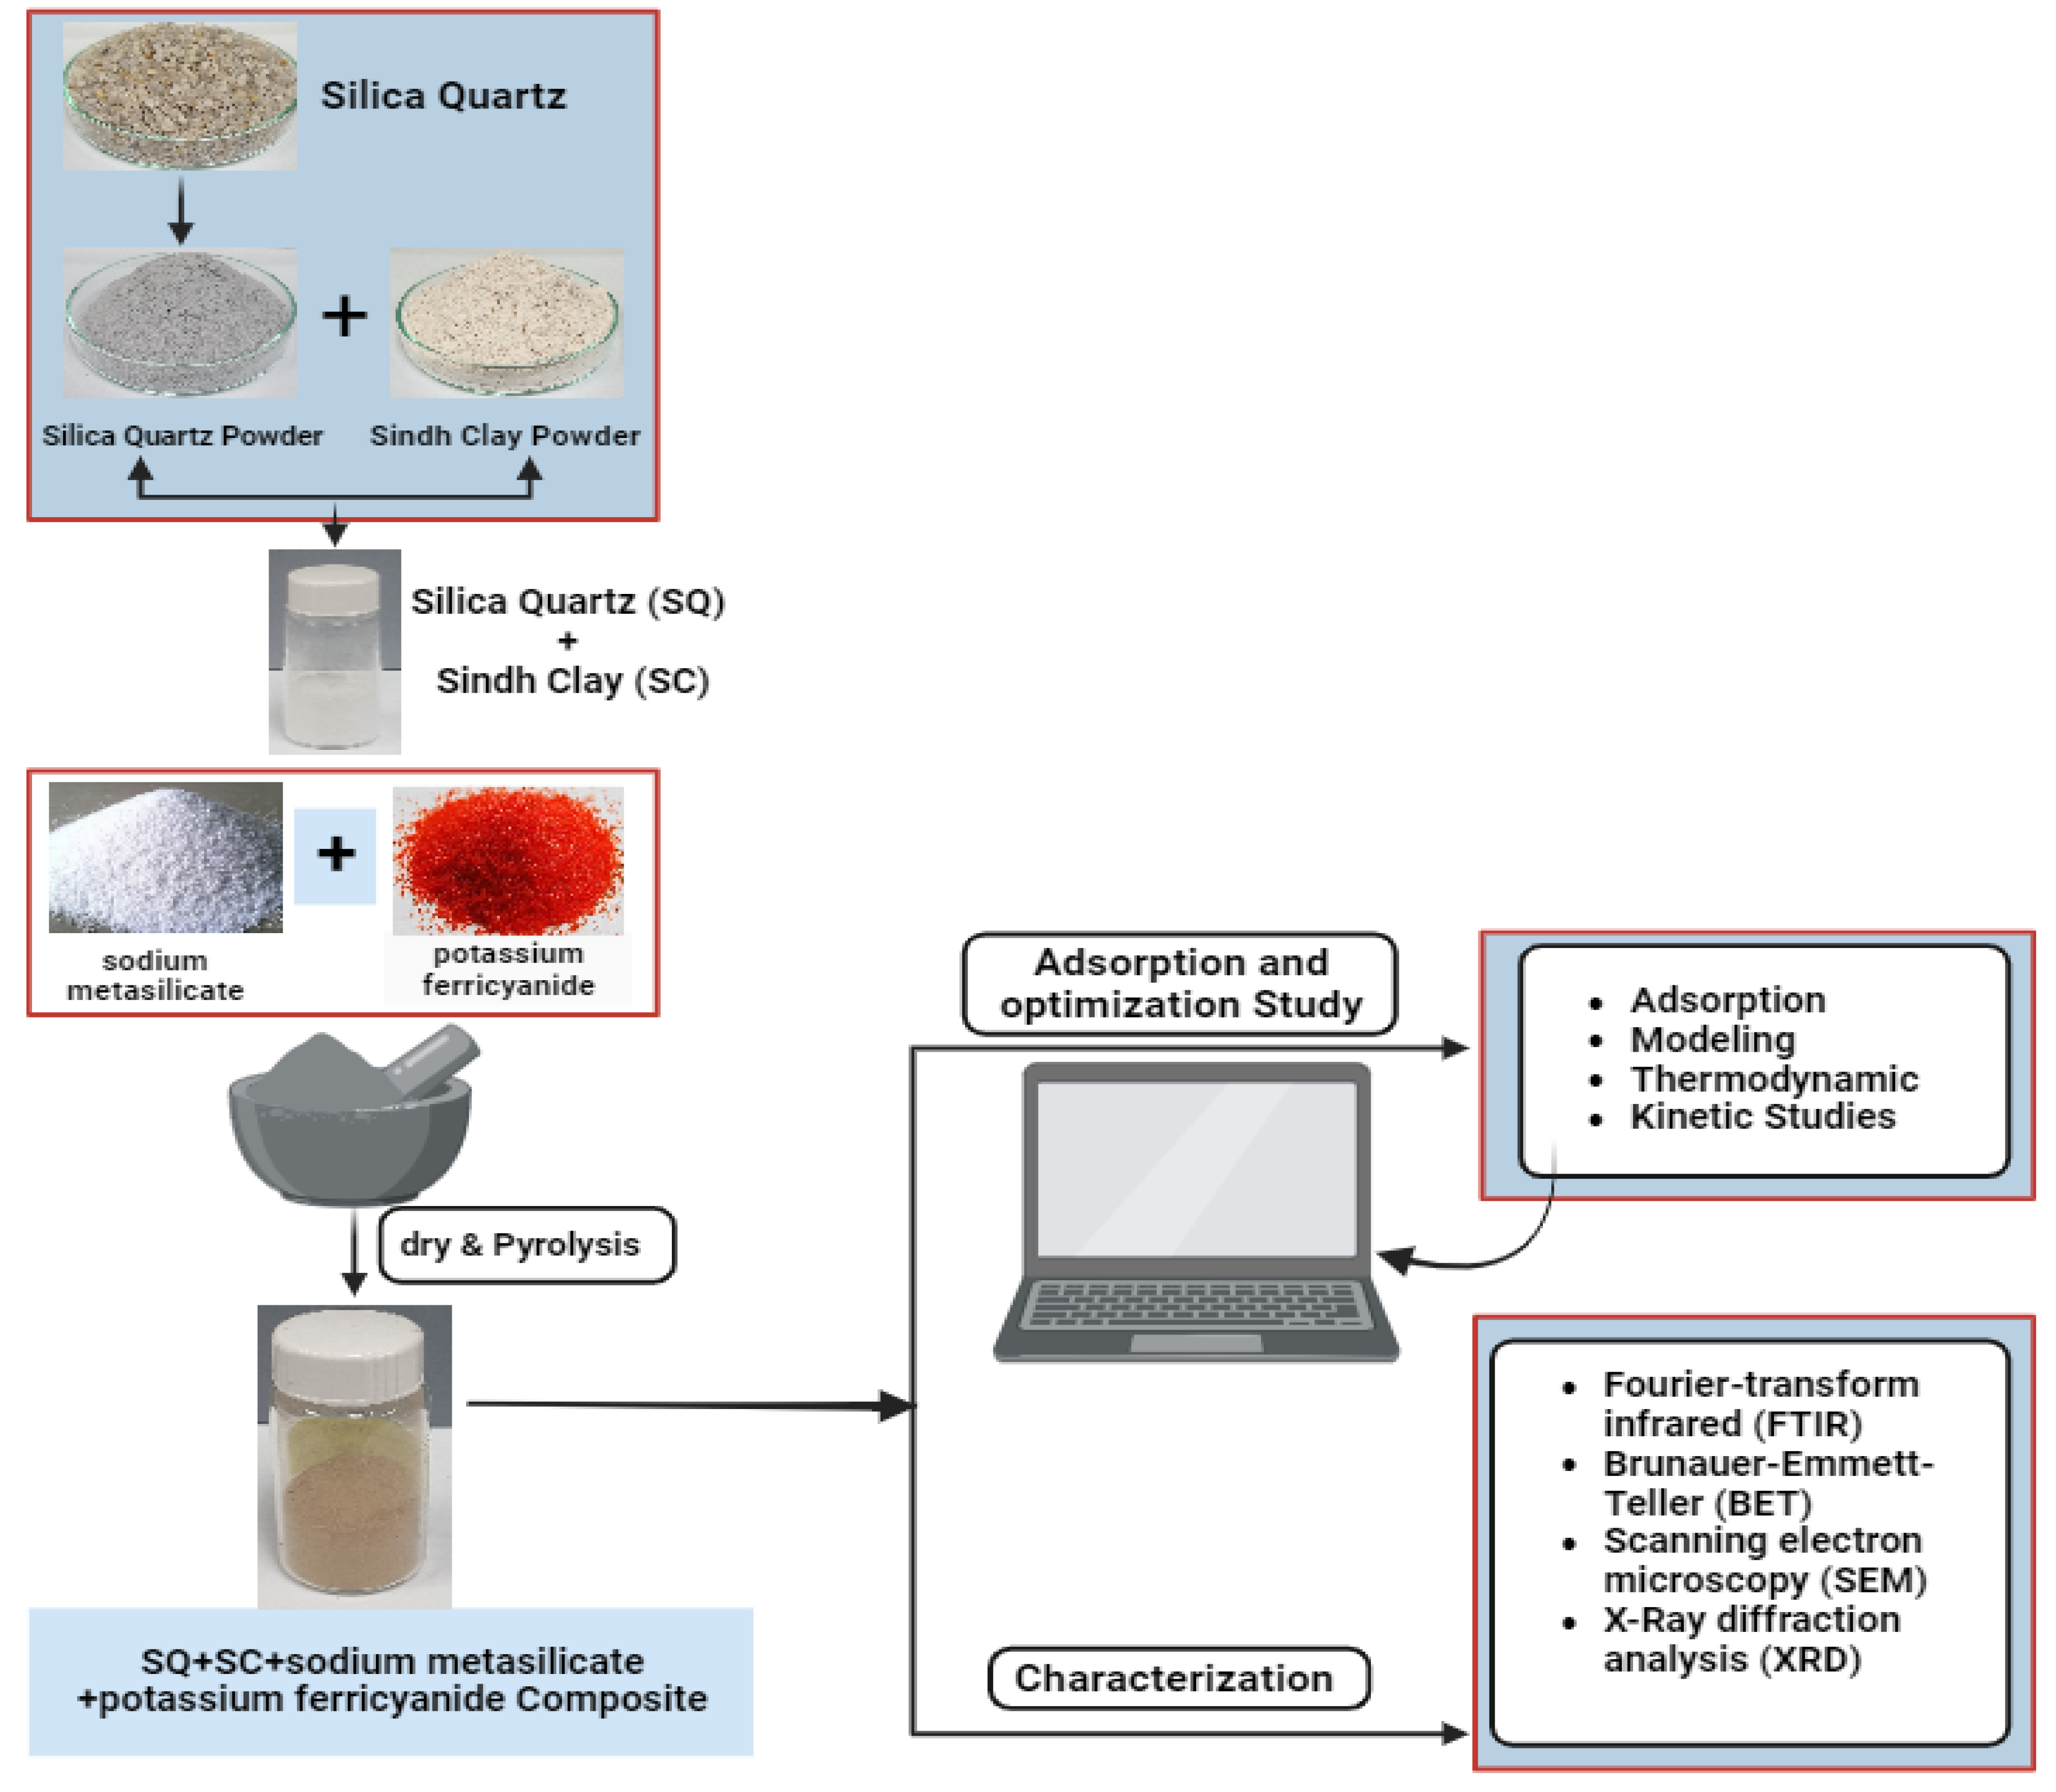
2.2. Preparation of Sample and Composite Materials

Sindh clay and quartz were used as starting materials to form composites. Quartz and clay stones were both crushed and then sieved to obtain the desired particle size, further prepared by performing a filtration mechanism. Filtration assisted in the purification of the clay by eliminating non-clay elements, such as minerals, insoluble salts, and non-suspended clay particles. After filtering, the refined clay filtrates were dried at room temperature in the form of pastes. Dried mixed powder of clay and quartz was utilized in the synthesis of composite material. It was prepared by mixing sodium metasilicate and potassium ferricyanide with mixed clay and quartz samples to obtain a thick and fine paste. Pastes of both samples were dried at 70 °C in the oven, and later, the dried sample was calcined at 400 °C for 3 h. The details are presented in the flow chart in Figure 2 for better understanding.

2.3. Adsorption Study

The adsorption process was performed by agitating the composites with the dye solution by using an orbital shaker at 120 rpm speed for 3 h. Dye solution of Acteray Golden 741 with a molar concentration of 25 ppm and at a certain pH of the dye solutions (maintained using 0.1 M HCl and 0.1 M NaOH solutions). The selected composite dose was added to every dye solution.
The adsorption capacity (qe) of synthesized composite as presented in Figure 2, its adsorption capacity at time t (qt), and linear equations of different kinetic models like Langmuir, Freundlich, Dubinin–Radushkevich, Temkin, and Harkin–Jura kinetic models were appraised. The kinetic models (pseudo-first-order and pseudo-second order) were applied to determine R2.

2.4. Optimization Experiments

2.4.1. Optimization of Initial Dye Concentration

The effect of initial dye concentration was examined by varying the concentration of relevant dye from 5 to 50 mg/L by maintaining the adsorbent dose, contact time, and temperature constant. While using the orbital shaking mechanism, the shaking speed should be 120 rpm, and the contact time should be 3 h at least. To investigate the relationship between dye concentration and adsorbent, different types of isotherm models were applied.

2.4.2. Optimization of Contact Time

Solution of 741 golden acteray dye with adsorbent doses were agitated for diverse time intervals (15, 30, 60, 120, 240 min). The adsorbent doses were kept constant (0.005 g) in all dye solutions. Kinetic data was inspected by means of pseudo first and second-order kinetic models [19].

2.4.3. Optimization of Concentration

The solution of dye, namely acteray dye, was prepared at the concentration of 500 ppm, and then dilutions of 5, 10, 15, 25, 50, 75, and 100 ppm were prepared from the stock solution. Test tubes containing 0.01 gm of adsorbent were filled with dye solution up to 10 mL and then placed on an orbital shaker with 120 rpm for at least 2 h. After that, all solutions were filtered with the help of a syringe filter, and their absorptions were filtered on a UV-visible spectrophotometer.

2.5. Estimation of Absorbance and Spectrophotometric Analysis

To determine the wavelength of Acteray dye, a 25 ppm solution of dye was prepared. Then, this dye solution was run on a 721 D UV Visible spectrophotometer and scanned over a wavelength range of 335 nm to 1000 nm to determine the wavelength at which the dye shows maximum absorption.
The absorbance of the dye was measured using a 721 D UV-visible spectrophotometer. All these values were measured before and after shaking to observe the effect of adsorbents on the dye. The dye solution was filtered using a syringe filter to remove the adsorbent contained in the solutions. Dye solutions are put in cuvettes and scanned with a spectrophotometer to determine their absorbance reading at their λ max.

2.6. Characterization of Adsorbents

Fourier transform infrared spectroscopy (FTIR) was used to determine the functional group management alongside a resolution of 4 cm−1 and operating in the 400–4000 cm−1 range using the Perkin–Elmer Spectrum. A scanning electron microscope (SEM) was used to study the surface morphology of nanocomposites. In SEM, a focused beam of electrons is used to demonstrate the images of clay or marble time. X-ray diffraction (XRD) was used to evaluate the crystallite size and structure on a Shimadzu-6000 machine (Shimadzu Corporation, Tokyo, Japan), with a scanning range and rate of 4 min−1 of theta (θ) of 20 to 80. The Brunauer–Emmett–Teller (BET) technique was used to measure the specific surface area using Thermo Fisher Scientific (Sorptomatic 1990 series). The pore size distribution was estimated using the Barrette–Joyner–Halenda (BJH) method.

3. Results and Discussion

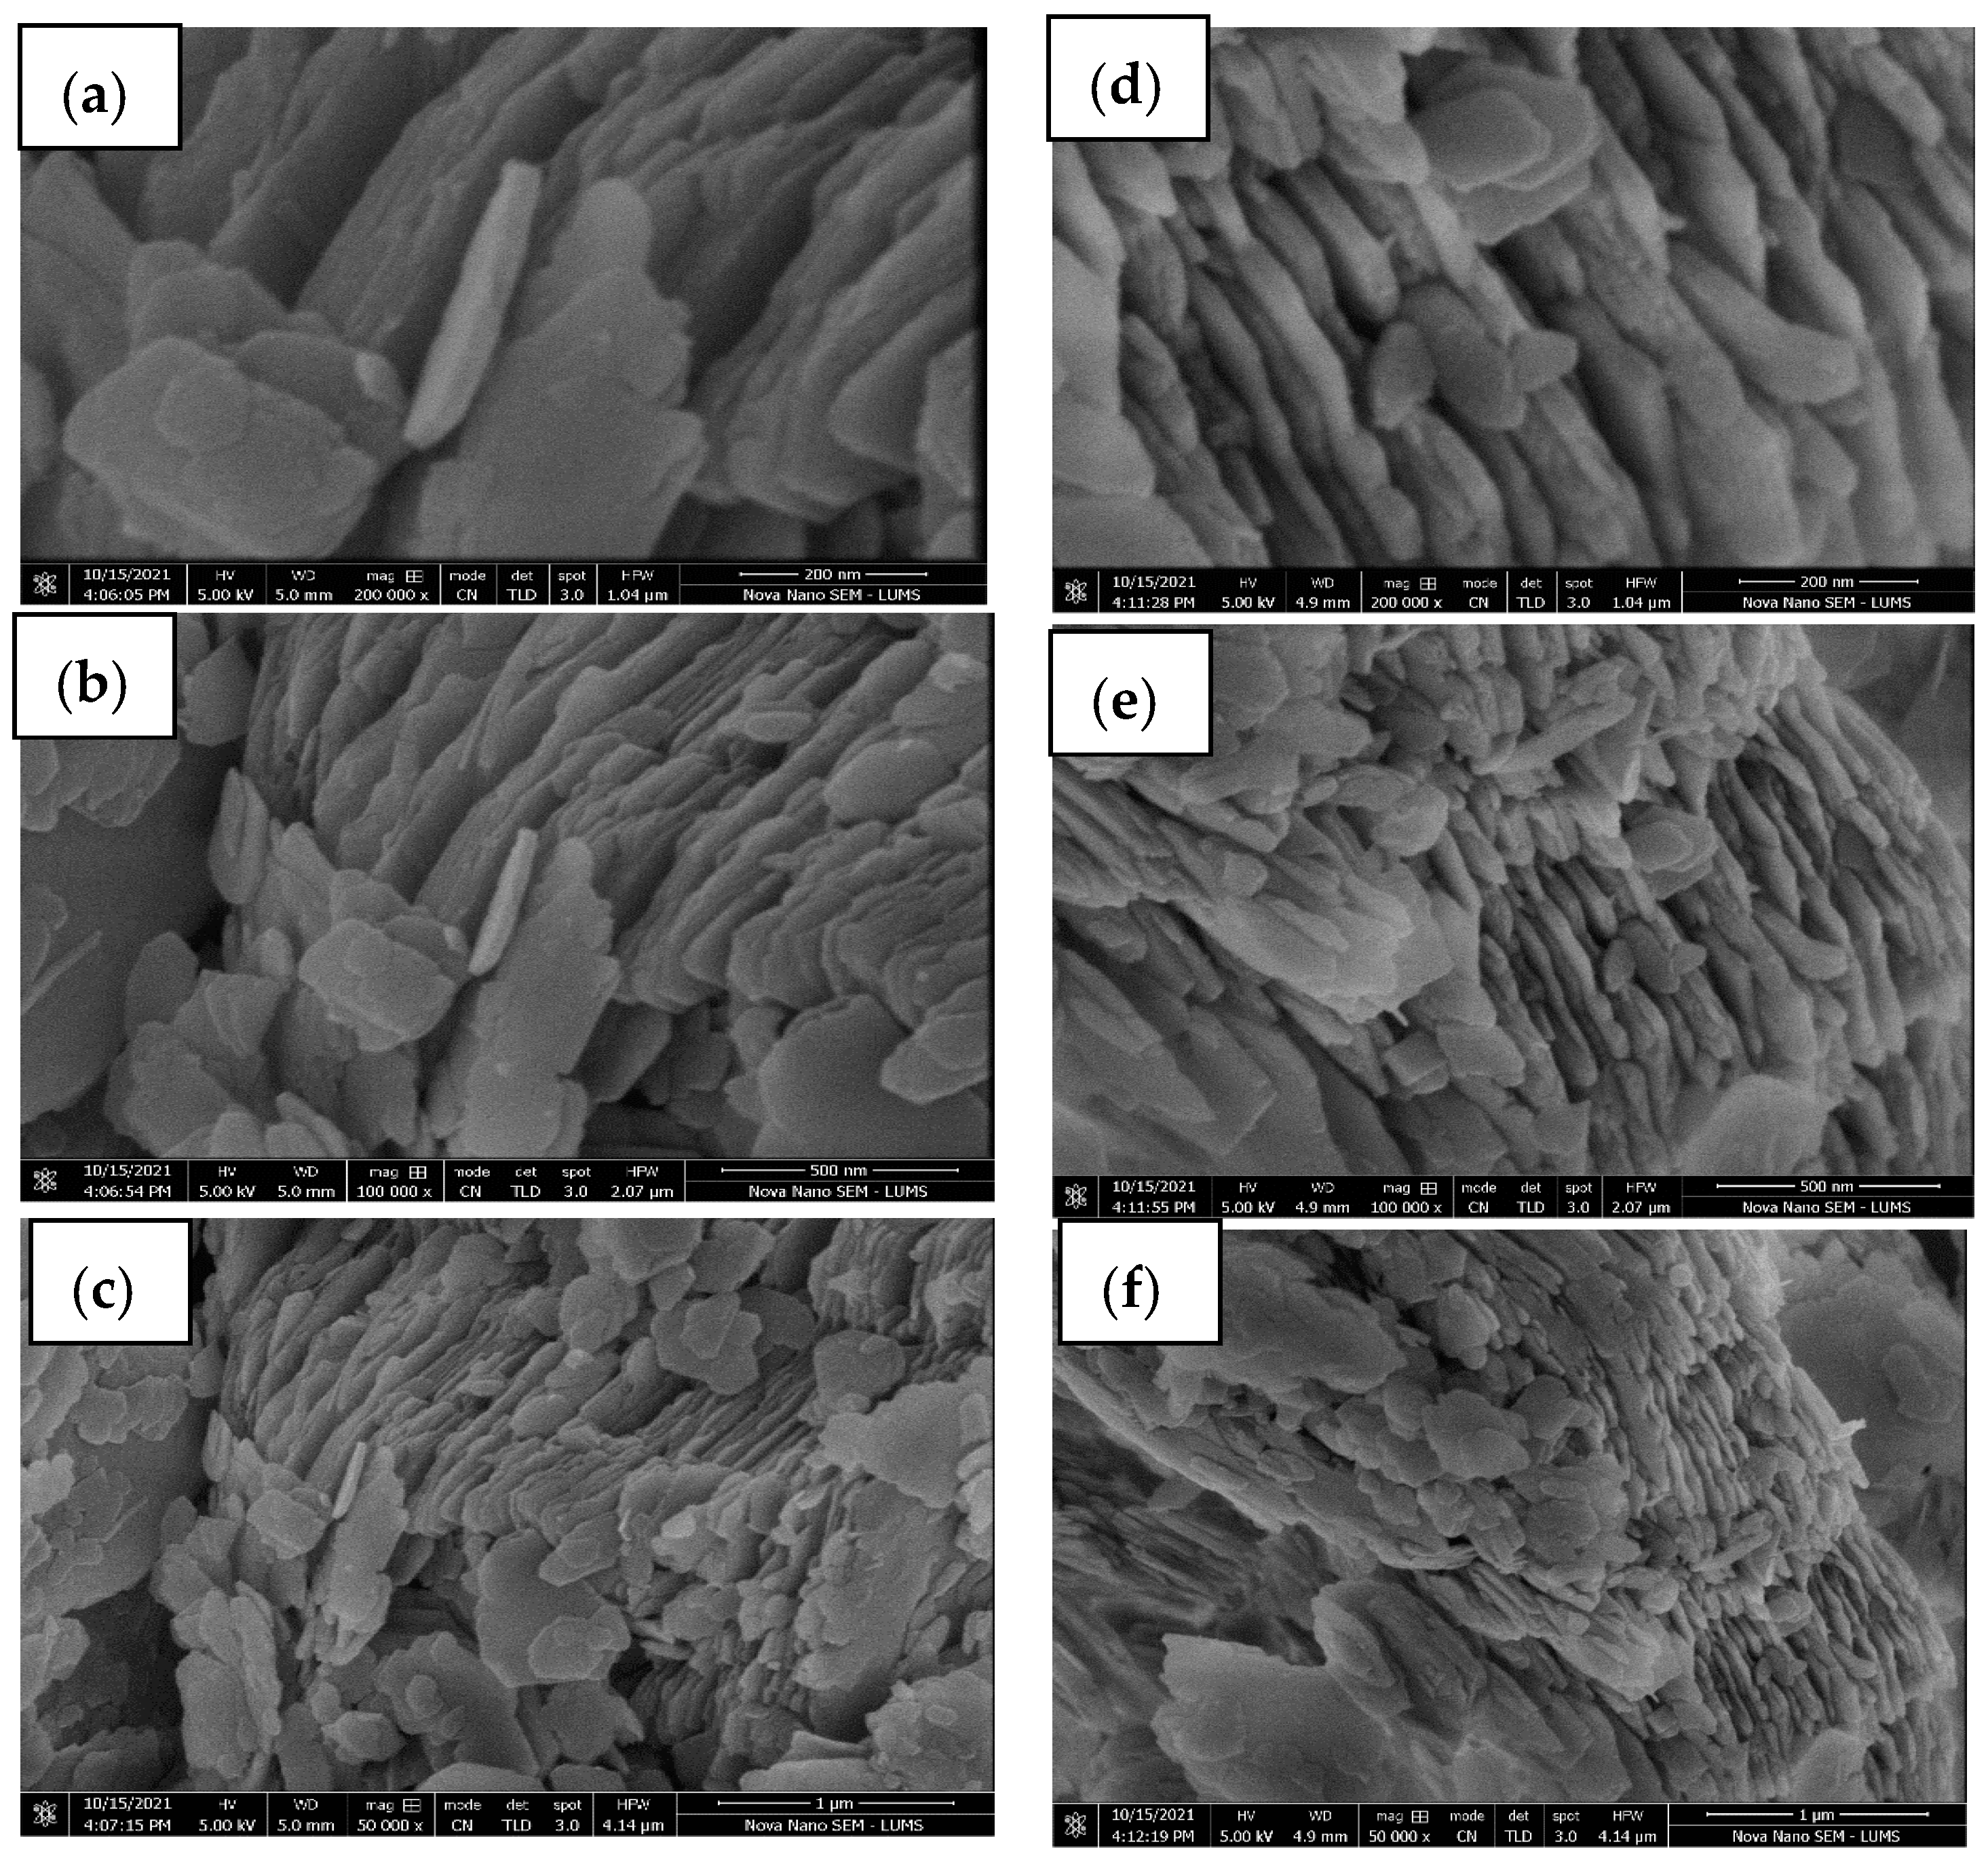
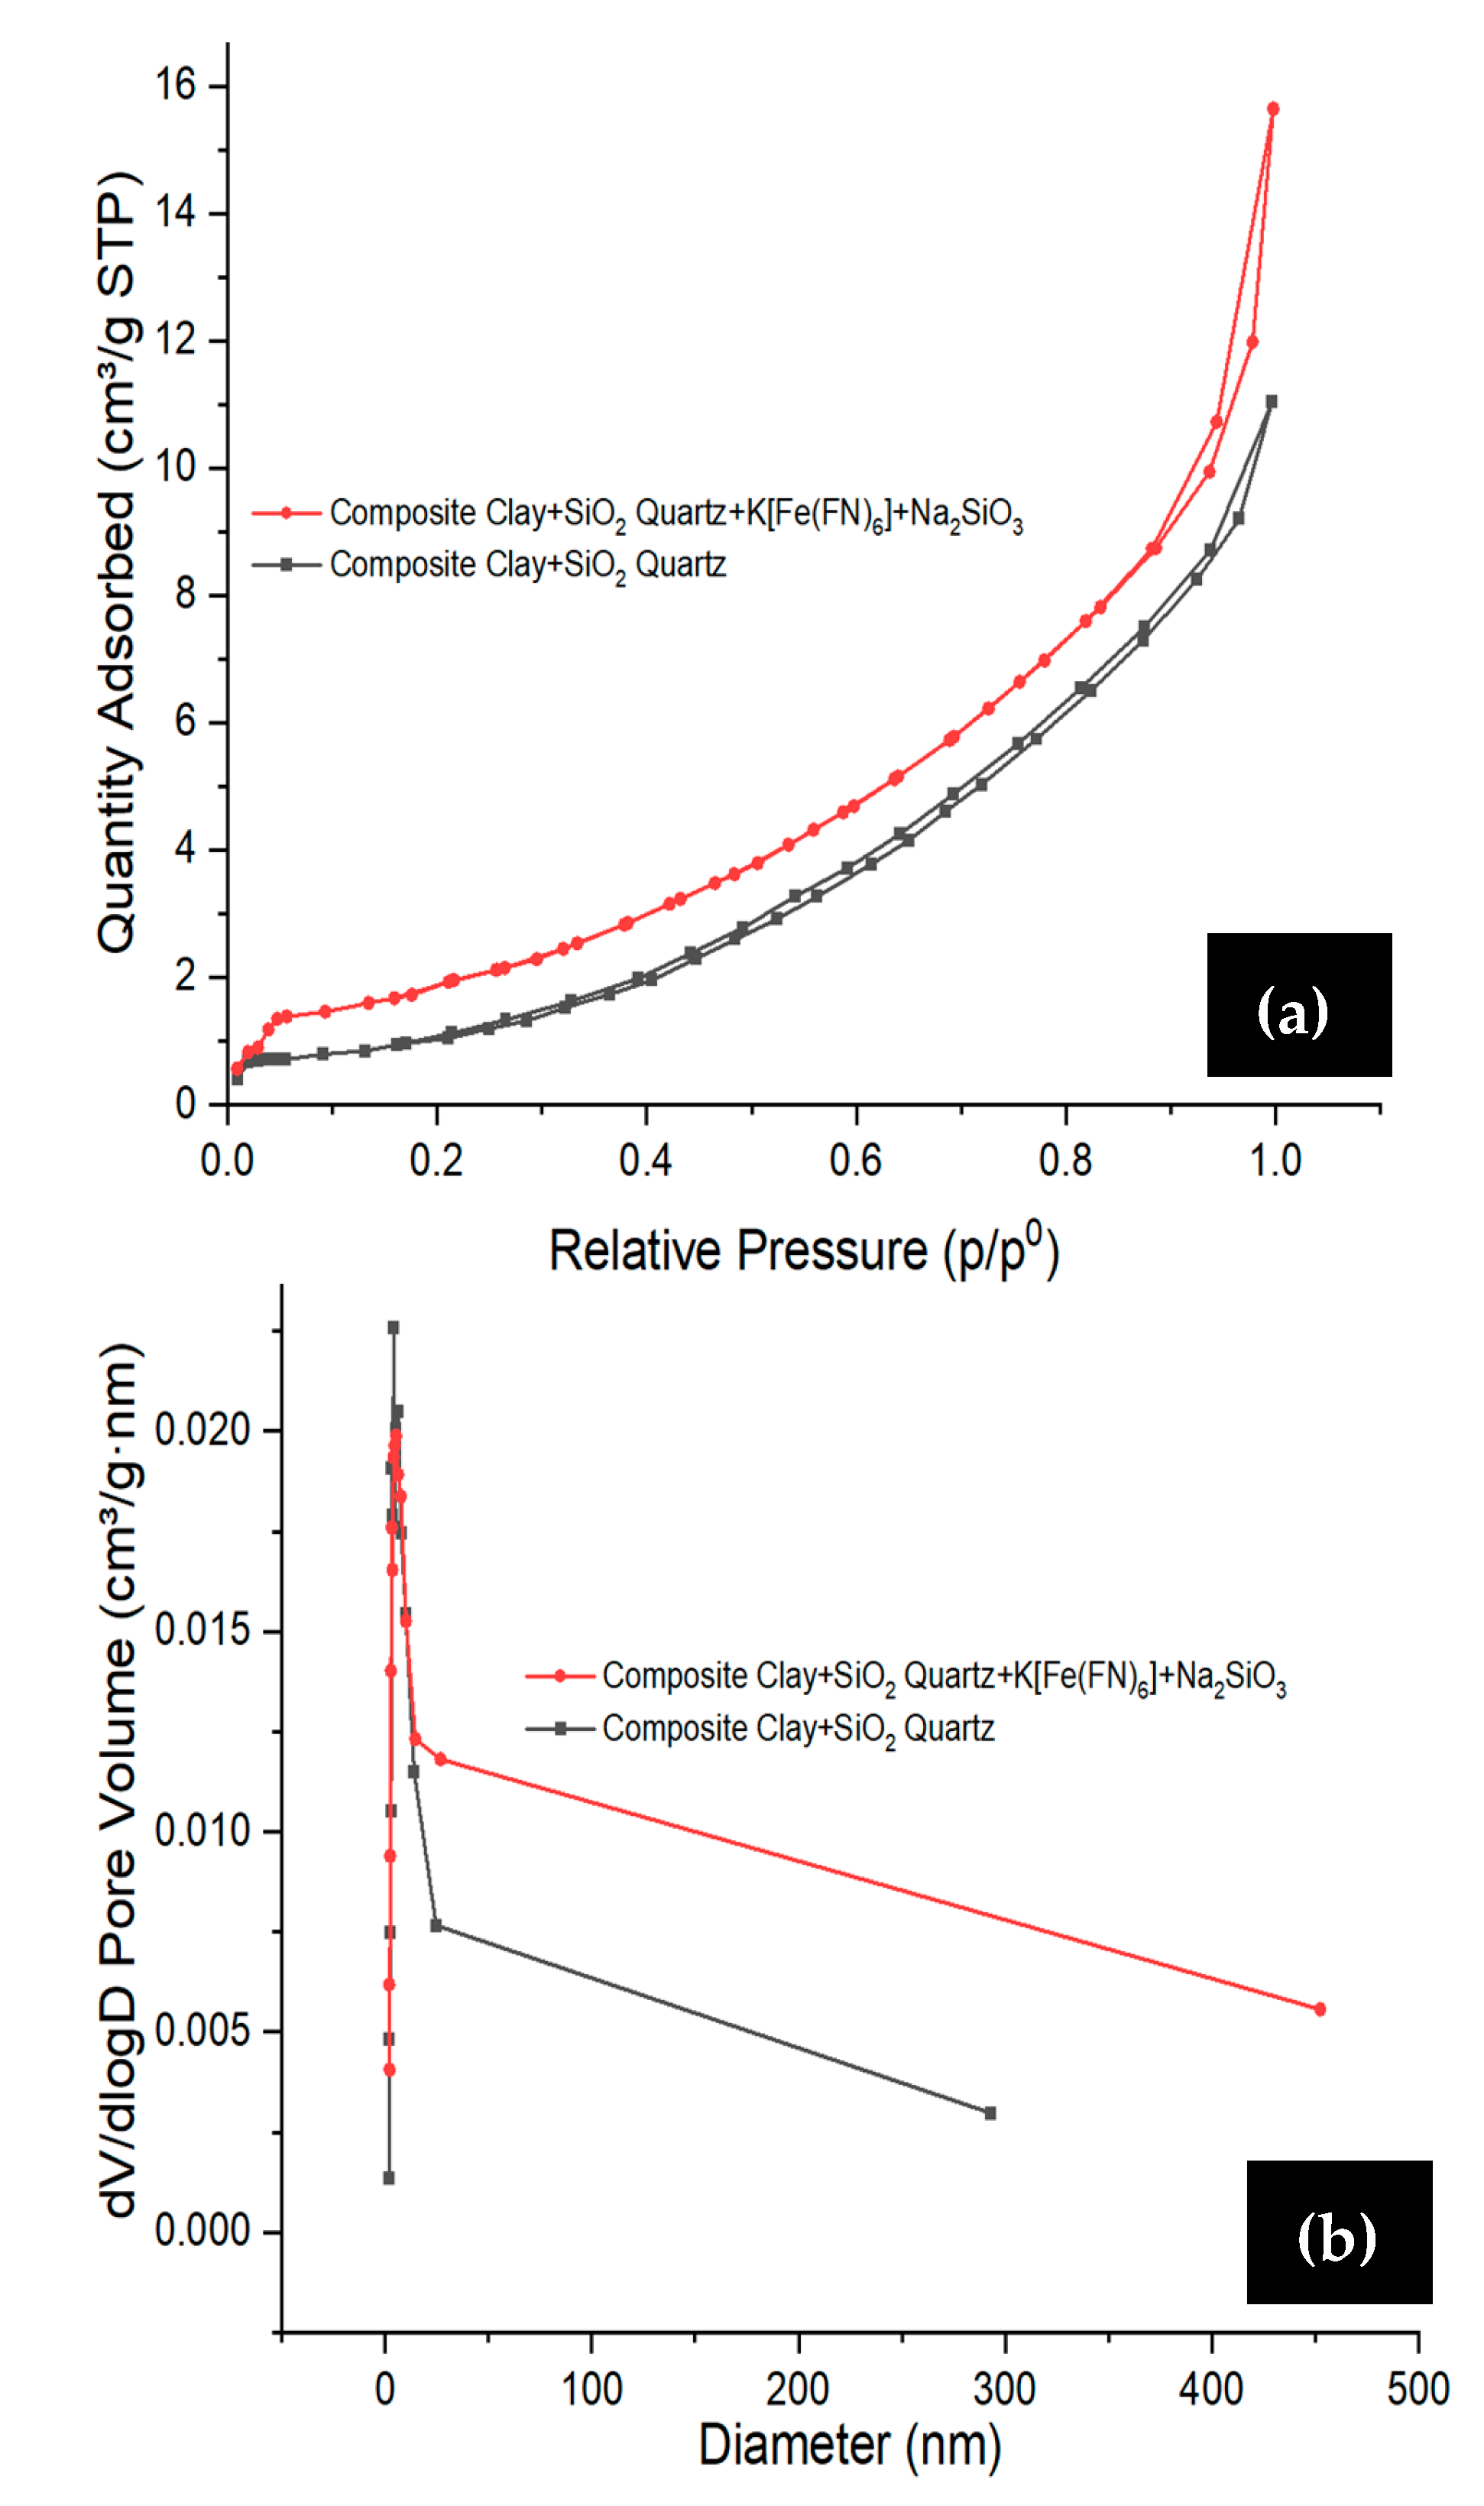
3.1. Characterization of SC + Quartz and SC + Quartz + Potassium Ferricyanide + Sodium Metasilicate

The FTIR patterns of nanocomposites of clay and quartz depicted numerous characteristic bands in Figure 3a. The adsorption spectrum of pure quartz showed IR peaks at 643 and 579 cm−1 (Si–O vibrations of quartz impurities) and 717, 767, and 419 cm−1 corresponding to the vibration band of Si–O–Si [20]. The vibration peaks allied to the SiO2 groups are allocated to the asymmetric and symmetric stretching modes (detected at 1016 cm−1) and the bending mode (at 537 cm−1) as a weak band [21]. These results provide evidence that it is a composite spectrum of quartz and clay.
The FTIR spectrum of the prepared SC + quartz + potassium ferricyanide + sodium metasilicate (modified quartz) is presented in Figure 3b. The absorption at the 2030 cm−1 peak of the FTIR spectrum confirms the development of the iron cyanide hydrate after the pyrolysis [22]. The prominent peak at 646 cm−1 and 438 cm−1 may be allocated to Fe–CN–Fe banding mode. FT-IR absorbance peaks from 725 to 1440 cm−1 (Figure 3b), such as Si=O bending, Si–O–Na, and Si–O–Si stretching vibrations [23]. In addition, the absorbances at 765 and 745 cm−1 were attributed to the symmetric stretching and bending vibrations of the Si–O–Si bond [24]. The medium peak appeared at 418 cm−1, and this is an indicative peak of the Fe–O stretching vibration in iron oxide [22]. Low-intensity peaks can be seen between 3700 and 3600 cm−1, which indicates the presence of a quartz-type compound mixed with potassium ferricyanide and sodium metasilicate having oxygen and hydrogen bonds (Figure 3b).
Scanning electron microscopy analysis was used to study the surface morphology of modified and unmodified quartz composites (Figure 4). The micrographs obtained show that the unmodified quartz sample has a flattened and elongated shape as compared to the modified quartz sample, which has aggregated and coarse morphology. The adsorption process is made easier by its higher contact area and easy pores diffusion. The surface area and the porosity of the adsorbent are crucial factors in determining its adsorption capacity and performance.
The crystallinity patterns of SC + quartz and SC + quartz + potassium ferricyanide + sodium metasilicate are depicted in Figure 5. These patterns provide insights into the structural characteristics of the synthesized composites. The crystalline structure of the SC + quartz and impregnated SC + quartz + potassium ferricyanide + Sodium metasilicate were evaluated by XRD diffracted at a range of 2θ = 5 to 80°. The crystalline phases of the prepared samples were determined to be quartz, silicon dioxide, and tridymite, as shown in Figure 5. Diffraction patterns corresponding to quartz (SiO2, Card No. 5000035) were observed 2 θ = 20.8° (100), 26.7° (101), 36.6° (110), 39.5° (102), 50.1° (112), 54.9° (202), 60.1° (211), 64.0° (113) and 68.3° (301). In addition, the diffraction peaks at 27.5 (2–21) and 28.1 (502) were determined as silicon dioxide (Card No. 4124076) and tridymite (Card No. 9013493). The intensity of the modified sample was significantly decreased upon the impregnation of potassium ferricyanide and sodium silicate, showing that the crystallinity of quartz was reduced concurrently.
The Brunauer–Emmett–Teller (BET) analysis was performed to evaluate the surface area, pole volume, and average pore size characteristics of SC + quartz and SC + quartz + potassium ferricyanide + sodium metasilicate, and the results are depicted in Figure 6 and Table 1. Figure 6 appraises that SC + quartz and SC + quartz + potassium ferricyanide + sodium metasilicate exhibited type-III isotherm patterns, indicative of mesoporous pore structures. The mesoporous structures were further confirmed by the presence of H3 hysteresis loops at P/P° = 0.99, according to the IUPAC classification [25]. Based on the BET method, the surface areas of SC + quartz and SC + quartz + potassium ferricyanide + sodium metasilicate were determined to be 4.02 m2/g and 7.02 m2/g. The activation of higher temperatures led to an increase in the average pore volume and specific surface area of SC + quartz and SC + quartz + potassium ferricyanide + sodium metasilicate. Further analysis of the pore size distribution revealed that SC + quartz and SC + quartz + potassium ferricyanide + sodium metasilicate exhibited average pore size from 3.27 to 3.34 nm using the Barrett, Joyner, and Halenda (BJH) methods as presented in Table 1 These findings provide further evidence of the synthesized composite surface composition and its potential for efficient of pollutants from the wastewater.

3.2. Determination of Maximum Wavelength (λmax)

To determine the wavelength of the dye, namely Acteray dye, a 25 ppm solution of dye was prepared by dissolving 0.001 g of dye in 40 mL distilled water. Then, this dye solution was run on a UV-visible spectrophotometer and scanned over a wavelength range of 335 nm to 1000 nm to determine the maximum absorption wavelength (434 nm).

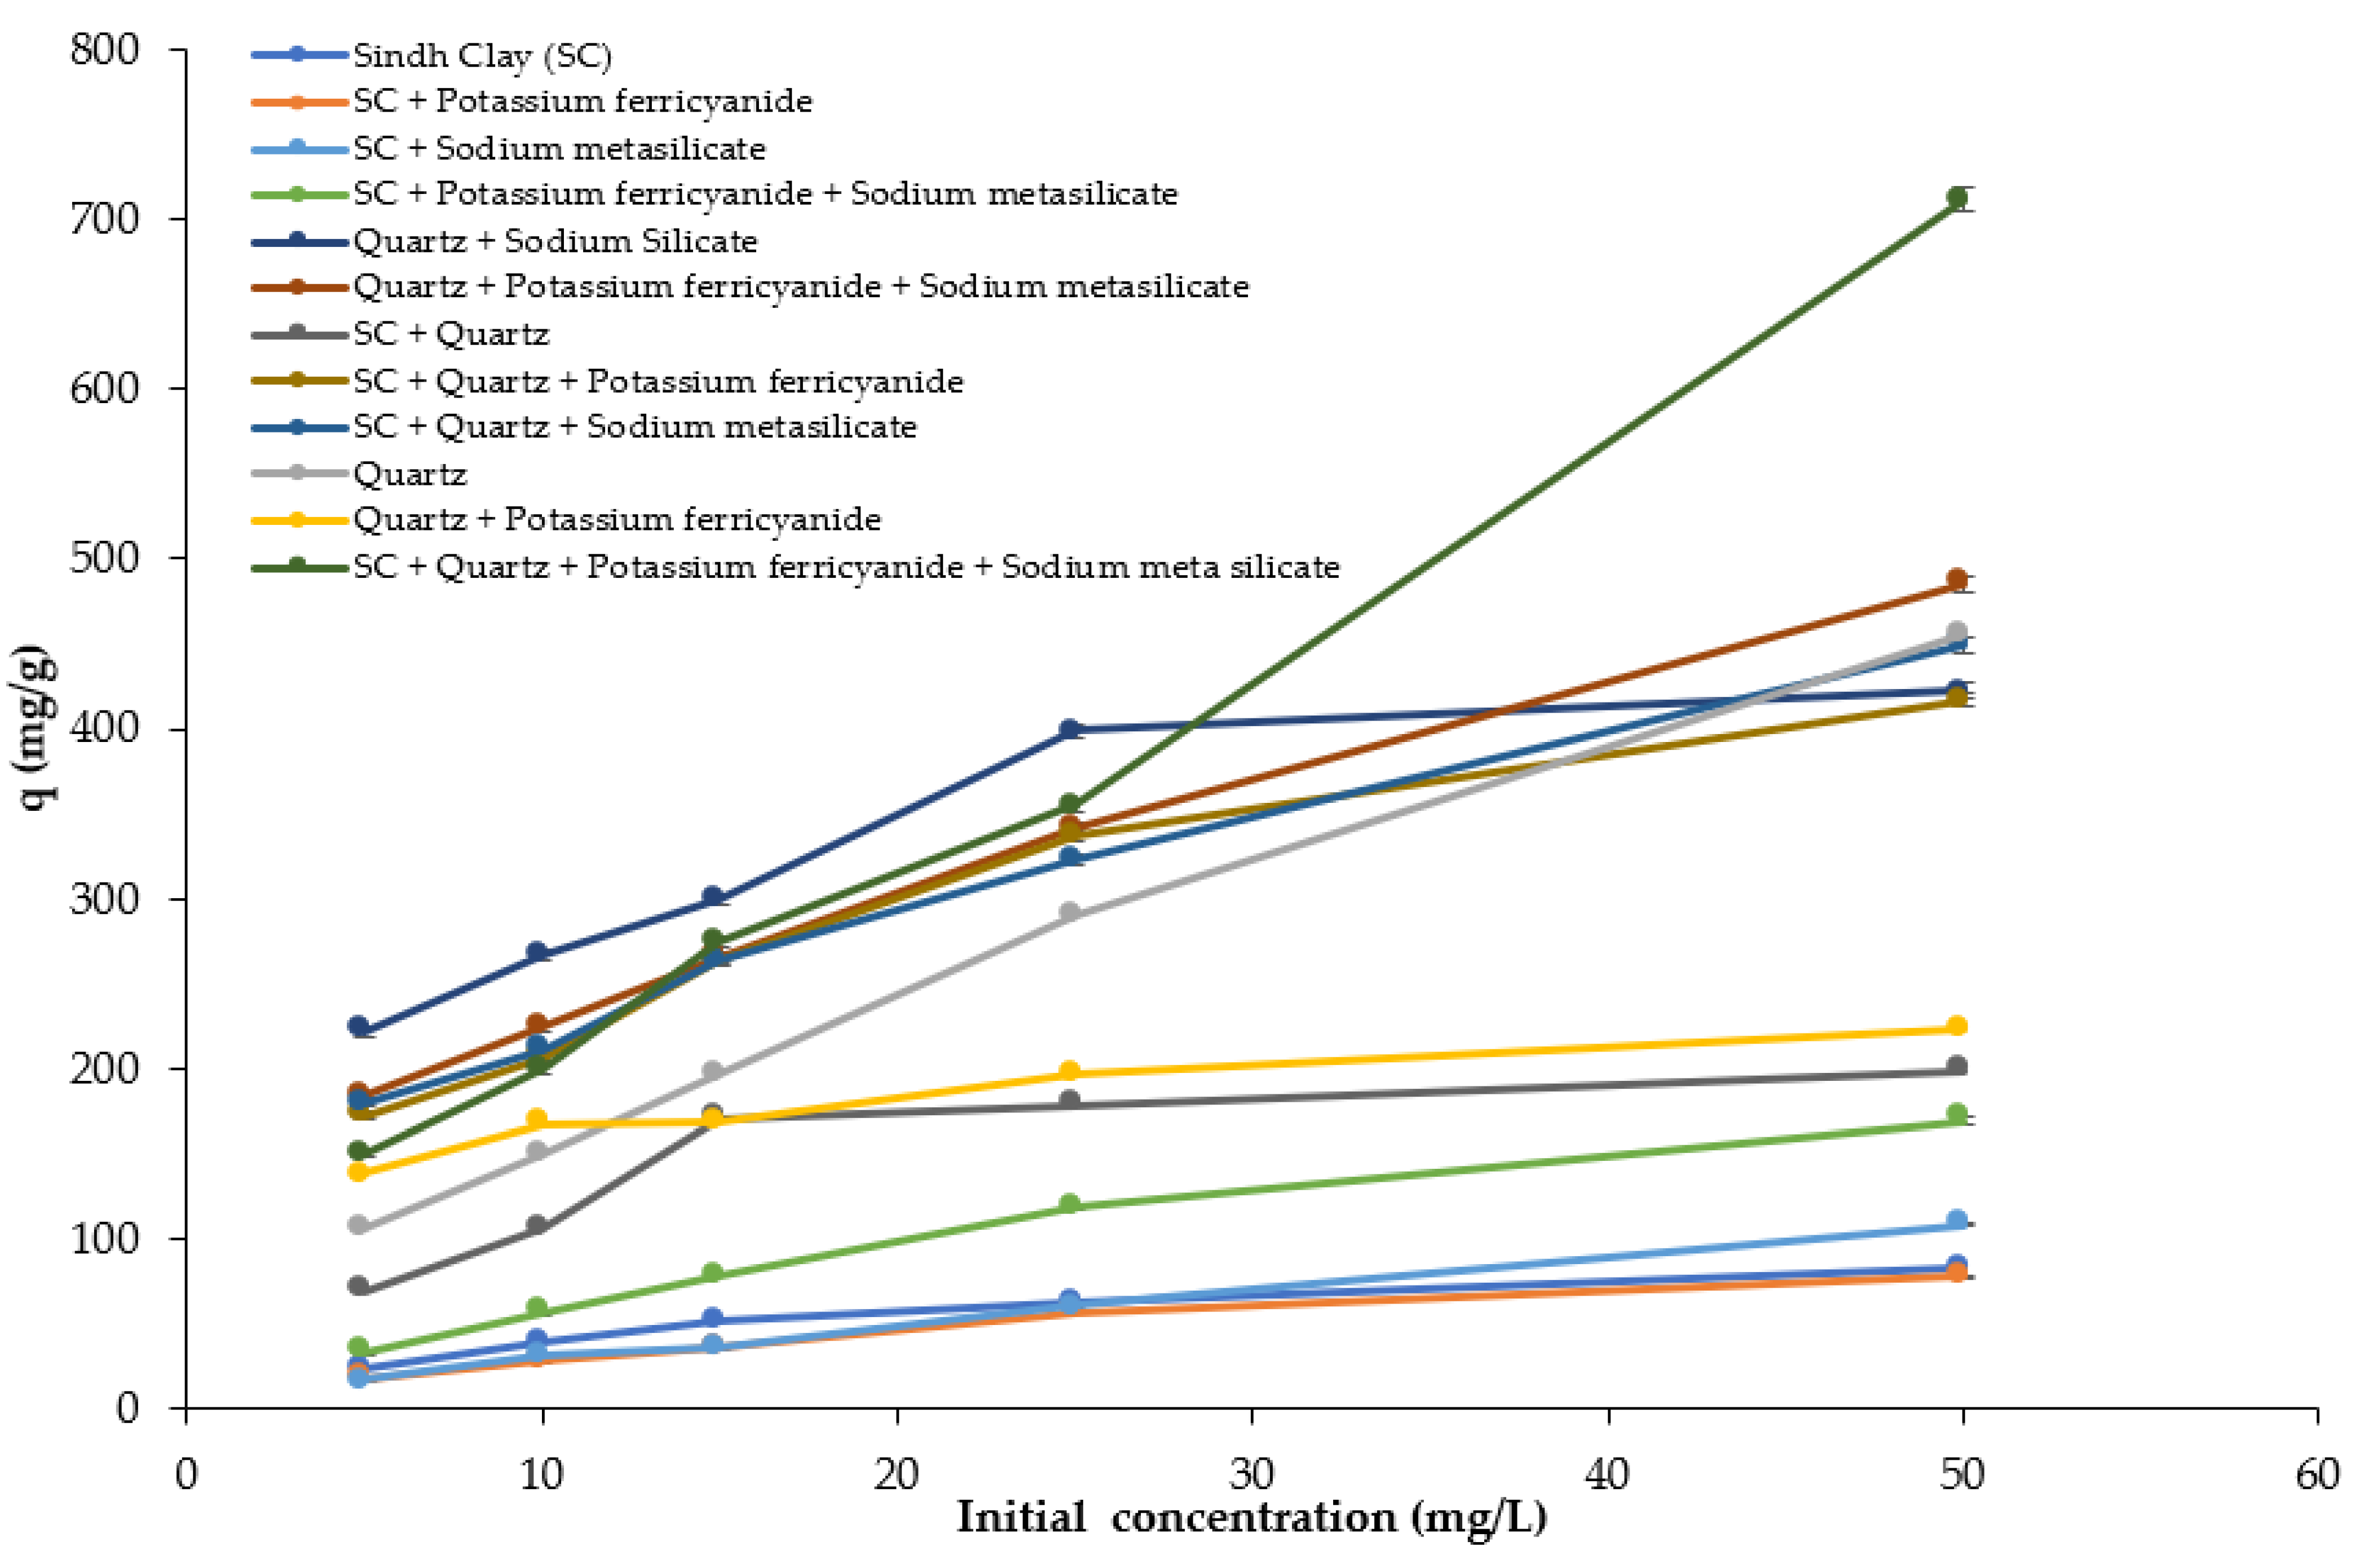
3.3. Effect of Initial Dye Concentration

The pH plays a significant role in the adsorption process because it significantly impacts dye's adsorptive and dissociative ability on the adsorbent surface [26]. The effect of change in pH for the adsorption of dye has been depicted in Figure 7. It has been found that dye adsorption increased by increasing pH, and maximum adsorption was recorded at pH 9. The pH was used in the range of 5, 6, 7, 8, 9, 10. A rapid increase in dye removal efficiency (q value) was observed with an increase in pH from 5 to 9. In acidic pH, dye adsorption was decreased due to repulsive forces between positive ions present on the surface of the adsorbent and cations of dye. The maximum q value for all materials was observed at pH 9 in the basic range because there are no positive ions on the adsorbent surface, and cations of dye easily bind with the adsorbent; more adsorptions occur, which results in an increase in dye removal efficiency. The increase in dye uptake by increasing pH can be explained based on absorbent zero-point charge. When pH increases above this point, the adsorbent surface is occupied by negative charges, which lead to an increase in the adsorption of cations through electrostatic attractive force [27].
The initial concentration is an important parameter for the evaluation of dye adsorption. The increase in initial Rhodamine B dye concentration increases the dye adsorption, as shown in Figure 8. The initial concentration of dye was used in the range of 5 to 50 mg/L. A sharp increase in dye removal efficiency was observed at maximum concentration (50 mg/L). The reason is that at higher dye concentrations, a greater number of cations of dye are available to adsorb on the surface of the adsorbent [28]. The modified composite material gives greater dye removal efficiency than the unmodified composite material. This supports the fact that modification of composite material with potassium ferricyanide provides better results in dye removal.
Langmuir isotherm illustrates how adsorbate reacts with adsorbent and is important in optimizing adsorbent utilization. Adsorption isotherm studies are designed to correlate adsorbate concentrations (Ce, mg/L) with adsorption capacity (Qe, mg/g) in a liquid state. To comprehend a complicated adsorption process in a liquid state, many isotherm models are used. Langmuir adsorption isotherm was developed to characterize gas–solid phase adsorption and is often used to measure and compare the adsorptive ability of different adsorbent materials. By regulating the relative rates of desorption and adsorption, the Langmuir isotherm compensates for physical adsorption [29], as Equation (1).
C e Q e = 1 Q ° k t + 1 Q ° C e
Here, Ce (mg/g) defines the concentration of adsorbate molecule and Qe (mg/g) for extreme adsorption capability at equilibrium. Kl and Q° are Langmuir coefficients interrelated to adsorbents' monolayer adsorption capability (mg/g). The plot of Ce/qe against Ce stretches a straight line.
The Freundlich isotherm applies to adsorption systems on heterogonous substances. This isotherm yields an equation that characterizes surface heterogeneity and the exponential function of active sites and their energy [30]. The linear form of the Freundlich isotherm is as follows in Equation (2):
L n q e = L n k f + 1 n L n C e
where Kf is the adsorption capacity (L/mg), and 1/n is the adsorption intensity; it also specifies the relative dispersal of the energy and the heterogeneity of the adsorbate positions.
The Dubinin–Radushkevich adsorption isotherm is an observational adsorption model used to represent adsorption mechanisms with Gaussian energy distribution onto heterogeneous planes [31], as presented in Equation (3). Because the Dubinin–Radushkevich isotherm is sensitive to temperature, all appropriate data may be generated by plotting adsorption data at various temperatures as a proportion of the logarithm of quantity adsorbed versus the square of potential energy.
L n q e = L n q ° β ε 2
where β (mol2/J2) represents the coefficient that suggests the mean adsorption energy, and Qe is adsorption capability at equilibrium, ε displays the Polanyi potential and is intended using this Equation.
ε = R T L n ( 1 + 1 C e )
where R (8.314 Jmol−1 k−1) signifies gas constant, T for absolute temperature in K. Ce is associated with the concentration of adsorbate (mg/L) at equilibrium. Mean free-energy (E) of adsorption is that free-energy change occurs when 1 mole of ion is distributed from solution to the adsorbent molecule. This free energy could be calculated by using the β value.
E = 1 2 β
The Temkin isotherm model considers the impacts of adsorbate or adsorbate interactions upon that adsorption mechanism. It is also supposed that as coating thickness increases, the adsorption rate of all particles in the stack decays exponentially [32]. The Temkin isotherm is only meaningful for a narrow range of ion concentrations. The linear version of the Temkin isotherm model is given in Equation (4).
q e = B L n A t + B l n C e
Temkin isotherm was fitted to tentative data using the above equation, where At is the equilibrium binding constant (L/mg). R2 values are revealed via a plot of qe versus lnCe.
The Harkin–Jura model predicts multi-layered adsorption on the top of absorbents with heterogeneous porous distribution [33]. The following is how this concept is expressed in Equation (5):
1 q 2 e = B A 1 A l o g C e
Here, A and B are Harkin–Jura constants that can be attained from plotting logCe versus 1/qe2.
Isotherm models like Langmuir, Freundlich, Dubinin–Radushkevich, Temkin, and Harkin–Jura were used to examine the adsorption of dyes on the surface of clay-based composites. These adsorption studies illustrate the adsorbent capacity by using the adsorption isotherm constants as their values depict the affinity of adsorbents and their surface properties. Data obtained from the adsorption isotherm parameters is listed in Table 2. Freundlich isotherm model best described the adsorption of dyes onto the clay composites. R2 values were close to 1 or more than 0.9, showing that the equation supports the experimental data. The comparison shows that the Harkin–Juraand Langmuir isotherms represented poor fits on the experimental conditions for all concentrations. Kf is the Freundlich constant, which specifies the adsorption capacity of every single absorbent; as greater the value of Kf, the greater the adsorption capacity of adsorbent. The degree of n indicates the extent of favorability for adsorption; when it is equal to unity, adsorption will be linear. Likewise, n greater than unity depicts physical adsorption more favorably. Adsorption energy determined by the Dubinin model was found to be between the range of 0.71 and 0.25 kJ/mol for clay compounds, revealing the impact of physisorption in dye adsorption.

3.4. Effect of Contact Time

The dye solution of 50 ppm was prepared by dissolving 0.025 gm of dye in 500 mL of distilled water. The dye solution was treated with all 12 adsorbents. The solution was filled in test tubes up to 15 mL containing 0.01 gm of adsorbent. Drying was performed in an oven at 30 °C, and after the intervals of 15, 30, 60, 120, and 240 min, all solutions were filtered with the help of a syringe filter, and their absorptions were recorded with the help of a spectrophotometer at the λ max of dye. The same procedure was repeated at other temperatures like 40, 50, 60 and 70 °C [34].
The kinetics equation of Lagergren or pseudo-first-order Equation (6) elucidates liquid-centered adsorption onto the solid capacity. Kinetic models describe that the rate of change of the solute uptake versus time is directly related to the change in concentration and solid uptake with time.
log q e q t = l o g q e k 1 t 2.303
where t is the time (min), k1 is the pseudo-first-order rate constant of the adsorption, qe (mg/g) signifies the equilibrium capability of the adsorption, and qt is for concentration (mg/g) at every time t.
This model was applied to determine the adsorption kinetics. The pseudo-second-order kinetic model shows its linear form as described in Equation (7).
t q = 1 k 2 q e 2 + t q t
Here, q (mg/g) signifies the quantity of the dye absorbed at the equilibrium state, qt (mg/g) is the quantity of dye adsorbed at time t (min), k2 pseudo-second-order rate constant of adsorption.
Both kinetic models (pseudo-first-order and pseudo-second-order) have been applied in order to determine the experimental data (Table 3) and to examine the chemical reactions, mass transfer, adsorption mechanism, potential rates, and kinetics of dye adsorption onto the clay composites [35]. The experimental data can be studied by correlation coefficients (R2) whose values are nearer to or equal to one. The higher the value of R2, the more the effectiveness of models on adsorption kinetics, as depicted in Table 2 and Table 3 [36]. The data obtained shows that the pseudo-first-order kinetic model was best fitted to acteray golden dye compared to pseudo-second-order as its R2 values are close to 1 (R2 > 0.9). The pseudo-second-order kinetic model failed to illustrate the qe and the rate constant of the model. Meanwhile, experimental values may differ from the estimated values, and the lower values of the regression coefficient (R2) demonstrate that the adsorbate molecules were attached to one binding site. Acteray golden dye shows maximum adsorption values after 240 min of shaking. The results depict that in the beginning, there is an increase in adsorption capacity, then it slows down with time because there are a large number of empty binding sites of dye anions at the start of adsorption, and later, with time, the adsorption process decelerates with the coverage of vacant sites. Calcinated composites show the applicability of the pseudo-second-order kinetic model, inferring that the adsorption happens on the heterogeneous surface of composite constituents.
A comparison of composite (SC + quartz + potassium ferricyanide + sodium metasilicate) used in the present study with previous studies is provided in Table 4. The composite used in the present study exhibited comparatively better dye removal capacity.

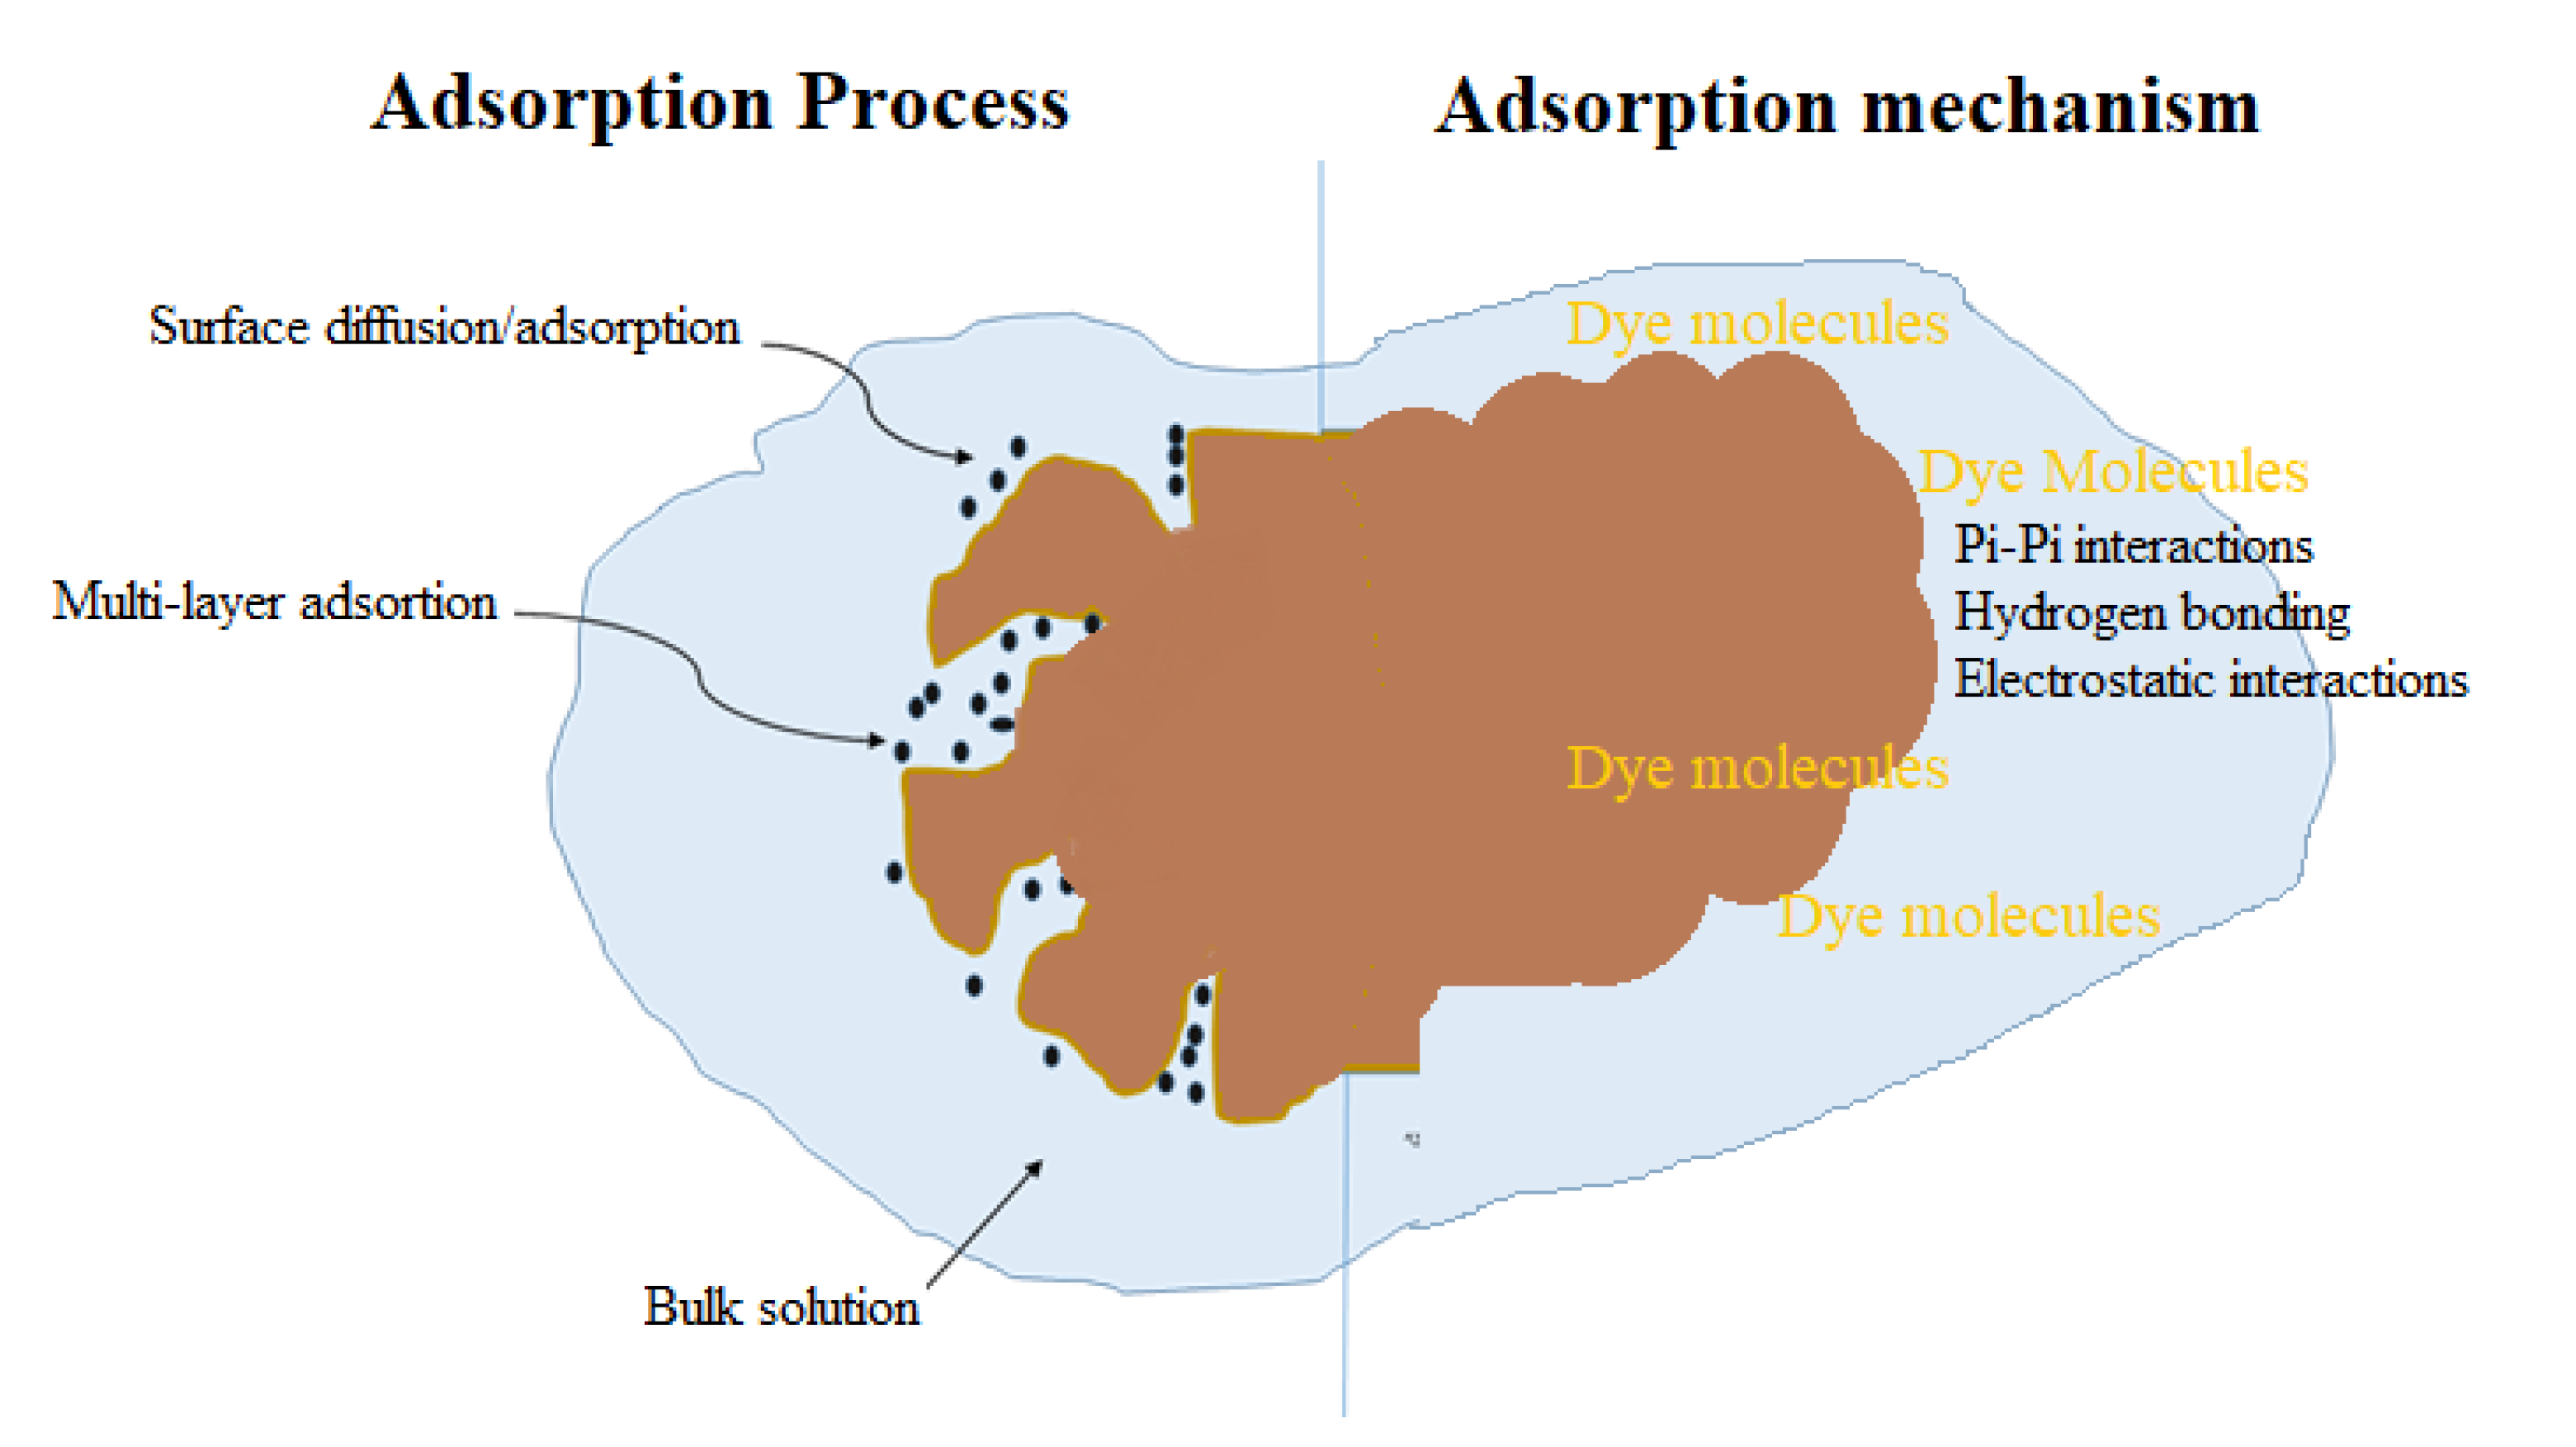
3.5. Plausible Mechanism of Adsorption

Figure 9 illustrates that adsorption mechanisms can occur in various ways involving weak electrostatic interactions, hydrogen bonding, or Pi–pi interactions, depending on which groups interact. Surface or multilayer adsorption is only possible when matched with various adsorption isotherms and the adsorption process. The driving force behind this adsorption is the difference in concentration between the adsorbent and bulk solution [46]. Chemisorption plays an important role in the adsorption of various molecules [47]. In the proposed adsorption process mechanism, absorbent molecules adsorb to the adsorbent surface in the form of a monolayer, or they may adsorb as multilayer from the bulk solution, which can also be evidenced from adsorption isotherm equations.

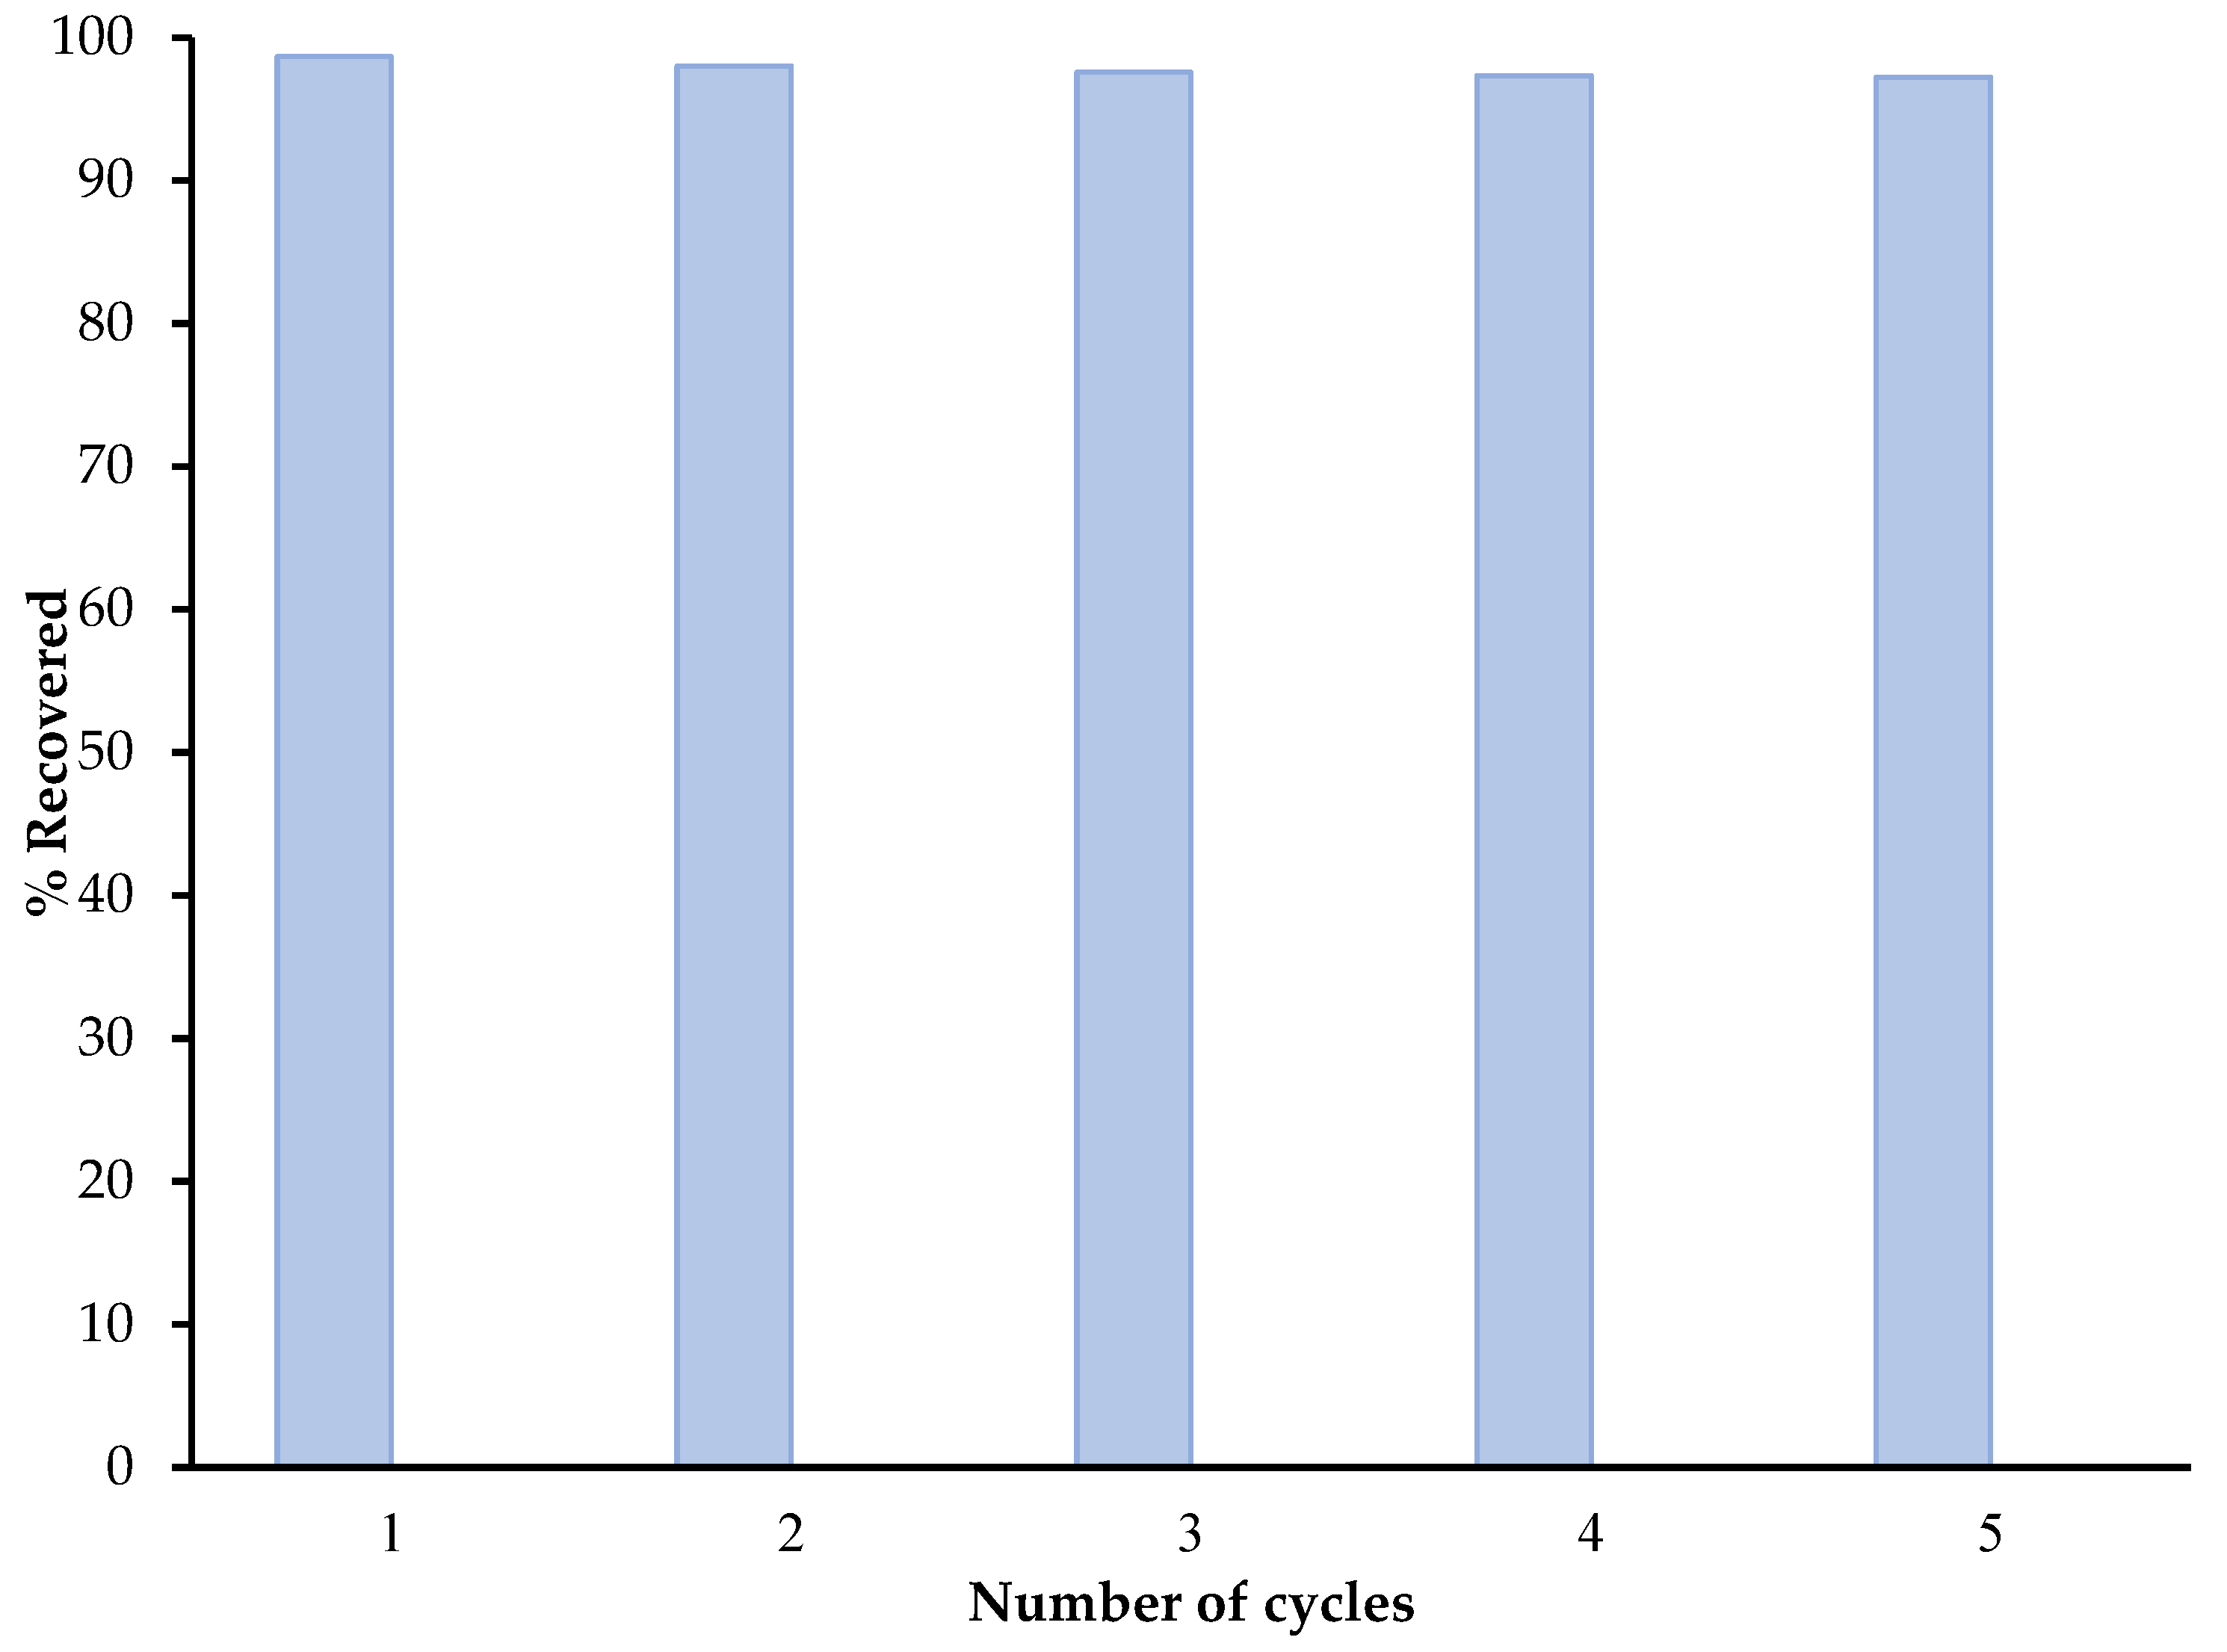
3.6. Reusability of SC + Quartz + Potassium Ferricyanide + Sodium Metasilicate Composite Study

In this context, commercial application of absorbent, the reusability study of the absorbent was conducted. The adsorbed dye was removed from the adsorbent using solvent extraction with the use of CH3OH as an eluent for up to five consecutive cycles (Figure 10). The amount of dye removed from the adsorbent was determined spectrophotometrically, and the removal efficiency was determined after each cycle. The results obtained clearly show that there was a very small decrease in the dye uptake capacity of adsorbent after each cycle, which suggests that adsorbent can be effectively used again.

4. Conclusions

The simple technique has been effectively used to prepare SC + quartz + Potassium ferricyanide + Sodium metasilicate, nanocrystallites composite. The crystal structure, structural change, and morphology of nanocrystallites were monitored by FT-IR, XRD, BET, and SEM. The micrographs obtained show that the unmodified quartz sample has a flattened and elongated shape as compared to the modified quartz sample, which has aggregated and coarse morphology. The adsorption spectrum of pure quartz showed adsorption at 1016 cm−1, which indicates SiO2 stretching and bending mode, as a weak peak can be seen at 537 cm−1, which indicates the presence of quartz and clay composite. The nanocomposites of clay and quartz have shown a very high uptake capacity for dye. Freundlich isotherm model best described the adsorption of dyes onto the clay composites. R2 values were close to 1 or more than 0.9, showing that the equation fits the experimental data well. The data obtained shows that the pseudo-first-order kinetic model was best fitted to acteray golden dye compared to pseudo-second-order as its R2 values are close to 1 (R2 > 0.9). The synthesized adsorbent demonstrates exceptional reusability, retaining over 90% of the adsorption capacity even after five cycles.

Author Contributions

Conceptualization, U.R. and M.A.H.; methodology, A.F., U.R. and M.A.H.; software, U.R. and F.A.A.; validation, U.R., M.A.H., F.A.A. and M.I.J.; formal analysis, A.F., U.R., M.A.H. and M.I.J.; investigation, U.R., M.A.H. and F.A.A.; resources, U.R. and F.A.A.; data curation, U.R., A.F. and J.H.; writing—original draft preparation, A.F., M.I.J. and M.A.H.; writing—review and editing, U.R., F.A.A., M.I.J., J.H. and M.A.H.; visualization, M.A.H. and U.R.; supervision, M.A.H.; project administration, U.R., M.A.H. and F.A.A.; funding acquisition, U.R. and F.A.A. All authors have read and agreed to the published version of the manuscript.

Funding

This research received no external funding.

Data Availability Statement

Not applicable.

Acknowledgments

Authors extend their thanks to the Researchers Supporting Project (RSP2023R160), King Saud University (Riyadh, Saudi Arabia).

Conflicts of Interest

The authors declare no conflict of interest.

References

  1. Zahoor, I.; Mushtaq, A. Water pollution from agricultural activities: A critical global review. Int. J. Chem. Biochem. Sci. 2023, 23, 164–176. [Google Scholar]
  2. Tariq, A.; Mushtaq, A. Untreated wastewater reasons and causes: A review of most affected areas and cities. Int. J. Chem. Biochem. Sci. 2023, 23, 121–143. [Google Scholar]
  3. Asghar, F.; Mushtaq, A. The future of nanomaterial in wastewater treatment: A review. Int. J. Chem. Biochem. Sci. 2023, 23, 150–157. [Google Scholar]
  4. Choudhary, A.; Mushtaq, A. From pollutant to valuable product: A novel reutilization strategy of wastewater. Int. J. Chem. Biochem. Sci. 2023, 23, 31–37. [Google Scholar]
  5. Hu, J.-Z.; Skrabal, P.; Zollinger, H. A comparison of the absorption spectra of a series of blue disperses dyes with the colorimetric evaluation of their dyeings. Dye. Pigments 1987, 8, 189–209. [Google Scholar] [CrossRef]
  6. Fatima, T.; Mushtaq, A. Efficacy and challenges of carbon-based nanomaterials in water treatment: A review. Int. J. Chem. Biochem. Sci. 2023, 23, 232–248. [Google Scholar]
  7. Hamada, M.S.; Jabal, R.A. Doped (Ag) ZnO nanoparticles for removal of azo dyes from aqueous solutions. Int. J. Chem. Biochem. Sci. 2022, 21, 210–217. [Google Scholar]
  8. Javed, A.; Mushtaq, A. A critical review of electrocoagulation and other electrochemical methods. Int. J. Chem. Biochem. Sci. 2023, 23, 98–110. [Google Scholar]
  9. Rehman, Z.; Mushtaq, A. Advancements in treatment of high-salinity wastewater: A critical review. Int. J. Chem. Biochem. Sci. 2023, 23, 1–10. [Google Scholar]
  10. Aljeboree, A.M.; Alshirifi, A.N.; Alkaim, A.F. Activated carbon (as a waste plant sources)–clay micro/nanocomposite as effective adsorbent: Process optimization for ultrasound-assisted adsorption removal of amoxicillin drug. Plant Arch. 2019, 19, 915–919. [Google Scholar]
  11. Maqsood, M.; Khalid, T.; Kazerooni, E.G.; Javed, I.; Nadeem, F. Wastewater treatment using soil composites as effective adsorbents–A comprehensive review. Int. J. Chem. Biochem. Sci. 2019, 16, 28–34. [Google Scholar]
  12. Nadeem, F.; Khan, F.G.; Bashir, I. Advancements in natural bio-flocculants for water treatment. Int. J. Chem. Biochem. Sci. 2020, 17, 71–80. [Google Scholar]
  13. Salleh, M.A.M.; Mahmoud, D.K.; Karim, W.A.W.A.; Idris, A. Cationic and anionic dye adsorption by agricultural solid wastes: A comprehensive review. Desalination 2011, 280, 1–13. [Google Scholar] [CrossRef]
  14. Orucoglu, E.; Grangeon, S.; Gloter, A.; Robinet, J.-C.; Madé, B.; Tournassat, C. Competitive adsorption processes at clay mineral surfaces: A coupled experimental and modeling approach. ACS Earth Space Chem. 2022, 6, 144–159. [Google Scholar] [CrossRef]
  15. Nazir, M.A.; Najam, T.; Shahzad, K.; Wattoo, M.A.; Hussain, T.; Tufail, M.K.; Shah, S.S.A.; ur Rehman, A. Heterointerface engineering of water stable ZIF-8@ZIF-67: Adsorption of rhodamine B from water. Surf. Interfaces 2022, 34, 102324. [Google Scholar] [CrossRef]
  16. Nazir, M.A.; Najam, T.; Jabeen, S.; Wattoo, M.A.; Bashir, M.S.; Shah, S.S.A.; ur Rehman, A. Facile synthesis of Tri-metallic layered double hydroxides (NiZnAl-LDHs): Adsorption of Rhodamine-B and methyl orange from water. Inorg. Chem. Commu. 2022, 145, 110008. [Google Scholar] [CrossRef]
  17. Jamshaid, M.; Khan, H.M.; Nazir, M.A.; Wattoo, M.A.; Shahzad, K.; Malik, M.; Rehman, A.U. A novel bentonite–cobalt doped bismuth ferrite nanoparticles with boosted visible light induced photodegradation of methyl orange: Synthesis, characterization and analysis of physiochemical changes. Inter. J. Environ. Analyt. Chem. 2022, 2022, 2032014. [Google Scholar] [CrossRef]
  18. Jamshaid, M.; Khan, M.I.; Fernandez, J.; Shanableh, A.; Hussain, T.; ur Rehman, A. Synthesis of Ti4+ doped Ca-BiFO3 for the enhanced photodegradation of moxifloxacin. New J. Chem. 2022, 46, 19848. [Google Scholar] [CrossRef]
  19. Ho, Y.; McKay, G.; Wase, D.; Forster, C. Study of the sorption of divalent metal ions on to peat. Adsorpt. Sci. Technol. 2000, 18, 639–650. [Google Scholar] [CrossRef]
  20. Barbosa, V.F.F.; Mackenzie, K.J.D.; Thaumaturgo, C. Synthesis and characterisation of materials based on inorganic polymers of alumina and silica: Sodium polysialate polymers. Int. J. Inorg. Mater. 2000, 2, 309–317. [Google Scholar] [CrossRef]
  21. Deshmukh, P.; Peshwe, D.; Pathak, S. FTIR and TGA analysis in relation with the % crystallinity of the SiO2 obtained by burning rice husk at various temperatures. Advan. Mater. Res. 2012, 585, 77–81. [Google Scholar] [CrossRef]
  22. Rohilla, S.; Lal, B.; Sunder, S.; Aghamkar, P.; Kumar, S.; Aggarwal, A. Synthesis of Fe4[Fe(CN)6]3·14H2O nanopowder by co-precipitation technique and effect of heat treatment. Acta Phys. Pol. A 2010, 118, 696–700. [Google Scholar] [CrossRef]
  23. Abo-El-Enein, S.A.; Eissa, M.A.; Diafullah, A.A.; Rizk, M.A.; Mohamed, F.M. Removal of some heavy metals ions from wastewater by copolymer of iron and aluminum impregnated with active silica derived from rice husk ash. J. Hazard. Mater. 2009, 172, 574–579. [Google Scholar] [CrossRef]
  24. Teo, S.H.; Islam, A.; Chan, E.S.; Choong, S.Y.T.; Alharthi, N.H.; Taufiq-Yap, Y.H.; Awual, M.R. Efficient biodiesel production from Jatropha curcus using CaSO4/Fe2O3-SiO2 core-shell magnetic nanoparticles. J. Clean. Prod. 2019, 208, 816–826. [Google Scholar] [CrossRef]
  25. Ahsan, M.A.; Jabbari, V.; Islam, M.T.; Turley, R.S.; Dominguez, N.; Kim, H.; Castro, E.; Hernandez-Viezcas, J.A.; Curry, M.L.; Lopez, J.; et al. Sustainable synthesis and remarkable adsorption capacity of MOF/graphene oxide and MOF/CNT based hybrid nanocomposites for the removal of Bisphenol A from water. Sci. Total Environ. 2019, 673, 306–317. [Google Scholar] [CrossRef] [PubMed]
  26. Mittal, A.; Kaur, D.; Malviya, A.; Mittal, J.; Gupta, V. Adsorption studies on the removal of coloring agent phenol red from wastewater using waste materials as adsorbents. J. Colloid Interface Sci. 2009, 337, 345–354. [Google Scholar] [CrossRef] [PubMed]
  27. Vijayakumar, G.; Tamilarasan, R.; Dharmendirakumar, M. Adsorption, kinetic, equilibrium and thermodynamic studies on the removal of basic dye Rhodamine-B from aqueous solution by the use of natural adsorbent perlite. J. Mater. Environ. Sci. 2012, 3, 157–170. [Google Scholar]
  28. Akl, M.; Youssef, A.; Al-Awadhi, M. Adsorption of acid dyes onto bentonite and surfactant-modified bentonite. J. Anal. Bioanal. Tech. 2013, 4, 3–7. [Google Scholar]
  29. Fost, S.D.; Aly, M.O. Adsorption Processes for Water Treatment; Betterworth Publications: Stoneharm, MA, USA, 1981. [Google Scholar]
  30. Hill, T.L. Statistical mechanics of multimolecular adsorption II. Localized and mobile adsorption and absorption. J. Chem. Phy. 1946, 14, 441–453. [Google Scholar] [CrossRef]
  31. Ayawei, N.; Ekubo, A.T.; Wankasi, D.; Dikio, E.D. Adsorption of congo red by Ni/Al-CO3: Equilibrium, thermodynamic and kinetic studies. Orient. J. Chem. 2015, 31, 1307–1318. [Google Scholar] [CrossRef]
  32. Vijayaraghavan, K.; Padmesh, T.V.N.; Palanivelu, K.; Velan, M. Biosorption of nickel(II) ions onto Sargassum wightii: Application of two-parameter and three-parameter isotherm models. J. Hazard. Mater. 2006, 133, 304–308. [Google Scholar] [CrossRef] [PubMed]
  33. Foo, K.Y.; Hameed, B.H. Insights into the modeling of adsorption isotherm systems. Chem. Eng. J. 2010, 156, 2–10. [Google Scholar] [CrossRef]
  34. Papic, S.; Koprivanac, N.; Metes, A. Optimizing polymer-induced flocculation process to remove reactive dyes from wastewater. Environ. Technol. 2000, 21, 97–105. [Google Scholar] [CrossRef]
  35. Zouboulis, A.; Loukidou, M.; Matis, K. Biosorption of toxic metals from aqueous solutions by bacteria strains isolated from metal-polluted soils. Process Biochem. 2004, 39, 909–916. [Google Scholar] [CrossRef]
  36. Vimonses, V.; Lei, S.; Jin, B.; Chow, C.W.; Saint, C. Kinetic study and equilibrium isotherm analysis of Congo Red adsorption by clay materials. J. Chem. Eng. 2009, 148, 354–364. [Google Scholar] [CrossRef]
  37. Kerie, E.; Alemu, A. Removal of acid yellow dye 17 from aqueous solutions using an activated bone char. Water Qual. Res. J. 2022, 57, 278–290. [Google Scholar] [CrossRef]
  38. Ahmadi, S.; Mohammadi, L.; Rahdar, A.; Rahdar, S.; Dehghani, R.; Adaobi Igwegbe, C.; Kyzas, G.Z. Acid dye removal from aqueous solution by using neodymium(III) oxide nanoadsorbents. Nanomaterials 2020, 10, 556. [Google Scholar] [CrossRef] [PubMed]
  39. Saraei, N.; Khanal, M.; Tizghadam, M. Removing acidic yellow dye from wastewater using Moringa peregrina. Comput. Res. Prog. Appl. Sci. Eng. 2022, 8, 2483. [Google Scholar] [CrossRef]
  40. Ashraf, M.A.; Hussain, M.; Mahmood, K.; Wajid, A.; Yusof, M.; Alias, Y.; Yusoff, I. Removal of acid yellow-17 dye from aqueous solution using eco-friendly biosorbent. Desalin. Water Treat. 2013, 51, 4530–4545. [Google Scholar] [CrossRef]
  41. Alemu, A.; Kerie, E. Removal of acid yellow 17 dye from aqueous solutions using activated water hyacinth (Eichhornia crassipes). Water Pract. Technol. 2022, 17, 1294–1304. [Google Scholar] [CrossRef]
  42. Praipipat, P.; Ngamsurach, P.; Prasongdee, V. Comparative reactive blue 4 dye removal by lemon peel bead doping with iron(III) oxide-hydroxide and zinc oxide. ACS Omega 2022, 7, 41744–41758. [Google Scholar] [CrossRef]
  43. Khan, J.; Sayed, M.; Ali, F.; Khan, H.M. Removal of acid yellow 17 dye by Fenton oxidation process. Z. Für Phys. Chem. 2018, 232, 507–525. [Google Scholar] [CrossRef]
  44. Albanis, T.; Hela, D.; Sakellarides, T.; Danis, T. Removal of dyes from aqueous solutions by adsorption on mixtures of fly ash and soil in batch and column techniques. Glob. Nest Int. J. 2000, 2, 237–244. [Google Scholar]
  45. Kabir, S.M.F.; Cueto, R.; Balamurugan, S.; Romeo, L.D.; Kuttruff, J.T.; Marx, B.D.; Negulescu, I.I. Removal of acid dyes from textile wastewaters using fish scales by absorption process. Clean Technol. 2019, 1, 311–324. [Google Scholar] [CrossRef]
  46. Saleh, T.A. Kinetic models and thermodynamics of adsorption processes: Classification. In Interface Science and Technology; Elsevier: Amsterdam, The Netherlands, 2022; pp. 65–97. [Google Scholar]
  47. Goswami, L.; Kushwaha, A.; Kafle, S.R.; Kim, B.-S. Surface modification of biochar for dye removal from wastewater. Catalysts 2022, 12, 817. [Google Scholar] [CrossRef]
Figure 1. Structure of Acteray Golden 741 dye.
Separations 10 00538 g001
Figure 2. Flow chart for the preparation of composite materials.
Separations 10 00538 g002
Figure 3. FTIR spectra of (a) SC + quartz (unmodified) (b) SC + quartz + potassium ferricyanide + sodium metasilicate (modified quartz).
Separations 10 00538 g003
Figure 4. SEM micrograph of unmodified (ac) and modified (df) quartz at various resolutions, 200 nm, 500 nm, 1 µm.
Separations 10 00538 g004
Figure 5. XRD analysis of (a) SC + quartz (unmodified) and (b) SC + quartz + potassium ferricyanide + sodium metasilicate (modified quartz).
Separations 10 00538 g005
Figure 6. (a) BET adsorption–desorption isotherms and (b) the pore size distribution of (a) SC + quartz (unmodified) (b) SC + quartz + potassium ferricyanide + sodium metasilicate (modified quartz).
Separations 10 00538 g006
Figure 7. Effect of pH on dye removal using various composites.
Separations 10 00538 g007
Figure 8. The effect of initial dye concentration on dye removal using various composites.
Separations 10 00538 g008
Figure 9. Adsorption process and mechanism for dye removal.
Separations 10 00538 g009
Figure 10. Reusability of SC + quartz + potassium ferricyanide + sodium metasilicate composite study.
Separations 10 00538 g010
Table 1. BET analysis of SC + quartz and SC + quartz + potassium ferricyanide + sodium metasilicate.
Materials BET Specific Surface Area (m2/g)Pore Volume (cm3/g)Average Pore Size (nm)
SC + Quartz4.020.0193.34
SC + quartz + potassium ferricyanide + sodium metasilicate7.200.0253.27
Table 2. Adsorption isotherms fitted to dye concentration data.
ModelsAdsorbentsR2QeQoKnβEAB
Langmuir IsothermSindh Clay0.15648.293964909.00.011
SC + K0.11957.8161231250147.87
SC + Na0.032910.8538350000.002
SC + Mix0.121716.9633810000.0085
Quartz0.351622.356161111.10.073
Quartz + K0.993542.25485833.30.235
Quartz + Na0.981248.500921666.60.187
Quartz + Mix0.299119.830423333.30.0256
SC + Q0.988641.70874769.20.236
SC + Q + K0.932544.917111666.60.115
SC + Q + Na0.911119.8304220000.111
SC + Q + Mix0.96436.0429114280.166
Freundlich IsothermSindh Clay0.81848.29396496.820.9171.089
SC + K0.90897.8161239.7830.2461.0319
SC + Na0.965110.8538311.830.2921.006
SC + Mix0.828516.9633811.500.30190.98
Quartz0.9956 22.3561622.934.1621.876
Quartz + K0.95942.2548522.0211.120.1735
Quartz + Na0.652848.5009243.2817.300.246
Quartz + Mix0.567219.8304243.165.841.750
SC + Q0.668241.7087422.966.4292.994
SC + Q + K0.595844.9171142.8611.062.64
SC + Q + Na0.556219.8304244.6613.182.90
SC + Q + Mix0.605436.0429139.7610.192.812
Dubinin IsothermSindh Clay0.98288.2939647.314 9 × 10−6238.09
SC + K0.94447.8161236.025 9 × 10−6238.09
SC + Na0.85310.853836.855 7 × 10−6267.37
SC + Mix0.402216.963386.269 5 × 10−6316.45
Quartz0.302922.3561620.32 3 ×10−6409.83
Quartz + K0.713642.2548519.51 1 × 10−6709.21
Quartz + Na0.413748.5009237.22 2 × 10−6500
Quartz + Mix0.357919.8304237.95 9 × 10−6238.09
SC + Q0.940741.7087420.05 2 × 10−6500
SC + Q + K0.524844.9171138.47 4 × 10−6354.60
SC + Q + Na0.41319.8304239.30 3 × 10−6413.223
SC + Q + Mix0.758236.0429137.49 3 × 10−6409.83
Temkin IsothermSindh Clay0.98448.293964 3.18550.384
SC + K0.98917.816123 3.08410.268
SC + Na0.926710.85383 4.16060.252
SC + Mix0.661116.96338 6.21490.199
Quartz0.341322.35616 11.050.443
Quartz + K0.950742.25485 3.08422.78
Quartz + Na0.710748.50092 10.841.708
Quartz + Mix0.293119.83042 9.5161.110
SC + Q0.773941.70874 4.2043.485
SC + Q + K0.69444.91711 10.8021.329
SC + Q + Na0.677819.83042 10.8461.708
SC + Q + Mix0.707236.04291 8.77582.011
Herkin–Jura IsothermSindh Clay0.52438.293964 −0.876−1.411
SC + K0.58567.816123 −0.688−1.384
SC + Na0.640410.85383 −1.177−1.401
SC + Mix0.951316.96338 −2.878−1.505
Quartz0.839122.35616 −104.16−1.666
Quartz + K0.939642.25485 −370.3−2.407
Quartz + Na0.511548.50092 −833.3−2
Quartz + Mix0.27619.83042 −277.7−1.66
SC + Q0.463541.70874 −75.18−1.593
SC + Q + K0.41744.91711 −0.0026−1.629
SC + Q + Na0.328919.83042 −526.3−1.789
SC + Q + Mix0.417536.04291 −0.0034−1.617
Table 3. The pseudo-first-order kinetic model fitted to dye removal data.
TemperatureAdsorbentsR2QeQOK
30 °CSindh Clay0.913247.3745851.700.0156
SC + K0.643432.6297517.980.0092
SC + Na0.922733.9267522.940.0131
SC + Mix0.606839.1147429.880.011
Quartz0.833564.9864589.920.0165
Quartz + K0.243966.9660816.830.0096
Quartz + Na0.944755.7709446.530.015
Quartz + Mix0.836242.6644230.980.0126
SC + Q0.865638.5686435.050.0133
SC + Q + K0.896147.7158936.460.0138
SC + Q + Na0.755440.1386926.280.0156
SC + Q + Mix0.819237.0668523.780.0117
40 °CSindh Clay0.955948.6715849.780.0163
SC + K0.906550.7194776.450.0165
SC + Na0.915840.3434846.310.0147
SC + Mix0.881342.8009554.500.0151
Quartz0.908153.7913167.760.00016
Quartz + K0.91257.2727292.000.0172
Quartz + Na0.869664.78166111.170.0175
Quartz + Mix0.925153.6547865.320.0161
SC + Q0.874853.3134680.350.163
SC + Q + K0.956235.7015938.120.0142
SC + Q + Na0.847348.1254752.500.0147
SC + Q + Mix0.855151.3338461.840.0154
50 °CSindh Clay0.952148.1937338.770.0142
SC + K0.940740.0021631.850.0135
SC + Na0.911641.9817937.110.0138
SC + Mix0.918945.121954.520.015
Quartz0.845146.96555.110.014
Quartz + K0.924949.9003137.320.0138
Quartz + Na0.852354.2691560.100.0151
Quartz + Mix0.871643.824935.390.0133
SC + Q0.869445.8045335.900.0133
SC + Q + K0.875944.0296935.250.0135
SC + Q + Na0.859548.6033141.830.013
SC + Q + Mix0.905155.088364.610.0158
60 °CSindh Clay0.964667.7852490.240.0165
SC + K0.823141.3674335.900.013
SC + Na0.831941.2991638.550.013
SC + Mix 0.881644.4392648.710.014
Quartz0.774636.8620628.990.012
Quartz + K0.85562.5972471.260.015
Quartz + Na0.833440.4117438.660.013
Quartz + Mix0.757138.0225421.030.010
SC + Q0.812738.636929.840.0124
SC + Q + K0.805543.8931637.710.0131
SC + Q + Na0.811138.090821.380.0115
SC + Q + Mix0.749738.4321128.750.012
70 °CSindh Clay0.208529.080072.955−0.0014
SC + K0.116420.478922.293−0.0034
SC + Na0.286726.963927.480.0055
SC + Mix0.91525.8034412.720.010
Quartz0.921433.0393327.460.0126
Quartz + K0.797651.1290542.830.013
Quartz + Na0.168931.05973.21−0.003
Quartz + Mix0.775828.533978.020.0089
SC + Q0.749333.2441214.340.0096
SC + Q + K0.933726.008237.700.0080
SC + Q + Na0.734135.1554917.330.010
SC + Q + Mix0.814331.8788619.150.010
Table 4. A comparison of various materials for acid yellow dye removal.
MaterialDye% RemovedReferences
SC + Quartz + Potassium ferricyanide + Sodium metasilicateAcetary Golden96.26The present study
Activated bone charAcid Yellow-1791.43[37]
Neodymium(III) Oxide NanoadsorbentsAcid Blue 9290.70[38]
Moringa peregrina seedsAcid Yellow80.00[39]
Typha angustata L.Acid Yellow-1789.98[40]
Activated water hyacinthAcid Yellow-1792.26[41]
Lemon peel beads-doped iron(III) oxide-hydroxide (LBF) Reactive Blue 483.55 [42]
Lemon peel beads-doped zinc oxide (LBZ) Reactive Blue 466.64[42]
H2O2/Fe2+Acid Yellow-1789.00[43]
Fly ash mixtures with a sandy clay loam soilAcid Yellow-753.00[44]
Fly ash mixtures with a sandy clay loam soilAcid Yellow-2344.90[44]
Fish scalesAcid Yellow-12793.00[45]
Disclaimer/Publisher’s Note: The statements, opinions and data contained in all publications are solely those of the individual author(s) and contributor(s) and not of MDPI and/or the editor(s). MDPI and/or the editor(s) disclaim responsibility for any injury to people or property resulting from any ideas, methods, instructions or products referred to in the content.

