Article

Anaerobic Digestion of Phosphorus-Rich Sludge and Digested Sludge: Influence of Mixing Ratio and Acetic Acid

1
State Key Laboratory of Pollution Control and Resource Reuse, College of Environmental Science and Engineering, Tongji University, Shanghai 200092, China
2
Shanghai Institute of Pollution Control and Ecological Security, Shanghai 200092, China
3
CNBM Environmental Protection Research Institute (Jiangsu) Co., Ltd., Yancheng 224051, China
*
Authors to whom correspondence should be addressed.
Separations 2023, 10(10), 539; https://doi.org/10.3390/separations10100539
Submission received: 5 September 2023 / Revised: 9 October 2023 / Accepted: 10 October 2023 / Published: 12 October 2023
(This article belongs to the Special Issue Removal and Recovery of Nitrogen and Phosphorus from Wastewater)

Abstract

:
Phosphorus is a critical influencial factor in the anaerobic digestion of phosphorus-rich sludge (PRS). The anaerobic digestion of PRS and digested sludge (DS) mixed according to different proportions was studied. The result showed that the phosphorus release rate of the mixed sludge increased with the increase in DS proportion until the DS proportion was over 50%. When the mixing ratio of PRS to DS was 3:1, the specific phosphorus release rate (SPRR) was increased by 20% and the methane production was raised to 7.39 mL/g VSS. A further experiment on the concentration of the added acetic acid indicated that the phosphorus release rate also tended to rise with the increase in acetic acid until the concentration was over 500 mg COD/L. Finally, the results of the anaerobic digestion of DS and waste activated sludge (WAS) showed that there was no typical phosphorus release in the initial stage of anaerobic digestion in WAS.

1. Introduction

Phosphorus is a common nutrient pollutant in domestic wastewater and is primarily removed at municipal wastewater treatment plants (WWTPs) [1]. After a series of treatments, a large amount of phosphorus will remain in the sludge, which is commonly known as phosphorus-rich sludge (PRS). It has been reported that about 90% of non-renewable phosphorus in sewage is eventually concentrated in the sludge, accounting for 2–5% of the dry weight of the sludge [2,3,4]. There are three main types of PRS: the chemical sludge produced via chemical phosphorus removal with iron or aluminum salts, the biological sludge discharged from the enhanced biological phosphorus removal (EBPR) system, and the ash from sludge incineration. For chemical sludge, destroying its sludge structure is important to enhance the phosphorus release, and anaerobic digestion is one feasible treatment method. As biological sludge is rich in ammonia nitrogen, phosphorus can be recovered via struvite precipitation. Phosphorus in ash mainly exists in the form of phosphate precipitates, and chemical extraction is the most effective way to dissolve and recover this [5].
Anaerobic digestion is one of the common reutilization technologies for the residual sludge. During the anaerobic digestion of PRS, 60–80% of the total phosphorus will be released again, so that the phosphorus concentration in the digestate can reach 100 mg/L–500 mg/L, even up to 1500 mg/L [6,7,8]. This part of phosphorus can easily be precipitated with Mg2+, Ca2+, etc., under suitable conditions, and these precipitates will block the pipeline of the digester, finally increasing the maintenance and management costs of WWTPs [9,10,11,12]. In addition, the return of the digestate to the sewage treatment system will increase the phosphorus load of the system, which will affect the phosphorus removal effect and make the phosphorus in the effluent exceed the discharge standard. High concentrations of phosphorus also affect the metabolism of anaerobic microorganisms in the system. Rudolfs and Stahl [13] added different phosphorus-containing compounds during anaerobic digestion and found that the degradation rate of organics decreased with the increase in phosphorus-containing compound dosage, indicating that excess phosphorus was not conducive to the metabolism of hydrolytic acidifying bacteria and syntrophic acetogenic bacteria. The experiments conducted by Takiguchi et al. [14] also indicated that the high concentration of phosphorus in the digestate may influence the methane production. Furthermore, Kuroda et al. [9] found that nearly all of the polyphosphate or 87% of total phosphorus (TP) could be released from activated sludge after thermal pretreatment (70 °C, 1 h). This finally caused the significant improvement in the digestion efficiency and methane production. However, Carliell-Marquet and Wheatley [8] suggested that when the concentration of dissolved orthophosphate in the digestate exceeded 250 mg/L, the degradation rate of organics and the rate of methane production would decrease, and the inhibition of phosphorus is reversible. Kleyböcker et al. [15] added calcium oxide to the collapsed digestion system and found that the system could quickly recover, in which polyphosphate accumulating organisms (PAOs) played an important role.
It can be seen that the recovery of phosphorus from PRS can not only ensure the stable operation of the anaerobic digestion system, but also be a cost-effective resource utilization strategy. At present, a large number of technical methods for recovering phosphorus from PRS have been developed. Liu et al. [16] used several pretreatments for PRS from food-processing wastewater and found that the anaerobic digestion after enzymatic hydrolysis pretreatment combined with thermal hydrolysis pretreatment significantly increased the accumulation of ammonia nitrogen and orthophosphate in the hydrolysate for struvite recovery in which the phosphorus recovery rate could reach up to 68.0%. Ping et al. [17] reported that during anaerobic digestion, a novel composite CaO2 bead could improve total short-chain fatty acid (TSCFA) production and phosphorus recovery from PRS acquired from a WWTP in which an iron-based coagulant was used. The highest TSCFAs production was observed at 356 mg/g VSS and about 9% of phosphorus in sludge could be recovered on beads. It is also reported that rhamnolipid, a kind of surfactant, had a significant impact on the phosphorus release and acidogenic fermentation of PRS produced with aluminum-based coagulants because the addition of rhamnolipid was conducive to produce propionate from PRS during anaerobic digestion [18]. Peroxydisulfate pre-oxidation was applied by Ding et al. [19] to enhance volatile fatty acid (VFA) production and iron-bound phosphorus release during anaerobic digestion, which showed an increase in the concentration of recoverable phosphorus by 49.3% along with enhanced VFA production. Zhang et al. [20] proposed a novel approach for the enhancement of phosphorus recovery from PRS by co-fermentation with protein-rich biomass (PRB). The results showed that PRBs with strong surface hydrophobicity and loose structure facilitated the hydrolysis and acidogenesis processes, contributing to an increase in the soluble orthophosphate and VFAs by 88.3% and 531.3%, respectively.
Meanwhile, research has shown that mixing different types of sludge can effectively improve the performance of anaerobic digestion. Hu et al. [21] studied the performance of anaerobic digestion of waste activated sludge (WAS) and flocculated sludge under different mixing ratios, and the results showed that when the mixing ratio of WAS to flocculated sludge was 2:1, compared with the separate digestion of flocculent sludge and WAS, the gas production rate increased by 132 mL/g and 157 mL/g, respectively, and the VS degradation rate increased by 13.2% and 9.4%, respectively. Sun et al. [22] reported that mixed sludge of primary sludge and secondary sludge could induce positive effects on both organics releasing in extracellular polymeric substances (EPS) and VFAs in the two-stage anaerobic digestion. When the mixing ratio of primary sludge to secondary sludge was 1:3, the two-stage anaerobic digestion of the mixed sludge showed the best biogas yield, and the cumulative hydrogen yield and methane yield reached 100.5 mL and 2643.6 mL, respectively. At the same time, the VS degradation rate of mixed sludge reached 14.2%. Under anaerobic conditions and in the presence of acetic acid, PAOs in PRS will absorb extracellular acetic acid and decompose intracellular polyphosphate, releasing orthophosphate outside the cell. Meanwhile, methanogens in DS can also adopt easily degradable organic carbon sources as substrates, especially acetic acid. Therefore, under the situation of a mixture of PRS and DS, the competition for carbon sources exists during the anaerobic digestion process. Yang [23] reported that the concentration of acetic acid ranging from 80 to 240 mg COD/L did not affect the initial phosphorus release rate during the anaerobic digestion of PRS, while it affected the maximum phosphorus release. When the concentration of acetic acid exceeded 300 mg COD/L, the polyphosphate particles were released completely, and increasing the concentration of acetic acid would not improve the phosphorus release. Xiao [24] studied the kinetics of acetic acid uptake of PRS during anaerobic digestion under different acetic acid concentrations. It was found that when the concentration of added acetic acid ranged from 60 to 380 mg/L, the absorption rate of acetic acid was independent of its concentration. When the concentration of acetic acid exceeded 444 mg/L, the excessively high concentration of acetic acid reduced the concentration of intracellular polyphosphate, and thus inhibited the absorption of acetic acid by PAOs. However, due to the different substrates and operating conditions adopted in anaerobic digestion, the concentration of acetic acid generated during the process varies a lot. In order to comprehensively study the influence mechanism, studies with a wider range of acetic acid concentrations are needed.
Based on the above mentioned considerations, the phosphorus release of sludge with different mixing ratios was conducted, and the impact of carbon source competition during the process was also evaluated. Firstly, the effect of the mixing ratio of PRS and DS on phosphorus release in PRS and methane production in DS during anaerobic digestion was investigated. Then, the effect of additional acetic acid concentration on anaerobic digestion was further conducted after the optimal ratio was achieved. Finally, the anaerobic digestion of WAS and DS was compared with those of PRS and DS. Our study provides valuable information on the release of phosphorus during anaerobic digestion and gives support for the design and regulation of practical projects.

2. Materials and Methods

2.1. Source of Sludge

WAS was acquired from the secondary sedimentation tank of a municipal WWTP in Shanghai, China. The sludge was filtered using a 1 mm × 1 mm screen and then concentrated via standing settling for about 24 h. The preprocessed WAS was then added to two different sequencing batch reactors to culture PRS and DS, respectively.
PRS was obtained from a reactor with a working volume of 11 L and the main parameters of this reactor were as follows: temperature 20–22 °C, stirring speed 200 rpm, sludge retention time 11 d, and hydraulic retention time 11 h. The reactor ran 4 cycles per day, with each cycle lasting 6 h. One cycle was divided into six stages: feeding (17 min), anaerobic reaction (90 min), aerobic reaction (180 min), sludge discharge and sedimentation (68 min), and drainage (5 min). CH3COONa, KH2PO4 and NH4Cl were used as carbon and nutrients sources. In addition, CaCl2, MgSO4·7H2O and trace elements were also supplied during the cultivating of PRS.
DS was obtained from a reactor with a working volume of 4 L and the main parameters of this reactor were as follows: temperature 30–35 °C, stirring speed 200 rpm, and sludge retention time 25 d. The reactor was operated intermittently, and methane produced was collected through a gas collection bag. Sludge was discharged every two days, and 320 mL of the mixed liquor was discharged each time. Then, 320 mL of concentrated secondary sludge was added to maintain the mixed liquor suspended solid (MLSS) in the reactor at approximately 20 g/L. During the discharge process, the pH inside the digester was simultaneously measured to ensure that the pH value was between 6.6 and 7.6.
The characteristics of PRS and DS are shown in Table 1.

2.2. Analyses

The pH was determined using a JENCO60l0 pH meter (JENCO, Huber Heights, OH, USA). Chemical oxygen demand (COD), TP, total inorganic orthophosphate (TIP), total ammonia nitrogen (TAN), NO3-N, NO2-N, total organic carbon (TOC), total nitrogen (TN), MLSS, and mixed liquor volatile suspended solid (MLVSS) were measured according to the Standard Methods [25]. The metal ions were measured using an inductively coupled plasma-optical emission spectrometer (ICP-OEC, PerkinElmer Optima 2100DV, USA).
The produced gas produced during the anaerobic process was collected and methane yield was monitored using a gas chromatograph with thermal conductivity detector (GC-TCD, Agilent 6890N, Santa Clara, CA, USA). Chromatographic column models included 80/100 M Hayseq Q 0.5 M × 1/8 in pre-column (column 1), 80/100 M Hayseq Q 6 ft × 1/8 in (column 2) and 60/100 M Molsieve 5A 6 ft × 1/8 in (column 3). The operating temperatures of the injector, oven and detector were 120 °C, 35 °C and 250 °C, respectively. The carrier gas was helium, and its flow rate was 20 mL/min. The gas injection volume was 200 µL.
The volatile fatty acids (VFAs) were measured using a gas chromatograph with flame ionization detector (GC-FID, Agilent 7890N, Santa Clara, CA, USA). Before measurement, the sample was first filtered with medium-speed qualitative filter paper, and then filtered through a 0.45 µm filter membrane. The filtrate was collected in a 2 mL brown bottle specifically for gas chromatography, and then 50~150 µL of 3% H3PO4 was added to adjust the pH of the sample to less than 6.0. The injection method was split injection, and the inlet temperature was 200 °C. The detector temperature was 220 °C. The chromatographic column was a 30.0 m × 530 μm × 1 μm J&W125-7332 capillary column, and nitrogen was used as the carrier gas. The carrier gas flow rate at the injection was 38.659 mL/min without splitting. The column pressure was 4.48 psi, and the carrier gas flow rate was 100 cm3/s. The column temperature rose from 55 °C (maintained for 1 min) to 110 °C at a rate of 30 °C/min; held for 1 min, and then increased to 200 °C at a rate of 10 °C/min; and finally, increased to 220 °C at a rate of 30 °C/min. The sample injection volume was 1 μL and the instrument detection limit was 0.1 mg/L.
The specific phosphorus release rate (SPRR) was calculated using the following formula [26]:
SPRR = Δc/(MLVSS × t)
where Δc was the released concentration of TIP (mg/L); MLVSS was the concentration of the mixed sludge (g/L); and t was the reaction time (h).

2.3. Experimental Set-Up

2.3.1. Anaerobic Digestion of PRS and DS with Different Mixing Ratios under the Same Acetic Acid Concentration

Five glass serum bottles (600 mL), respectively, named A1–A5 were used for batch tests. Every bottle contained 390 mL mixed sludge and 10 mL sodium acetate solution. The mixing ratios of the substrates are shown in Table 2. All bottles were purged with nitrogen gas for 2 min to remove oxygen. The bottles were placed in a shaker (130 rpm) under mesophilic (35 ± 1 °C) conditions and then subjected to anaerobic digestion for 6 d. The pH was controlled to 7.0 with NaOH and HCl during the experiment. All tests were performed in duplicate.

2.3.2. Anaerobic Digestion of PRS and DS with the Same Mixing Ratio under Different Acetic Acid Concentrations

Four glass serum bottles (600 mL), respectively, named B1–B4 were used for batch tests. Every bottle contained 390 mL mixed sludge and 10 mL sodium acetate solution. The mixing ratios of the substrates are shown in Table 3. All bottles were purged with nitrogen gas for 2 min to remove oxygen. The bottles were placed in a shaker (130 rpm) under mesophilic (35 ± 1 °C) conditions and then subjected to anaerobic digestion for 7 d. The pH was controlled to 7.0 with NaOH and HCl during the experiment. All tests were performed in duplicate.

2.3.3. Anaerobic Digestion of WAS and DS with Different Mixing Ratios under the Same Acetic Acid Concentration

Six glass serum bottles (600 mL), respectively, named C1–C6 were used for batch tests. Every bottle contained 390 mL mixed sludge and 10 mL sodium acetate solution. The mixing ratios of the substrates are shown in Table 4. All bottles were purged with nitrogen gas for 2 min to remove oxygen. The bottles were placed in a shaker (130 rpm) under mesophilic (35 ± 1 °C) conditions and then subjected to anaerobic digestion for 8 d. The pH was controlled to 7.0 with NaOH and HCl during the experiment. All tests were performed in duplicate.

3. Results and Discussion

3.1. Phosphorus Release during Anaerobic Digestion

The phosphorus release during anaerobic digestion was mainly studied as the change in the concentration of TIP. Figure 1a shows that A1~A4 released TIP in a similar trend. A1~A4 released TIP rapidly in the first 0.5 d of anaerobic digestion, then TIP decreased slightly and remained stable. TIP of A1 and A2 reached 860 mg/L and 671 mg/L within 2 d, respectively; while TIP of A3 and A4 reached 509 mg/L and 310 mg/L within 0.5 d, respectively. Obviously, the higher the proportion of PRS, the more phosphorus released. During the entire anaerobic digestion, TIP of A5 remained at about 145 mg/L, so it can be seen that the increase in TIP of A1~A4 was mainly from the anaerobic metabolism of PRS. Under anaerobic conditions, PAOs can decompose intracellular polyphosphate to provide energy for the absorption of extracellular carbon sources and release TIP out of the cell. A1~A4 were all added with 3000 mg COD/L acetic acid, so the anaerobic phosphorus release was obvious in the first 0.5 d. But with the gradual decomposition of polyphosphate, the release rate of TIP decreased, and the amount of released TIP tended to stabilize.
As shown in Figure 1b, TIP of B4 was significantly different from the others because of the absence of acetic acid, but TIP of B1~B3 shared the same trend. In the first 2 days, the release rate of TIP of B1~B3 was much higher than that of B4. In the initial stage of anaerobic digestion, PAOs decompose intracellular polyphosphate to provide energy for absorbing extracellular acetic acid [27]. During this process, PAOs would compete with other microorganisms (such as methanogens) for carbon sources, resulting in an increase in the phosphorus release rate. In the B4 group, the concentration of the carbon source was low because no additional acetic acid was added, also the generated acetic acid was low in the first 2 days during anaerobic digestion. Thus, the competition between PAOs and other microorganisms would not occur. This finally resulted in a slow phosphorus release rate during the process.
On the first day, TIP of B1~B3 reached its maximum at 519 mg/L, 508 mg/L and 519 mg/L, respectively. Then, TIP decreased slightly and remained stable after 4 days. It can be seen that the initial stage (0~1 d) of anaerobic digestion of mixed sludge was dominated by the anaerobic metabolism of PRS. Acetic acid was not added in B4, so PRS provided the energy needed for cell maintenance by slowly decomposing intracellular polyphosphate under anaerobic conditions. The result was consistent with Xiao’s study [24], suggesting that if the acetic acid concentration exceeded 500 mg COD/L, it had less effect on phosphorus release. In addition, the release of TIP presented in Figure 1c showed three distinct stages within 8 days. In the first 0.5 d, the release rate of TIP was the fastest. Between 0.5 d and 2 d, the growth of the release rate slowed down. After 2 d, the release rate remained stable. The released amount of TIP was not as high as in previous experiments, and the maximum was only about 180 mg/L. It is because the phosphorus content of WAS was as low as 2.0%. WAS taken from WWTP was concentrated by settling for about 24 h in the laboratory, so the sludge experienced one day under anaerobic conditions. According to the conclusion of Jardin et al. [27], some phosphorus had been released during this time.
The SPRR was calculated for analyzing the difference in the phosphorus release process more specifically. Table 5 shows that the addition of DS in A1~A4 increased the SPRR of PRS. With the increase in the proportion of DS in mixed sludge, the SPRR also increased correspondingly. However, when the proportion of DS exceeded 50%, the SPRR did not increase but decreased. Similarly, the addition of acetic acid in B1~B4 also increased the SPRR by 16.7–0.6% but when the concentration of acetic acid exceeded 500 mg/L, the SPRR did not continue to increase. Chen et al. [28] reported that the maximum phosphorus release rate increased significantly with the increase in the initial acetic acid concentration, which indicated that the addition of acetic acid could cause phosphorus in PRS to be released quickly in a short period of time. It was also reported that the initial acetic acid concentration had little effect on the maximum phosphorus release, and 73.1 ± 2.2% of the total phosphorus was released into the liquid phase in the form of phosphate, which was mainly from the decomposition of polyphosphate. With the increase in the proportion of DS in C1~C4, the SPRR also gradually increased. However, the SPRR of C1~C4 was much lower than that of A1~A4, which indicated that WAS did not have the typical anaerobic phosphorus release phenomenon in the initial stage of anaerobic digestion. The difference between C2 and C6 was that acetic acid was added to C2, but the SPRR of C2 and C6 was not much different. It can be seen that the SPRR of the mixed anaerobic digestion of WAS and DS will not be greatly affected by the addition of acetic acid. This further shows that WAS does not absorb acetic acid and release a large amount of phosphorus in the initial stage of anaerobic digestion.

3.2. Variations of Metal Ions

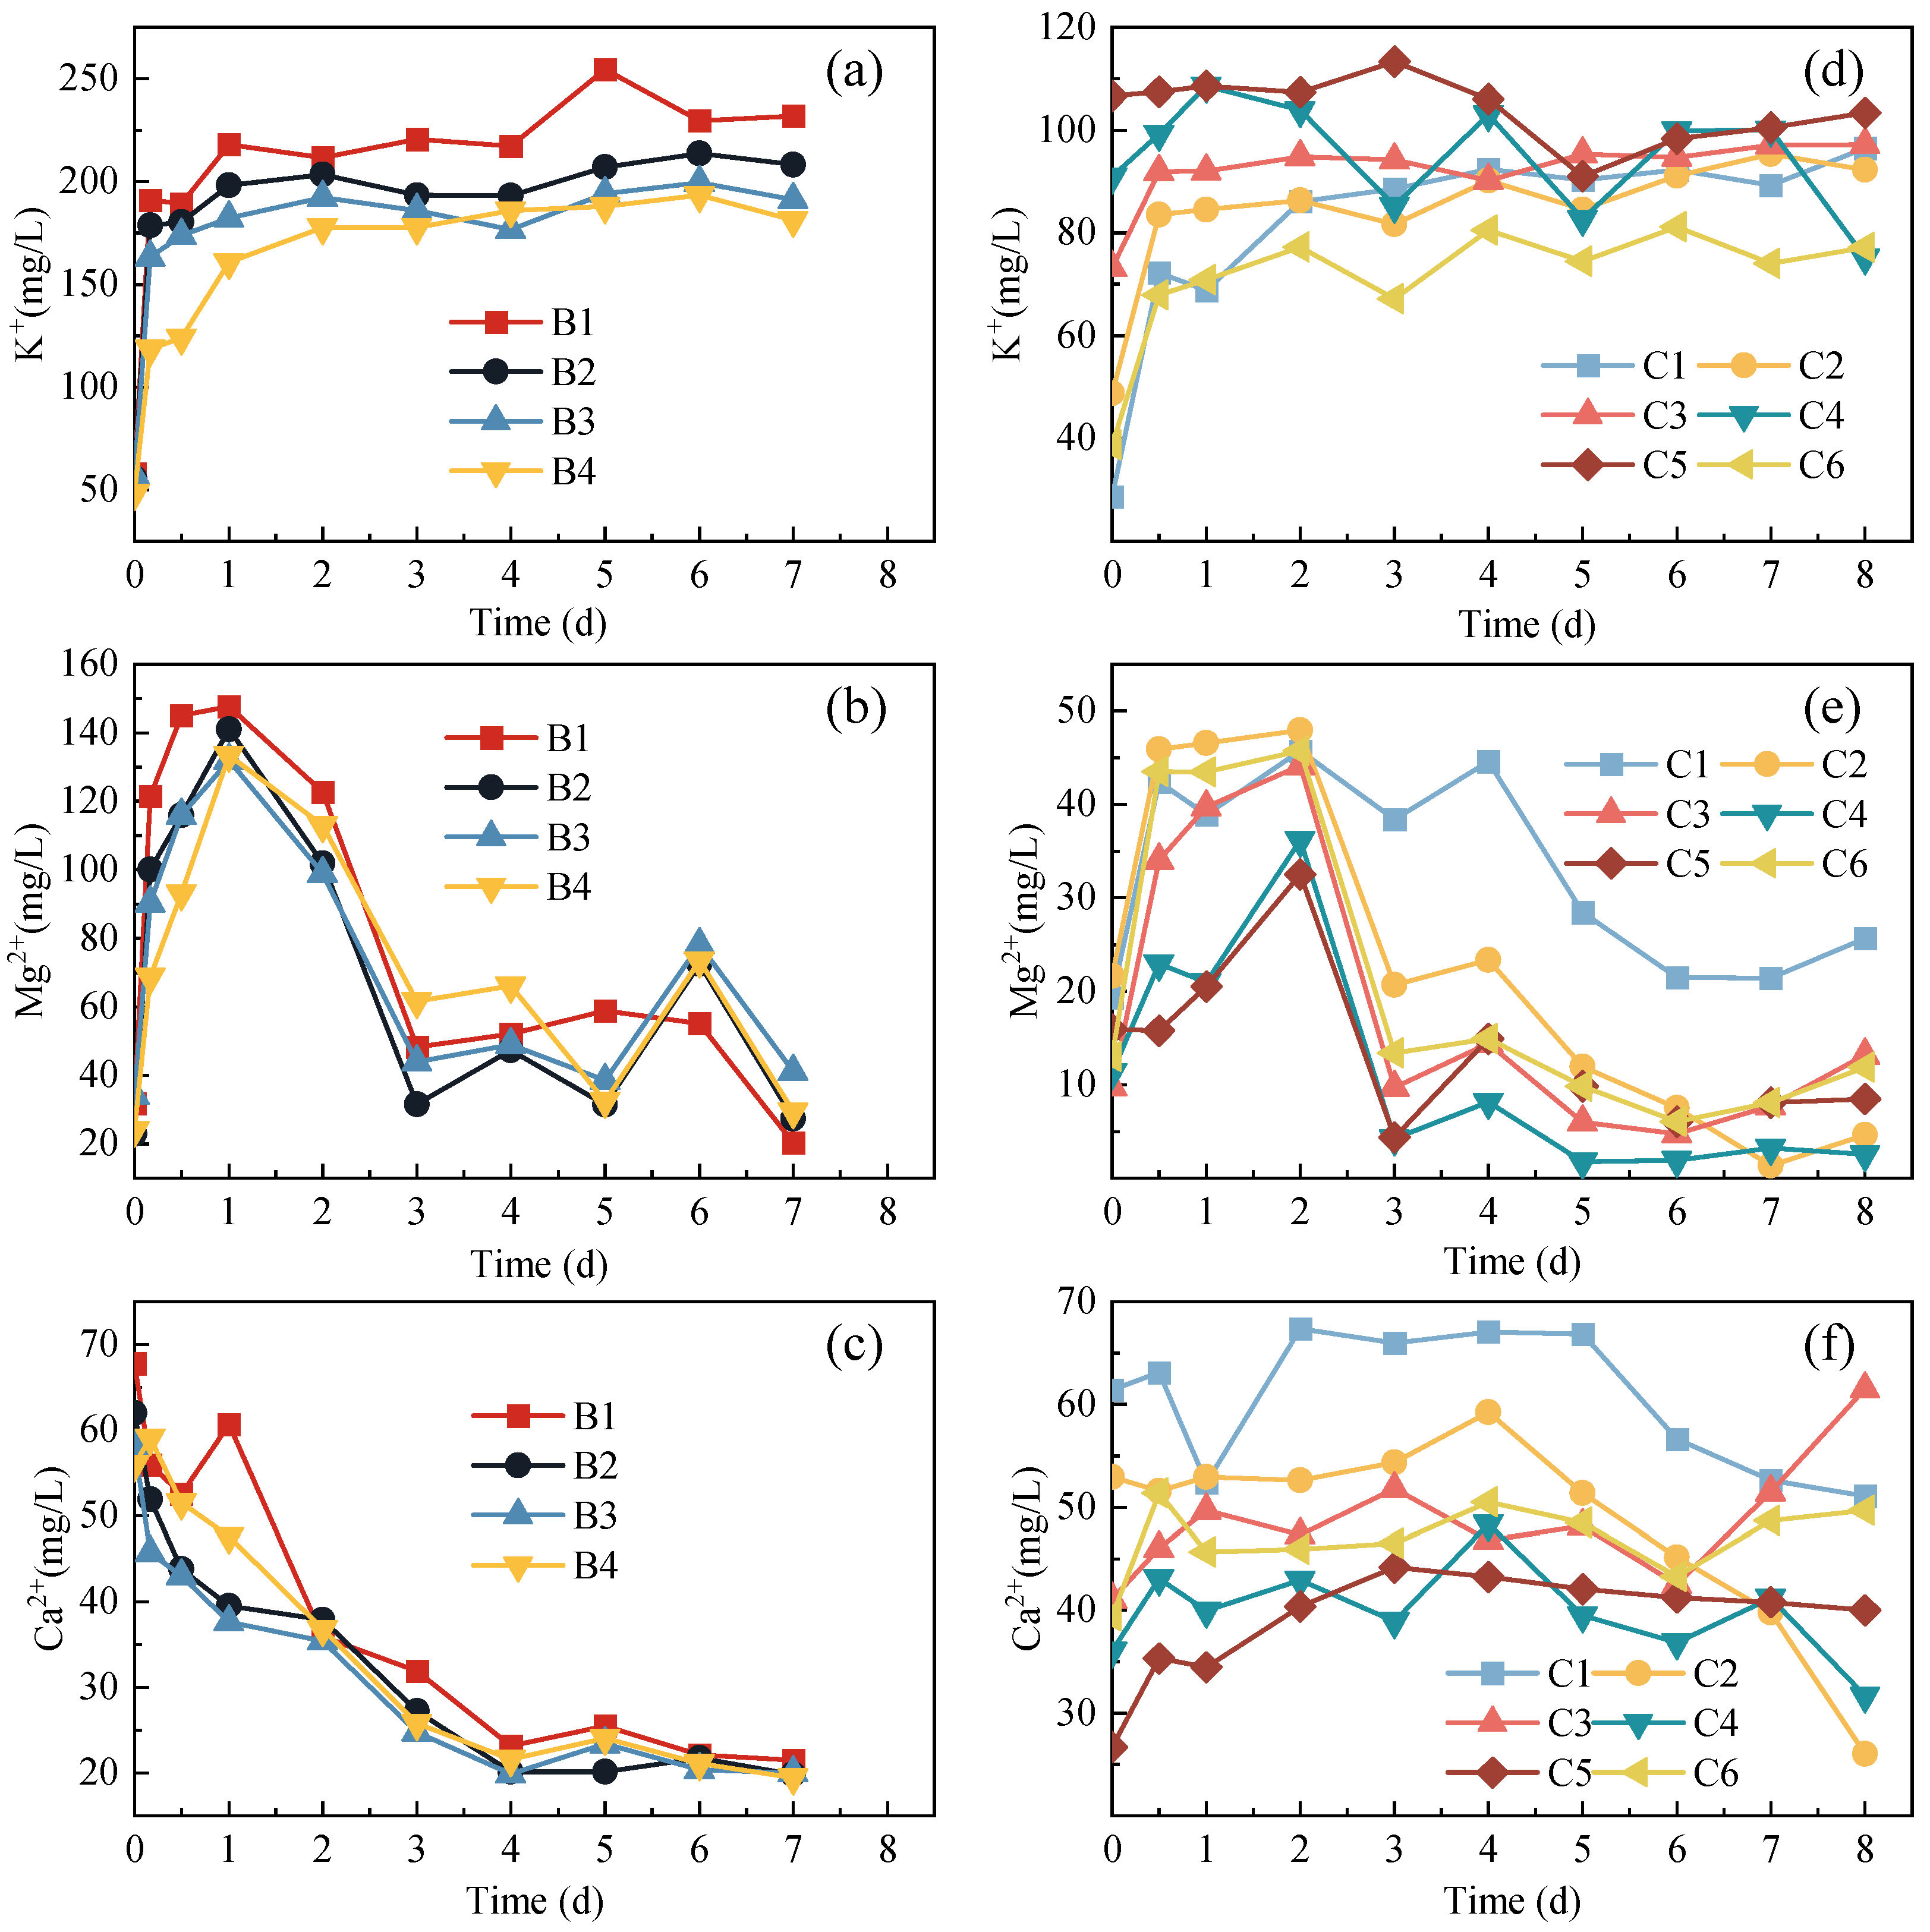
Metal ions were analyzed to further confirm the difference in phosphorus release. As shown in Figure 2a, K+ of B1~B4 increased during the first day and remained stable after then, which was similar to the change in TIP. Figure 2b shows that Mg2+ of B1~B4 increased rapidly during the first day, but then decreased sharply and remained stable after 3 days. During the first day, a large amount of K+ and Mg2+ were released due to the decomposition of polyphosphate, but the pH at this time was between 7.0 and 7.1, which was not the optimal pH for the precipitation of Mg2+ and polyphosphate. But after the first day, pH gradually increased due to the continuous use of VFAs by DS, so the precipitation of Mg2+ and polyphosphate began, resulting in the decrease in Mg2+ [29,30,31]. Zhang and Li [32] reported that compared with neutral conditions, Ca2+ dissolved from the sludge was more likely to form precipitates with polyphosphate under alkaline conditions. Ca2+ of B1~B4 showed a downward trend during the first 4 days, indicating that Ca2+ was indeed precipitated with polyphosphate at this stage [33]. Figure 2d shows that K+ of C5 remained basically unchanged, while K+ of the others showed an increasing trend in 12 h, which was consistent with the change in trend of TIP. TIP of C3~C5 decreased sharply on the second day. It can be seen from Figure 2e that Mg2+ dropped similarly at the same time, which indicated that part of TIP precipitated with Mg2+. This also shows that the precipitation of phosphorus is easy to appear in the anaerobic digestion system of WWTP [10,34]. As shown in Figure 2f, Ca2+ of C1 and C2 began to decrease after 5 days because the pH of the system was already between 7.5 and 7.6 at this time, and Ca2+ was likely to be precipitated with TIP. Barat et al. [35] pointed out that with the increase in pH and TAN in the digestion system, 50.7% of the dissolved phosphorus would form precipitates.

3.3. Methane Production Performance

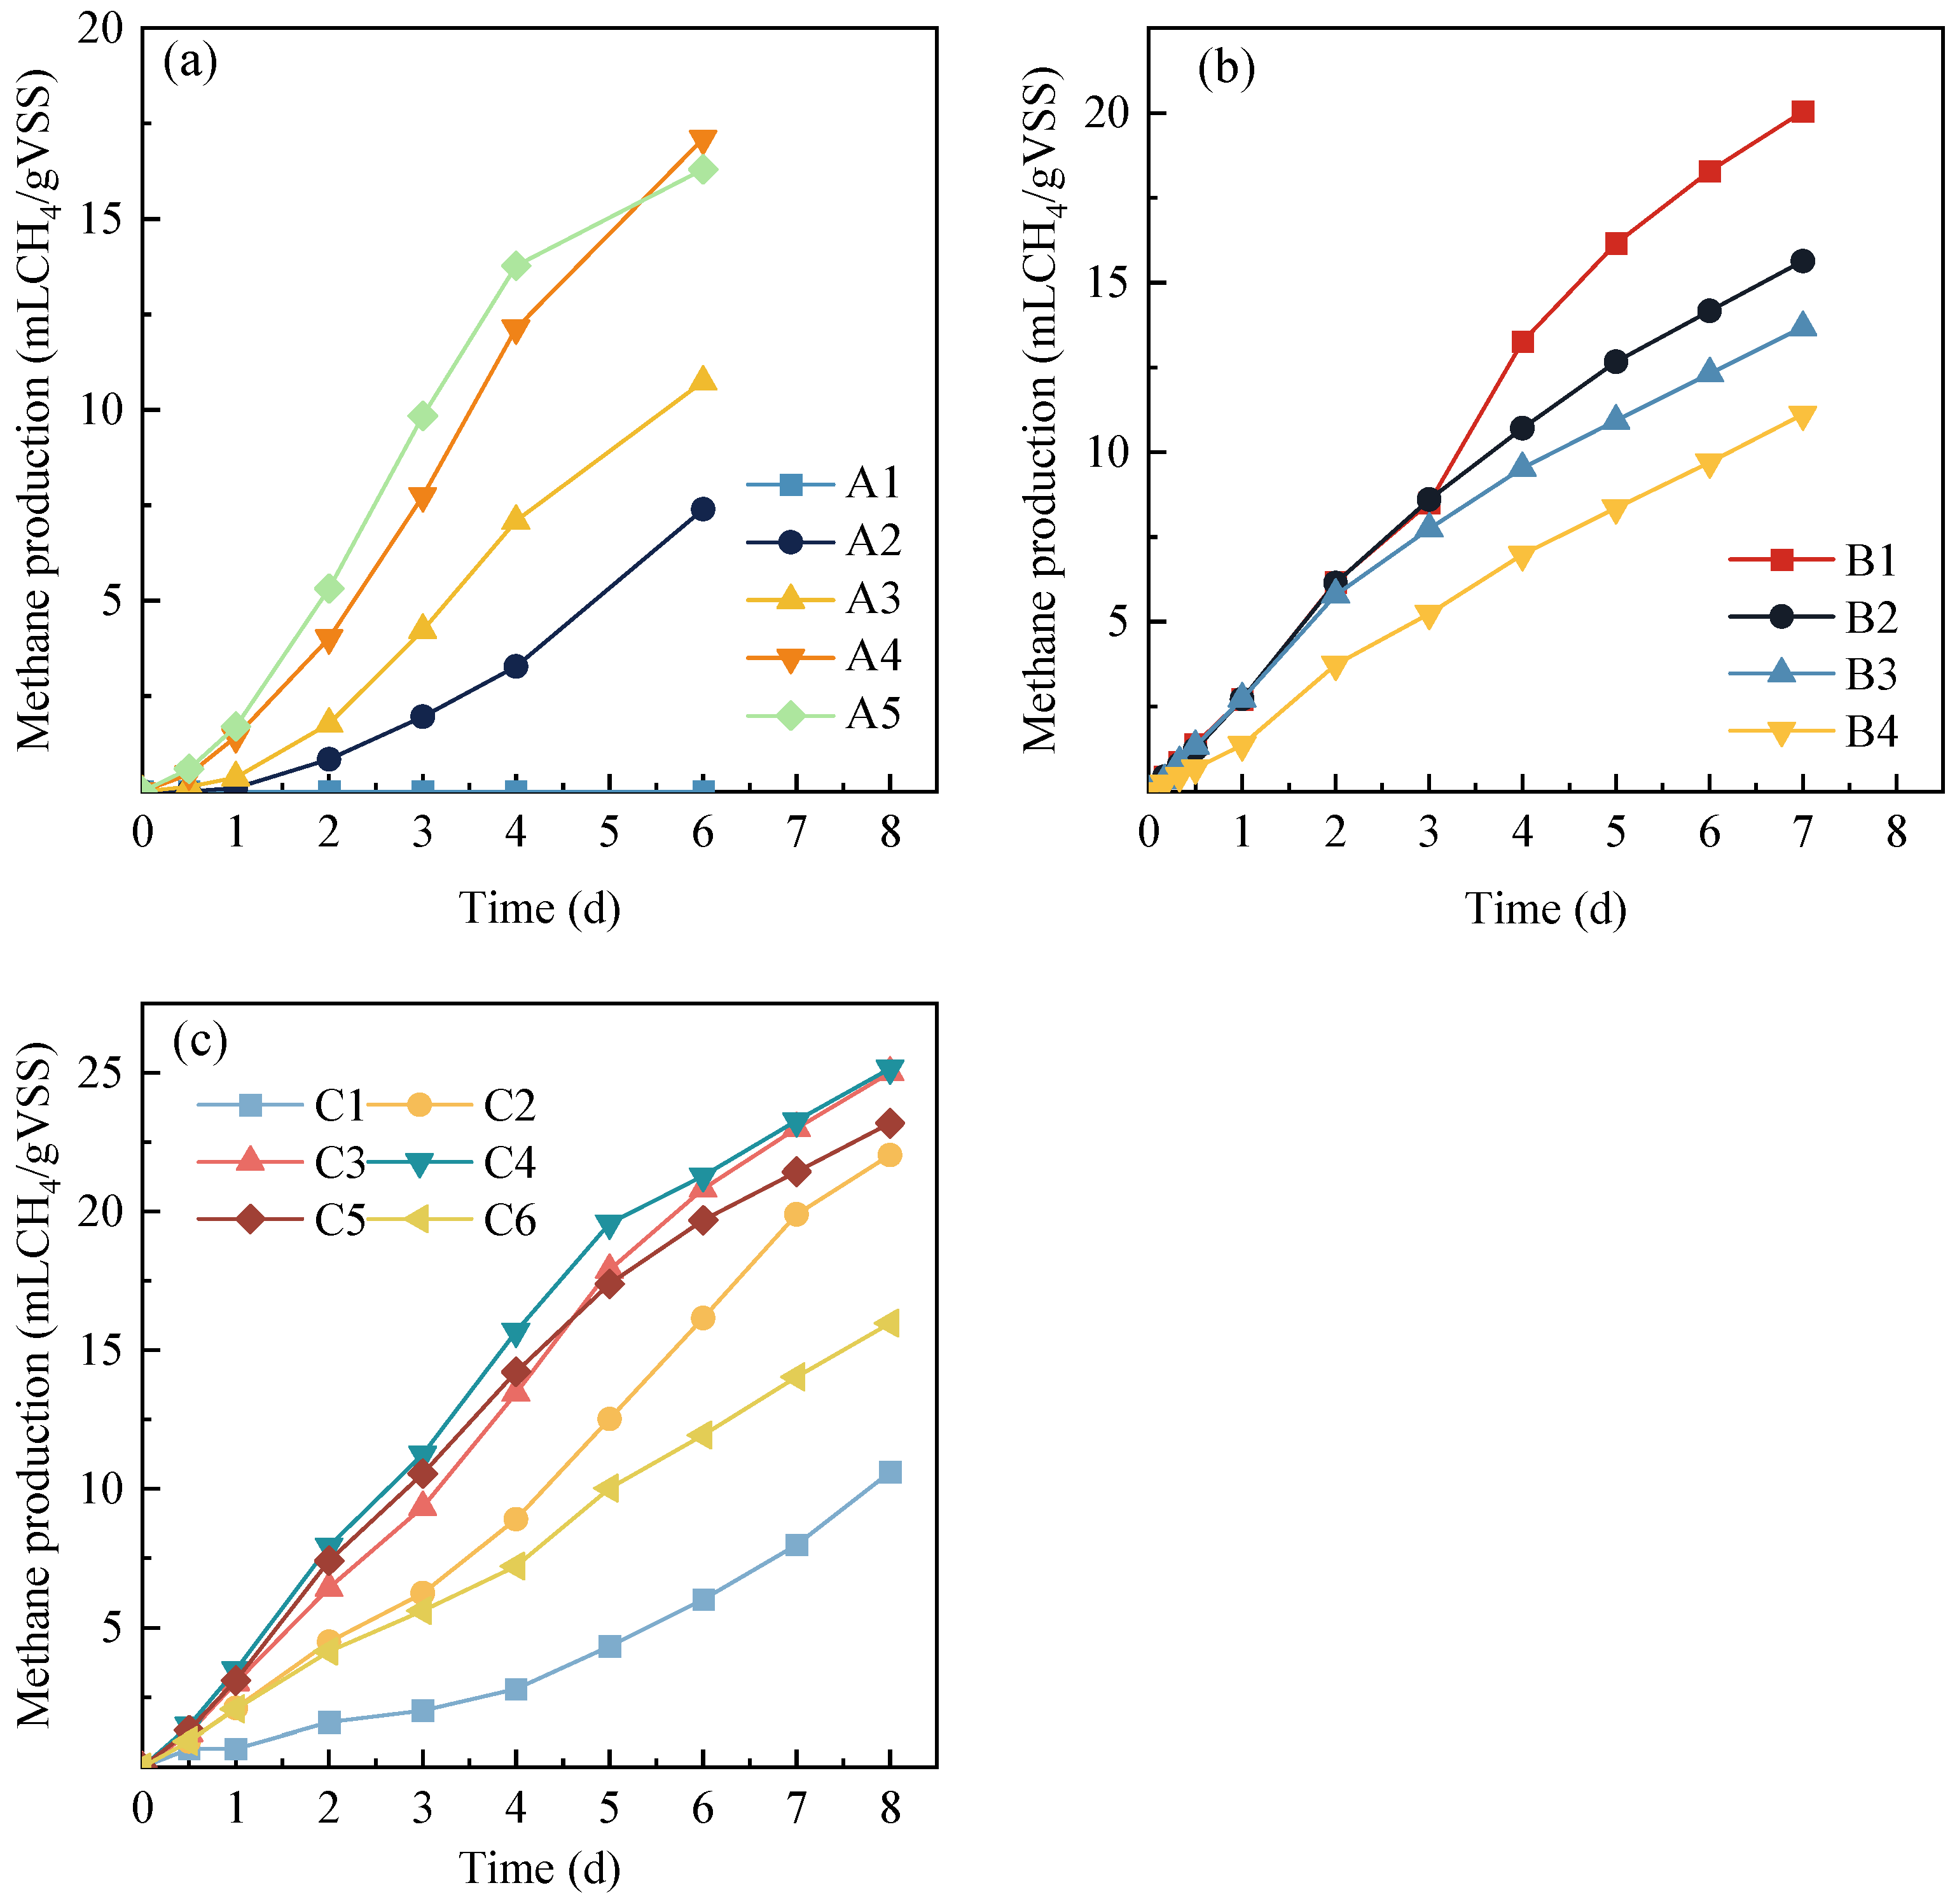
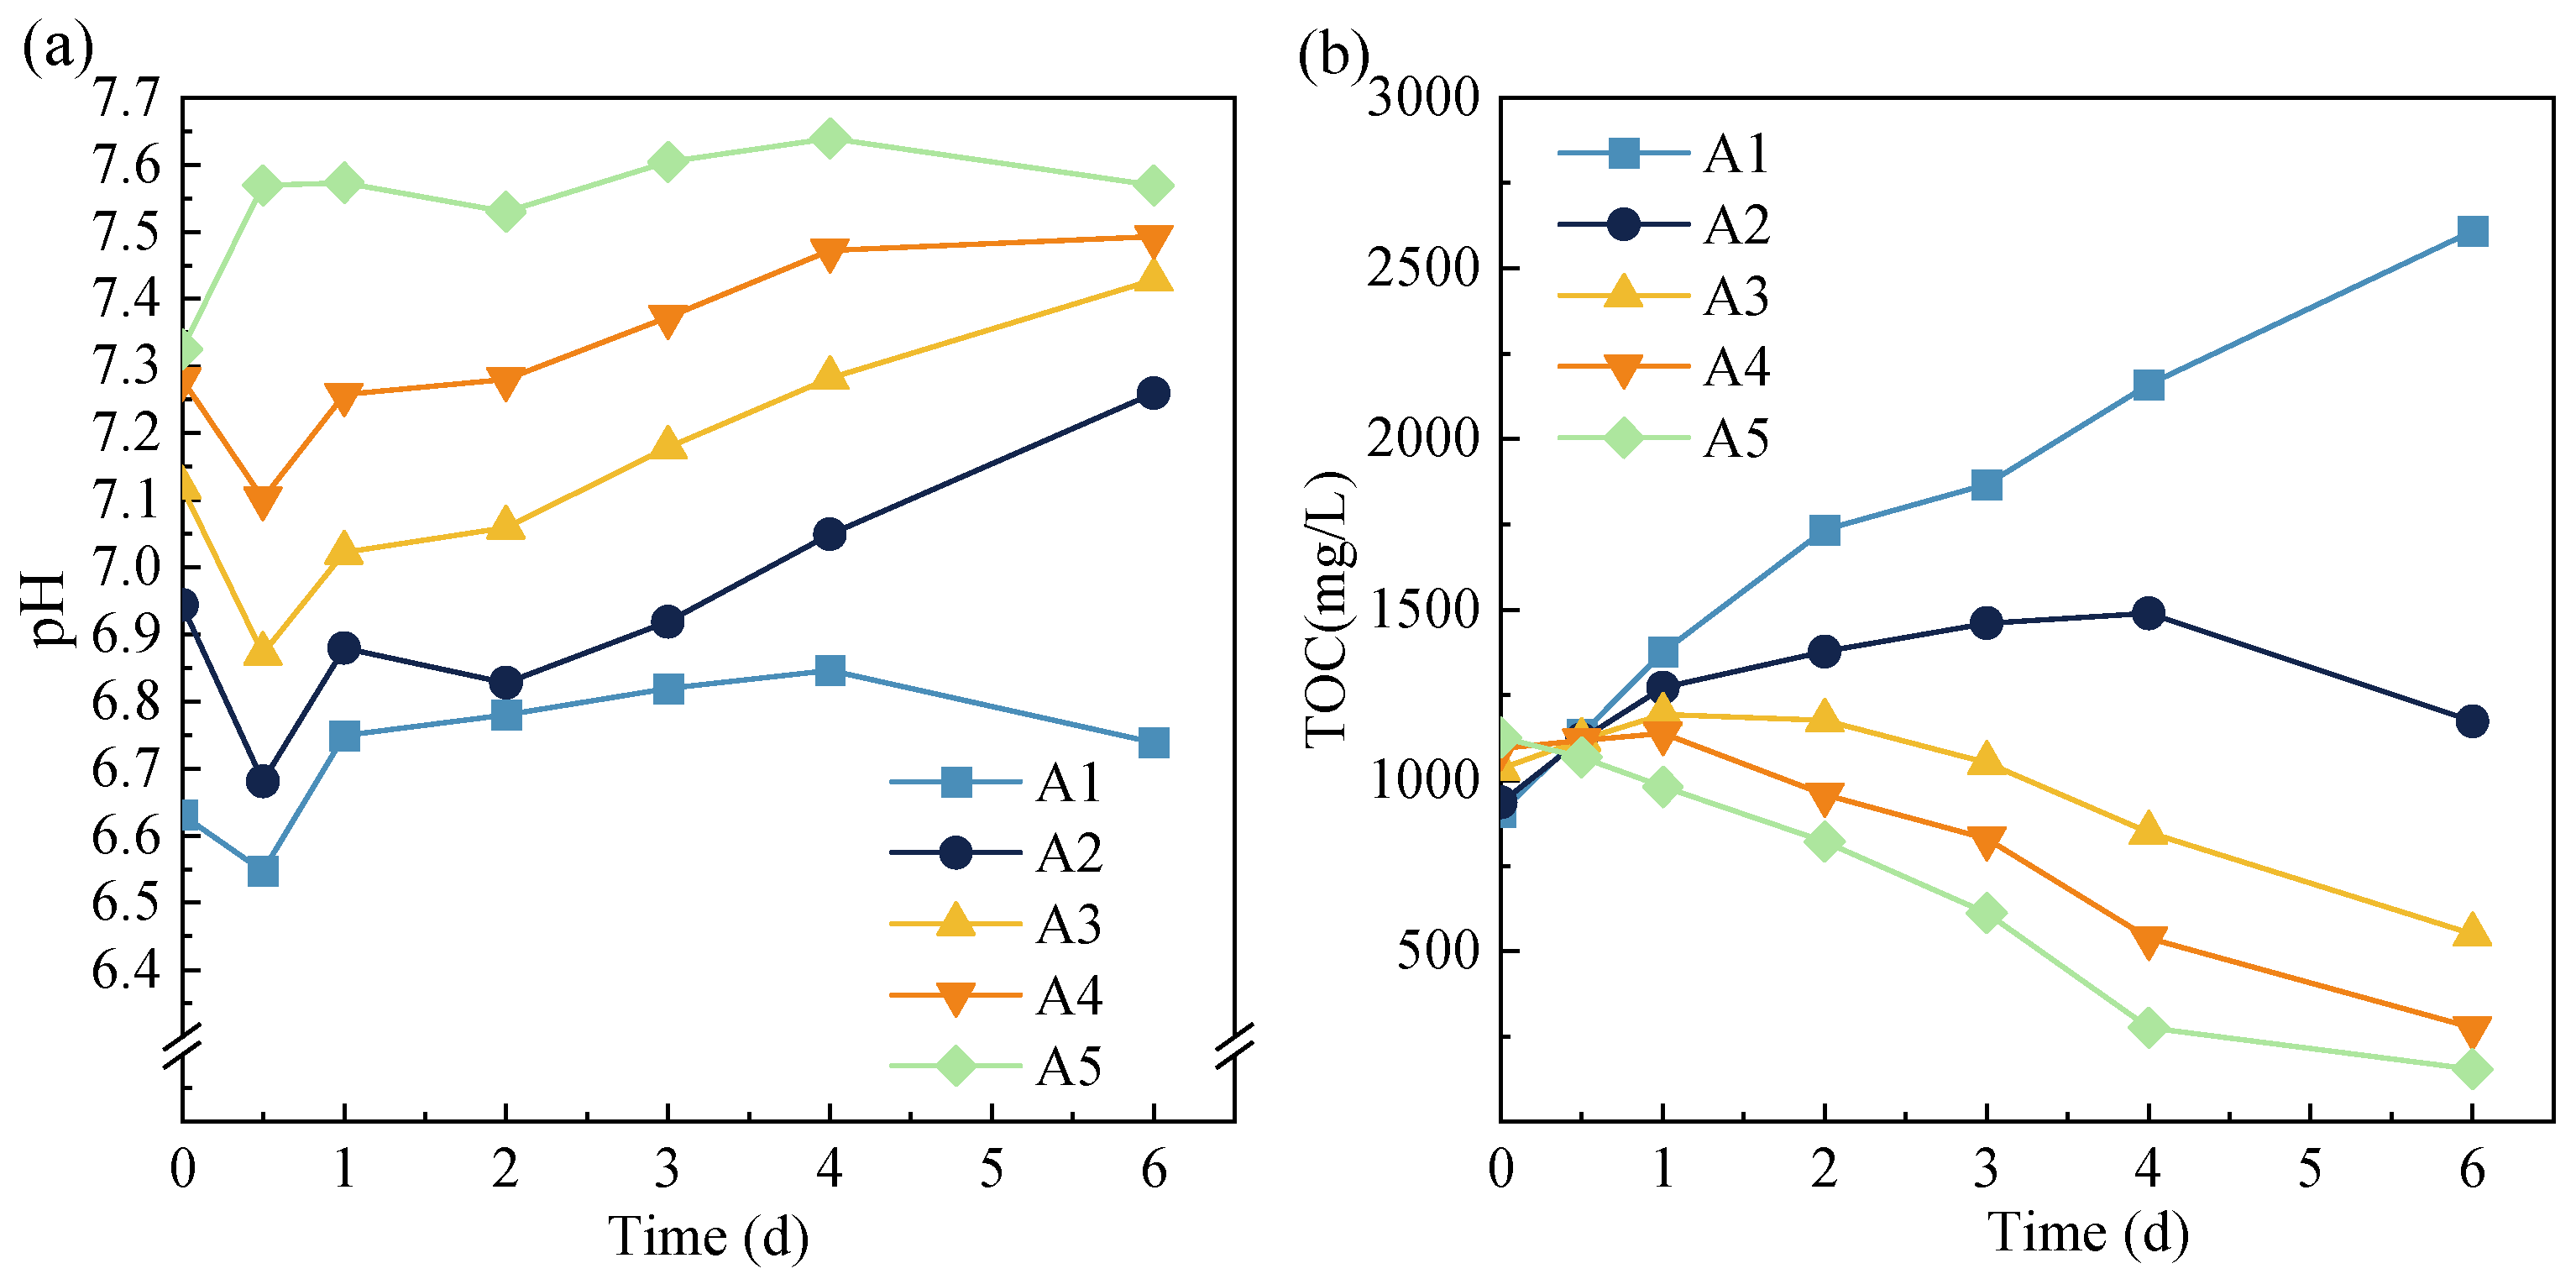
The cumulative methane production was measured to evaluate the bioconversion efficiency of the mixed sludge during anaerobic digestion. As shown in Figure 3a, the cumulative methane production of A2~A4 was 7.39 mL/g VSS, 10.74 mL/g VSS and 17.10 mL/g VSS, respectively. In summary, the higher the proportion of DS in the mixed sludge, the higher the methane production of the anaerobic digestion system. This was because the anaerobic metabolism of PRS and the hydrolytic acidification significantly reduced the pH of the system, which affected the activity of DS. The pH of DS was always controlled above 7.0 during the cultivation process. Once the environmental pH was lower than 7.0, the activity of DS would decrease, thereby affecting the generation of methane. The difference in pH shown in Figure 4a can prove this point. Figure 3a shows that there was no methane in A1, which was consistent with the conclusion of Chen et al. [36]. Combined with Figure 4b, which shows that the TOC of A1 kept increasing because DS was not added to A1, it can be inferred that the anaerobic metabolism and decomposition of PRS mainly occurred in A1 during the whole anaerobic digestion. Under anaerobic conditions, PAOs in PRS would synthesize readily biodegradable organics into polyhydroxyalkanoates (PHA) and store it in the cells, while not for directly degrading the organics like the hydrolytic acidogenic bacteria in DS. PHA is a kind of high molecular organic compound. After the anaerobic metabolism of PRS ended, part of the sludge cells began to lyse and released the intracellular organics, which caused the continuous increase in TOC. In the first 4 days, the cumulative methane production of A4 and A5 was similar, but after that, the cumulative methane production of A5 was 20% lower than that of A4. TOC of A5 kept decreasing because only DS was added to A5. Under anaerobic conditions, DS continuously used the initially added acetic acid and resulted in the significant decrease in TOC. TOC of A2~A4 varied between A1 and A5. The decay and decomposition of PRS was the main biological process within 1 day, but after 1 day, the anaerobic metabolism of DS became dominant, and the utilization rate of organics gradually increased.
As shown in Figure 3b, the difference in cumulative methane production of B1~B4 was obvious. Without the addition of acetic acid, the cumulative methane production of B4 was significantly lower than that of the others. The cumulative methane production of B1~B3 in 3 days had no big difference, but VFAs that can be used by DS at this stage were very different. Figure 5 shows that VFAs of B1~B3 decreased rapidly in 0.5 d. The rate of VFA reduction between 0.5 d and 3 d was much slower than that before 0.5 d, because the ability of PRS to absorb acetic acid by anaerobic metabolism decreased with the continuous decomposition of polyphosphate. Furthermore, the rate of acetic acid utilization by DS is much lower than that of PRS. On the third day, VFAs of B1~B3 were 1084 mg COD/L, 168 mg COD/L and 70 mg COD/L, respectively. VFAs of B1 dropped sharply after 3 days because a pH of 7.45 at this time was beneficial to the anaerobic metabolism of DS. Correspondingly, the cumulative methane production of B1 increased rapidly after 3 days. The variations in organics indicated that the main biological process of mixed sludge in 0.5 d was the anaerobic metabolism of PRS. Between 12 to 72 h, the biological process included the death and decomposition of PRS, hydrolytic acidification of organics and anaerobic methane production of DS. After 3 days, the main biological process was anaerobic methane production of DS.
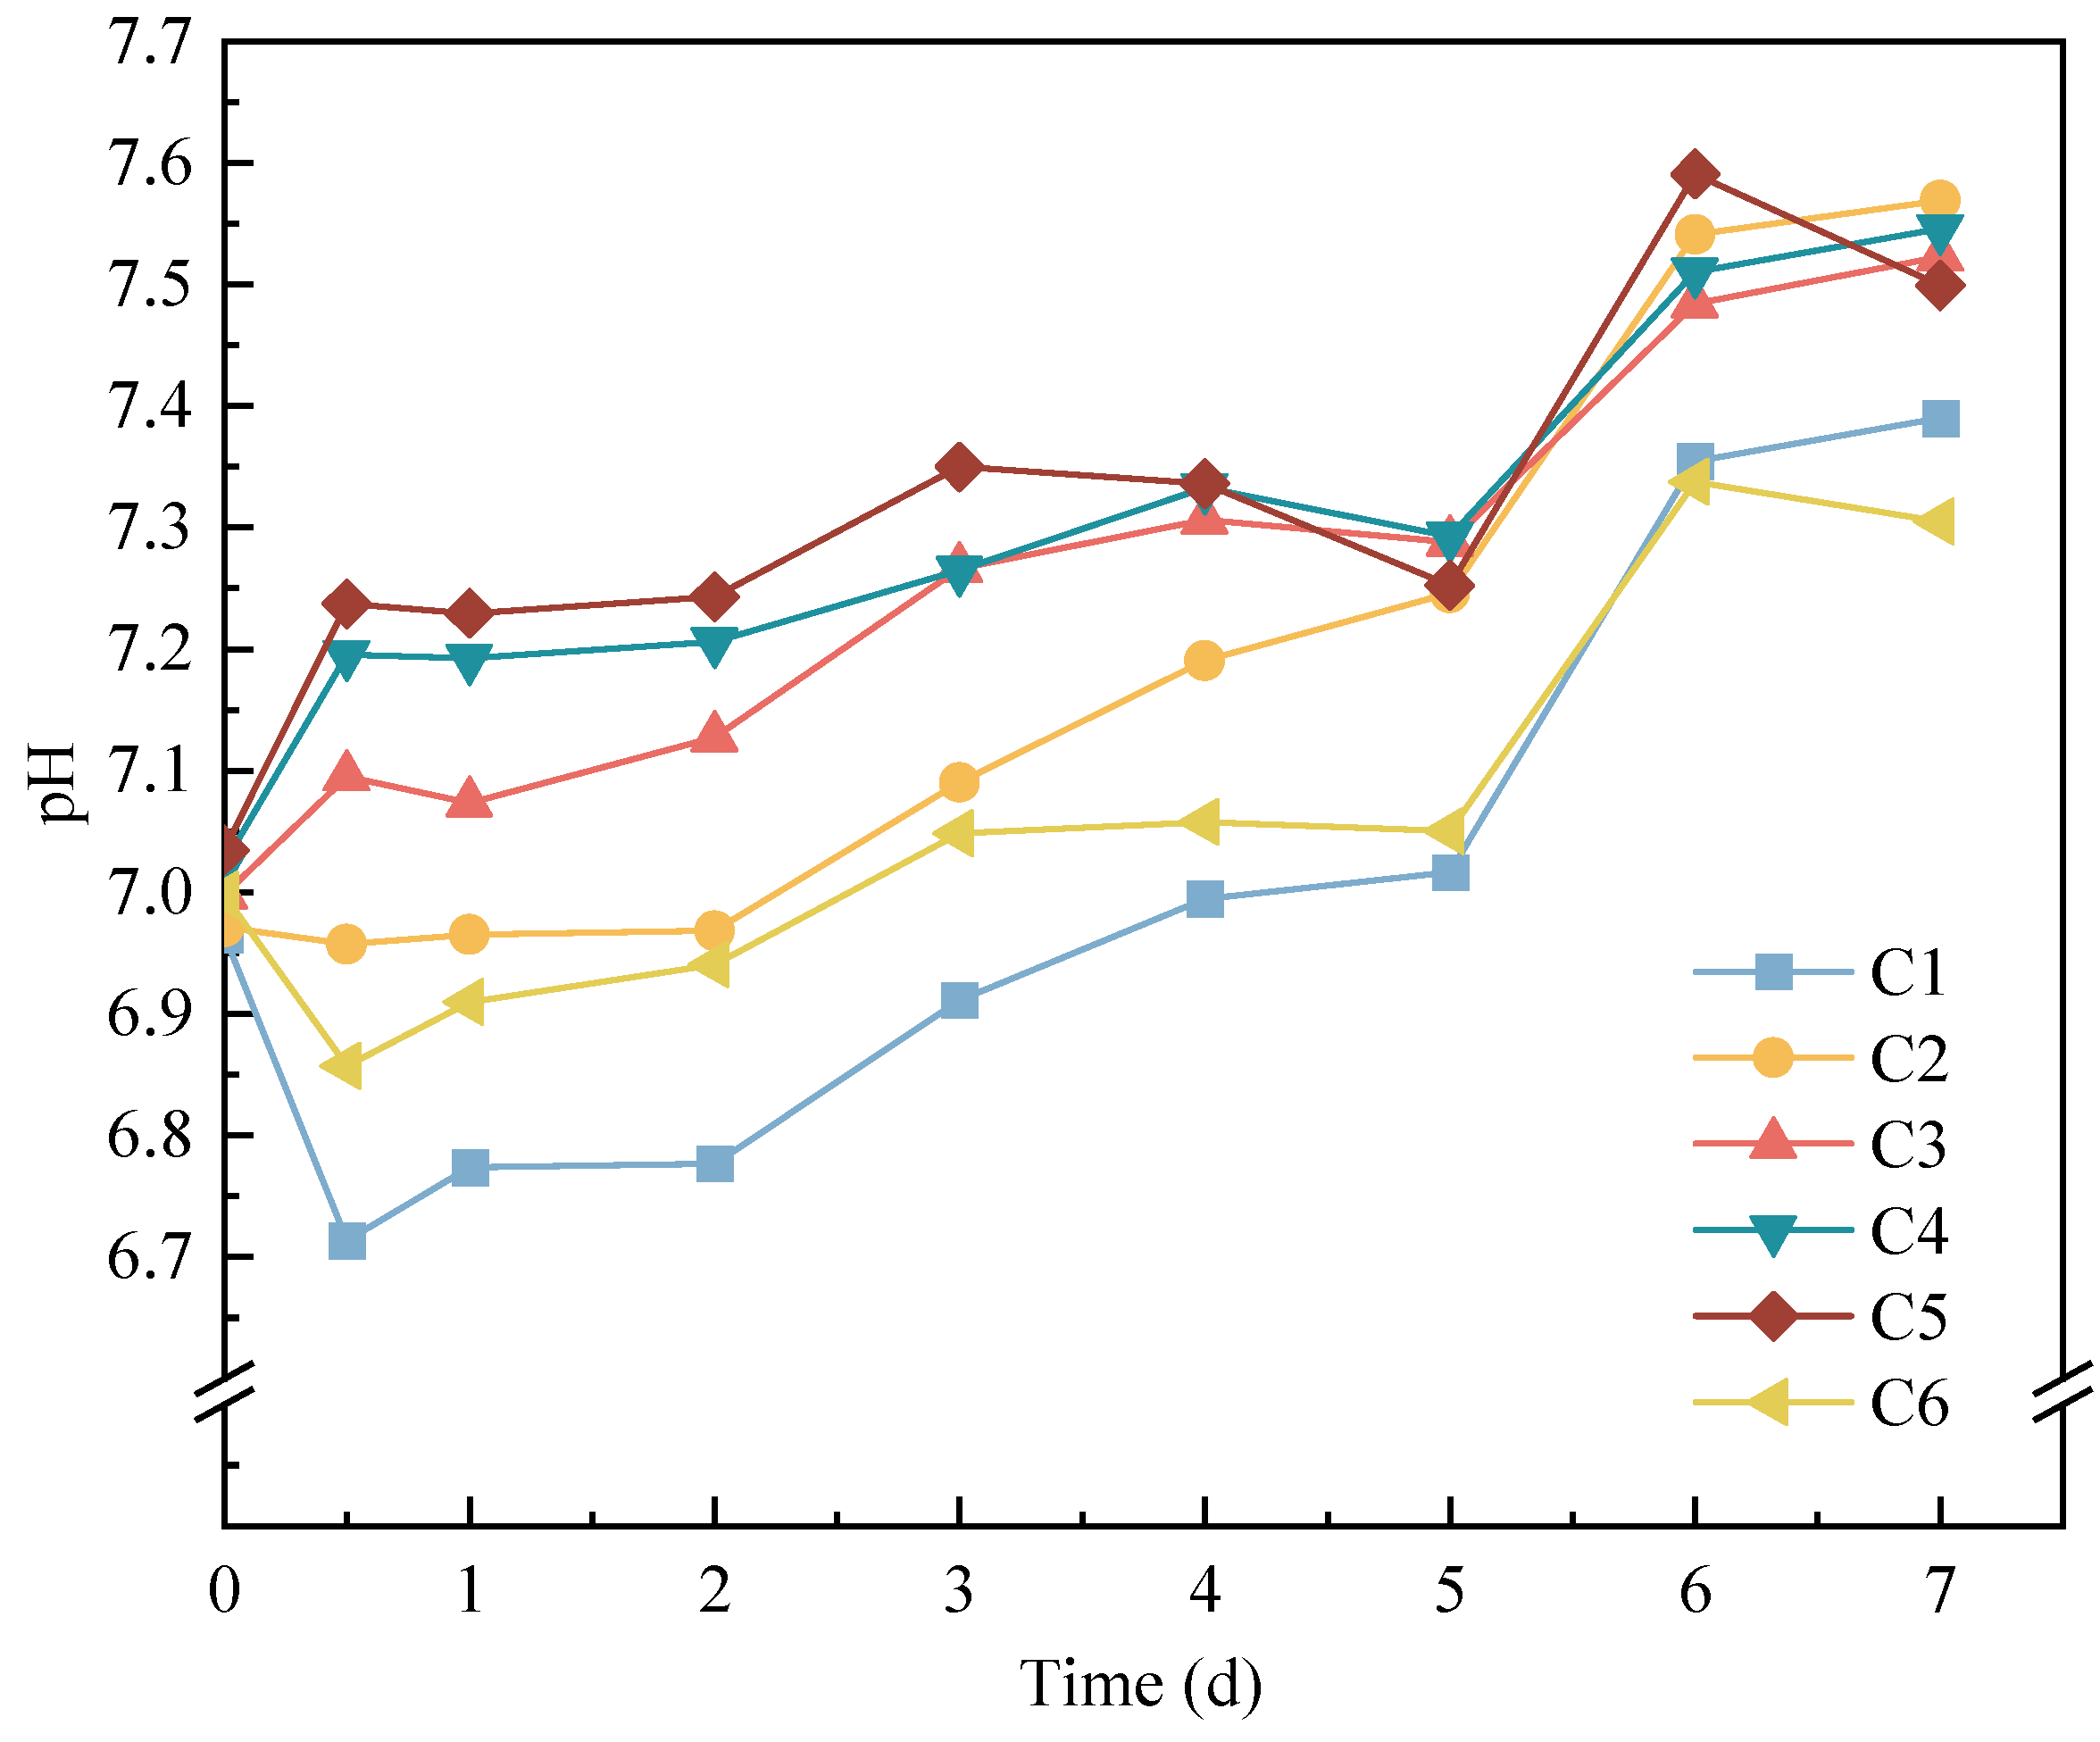
According to Figure 3c, the cumulative methane production of C2~C5 was much higher than that of C1 and C6. There was no additional DS in C1, so there was no significant methanogenesis metabolism. Acetic acid was not added in C6, and DS did not have sufficient available substrates, so the methane production certainly progressed slowly. C4 and C5 had a higher proportion of DS and sufficient acetic acid, so the cumulative methane production of both was not much different in 3 days. However, the organics produced by the decomposition of WAS in C4 could be hydrolyzed into VFAs as the substrate for DS, so the cumulative methane production of C4 was 19% greater than that of C5 after 3 days. The cumulative methane production of C2 showed two distinct stages. The first stage (0~3 d) had a slower increase in cumulative methane production. As shown in Figure 6, pH of C2 first decreased at this stage because the hydrolytic acidification was strong and a large amount of VFAs was produced, which caused the pH to drop below 7.0 for a short time and the activity of DS to be restricted. Then, with the recovery of DS activity and the increase in TAN, the pH gradually increased. In the second stage (3~7 d), the cumulative methane production increased very rapidly because pH was suitable for the metabolism of methanogens. The difference between C6 and C2 was that there was no acetic acid added to C6, but there was little difference in the cumulative methane production in 3 days. After 3 days, the cumulative methane production of C2 began to be greater than that of C6, which showed that the hydrolytic acidification in C6 could provide a certain amount of carbon source as a substrate for the anaerobic methanogenesis of DS in the first 3 days.

4. Conclusions

The mixing ratio of PRS and DS can influence the phosphorus release and methane production during anaerobic digestion. With the increase in the proportion of DS, the specific phosphorus release rate of the mixed sludge will gradually increase, but when the proportion of DS exceeds 50%, the specific phosphorus release rate of the mixed sludge will not increase accordingly. When the ratio of PRS to DS is 3:1, it is not only beneficial to the phosphorus release but also to the methane production. At this ratio, the specific phosphorus release rate of the mixed sludge increases with the increase in the acetic acid concentration, but when the acetic acid concentration exceeds 500 mg COD/L, the specific phosphorus release rate of the mixed sludge cannot be further improved significantly. Our study can provide valuable information on the release of phosphorus during anaerobic digestion, and give support for the design and regulation of practical projects.

Author Contributions

Conceptualization, Z.X., W.W., Q.P., L.W. and Y.L.; data curation, Z.X.; formal analysis, Z.X. and L.W.; methodology, W.W.; software, Z.X. and L.W.; validation and visualization, Z.X., Q.P. and L.W.; investigation, Z.X., W.W. and L.W.; writing—original draft preparation, Z.X.; writing—review and editing, all authors; supervision, Y.L.; project administration, Y.L.; funding acquisition, Y.L.; resources, Y.L. All authors have read and agreed to the published version of the manuscript.

Funding

This work was supported by the National Key Research and Development Program of China (2019YFC1905004, 2019YFC1905002) and the Natural Science Foundation of China (No. 52100158).

Data Availability Statement

The data that support the findings of the study are available from the corresponding author upon request.

Conflicts of Interest

The authors declare no conflict of interest.

References

  1. Li, R.H.; Cui, J.L.; Hu, J.H.; Wang, W.J.; Li, B.; Li, X.D.; Li, X.Y. Transformation of Fe–P Complexes in Bioreactors and P Recovery from Sludge: Investigation by XANES Spectroscopy. Environ. Sci. Technol. 2020, 54, 4641–4650. [Google Scholar] [CrossRef] [PubMed]
  2. Zhou, K.; Barjenbruch, M.; Kabbe, C.; Inial, G.; Remy, C. Phosphorus recovery from municipal and fertilizer wastewater: China’s potential and perspective. J. Environ. Sci. 2017, 52, 151–159. [Google Scholar] [CrossRef] [PubMed]
  3. Liang, S.; Chen, H.; Zeng, X.; Li, Z.; Yu, W.; Xiao, K.; Hu, J.; Hou, H.; Liu, B.; Tao, S.; et al. A comparison between sulfuric acid and oxalic acid leaching with subsequent purification and precipitation for phosphorus recovery from sewage sludge incineration ash. Water Res. 2019, 159, 242–251. [Google Scholar] [CrossRef] [PubMed]
  4. Fang, L.; Wang, Q.; Li, J.S.; Poon, C.S.; Cheeseman, C.R.; Donatello, S.; Tsang DC, W. Feasibility of wet-extraction of phosphorus from incinerated sewage sludge ash (ISSA) for phosphate fertilizer production: A critical review. Crit. Rev. Environ. Sci. Technol. 2020, 51, 939–971. [Google Scholar] [CrossRef]
  5. Ding, Y.Y.; Yu, H.Y.; Dai, X.H. Research Progress on Phosphorus in Sludge and Its Recovery Technology. China Water Wastewater 2022, 38, 29–34. [Google Scholar]
  6. Jardin, N.; Popel, H.J. Phosphate Release of Sludges from Enhanced Biological P-Removal during Digestion. Water Sci. Technol. 1994, 30, 281–292. [Google Scholar] [CrossRef]
  7. Mavinic, D.S.; Koch, F.A.; Hall, E.R.; Abraham, K.; Niedbala, D. Anaerobic co-digestion of combined sludges from a BNR wastewater treatment plant. Environ. Technol. 1998, 19, 35–44. [Google Scholar] [CrossRef]
  8. Carliell-Marquet, C.M.; Wheatley, A.D. Measuring metal and phosphorus speciation in P-rich anaerobic digesters. Water Sci. Technol. 2002, 45, 305–312. [Google Scholar] [CrossRef]
  9. Kuroda, A.; Takiguchi, N.; Gotanda, T.; Nomura, K.; Kato, J.; Ikeda, T.; Ohtake, H. A simple method to release polyphosphate from activated sludge for phosphorus reuse and recycling. Biotechnol. Bioeng. 2002, 78, 333–338. [Google Scholar] [CrossRef]
  10. Battistoni, P.; Fava, G.; Pavan, P.; Musacco, A.; Cecchi, F. Phosphate removal in anaerobic liquors by struvite crystallization without addition of chemicals: Preliminary results. Water Res. 1997, 31, 2925–2929. [Google Scholar] [CrossRef]
  11. Petzet, S.; Cornel, P. Prevention of Struvite Scaling in Digesters Combined with Phosphorus Removal and Recovery-The FIX-Phos Process. Water Environ. Res. 2012, 84, 220–226. [Google Scholar] [CrossRef] [PubMed]
  12. Yuan, Z.G.; Pratt, S.; Batstone, D.J. Phosphorus recovery from wastewater through microbial processes. Curr. Opin. Biotechnol. 2012, 23, 878–883. [Google Scholar] [CrossRef] [PubMed]
  13. Rudolfs, W.; Stahl, G.W. Phosphates in sewage and sludge treatment. III. Effects on sludge digestion. Sewage Work. J. 1947, 19, 415–422. [Google Scholar]
  14. Takiguchi, N.; Kishino, M.; Kuroda, A.; Kato, J.; Ohtake, H. A laboratory-scale test of anaerobic digestion and methane production after phosphorus recovery from waste activated sludge. J. Biosci. Bioeng. 2004, 97, 365–368. [Google Scholar] [CrossRef] [PubMed]
  15. Kleybocker, A.; Liebrich, M.; Kasina, M.; Kraume, M.; Wittmaier, M.; Wurdemann, H. Comparison of different procedures to stabilize biogas formation after process failure in a thermophilic waste digestion system: Influence of aggregate formation on process stability. Waste Manag. 2012, 32, 1122–1130. [Google Scholar] [CrossRef] [PubMed]
  16. Liu, X.L.; Li, A.J.; Ma, L.S.; Jing, Z.T.; Yang, J.; Tang, Y.; Hu, B. A comparison on phosphorus release and struvite recovery from waste activated sludge by different treatment methods. Int. Biodeterior. Biodegrad. 2020, 148, 104878. [Google Scholar] [CrossRef]
  17. Ping, Q.; Zhang, Z.P.; Dai, X.H.; Li, Y.M. Novel CaO2 beads used in the anaerobic fermentation of iron-rich sludge for simultaneous short-chain fatty acids and phosphorus recovery under ambient conditions. Bioresour. Technol. 2021, 322, 124553. [Google Scholar] [CrossRef] [PubMed]
  18. Ping, Q.; Zhang, J.Y.; Tang, R.J.; Liao, S.T.; Zhang, Z.P.; Li, Y.M. Effect of surfactants on phosphorus release and acidogenic fermentation of waste activated sludge containing different aluminium phosphate forms. Chemosphere 2022, 287, 132213. [Google Scholar] [CrossRef] [PubMed]
  19. Ding, Y.Y.; Wu, B.R.; Liu, Z.G.; Dai, X.H. Simultaneous enhancing phosphorus recovery and volatile fatty acids production during anaerobic fermentation of sewage sludge with peroxydisulfate pre-oxidation. Bioresour. Technol. 2022, 357, 127164. [Google Scholar] [CrossRef]
  20. Zhang, Z.P.; Ping, Q.; Guo, W.J.; Cai, C.; Li, Y.M. A novel approach using protein-rich biomass as co-fermentation substrates to enhance phosphorus recovery from FePs-bearing sludge. Water Res. 2022, 218, 118479. [Google Scholar] [CrossRef]
  21. Hu, X.B.; Zhao, X.; Ye, X.; Zhong, M.Y. Enhancement of mixing with waste activated sludge to anaerobic digestion of flocculated sludge. Chin. J. Environ. Eng. 2016, 10, 1456–1462. [Google Scholar]
  22. Sun, C.; Guo, L.; Zheng, Y.K.; Yu, D.; Jin, C.J.; Zhao, Y.G.; Yao, Z.W.; Gao, M.C.; She, Z.L. Effect of mixed primary and secondary sludge for two-stage anaerobic digestion (AD). Bioresour. Technol. 2022, 343, 126160. [Google Scholar] [CrossRef] [PubMed]
  23. Yang, Q. The Study on Phosphorus Discharge Capability of High Phosphatic Sludge and Phosphorus Recycle Potency. Master’s Thesis, Chongqing University, Chongqing, China, November 2002. [Google Scholar]
  24. Xiao, F. Phosphate release by polyphosphate accumulating organisms under different acetate concentration. Environ. Sci. Manag. 2009, 34, 90–94. [Google Scholar]
  25. APHA. Standard Method for the Examination of Water and Wastewater, 21st ed.; American Public Health Association: Washington, DC, USA, 2012. [Google Scholar]
  26. Luo, G.Y.; Zhang, Y.; Xu, X.Y. Characteristics of Activated Sludge and Stability of Denitrifying Phosphorus Removal in SUFR System. Res. Environ. Sci. 2011, 24, 85–89. [Google Scholar]
  27. Jardin, N.; Popel, H.J. Behavior of waste activated sludge from enhanced biological phosphorus removal during sludge treatment. Water Environ. Res. 1996, 68, 965–973. [Google Scholar] [CrossRef]
  28. Chen, W.L.; Wang, R.Y.; Li, Y.M. Effect of acetate concentration on phosphate release during anaerobic fermentation of phosphorus-rich sludge. China Environ. Sci. 2015, 35, 1763–1770. [Google Scholar]
  29. Wild, D.; Kisliakova, A.; Siegrist, H. Prediction of recycle phosphorus loads from anaerobic digestion. Water Res. 1997, 31, 2300–2308. [Google Scholar] [CrossRef]
  30. Bi, D.S.; Guo, X.P. on the effects of nitrogen and phosphorus release on the anaerobic digestion of PRWAS with pH-adjusted by Mg(OH)2. J. Saf. Environ. 2012, 67, 94–97. [Google Scholar]
  31. Wild, D.; Kisliakova, A.; Siegrist, H. P-fixation by Mg, Ca and zeolite A during stabilization of excess sludge from enhanced biological P-removal. Water Sci. Technol. 1996, 34, 391–398. [Google Scholar] [CrossRef]
  32. Zhang, L.L.; Li, Y.M. Effect of pH on phosphorus release from chemical-biological mixed sludge during anaerobic fermentation. China Environ. Sci. 2014, 34, 650–657. [Google Scholar]
  33. Marti, N.; Ferrer, J.; Seco, A.; Bouzas, A. Optimisation of sludge line management to enhance phosphorus recovery in WWTP. Water Res. 2008, 42, 4609–4618. [Google Scholar] [CrossRef]
  34. Fujimoto, N.; Mizuochi, T.; Togami, Y. Phosphorus Fixation in the Sludge Treatment System of a Biological Phosphorus Removal Process. Water Sci. Technol. 1990, 23, 635–640. [Google Scholar] [CrossRef]
  35. Barat, R.; Bouzas, A.; Marti, N.; Ferrer, J.; Seco, A. Precipitation assessment in wastewater treatment plants operated for biological nutrient removal: A case study in Murcia, Spain. J. Environ. Manag. 2009, 90, 850–857. [Google Scholar] [CrossRef]
  36. Chen, Y.G.; Jiang, S.; Yuan, H.Y.; Zhou, Q.; Gu, G.W. Hydrolysis and acidification of waste activated sludge at different pHs. Water Res. 2007, 41, 683–689. [Google Scholar] [CrossRef]
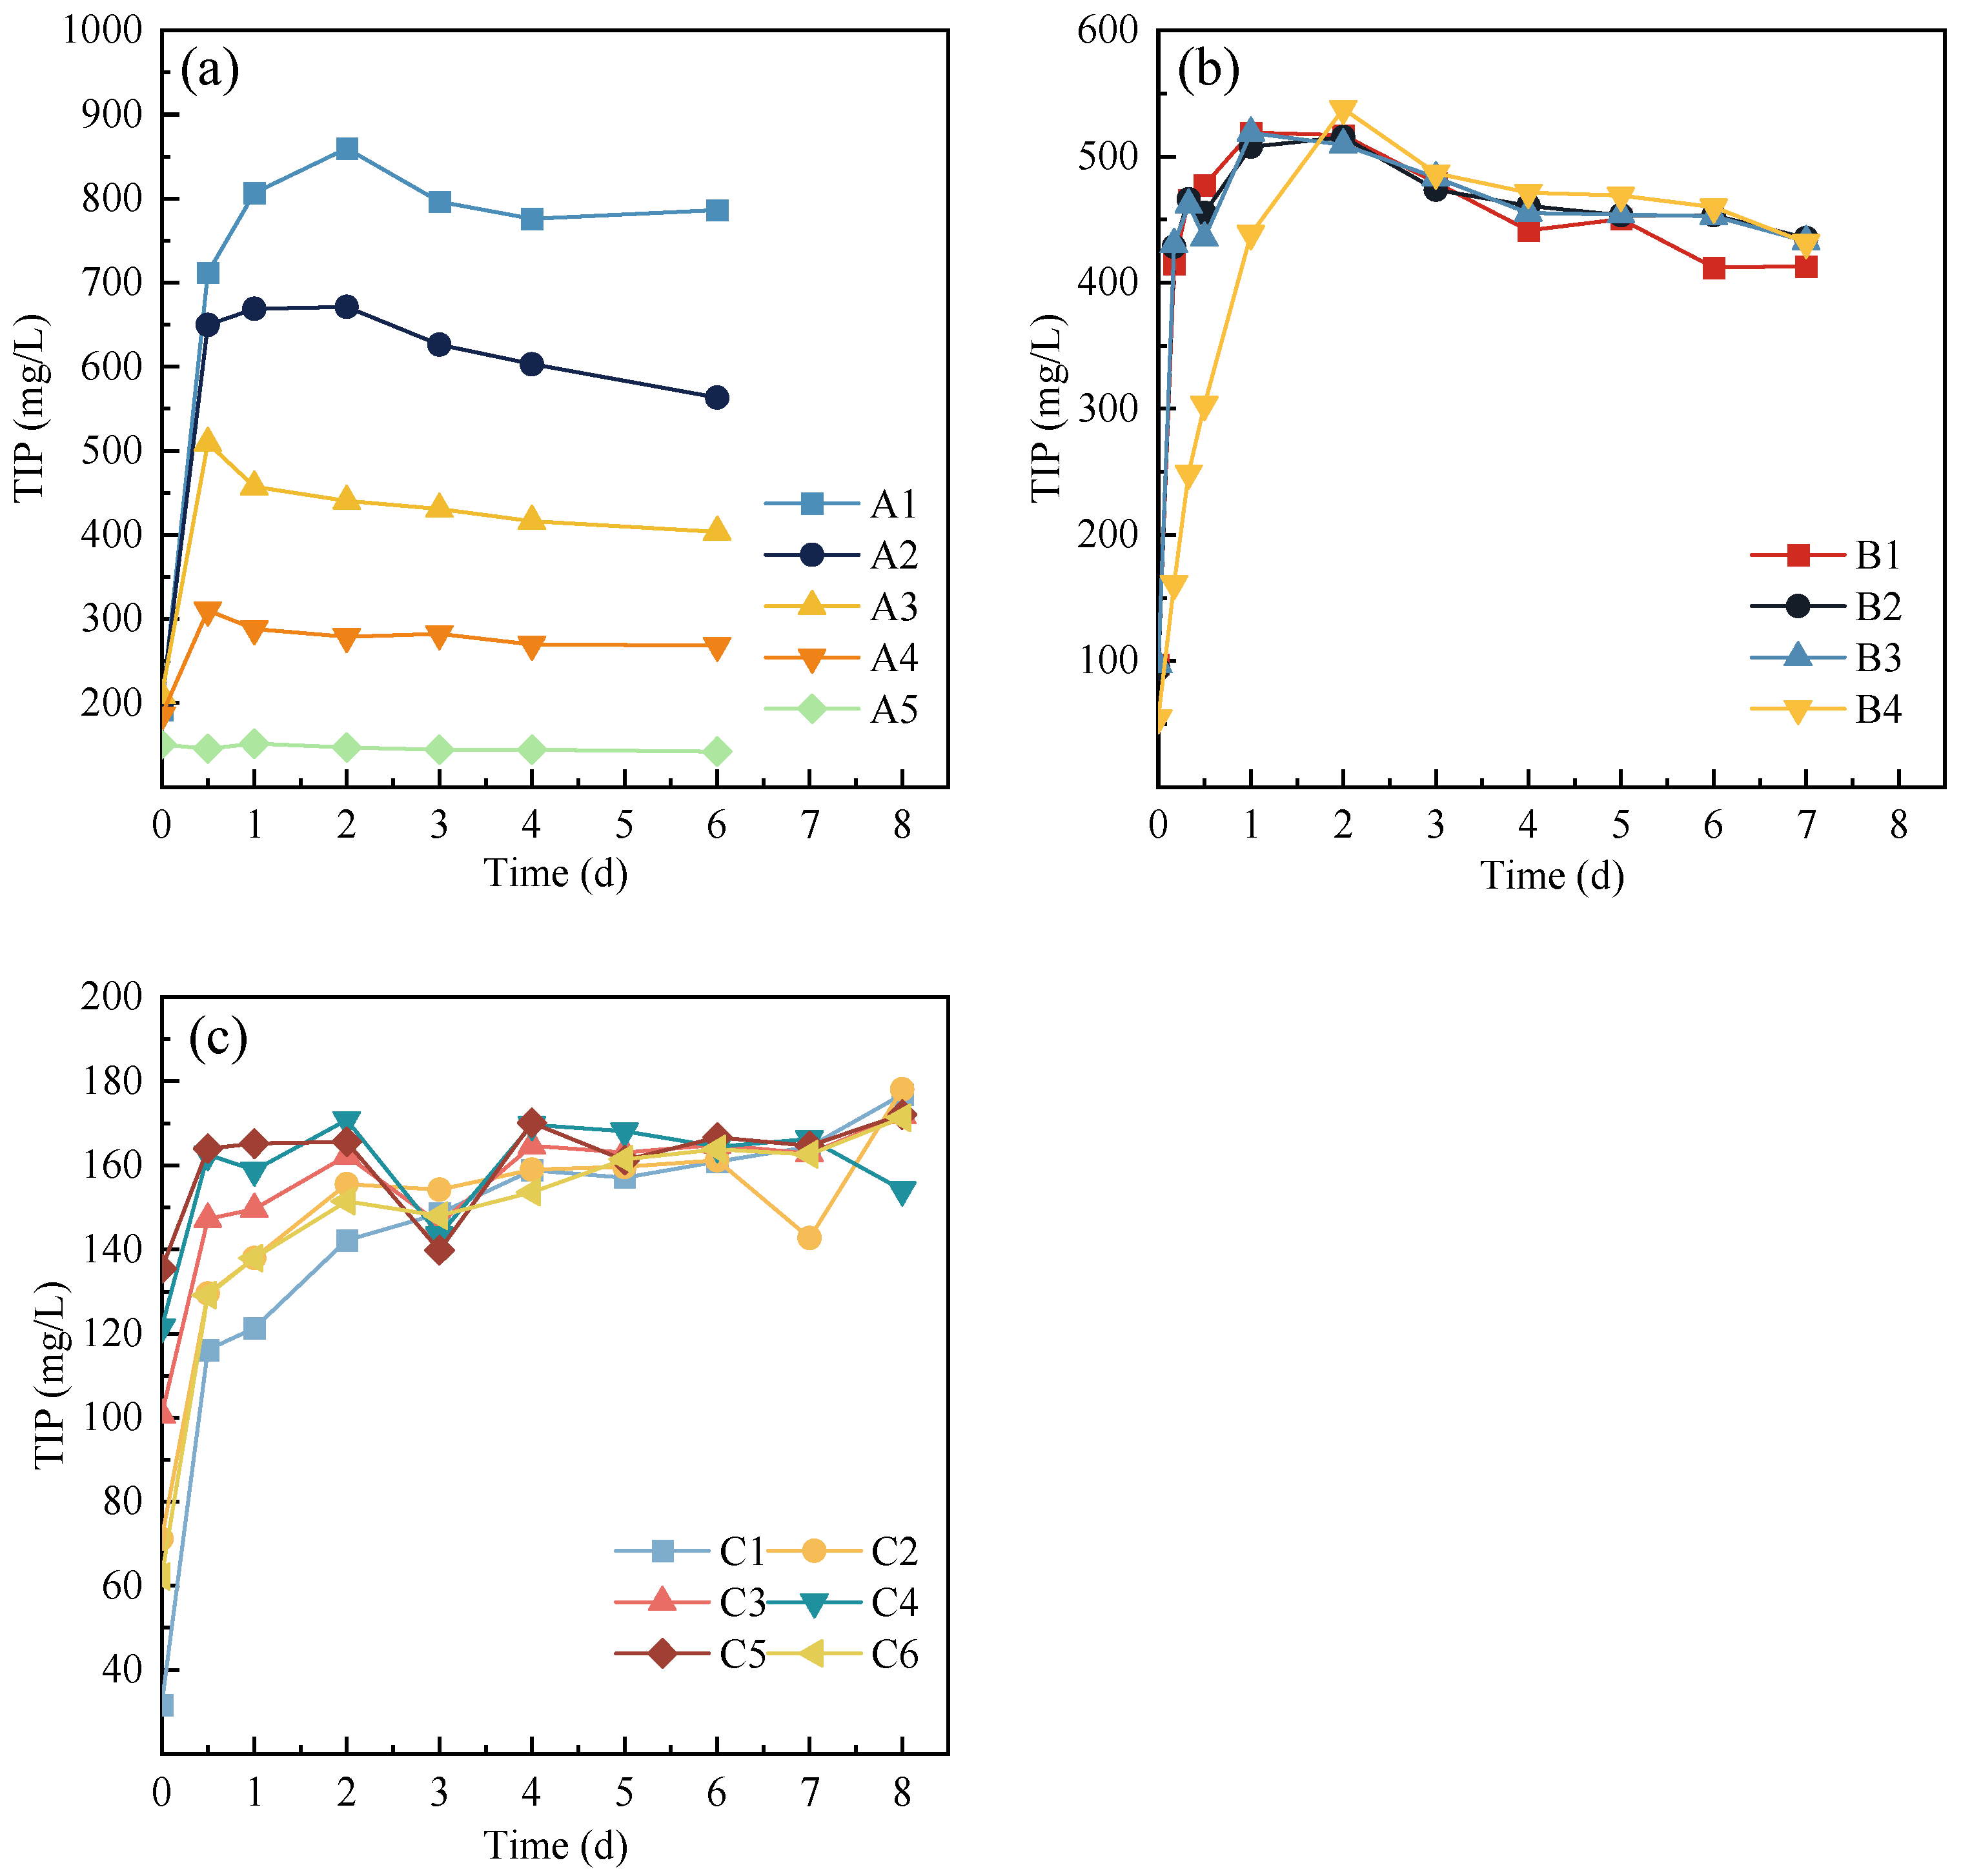
Figure 1. The phosphorus release curve of anaerobic digestion of PRS and DS with different mixing ratios under the same acetic acid concentration (a), the phosphorus release curve of anaerobic digestion of PRS and DS with the same mixing ratio under different acetic acid concentrations (b) and the phosphorus release curve of anaerobic digestion of WAS and DS with different mixing ratios under the same acetic acid concentration (c).
Separations 10 00539 g001
Figure 2. Variations in K+ (a), Mg2+ (b) and Ca2+ (c) of anaerobic digestion of PRS and DS with the same mixing ratio under different acetic acid concentrations. Variations in K+ (d), Mg2+ (e) and Ca2+ (f) of anaerobic digestion of WAS and DS with different mixing ratios under the same acetic acid concentration.
Separations 10 00539 g002
Figure 3. The methane production of anaerobic digestion of PRS and DS with different mixing ratios under the same acetic acid concentration (a). The methane production of anaerobic digestion of PRS and DS with the same mixing ratio under different acetic acid concentrations (b). The methane production of anaerobic digestion of WAS and DS with different mixing ratios under the same acetic acid concentration (c).
Separations 10 00539 g003
Figure 4. Variations in pH (a) and TOC (b) of anaerobic digestion of PRS and DS with different mixing ratios under the same acetic acid concentration.
Separations 10 00539 g004
Figure 5. Variation in VFAs of anaerobic digestion of PRS and DS with the same mixing ratio under different acetic acid concentrations.
Separations 10 00539 g005
Figure 6. Variation in pH of anaerobic digestion of WAS and DS with different mixing ratios under the same acetic acid concentration.
Separations 10 00539 g006
Table 1. Characteristics of PRS and DS.
SludgepHMLSS
(g/L)
MLVSS
(g/L)
TP
(mg/L)
TN
(mg/L)
TOC
(mg/L)
PRS7.4012.108.71944.588.3922.23
DS7.3317.3810.75-391.40192.06
Table 2. The mixing ratio of the substrates in the anaerobic digestion of PRS and DS with different mixing ratios under the same acetic acid concentration.
Experimental GroupAdded Acetic Acid
(mg COD/L)
The Mixing Ratios of SludgeMLSS
(g/L)
MLVSS
(g/L)
PRS (%)DS (%)
A13000100016.9112.79
A23000752517.4812.86
A33000505016.6111.37
A43000257515.189.37
A53000010014.487.95
Table 3. The mixing ratio of the substrates in the anaerobic digestion of PRS and DS with the same mixing ratio under different acetic acid concentrations.
Experimental GroupAdded Acetic Acid
(mg COD/L)
The Mixing Ratios of SludgeMLSS
(g/L)
MLVSS
(g/L)
PRS (%)DS (%)
B12000752513.429.26
B21000752513.429.26
B3500752513.429.26
B40752513.429.26
Table 4. The mixing ratio of the substrates in the anaerobic digestion of WAS and DS with different mixing ratios under the same acetic acid concentration.
Experimental GroupAdded Acetic Acid
(mg COD/L)
The Mixing Ratios of SludgeMLSS
(g/L)
MLVSS
(g/L)
WAS (%)DS (%)
C13000100023.2717.30
C23000752522.9716.12
C33000505022.6614.88
C43000257522.3413.65
C53000010022.0512.47
C60752523.5516.50
Table 5. SPRR of three experiments.
Experimental GroupSPRR
(mg P/(g SS•h))
A12.56
A23.06
A33.12
A42.73
B12.66
B22.70
B32.75
B42.28
C10.30
C20.69
C30.83
C41.50
C60.78
Disclaimer/Publisher’s Note: The statements, opinions and data contained in all publications are solely those of the individual author(s) and contributor(s) and not of MDPI and/or the editor(s). MDPI and/or the editor(s) disclaim responsibility for any injury to people or property resulting from any ideas, methods, instructions or products referred to in the content.