
Simultaneous Determination of Sodium Pentachlorophenolate and Its Metabolites in Swine Samples

 ,
, 
Abstract
:1. Introduction
2. Materials and Methods
2.1. Chemicals and Reagents
2.2. Sample Preparation
2.3. Instrumentation and Conditions
2.3.1. LC-MS/MS
2.3.2. GC-MS/MS
3. Results and Discussion
3.1. Optimization of Instrument Conditions
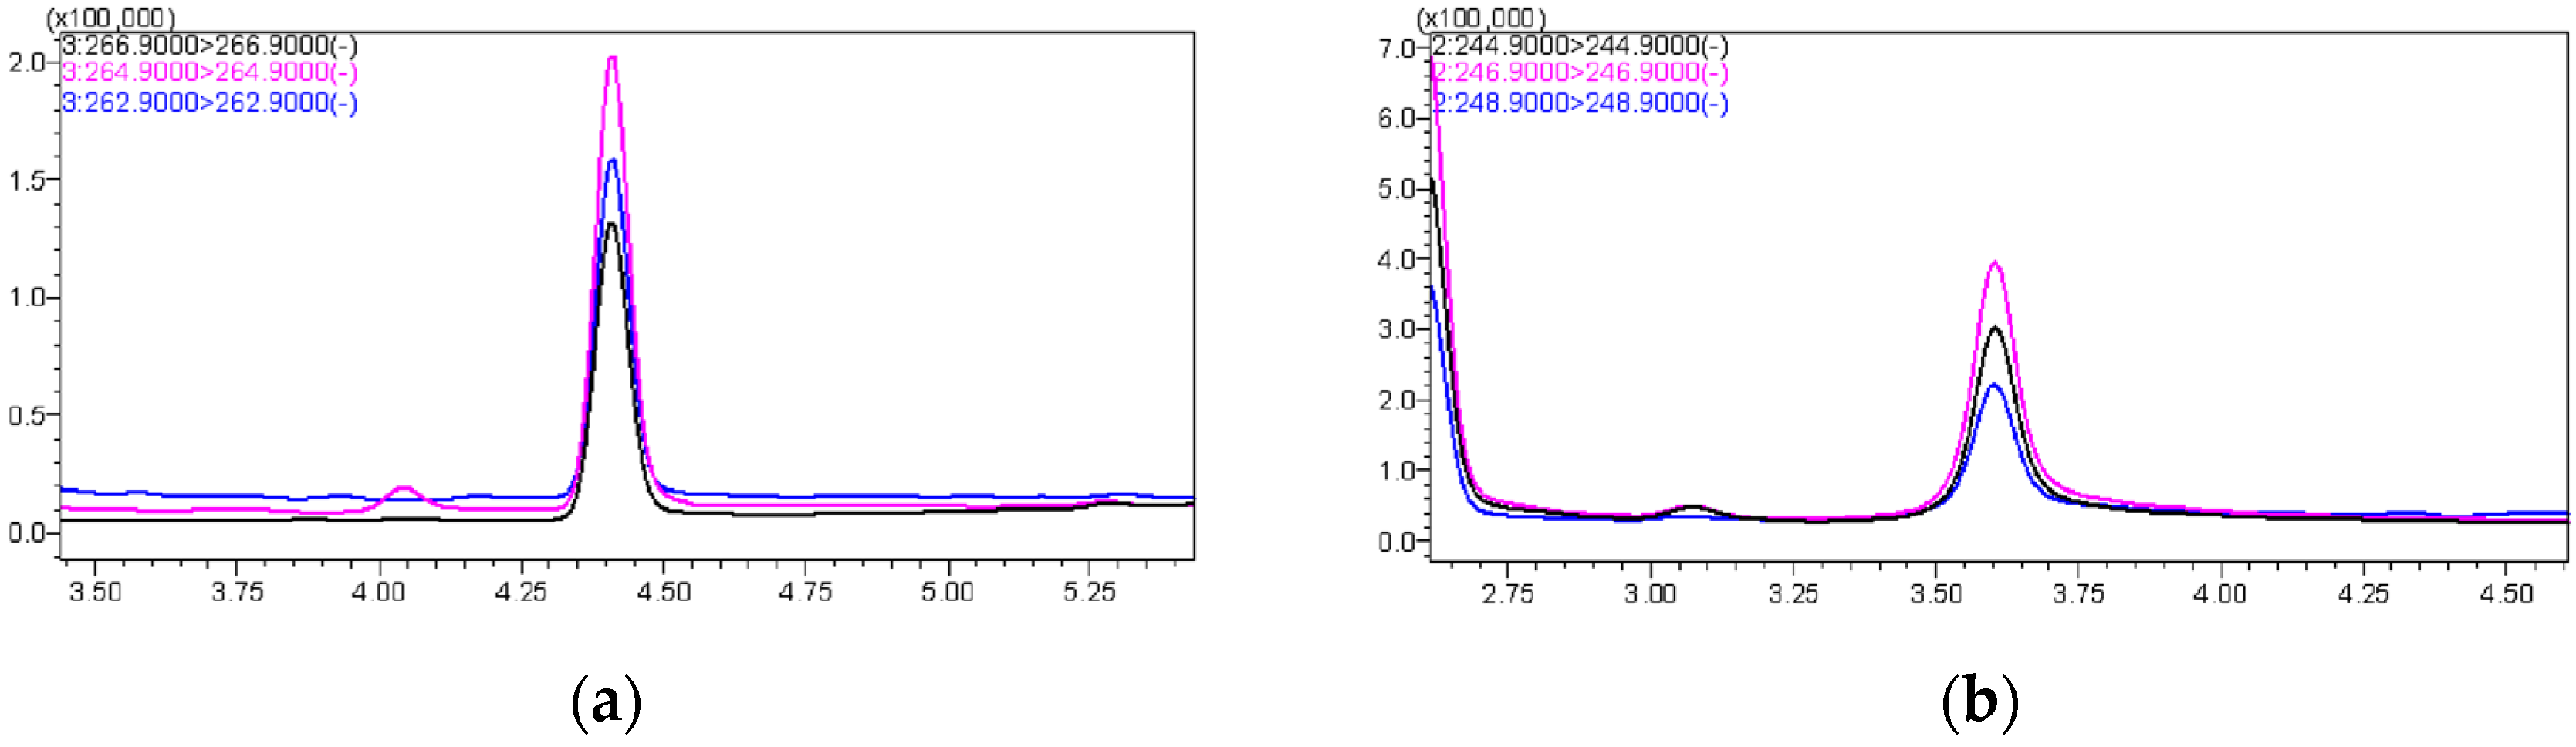
3.1.1. LC-MS/MS
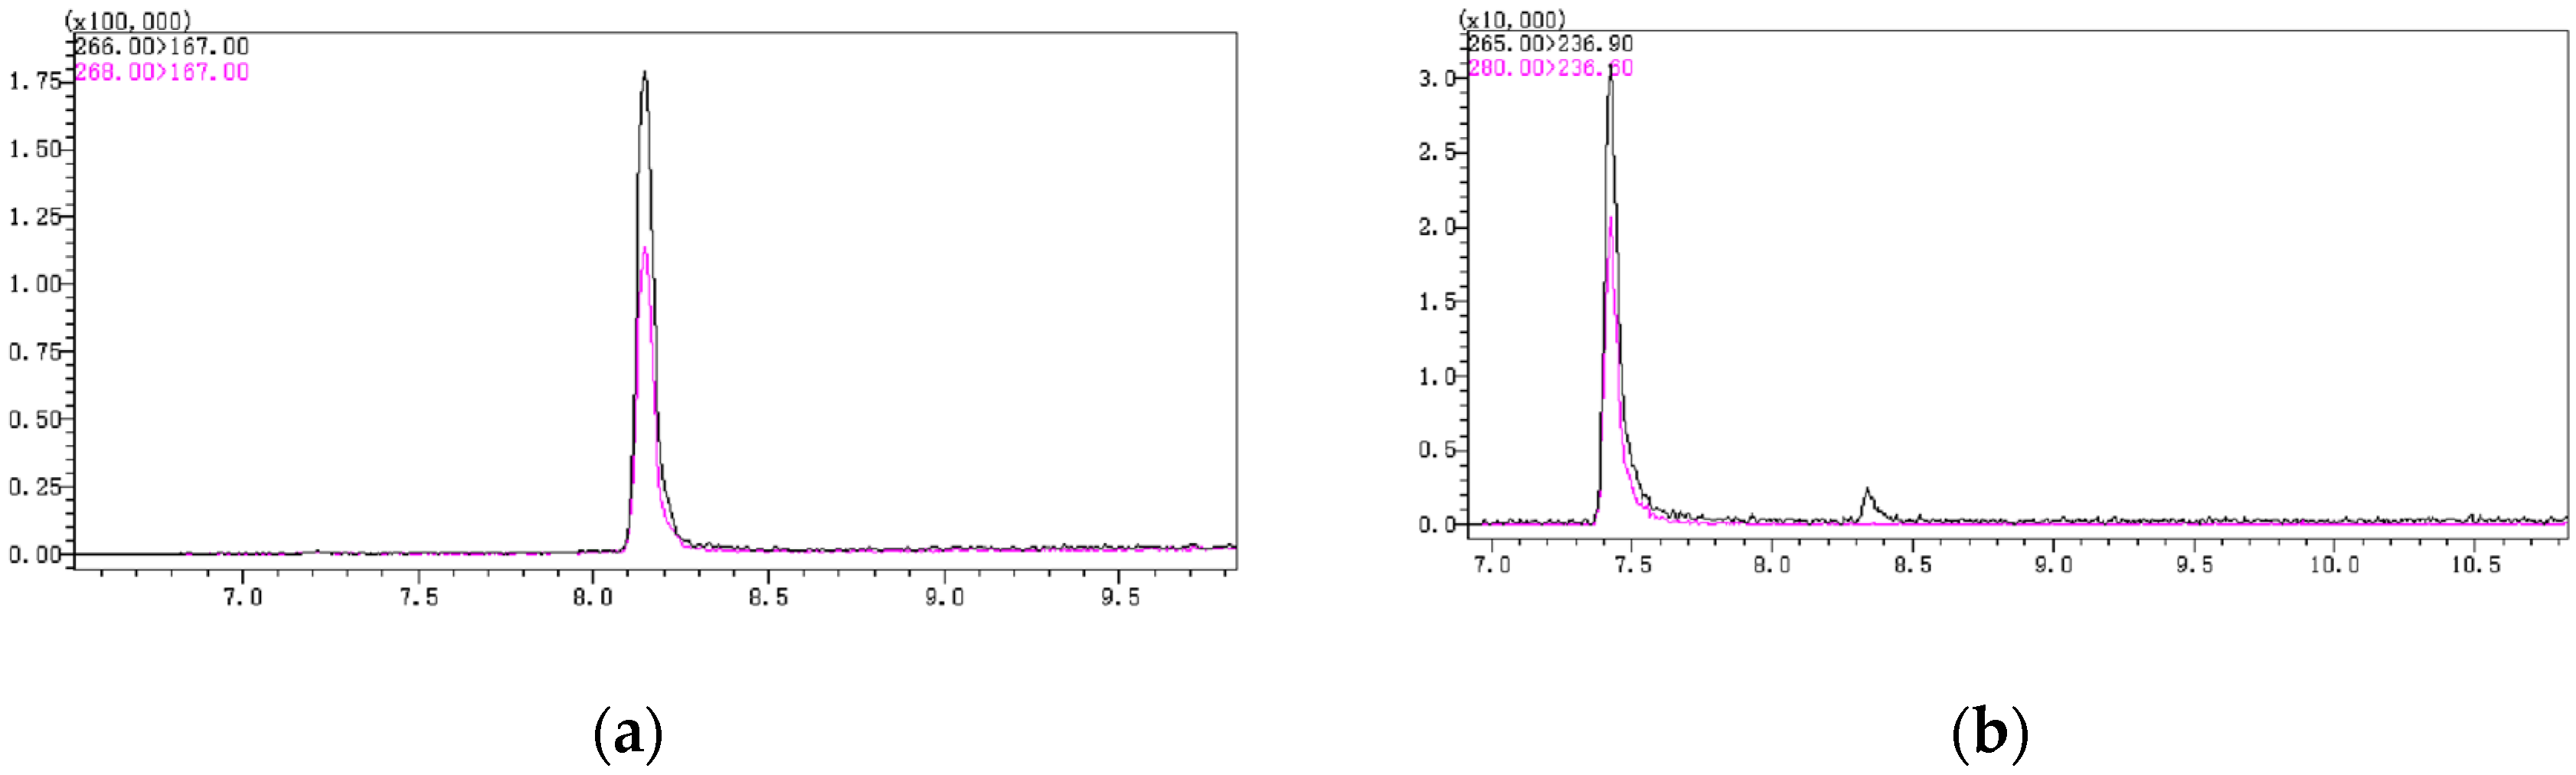
3.1.2. GC-MS/MS
3.2. Optimization of Sample Extraction
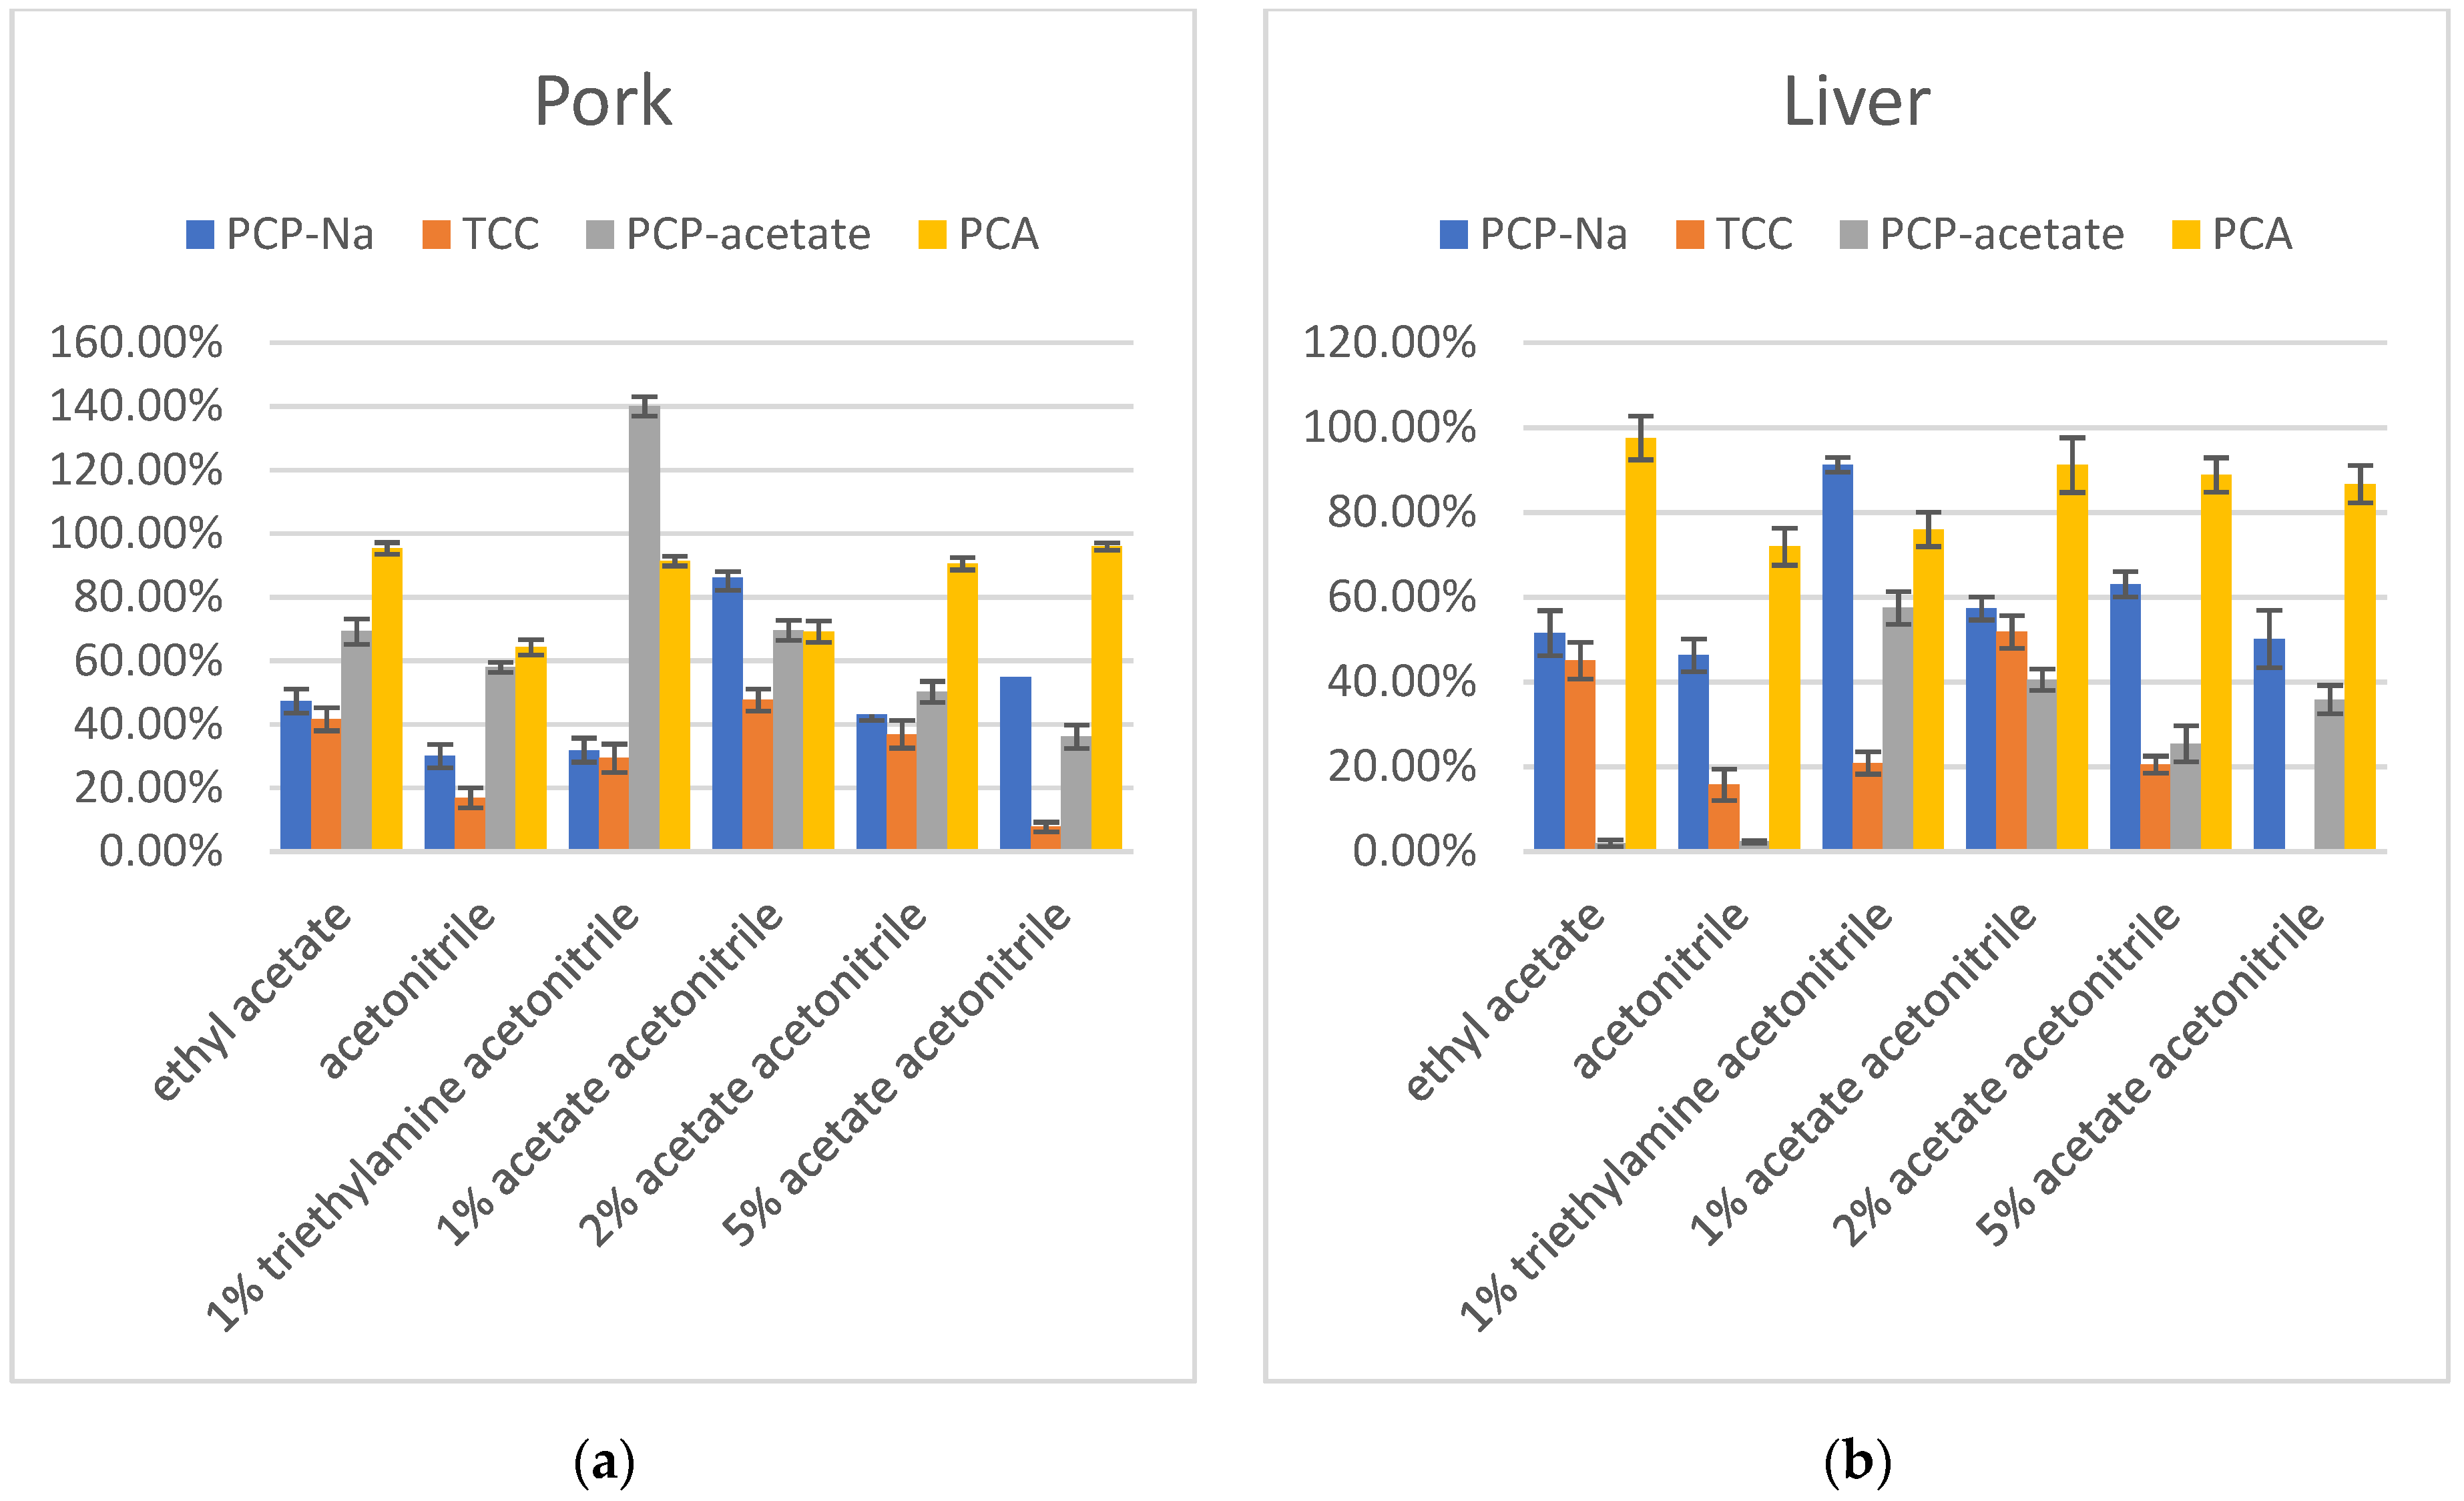
3.2.1. Extraction Solvent
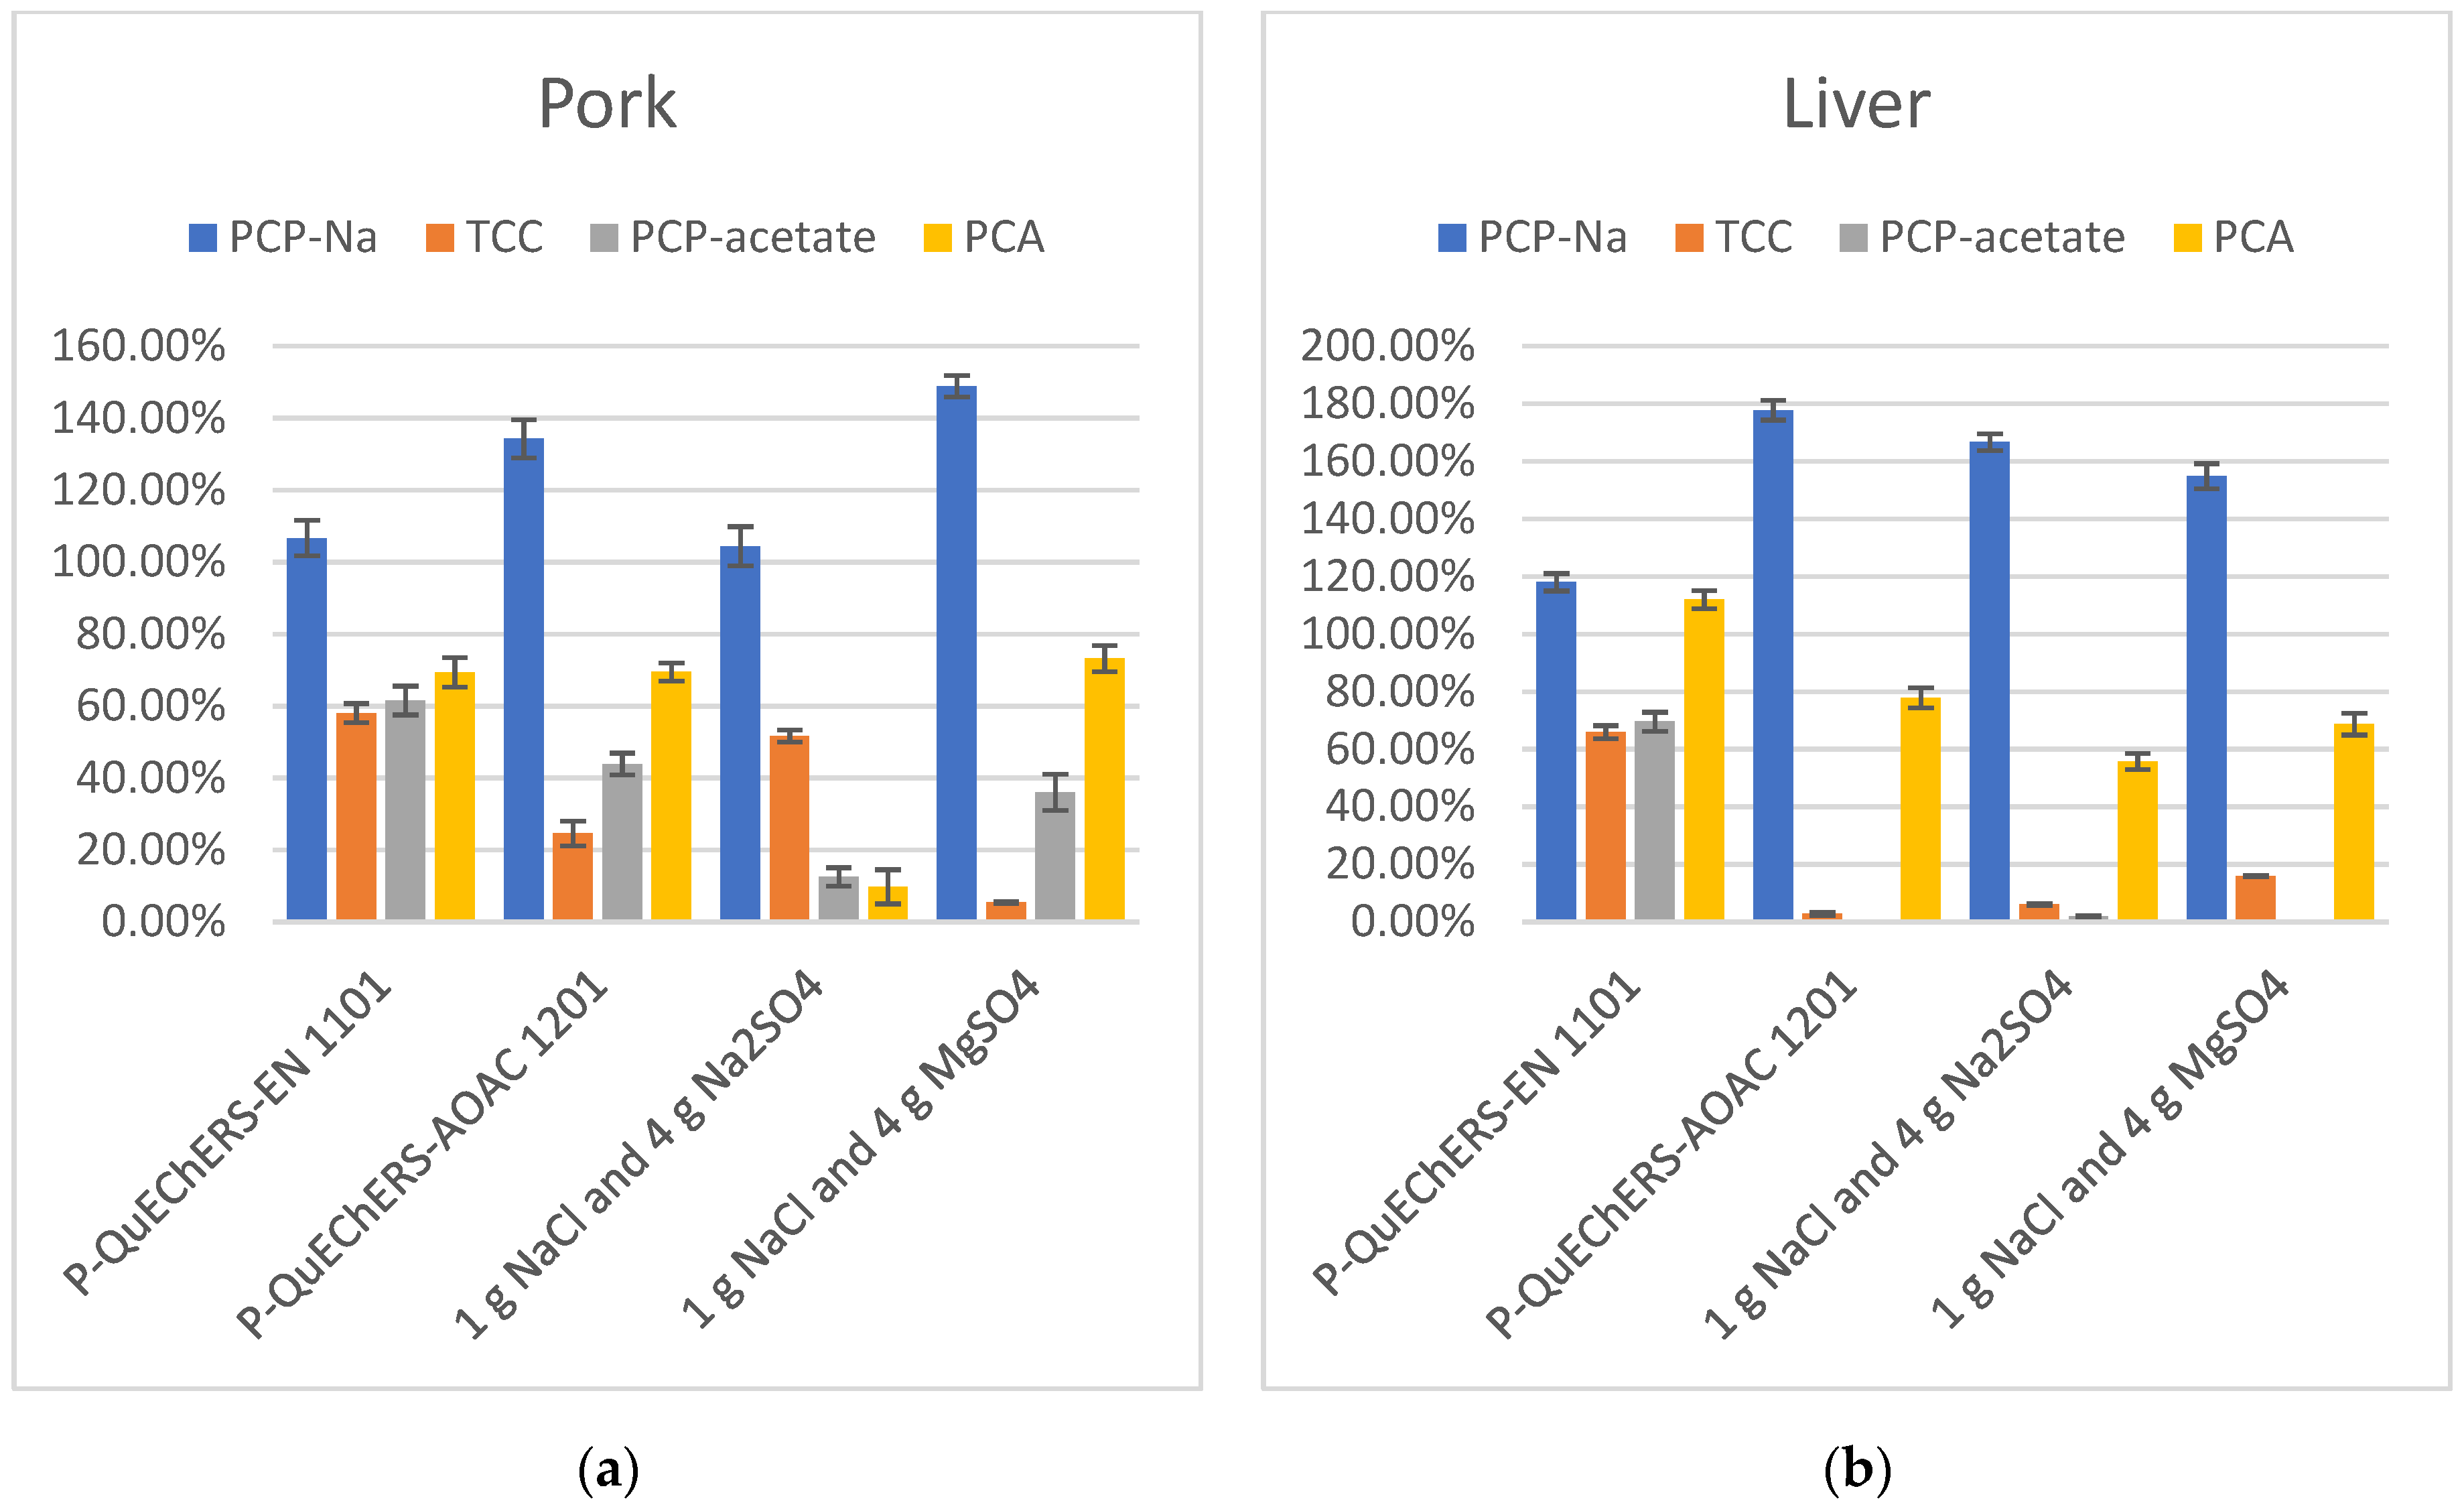
3.2.2. Extraction Salts
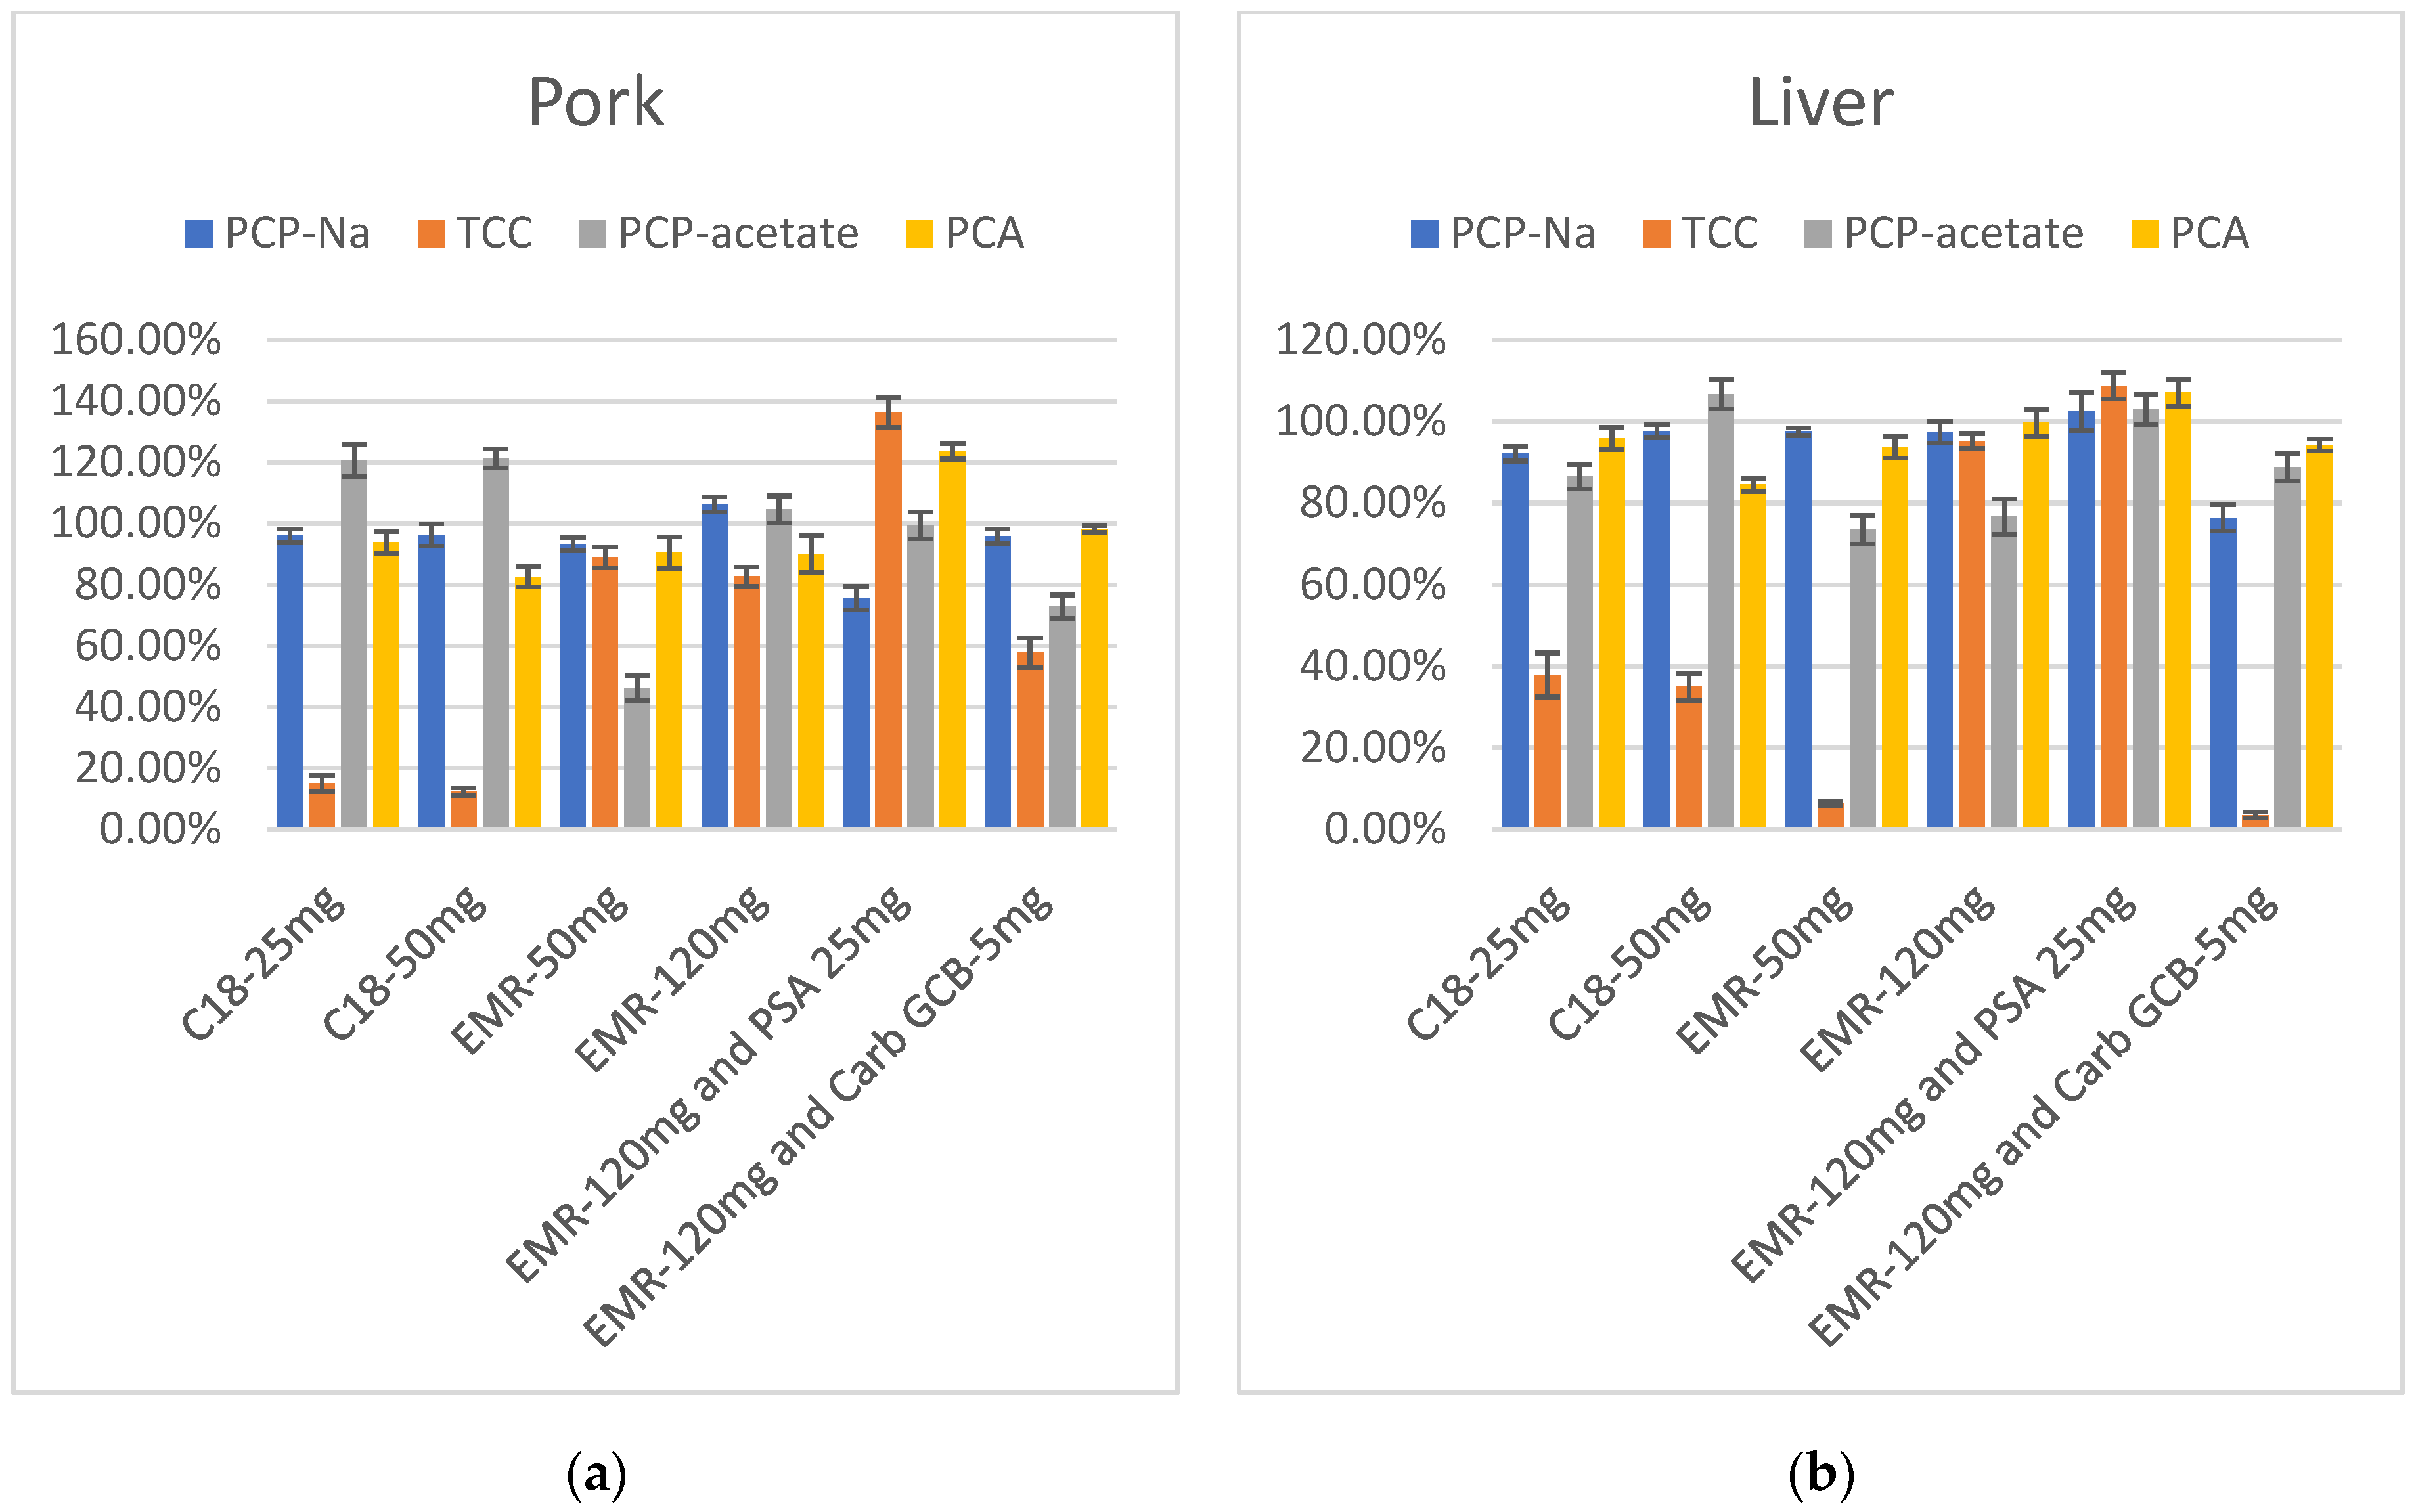
3.2.3. Purification Procedure
3.3. Method Validation
3.3.1. Accuracy and Precision
3.3.2. Linearity and Matrix Effect
3.3.3. Sensitivity
4. Conclusions
Author Contributions
Funding
Data Availability Statement
Acknowledgments
Conflicts of Interest
References
- Farhadi, K.; Farajzadeh, M.; Matin, A.; Hashemi, P. Dispersive liquid-liquid microextraction and liquid chromatographic determination of pentachlorophenol in water. Open Chem. 2009, 7, 369–374. [Google Scholar] [CrossRef]
- WHO. Environmental Health Criteria 71-Pentachlorophenol; WHO: Geneva, Switzerland, 1987. [Google Scholar]
- Mäenpää, K.A.; Penttinen, O.-P.; Kukkonen, J.V.K. Pentachlorophenol (PCP) bioaccumulation and effect on heat production on salmon eggs at different stages of development. Aquat. Toxicol. 2004, 68, 75–85. [Google Scholar] [CrossRef] [PubMed]
- Cooper, G.S.; Jones, S. Pentachlorophenol and Cancer Risk: Focusing the Lens on Specific Chlorophenols and Contaminants. Environ. Health Perspect. 2008, 116, 1001–1008. [Google Scholar] [CrossRef] [PubMed]
- Guyton, K.Z.; Loomis, D.; Grosse, Y.; El Ghissassi, F.; Bouvard, V.; Benbrahim-Tallaa, L.; Guha, N.; Mattock, H.; Straif, K.; International Agency for Research on Cancer Monograph Working Group. Carcinogenicity of pentachlorophenol and some related compounds. Lancet Oncol. 2016, 17, 1637–1638. [Google Scholar] [CrossRef] [PubMed]
- Spalding, J.W.; French, J.E.; Stasiewicz, S.; Furedi-Machacek, M.; Conner, F.; Tice, R.R.; Tennant, R.W. Responses of transgenic mouse lines p53(+/−) and Tg center dot AC to agents tested in conventional carcinogenicity bioassays. Toxicol. Sci. 2000, 53, 213–223. [Google Scholar] [CrossRef] [PubMed]
- Maheshwari, N.; Mahmood, R. Protective effect of catechin on pentachlorophenol-induced cytotoxicity and genotoxicity in isolated human blood cells. Environ. Sci. Pollut. Res. 2020, 27, 13826–13843. [Google Scholar] [CrossRef] [PubMed]
- Singh, S.; Chaube, R. Toxicological Impact of Pentachlorophenol on the Hepatic and Reproductive Activity of the Stinging Catfish Heteropneustes fossilis. Aquac. Stud. 2019, 19, 139–145. [Google Scholar] [CrossRef] [PubMed]
- Markovich, Z.R.; Hartman, J.H.; Ryde, I.T.; Hershberger, K.A.; Joyce, A.S.; Ferguson, P.L.; Meyer, J.N. Mild pentachlorophenol-mediated uncoupling of mitochondria depletes ATP but does not cause an oxidized redox state or dopaminergic neurodegeneration in Caenorhabditis elegans. Curr. Res. Toxicol. 2022, 3, 100084. [Google Scholar] [CrossRef] [PubMed]
- Namit, A.; Dowell, W.; Matiasek, S.; Webster, J.; Stachura, D.L. Pentachlorophenol has significant adverse effects on hematopoietic and immune system development in zebrafish (Danio rerio). PLoS ONE 2022, 17, e0265618. [Google Scholar] [CrossRef] [PubMed]
- Fernandes, A.R.; Mortimer, D.; Rose, M.; Smith, F.; Steel, Z.; Panton, S. Recently listed Stockholm convention POPs: Analytical methodology, occurrence in food and dietary exposure. Sci. Total Environ. 2019, 678, 793–800. [Google Scholar] [CrossRef] [PubMed]
- Chen, Y.H.; Chen, S.; Song, A.H.; Huang, J.C.; Cheng, Y.M.; Liu, J.; Wang, Y. Establishment of trace pentachlorophenol and its sodium salt in animal-origin foods by automated solid phase extraction-coupled with ultra performance liquid chromatography-tandem mass spectrometry. Food Mach. 2019, 7, 80–86. [Google Scholar]
- Wang, L.Z.; Fang, E.H.; Wang, C.J.; Chen, Y.; Lin, Z.X.; Xu, D.M. Determination of trace pentachlorophenol and its sodium salt in animal-origin foods by QuEChERS-ultra performance liquid chromatography-tandem mass spectrometry. Chin. J. Chromatogr. 2018, 36, 518–522. [Google Scholar] [CrossRef]
- Awawdeh, A.M.; Harmon, H.J. Spectrophotometric detection of pentachlorophenol (PCP) in water using water soluble porphyrins. Sens. Actuators B Chem. 2005, 106, 234–242. [Google Scholar] [CrossRef]
- Kim, H.; Kim, Y.; Park, S.; Lee, J.; Choi, J. Gas chromatographic determination of phenol in fish tissues as a phenyl acetate derivative following solvent extraction of acidified samples. Acta Chromatogr. 2020, 32, 64–67. [Google Scholar] [CrossRef]
- Wang, C.; Cheng, C.; Yang, G.; Zhang, S.; Qian, X. Determination of sodium pentachlorophenoxide residues in animal-derived foods by ultra-performance liquid chromatography-tandem mass spectrometry (UPLC-MS/MS). Agric. Biotechnol. 2022, 11, 99–101. [Google Scholar]
- State Administration for Market Regulation. Available online: https://spcjsac.gsxt.gov.cn/ (accessed on 22 October 2022).
- Yan, X.; Zhao, Q.; Yan, Z.; Chen, X.; He, P.; Li, S.; Fang, Y. Determination of Pentachlorophenol in Seafood Samples from Zhejiang Province Using Pass-Through SPE-UPLC-MS/MS: Occurrence and Human Dietary Exposure Risk. Molecules 2023, 28, 6394. [Google Scholar] [CrossRef] [PubMed]


| Compound | MRM Ion Pair (m/z) | Collision Energy (CE)/eV |
|---|---|---|
| PCP-Na | 262.9 > 262.9 1 | 5 |
| 264.9 > 264.9 | 5 | |
| 266.9 > 266.9 | 5 | |
| TCC | 244.9 > 244.9 1 | 5 |
| 246.9 > 246.9 | 5 | |
| 248.9 > 248.9 | 5 |
| Compound | MRM Ion Pair (m/z) | Collision Energy (CE)/eV |
|---|---|---|
| PCP-acetate | 266.0 > 167.0 1 | 27 |
| 268.0 > 167.0 | 36 | |
| PCA | 265.0 > 236.9 1 | 12 |
| 280.0 > 236.6 | 30 |
| Swine Sample | Compound | Spiked Level (μg/kg) | Recovery of Five Replicates (%) (n = 5) | Average (%) (n = 5) | RSD (%) (n = 5) |
|---|---|---|---|---|---|
| Pork | PCP-Na | 1 | 110.3, 104, 108.1, 107.3, 115.7 | 109.0 | 3.98 |
| 2 | 117.1, 97.6, 111.5, 90.1, 114.8 | 106.2 | 11.06 | ||
| 10 | 99.2, 96.0, 95.6, 103.4, 105.9 | 100.0 | 4.52 | ||
| TCC | 1 | 84.2, 96.5, 92.7, 81.4, 81.9 | 87.3 | 7.84 | |
| 2 | 97.7, 105.2, 85.3, 98.2, 108.2 | 98.9 | 8.95 | ||
| 10 | 70.8, 83.1, 74.9, 71.7, 79.3 | 76.0 | 6.84 | ||
| PCP-acetate | 1 | 85.9, 92.1, 88.7, 100.6, 87.1 | 90.9 | 6.51 | |
| 2 | 75.6, 83.6, 75.7, 77, 79.5 | 78.3 | 4.30 | ||
| 10 | 99.7, 103.7, 102.3, 96.6, 102.3 | 100.9 | 2.78 | ||
| PCA | 1 | 81.1, 84.6, 82.2, 78.4, 79.9 | 81.2 | 2.87 | |
| 2 | 73.1, 74.1, 88.0, 77.9, 76.8 | 78.0 | 7.58 | ||
| 10 | 89.3, 104.4, 99.5, 95.4, 82.6 | 94.2 | 9.08 | ||
| Fat | PCP-Na | 1 | 117.7, 110.3, 117.1, 117.8, 105.2 | 113.6 | 4.98 |
| 2 | 117.8, 107.9, 112.6, 119.4, 119.9 | 115.5 | 4.45 | ||
| 10 | 72.6, 71.2, 85.0, 77.4, 81.3 | 77.5 | 7.46 | ||
| TCC | 1 | 80.0, 90.9, 72.1, 82.8, 82.4 | 81.6 | 8.25 | |
| 2 | 60.5, 69.5, 67.1, 62.9, 66.1 | 65.2 | 5.42 | ||
| 10 | 68.3, 67.9, 62.7, 69.9, 67.2 | 67.2 | 4.01 | ||
| PCP-acetate | 1 | 66.0, 67.4, 62.9, 66.3, 69.1 | 62.3 | 9.75 | |
| 2 | 65.9, 67.7, 72.3, 68.5, 63.1 | 67.5 | 5.00 | ||
| 10 | 68.7, 79.7, 76.7, 83.8, 83.2 | 78.4 | 7.85 | ||
| PCA | 1 | 77.0, 76.6, 69.2, 64.2, 65.8 | 70.5 | 8.45 | |
| 2 | 72.1, 65.5, 61.1, 65.4, 66.4 | 66.1 | 5.96 | ||
| 10 | 63.9, 61.6, 68.9, 72.8, 70.3 | 67.5 | 6.81 | ||
| Liver | PCP-Na | 1 | 99.2, 98.7, 103.4, 103.3, 98 | 100.5 | 2.61 |
| 2 | 94.7, 96.2, 76.9, 92.3, 97.6 | 91.5 | 9.19 | ||
| 10 | 97.7, 100.2, 98.9, 104.4, 99.5 | 100.1 | 2.57 | ||
| TCC | 2 | 76.8, 74.1, 80.3, 89.8, 98.5 | 83.9 | 12.06 | |
| 4 | 84.9, 91.0, 71.7, 88.5, 94.1 | 86.0 | 10.13 | ||
| 20 | 72.3, 80.1, 69.2, 78.9, 76.4 | 75.4 | 6.06 | ||
| PCP-acetate | 1 | 62.1, 62.8, 67.0, 65.0, 68.7 | 65.1 | 4.26 | |
| 2 | 63.6, 65.2, 62.1, 69.5, 64.7 | 65.0 | 4.25 | ||
| 10 | 74.8, 81.4, 76.5, 69.2, 76.8 | 75.7 | 5.79 | ||
| PCA | 1 | 67.8, 65.8, 68.8, 78.6, 66.0 | 69.4 | 7.62 | |
| 2 | 63.7, 72.4, 69.0, 72.9, 66.5 | 68.9 | 5.67 | ||
| 10 | 94.4, 89.8, 95.0, 87.7, 90.8 | 91.6 | 3.39 | ||
| Heart | PCP-Na | 1 | 104.3, 106.4, 98.7, 107, 106.5 | 104.6 | 3.28 |
| 2 | 114.4, 109.1, 92.7, 116.2, 99.4 | 106.3 | 9.48 | ||
| 10 | 106.1, 106.7, 106.6, 104.3, 100.8 | 104.9 | 2.37 | ||
| TCC | 2 | 93.1, 101.5, 106.4, 93.7, 96.5 | 98.2 | 5.74 | |
| 4 | 83.6, 85.4, 73.1, 74.2, 75.1 | 78.3 | 7.32 | ||
| 20 | 76.5, 89.0, 83.4, 80.9, 92.3 | 84.4 | 7.48 | ||
| PCP-acetate | 1 | 76.6, 81.4, 70.9, 71.9, 77.4 | 75.6 | 5.66 | |
| 2 | 92.7, 93.4, 91.8, 90.5, 84.9 | 90.7 | 3.74 | ||
| 10 | 89.7, 78.4, 82.2, 91.8, 85.1 | 85.4 | 6.38 | ||
| PCA | 1 | 92.3, 92.9, 98.1, 80.5, 94.7 | 91.7 | 7.28 | |
| 2 | 102.6, 110.1, 92.3, 106.7, 93.7 | 101.1 | 7.77 | ||
| 10 | 117.8, 90.0, 109.6, 118.6, 109.7 | 109.1 | 10.54 | ||
| Lungs | PCP-Na | 1 | 106.2, 106.5, 116.7, 117.0, 113.0 | 111.9 | 4.74 |
| 2 | 100.8, 113.4, 104.2, 114.1, 105.8 | 107.6 | 5.44 | ||
| 10 | 111.3, 96.3, 99.1, 116.9, 106.9 | 106.1 | 8.03 | ||
| TCC | 1 | 63.0, 62.0, 72.6, 69.2, 62.3 | 65.8 | 7.30 | |
| 2 | 72.3, 70.7, 71.1, 72.7, 63.0 | 69.9 | 5.67 | ||
| 10 | 79.6, 78.8, 96.7, 80.9, 99.1 | 87.0 | 11.49 | ||
| PCP-acetate | 1 | 69.3, 68.1, 70.6, 63.1, 67.7 | 67.8 | 4.19 | |
| 2 | 78.6, 78.2, 72.7, 63.8, 66.5 | 72.0 | 9.35 | ||
| 10 | 91.3, 71.3, 88.5, 73.8, 88.7 | 82.7 | 11.33 | ||
| PCA | 1 | 77.6, 81.4, 81.0, 84.9, 77.0 | 80.4 | 3.94 | |
| 2 | 94.4, 85.1, 88.2, 84.8, 86.6 | 87.8 | 4.43 | ||
| 10 | 95.9, 96.1, 97.0, 96.8, 97.5 | 96.6 | 0.70 | ||
| Kidney | PCP-Na | 1 | 118.4, 115.8, 111.5, 117.2, 113.9 | 115.3 | 2.35 |
| 2 | 113.4, 112.4, 116.9, 110.9, 118.8 | 114.5 | 2.85 | ||
| 10 | 112.2, 110.2, 108.9, 115.4, 113.8 | 112.1 | 2.33 | ||
| TCC | 2 | 96.2, 82.9, 93.1, 101.1, 95.2 | 93.7 | 7.14 | |
| 4 | 92.9, 85.9, 83.6, 98.6, 93.4 | 90.9 | 6.69 | ||
| 20 | 103.2, 95.8, 92.1, 92.3, 93.5 | 95.4 | 4.83 | ||
| PCP-acetate | 1 | 63.1, 69.1, 61.5, 70.1, 66.8 | 66.1 | 5.66 | |
| 2 | 68.7, 63.5, 62.9, 63.2, 62.2 | 64.1 | 4.04 | ||
| 10 | 63.0, 60.3, 66.4, 61.2, 71.5 | 64.5 | 7.06 | ||
| PCA | 1 | 81.1, 95.2, 88.0, 82.2, 88.1 | 86.9 | 6.50 | |
| 2 | 95.5, 98.7, 87.5, 97.6, 85.7 | 93.0 | 6.45 | ||
| 10 | 95.2, 86.2, 89.1, 95.6, 90.7 | 91.4 | 4.42 |
| Swine Sample | PCP-Na | TCC | PCP-Acetate | PCA |
|---|---|---|---|---|
| Pure Solvent | Y = 4090.5X + 46,197.3 | Y = 10,039.8X + 4641.8 | Y = 13,623.0X − 152,913 | Y = 10,652.1X − 103,305.7 |
| R2 = 0.99254 | R2 = 0.99996 | R2 = 0.99217 | R2 = 0.99349 | |
| Pork | Y = 4886.4X + 24,865.4 | Y = 12,451.3X + 375,231 | Y = 38,263.9X + 16,887.4 | Y = 36,600.6X + 117,238.7 |
| R2 = 0.99926 | R2 = 0.99506 | R2 = 0.99913 | R2 = 0.99954 | |
| Fat | Y = 4937.1X + 42,273.4 | Y = 16,016.4X + 73,232.1 | Y = 15,714.8X + 78,208 | Y = 29,870.68X + 529,011 |
| R2 = 0.99894 | R2 = 0.99795 | R2 = 0.99990 | R2 = 0.99684 | |
| Liver | Y = 8772.16X + 959,843 | Y = 14,417.9X + 182,026 | Y = 14,551.1X + 594,613 | Y = 30,823.1X + 122,455.9 |
| R2 = 0.99835 | R2 = 0.99915 | R2 = 0.99449 | R2 = 0.99976 | |
| Heart | Y = 10,518.2X + 118,488 | Y = 11,327.2X + 15,768.4 | Y = 12,206.2X − 11,186.1 | Y = 24,071.68X − 82,068.2 |
| R2 = 0.99901 | R2 = 0.99991 | R2 = 0.99953 | R2 = 0.99996 | |
| Lungs | Y = 10,522.5X + 164,528 | Y = 13,053.5X + 53,755.2 | Y = 9963.12X + 17,405.2 | Y = 25,570.9X − 10,717.2 |
| R2 = 0.99706 | R2 = 0.99882 | R2 = 0.99986 | R2 = 0.99978 | |
| Kidney | Y = 11,202.3X + 555,109 | Y = 7947.16X + 6834.82 | Y = 2378.8X − 607.29 | Y = 1942.41X − 5177.4 |
| R2 = 0.99961 | R2 = 0.99802 | R2 = 0.99986 | R2 = 0.99797 |
Disclaimer/Publisher’s Note: The statements, opinions and data contained in all publications are solely those of the individual author(s) and contributor(s) and not of MDPI and/or the editor(s). MDPI and/or the editor(s) disclaim responsibility for any injury to people or property resulting from any ideas, methods, instructions or products referred to in the content. |
© 2023 by the authors. Licensee MDPI, Basel, Switzerland. This article is an open access article distributed under the terms and conditions of the Creative Commons Attribution (CC BY) license (https://creativecommons.org/licenses/by/4.0/).
Share and Cite
Jia, Q.; Cui, M.; Li, M.; Li, Y.; Meng, F.; Xu, Y.; Qian, Y.; Yan, X.; Qiu, J. Simultaneous Determination of Sodium Pentachlorophenolate and Its Metabolites in Swine Samples. Separations 2023, 10, 537. https://doi.org/10.3390/separations10100537
Jia Q, Cui M, Li M, Li Y, Meng F, Xu Y, Qian Y, Yan X, Qiu J. Simultaneous Determination of Sodium Pentachlorophenolate and Its Metabolites in Swine Samples. Separations. 2023; 10(10):537. https://doi.org/10.3390/separations10100537
Chicago/Turabian StyleJia, Qi, Miao Cui, Meiling Li, Yuncheng Li, Fanbing Meng, Yanyang Xu, Yongzhong Qian, Xue Yan, and Jing Qiu. 2023. "Simultaneous Determination of Sodium Pentachlorophenolate and Its Metabolites in Swine Samples" Separations 10, no. 10: 537. https://doi.org/10.3390/separations10100537
APA StyleJia, Q., Cui, M., Li, M., Li, Y., Meng, F., Xu, Y., Qian, Y., Yan, X., & Qiu, J. (2023). Simultaneous Determination of Sodium Pentachlorophenolate and Its Metabolites in Swine Samples. Separations, 10(10), 537. https://doi.org/10.3390/separations10100537