Abstract
Self-excited oscillation pulse jet technology is widely used to clean sediment from oil storage tanks. Its successful application is dependent on jet performance. As the cleaning requirements of the oil industry increase, it is necessary to optimise the structure of self-excited oscillation pulsed jet nozzles (SOPJNs) to optimise cleaning and energy efficiencies. In this study, the jet performance of a SOPJN is modelled and analysed based on computational fluid dynamics with consideration of a large eddy simulation and homogeneous cavitation. The modelling results are highly consistent with experimental results. The effects of the SOPJN’s inlet diameter, cavity diameter, cavity length, wall reflection angle, and inlet pressure on the jet’s peak velocity, oscillation frequency, and cavitation number were analysed. The results show that the oscillation frequency decreases with the increase of the inlet diameter d1, cavity diameter D, cavity length L and reflection angle of wall α. Optimisation of the SOPJN inlet diameter, cavity length, and wall reflection angle produced a jet with a high peak velocity and strong cavitation. The optimal nozzle cavity diameter strengthens cavitation, while the peak velocity fluctuates as the cavity diameter increases. The peak velocity increases with the inlet pressure, while the increasing rate of the peak velocity decreases. The results of this study can be used in the design and optimisation of similar nozzle structures for improved pulse jet cleaning.
1. Introduction
Crude oil storage is an essential part of oil and gas processing. Long-term storage of crude oil in a tank will result in the formation of sediment at the bottom. If not promptly removed, this sediment can seriously affect the quality of the oil and accelerate corrosion of the inner wall of the tank floor, which could potentially lead to an oil spill, fire, or other severe accident. Therefore, tank-cleaning technology is key to safe oil and gas storage [1,2]. The main tank-cleaning methods include heating of the whole tank, chemical cleaning, heat oil circulation, and crude oil injection. Problems associated with these methods include long work periods, high energy consumption and environmental pollution [3,4,5,6]. Compared with the above methods, self-excited oscillation pulsed jet cleaning technology has many advantages, such as being low-cost, energy-efficient, safe, and environmentally friendly. A current topic of interest is the improvement of self-excited oscillation pulse jet cleaning technology, which can provide lower cost and higher efficiency than existing methods. The self-excited oscillation pulsed jet nozzle (SOPJN) is the core component of such systems. The structure of the nozzle directly affects the cleaning performance and cost, so it is important to analyse the effects of nozzle geometry and dynamics on jet performance.
There have been many studies on SOPJNs, which have mainly focused on three topics. (1) The mechanism of self-excited oscillation pulsed jets has been researched. (2) The influences of various factors on jet velocity and oscillation frequency have been analysed. (3) The influences of different factors on the cavitation capability of the nozzle have been analysed. For example, Thomas et al. [7,8,9] used theoretical analysis and numerical simulation to explain the mechanism of self-excited oscillation pulsed jets. By combining large eddy simulation with experiments, Fang et al. [10] studied the three-dimensional cavitation turbulence flow inside a Helmholtz oscillator. The results show that there is a close relationship between the vortex-cavitation interaction and the flow mechanism. Liu et al. [11] designed a self-excited aspiration pulsed jet device based on a traditional low-frequency self-excited oscillation pulsed jet device and revealed its impacts, characteristics, and pulse mechanism through experiments. Wang et al. [12,13,14] analysed the effects of the structural parameters of nozzles on the jet’s peak velocity and oscillation frequency through numerical simulations and experiments and obtained optimised SOPJN structural parameters. Tamaki et al. [15,16,17] determined the main influences on an SOPJN’s cavitation capability through numerical simulations and experiments. Xiang et al. [18] researched the periodical dynamics induced by the geometric parameters and operational variables of a self-excited pulsed cavitation jet under optimum experimental conditions. They revealed the mechanism of cavitation jet occurrence by considering the jet shape, striking force, and cavity pressure. Huang and Li et al. [19,20] analysed the influences of oscillating cavity parameters on the rock-breaking performance of an oscillating pulsed jet through experiments and simulations. Together, these studies found that the jet performance of a nozzle can be evaluated by examining the peak velocity, oscillation frequency, and cavitation capability. A limitation of existing research is that only one or two indicators of jet performance have been analysed. Most researchers have only studied the relationships between nozzle structural parameters and SOPJN performance qualitatively and not quantitatively. Accordingly, the present study aims to obtain better jet performance from nozzles by comprehensively and quantitatively analysing the influences of their structural parameters on jet performance.
The CFD method is used widely in the research on cavitating jets. At present, there are three main numerical simulation models of such turbulence: Direct numerical simulations (DNS), Reynolds-averaged Navier–Stokes (RANS) models and large eddy simulations (LES). A DNS can obtain accurate information of the turbulent field and is an effective way to study turbulence mechanisms. However, existing computational resources are often insufficient for high-Reynolds-number flow simulations, which limits their application. The RANS models can calculate complex flows with high Reynolds numbers but cannot reflect the detailed information of the flow field. The LESs are based on the mechanism of turbulent kinetic energy transmission. They can directly calculate the motion of large-scale vortices and describe the influence of small-scale vortices on large-scale vortices via modelling. They not only obtain more dynamic information than RANS models, such as the structure and properties of large-scale vortices but also have higher computational efficiency than DNS. It is considered to be one of the best potential turbulent flow numerical simulation methods. Many experts have used LES and the homogeneous flow model to predict turbulent flow cavitation. The results of LES are highly consistent with those of experiments [21,22,23,24,25,26,27,28]. Thus, we chose to use the LES approach in our research. In Section 2, we will explain the main factors affecting the performance of self-excited oscillation jets in detail. We then describe the CFD method, explain the control equation, and present a two-dimensional calculation model based on fluid properties and boundary conditions. Lastly, we experimentally and theoretically verify the results of the numerical model. In Section 3, we compare the impacts of different nozzle structural parameters on the jet’s peak velocity, oscillation frequency, and cavitation number. And we examine the jet performance of the optimised nozzle under different operating parameters. In Section 4, we discuss the main conclusions of this investigation.
2. Numerical Models and Evaluation Indexes of Jet Performance
2.1. Numerical Analysis Model
2.1.1. Governing Equations
Numerical simulation is used in this paper as it can clearly monitor the internal and external flow field characteristics of the nozzle. In addition, the effects of different conditions and different nozzle structure parameters on the jet flow field can be analysed and discussed in an all-round way. Compared with the experiments, it greatly reduces the research cost and time. Therefore, the numerical simulation is also applied in this research. To clearly understand the mechanism of a self-excited oscillation pulse jet and the characteristics of cavitation bubbles and hydrodynamics, an LES model was used to analyse the flow field of the nozzle with consideration of the transition between gas and liquid.
- LES control equations
In LES equations, flow field variables are divided into large-scale pulses and small-scale pulses. To obtain control equations for large-scale pulses, filtering is adopted to eliminate small-scale pulses from the turbulent flow. Then, the additional stress of the sub-grid scale is introduced into the control equation to solve the Navier–Stokes equation. Finally, the small-scale pulses are solved by additional equations. The large-scale pulses and small-scale pulses are respectively defined as the solvability scale and grid scale of the turbulence flow.
- (1)
- Navier–Stokes equations
Navier–Stokes equations are used to describe the pulse jet. After dimensionless processing, the fluid density ρ is equal to 1 and the reciprocal of the Reynolds number is the viscosity coefficient ν. The altered Navier–Stokes equations are shown in Equation (1).
- (2)
- Filter functions
Under the LES framework, a physical quantity f can be divided into two parts in the two-dimensional incompressible turbulent flow field. The component is the large-scale pulse and component f′ is the small-scale pulse. The relationship between f, and f′ is described by Equation (2). The expression of is found in Equation (3). The Gaussian filter function Gi(xi,xi′) is in the xi-direction and its expression is shown as Equation (4). The grid length Δi is in the xi-direction.
- (3)
- LES control equations
After dimensionless processing, the Navier–Stokes equations are filtered to obtain the LES turbulence Equation (5). The sub-grid scale stress τij is the filtered momentum transport that is generated by the small- and large-scale pulses.
- (4)
- The sub-grid scale model
The Smagorinsky eddy viscosity model is adopted as the sub-grid scale model in this paper and is expressed as Equation (6). The eddy viscosity coefficient υτ can be solved by Equation (7).
- 2.
- Homogeneous Equilibrium Model
A homogeneous equilibrium model (HEM) is used to analyse cavitation flow. In the HEM, a gas-liquid two-phase fluid can be considered to be a mixed homogeneous and variable-density single-phase fluid. βl is the volume fraction of the liquid and βν is the volume fraction of liquid vapour. For a control volume βl, the value of βν can range between 0 and 1, with their sum being 1. There is no cavitation phenomenon when βl = 1 and there is complete cavitation when βl = 0. ρ is the mixture’s density and μ is the mixture’s dynamic viscosity.
Under the precondition of isothermal homogeneous flow, the compressibility of the liquid and vapour are low in the cavitation flow, and they can be considered to be an incompressible fluid [29,30,31]. Based on the above assumptions, the control equations of the two-phase turbulent flow in the nozzle are as follows:
- (1)
- Continuity equation:
- (2)
- Momentum equation:
- (3)
- Volume fraction equation:
- (4)
- Rayleigh established the Rayleigh–Plesset Equation (13) on the condition of incompressible flow. The equation can be used to calculate the process of bubble movement, growth, and collapse.
2.1.2. Calculation Model
- Nozzle geometry and calculation setup
Figure 1 shows a SOPJN consisting of three main parts: the inlet nozzle, self-excited oscillation cavity (SOC), and outlet nozzle. The SOC is marked in blue with a red boundary in Figure 1. When a high-pressure water jet is injected into the SOC at high speed, the jet produces an unstable shear layer in the SOC, and many vortex rings are generated around the shear layer [32]. In this paper, the flow characteristics in the SOC of the self-excited oscillation pulsed jet nozzle are explored.
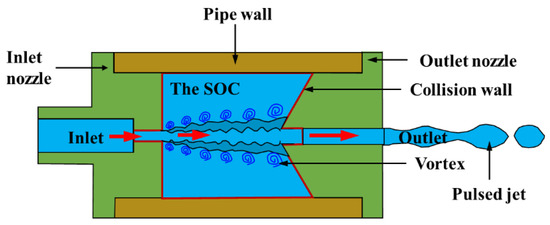
Figure 1.
Schematic diagram of the self-excited oscillation pulsed jet nozzle.
The main characteristic parameters of the SOC are described in Figure 2a. They are the inlet diameter d1, cavity diameter D, cavity length L, wall reflection angle α, and outlet diameter d2. Considering the nozzle model to be axisymmetric, a two-dimensional computational model is used, as shown in Figure 2b. To reduce calculation errors caused by the outlet boundary condition, a large external flow field is established in the computational model. As shown in Figure 2b, the area surrounded by the red line is the extended external flow field. The boundary conditions and computational grids are described in detail in Figure 2b. The fluid domain is made up of 225,097 cells. A domain mesh refinement scheme is used in the central region of the calculation model and the minimum size is 0.2 mm.
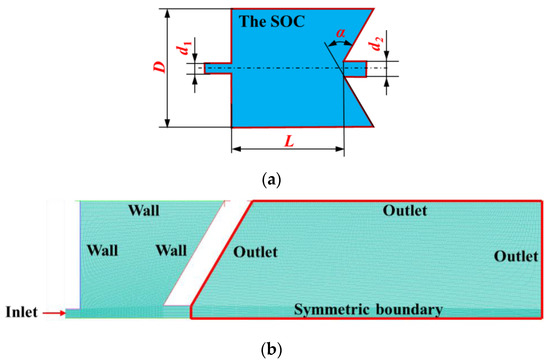
Figure 2.
(a) Geometry and (b) gridding model and boundary conditions of the self-excited oscillation cavity (SOC).
- 2.
- Boundary conditions and fluid properties
It is well-known that establishing appropriate boundary conditions is important in ensuring the convergence and accuracy of simulations. In our case, the boundary conditions for the computation are shown in Figure 2b. Pressure boundary conditions are applied at the inlet and outlet edges. The boundary conditions of the walls are defined as being impermeable and not allowing slip. Symmetry conditions are employed at the symmetric boundary. The inlet pressure is set to range between 0 MPa and 3 MPa and atmospheric pressure is used at the pressure outlet.
The fluid in the simulations and experiments is water. The saturation pressure is set to 3540 Pa, the surface tension coefficient is 0.0717 N/m, and the vapour density is 0.02558 kg/m3.
- 3.
- Calculation Settings
A monitoring point is selected on the centre axis of the calculation model, which is 50 mm apart from the exit of the outlet nozzle. The monitoring parameters include velocity, pressure, and vapour volume fraction. Based on the monitoring results, the cavitation numbers can be calculated by Equation (2).
2.2. Computational Model Validation
2.2.1. Experimental Verification
A principle diagram of the self-excited oscillation pulsed jet experiment is shown in Figure 3, in which (a) is a schematic diagram of the experimental system and (b) and (c) are the enlarged view of the region outlined by the red dotted line. The experimental purpose was to obtain the pressure and force at the monitoring point. The pressure and the force were measured by the same experimental system, but the measuring sensors were different. The pressure was measured by the pressure sensor, while the force was measured by the load cell. When the pressure was measured, the pressure sensor was installed in the experimental system, or the load cell was installed in the experimental system. The monitoring point of the maximum pressure and force are located at the centre of the end cover, which is 50 mm from the exit of the outlet nozzle, as respectively indicated in Figure 3b,c. In this experiment, the inlet diameter, cavity diameter, cavity length, angle of reflection of the wall, and outlet diameter of the nozzle are 8 mm, 100 mm, 35 mm, 60° and 11 mm, respectively. The experimental system is shown in Figure 4, which included a plunger pump, control cabinet, throttle valve, pressure gauge, pressure sensor, water tank, steel plate, and the SOPJN. The experiment measured the pressure and force at the monitoring point at inlet pressures of 1 MPa, 1.5 MPa, 2 MPa, 2.5 MPa and 3 MPa. The inlet pressure for each group was tested three times and the average value taken as the result.
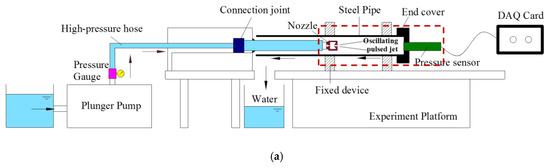
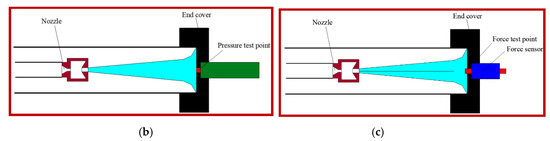
Figure 3.
(a) Schematic diagram of the experimental system and (b) enlargement of the red box containing the maximum pressure measurement point (c) enlargement of the red box containing the force measurement point.
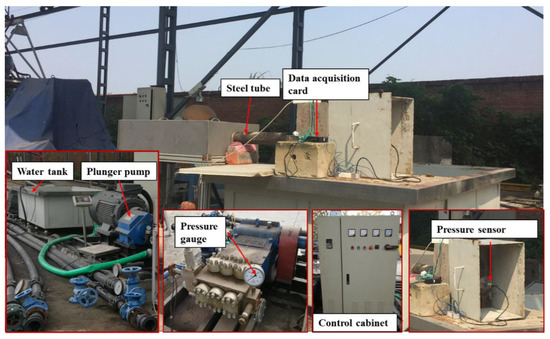
Figure 4.
High-pressure water jet measurement system.
Figure 5 compares experimental and calculated results to verify the calculation model. Figure 5a,b show that the maximum pressure errors between the two results are <8.8% and the force errors are <6.6%, indicating high consistency. This demonstrates that the numerical calculation model can be used to analyse the jet performance of the nozzle.
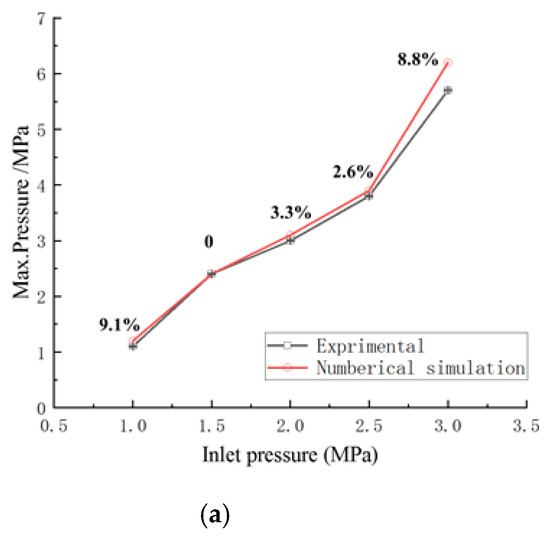
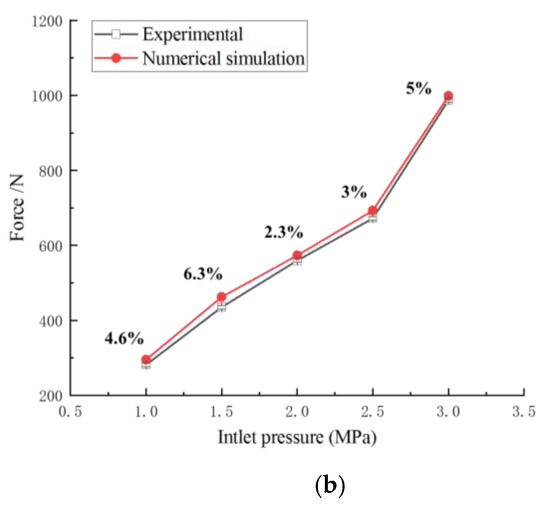
Figure 5.
Errors between the experimental and calculated values of (a) maximum pressure and (b) force.
2.2.2. Mechanism Validation
According to boundary layer and vortex theory, vortex disturbance waves are generated in the separation zone when the jet passes through the SOC. The centre pressure of the vortex disturbance wave is low. For the self-excited oscillation pulsed jet to be generated, certain conditions must be satisfied within the oscillation cavity [24]. As shown in Figure 6, there is a process of change in pressure in the SOC. As shown in Figure 6a, the vortex disturbance wave is generated at the exit of the inlet nozzle, which is then amplified as it transmits downward. Next, the vortex disturbance wave impinges upon the collision wall and is reflected effectively. Finally, new vortex disturbance waves are generated at the exit of the inlet nozzle. These five conditions are shown in Figure 6 and demonstrate that the results of the computational model are robust.
Figure 6.
Pressure contours in the SOC at different times. (a) Generation of vortex disturbance waves (b) Amplification of vortex disturbance waves (c) Amplification of vortex disturbance waves (d) Interaction between wall and disturbance waves (e) Reflection of disturbance waves (f) Generation of new vortex disturbance waves and steam pocket.
Figure 7 clearly shows that disturbance waves, steam pockets, vortex rings, and pulses are generated in the SOC. The calculation results are consistent with the conclusions of previous studies [25,26]. The mechanism of the self-excited oscillation pulsed jet is shown in Figure 7. The vortex disturbance waves are generated by differences between the jet velocity and the SOC’s inner fluid velocity. Some of the disturbance waves are amplified by the downward flow in the unstable shear layer. Next, the disturbance waves impinge upon the collision wall, then some are reflected effectively while others flow downwards with the jet. The reflected waves interact with the jet, which causes the impedance of fluid to cause periodic changes in the SOC; thus, pressure pulses occur in the flow. This process forms the self-excited oscillation pulsed jet.
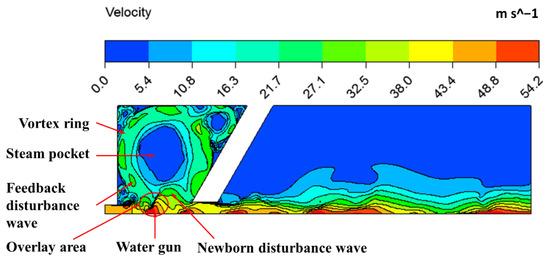
Figure 7.
Velocity contours in the SOC.
Figure 8 shows the volume fraction of vapour in the computational model. It shows that a steam pocket and a series of bubbles are generated in the nozzle. According to vortex theory, bubbles are generated in the shear layer when the centre vortex pressure is lower than the saturated vapour pressure. Meanwhile, the number of bubbles is proportional to the number of vortices, because each vortex is characterized by a single cavity. Therefore, a greater number of bubbles corresponds to a larger number of vortices and a higher oscillation frequency [12,33].
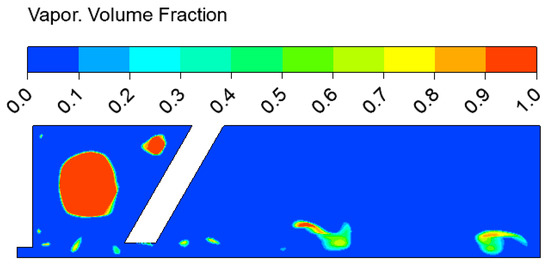
Figure 8.
Vapour volume fractions in the SOC.
A temporal behavior of velocity at the monitoring point is researched. Figure 9 is the curve of velocity over time. As described in Figure 9, the axial velocity at the monitoring point oscillates around 40 m/s over time. This is an obvious pulsed jet characteristic.
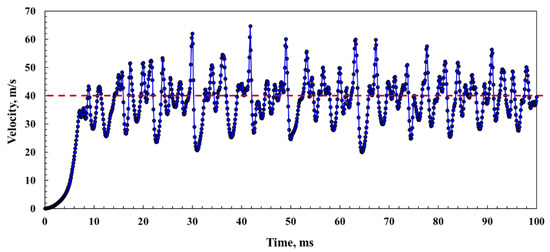
Figure 9.
Change curve of axial velocity over time at the monitoring point.
2.3. Jet Performance Evaluation Indexes
The main evaluation indices of jet performance are peak velocity, cavitation number K and oscillation frequency ω.
- Peak velocity
Jet velocity primarily consists of axial velocity and feedback velocity. Feedback velocity is a variable velocity induced by feedback disturbance waves. This paper assumes that the axial velocity has a base value and that the feedback velocity is the range of velocity amplitude. Fluctuation in the flow impedance appears in the SOC when the feedback disturbance waves interact with the jet and transforms it into a pulse jet. Higher feedback velocity results in a larger amplitude range and a greater oscillation effect. Peak velocity mainly affects the decontamination ability, with a higher peak velocity resulting in a greater decontamination effect.
- 2.
- Oscillation frequency
The expression of oscillation frequency is shown in Equation (14) [12], which shows that the oscillation frequency decreases with increases in inlet diameter, cavity diameter, and cavity length.
- 3.
- Cavitation number
When the local pressure drops below the saturation pressure of the fluid, cavitation occurs, where bubbles go through a process of formation, development, and collapsing inside the fluid or at the liquid-solid interface. The cavitation number K is a dimensionless parameter that can be used to describe the cavitation state and features. It can also be used to determine the intensity of cavitation and to judge whether cavitation happens in the fluid or at the liquid-solid interface. The cavitation number is usually defined by Equation (15) and is a very large number at the initial stage of cavitation [34]. As cavitation develops further, the cavitation number gradually decreases. The critical cavitation number is defined as K0. Cavitation will not occur unless K is less than K0. A larger value of K0 translates to a stronger capacity for cavitation.
3. Results and Discussion
3.1. Influences of Structural Parameters on Jet Performance
3.1.1. Influence of Inlet Diameter on Jet Performance
- Influence of inlet diameter on peak velocity and oscillation frequency.
With all other factors held constant in the computational model, the structure of the nozzle can be defined as d1 (Inlet diameter, mm), D (Cavity diameter, mm), α (Reflection angle of wall, °), L (Cavity length, mm), d2 (Outlet diameter, mm). In the analysis of influences of the inlet diameter d1 on the jet performance, only inlet diameter d1 is changing while the other structure parameters D, α, L, d2 are kept constant. Here, the cases are respectively analysed when d1 = 6 mm, 7 mm, 8 mm, 9 mm, 10 mm and 11 mm and the other structure parameters D = 100 mm, α = 60°, L = 35 mm, d2 = 11 mm. The cases are uniformly denoted as d1-100-60-35-11 (where d1 = 6 mm, 7 mm, 8 mm, 9 mm, 10 mm and 11 mm respectively, and D = 100 mm, α = 60°, L = 35 mm, d2 = 11 mm).
Figure 10 shows the change curves of peak velocity and feedback velocity with the inlet diameter d1, while the cavity diameter d2 is constant. The inlet flow rate and the velocity difference between the inlet jet and the fluid in the self-excited oscillation cavity are the two main factors affecting the formation and development of the disturbance wave. The larger the velocity difference is, the easier the disturbance wave will be formed. However, if the inlet flow rate is small and there is no sufficient energy, the disturbance wave is easy to collapse. Therefore, with increases in d1/d2 from 0.545 to 0.818, the inlet flow increase. It is beneficial to the development of the disturbance wave and then the feedback velocity increase at this stage. However, when the inlet diameter d1 further increases, the velocity difference between the inlet jet and the fluid in the self-excited oscillation cavity is small. It results in the difficulty of the formation of disturbance waves. In addition, then the feedback velocity gradually decreases. On one hand, with increases in d1/d2, the feedback velocity first increases and then decreases. On the other hand, based on the fluid similarity network theory and the research of Li, the self-excited oscillation system has obvious resonance characteristics [32]. Therefore, with increases in d1/d2, the peak velocity has a similar sinusoidal variation. As shown in Figure 10, when d1/d2 is 0.545 and 0.818, the peak velocity is large. However, when d1/d2 is 0.545, the feedback velocity is very small, and the jet pulse effect is poor. Therefore, the optimal value of d1/d2 is 0.818. In this situation, both the peak velocity and feedback velocity reach their peak values and the oscillation effect is optimal.
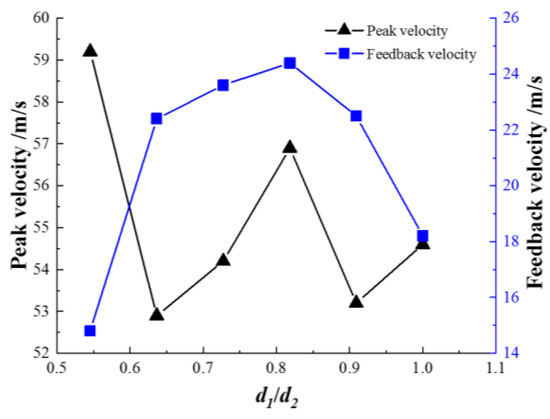
Figure 10.
Curves of peak velocity and feedback velocity vs inlet diameter.
Figure 11 shows the influence of inlet diameter d1 on the steam pocket region. It shows that as the inlet diameter d1 increases, the serial bubbles and steam pocket region decrease. The initial results show that fewer serial bubbles result in a lower oscillation frequency. Therefore, with the increase of inlet diameter d1, the oscillation frequency of the self-excited oscillation pulse jet nozzle decreases gradually.
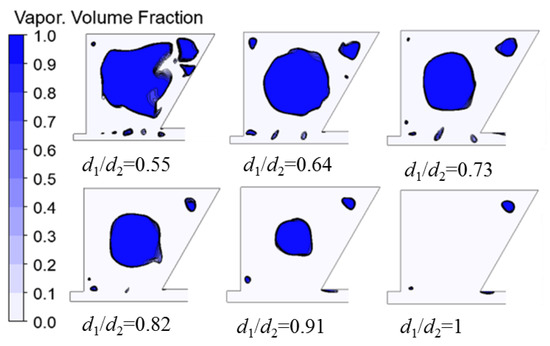
Figure 11.
Steam pocket regions of the nozzle with different inlet diameters.
- 2.
- Influence of inlet diameter on cavitation number
To intuitively deduce the cavitation at the monitoring point, this paper assumes that when the vapour content of the monitoring point is greater than 0, the volume fraction of vapour will be set to 1; otherwise, the volume fraction of vapour is set to 0. According to this rule, the curves of the vapour volume fraction and cavitation number vary with time as shown in Figure 12. This leads to the conclusion that the value of K0 is the maximum cavitation number. A greater value of K0 means the system will be prone to easier cavitation. Figure 12 expresses that the critical cavitation number peaks at 1.42 when the inlet diameter is 9 mm, during which time the cavitation capability of the nozzle is the strongest.
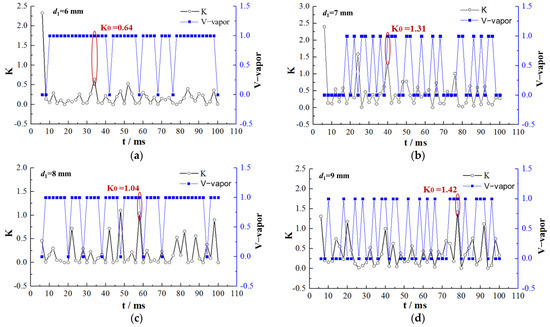
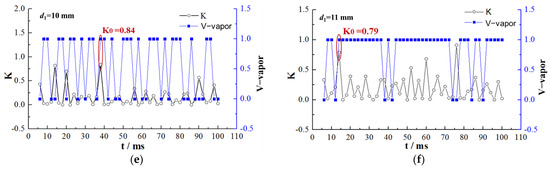
Figure 12.
Cavitation number vs time for nozzles of various inlet diameters. (a) d1 = 6 mm (b) d1 = 7 mm (c) d = 8 mm (d) d1 = 9 mm (e) d1 = 10 mm and (f) d1 = 11 mm.
3.1.2. Influence of Cavity Diameter on Jet Performance
- Influence of cavity diameter on peak velocity and oscillation frequency
The influences of cavity diameter D on the jet performance were analysed using cases with dimensions 9-D-60-35-11 (where D = 85 mm, 90 mm, 100 mm, 105 mm and 110 mm respectively, and d1 = 9 mm, α = 60°, L = 35 mm, d2 = 11 mm). The curves of peak velocity and feedback velocity vs cavity diameter are shown in Figure 13. The figure shows that as the cavity diameter D increases, the feedback velocity first increases and then decreases. It can be explained according to the changes of steam pocket shown in Figure 14.
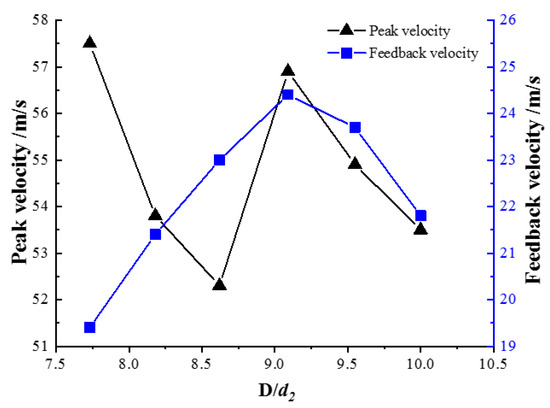
Figure 13.
Curves of peak velocity and feedback velocity vs cavity diameter.
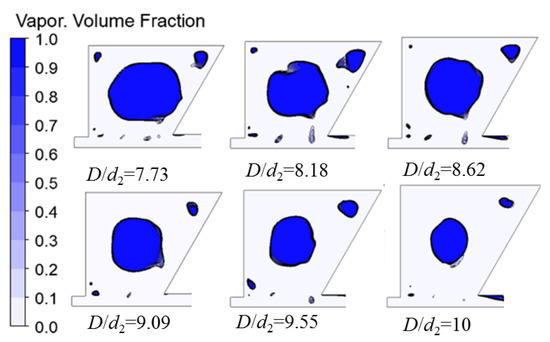
Figure 14.
Steam pocket regions of the nozzle with different cavity diameters.
Figure 14 shows that the steam pocket region is affected by the cavity diameter D. When D/d2 increases from 7.73 to 9.09, the steam pocket and serial bubbles both decrease. In addition, more energy is converted into the kinetic energy of the disturbance wave, then the feedback velocity gradually increases. When D further increases, a larger cavity diameter results in more fluid being contained within the cavity. If the inlet velocity and flow is the same, the total energy is the same. Then more fluid is contained in the steam pocket, which reduces the feedback velocity. Therefore, as the cavity diameter D increases, the feedback velocity increases first and then decreases. Feedback velocity and peak velocity peaks when D/d2 is approximately 9 and the oscillation effect is the greatest.
- 2.
- Influence of cavity diameter on cavitation number
Figure 15 shows curves of the vapour volume fraction and cavitation number vs time. The graphs indicate that as the cavity diameter increases, K0 initially increases and then decreases. K0 peaks at 1.42 with a cavity diameter of 100 mm.
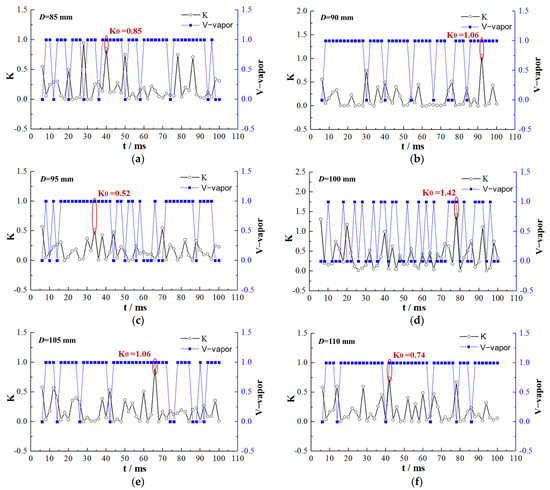
Figure 15.
Cavitation numbers with nozzles of different cavity diameter. (a) D = 85 mm (b) D = 90 mm (c) D = 95 mm (d) D = 100 mm (e) D = 105 mm and (f) D = 110 mm.
3.1.3. Influence of Cavity Length on Jet Performance
- Influence of cavity length on peak velocity and oscillation frequency
The jet performance of the nozzle was analysed using cases with the structural parameters of 9-100-60-L-11 (where L = 25 mm, 30 mm, 35 mm, 40 mm, 45 mm and 50 mm respectively, and d1 = 9 mm, D = 100 mm, α = 60°, d2 = 11 mm). Figure 16 shows that as the cavity length L increases, the peak velocity and feedback velocity first increase and then decrease. At L/d2 values of 3–3.5, the peak velocity and feedback velocity are both higher. As L/d2 increases from 2.27 to 3.18, the disturbance wave develops more and more fully in the disturbance layer, and the feedback velocity of the disturbance wave increases gradually. However, as the further increase of L/d2, when L/d2 > 3.18, the path of the disturbance wave increases, and more energy is spread to the vortex ring. It leads to the gradual decrease of the feedback velocity.
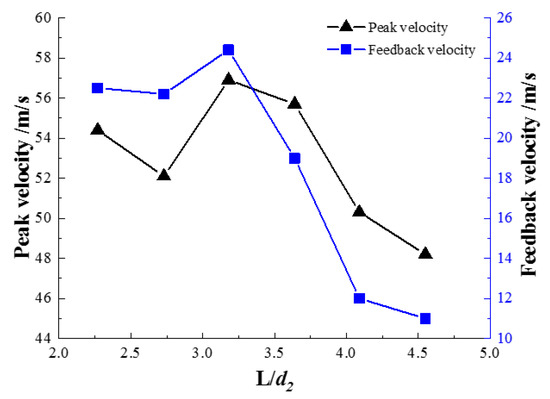
Figure 16.
Curves of peak velocity and feedback velocity with cavity length.
Figure 17 shows that the steam pocket region is affected by the length of the cavity. When the cavity length increases, the steam pocket gradually increases. However, if the cavity length is too short, the disturbance wave cannot fully develop in the shear layer, which prevents the feedback velocity from reaching its peak.
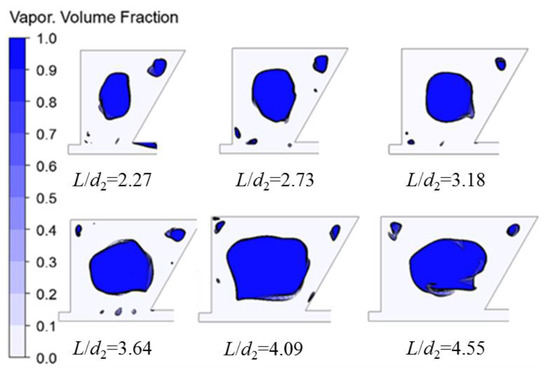
Figure 17.
Steam pocket regions of the nozzle at different cavity lengths.
- 2.
- Influence of cavity length on cavitation number
Figure 18 shows the curves of the vapour volume fraction and cavitation number with time. The figure demonstrates that the critical cavitation number peaks at a cavity length of 35 mm.
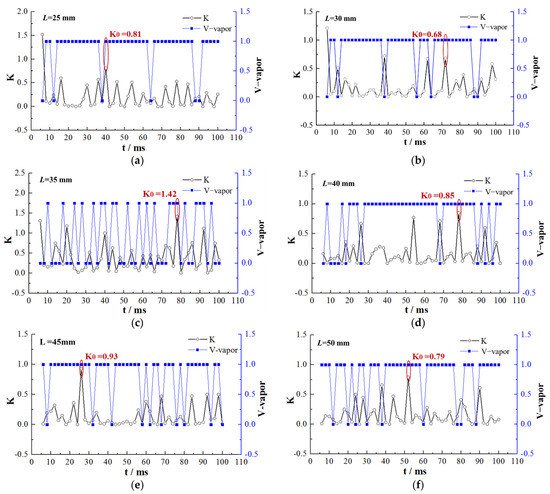
Figure 18.
Cavitation numbers with nozzles of various cavity lengths (a) L = 25 mm (b) L = 30 mm (c) L = 35 mm (d) L = 40 mm (e) L = 45 mm and (f) L = 50 mm.
3.1.4. Influence of the Angle of Reflection of the Wall on Jet Performance
- Influence of wall reflection angle on peak velocity and oscillation frequency
The jet performance of the nozzle was analysed using cases with the structural parameters of 9-100-α-35-11 (where α = 50°, 60°, 70°, 80°, 90° or 100° respectively, and d1 = 9 mm, D = 100 mm, L = 35 mm, d2 = 11 mm). Figure 19 shows that as the wall reflection angle increases, the peak velocity first increases and then decreases. The peak velocity is maximum when α = 60°. The feedback velocity increases with the increase in α, and becomes stable when α is greater than 60°. This is because when α increases from 50° to 60°, the low-speed fluid in the oscillating cavity gradually decreases. Under the same inlet jet energy, the low-speed fluid consumes less disturbed wave energy, and the feedback velocity of the disturbed wave gradually increases. When α is greater than 60°, although the low-velocity fluid in the oscillating cavity decreases gradually, the steam pocket in the oscillating cavity becomes larger significantly as shown in Figure 20. The larger steam pocket will absorb more energy of the disturbed wave. Under the comprehensive function of the two factors, the feedback velocity of the disturbed wave gradually becomes stable.
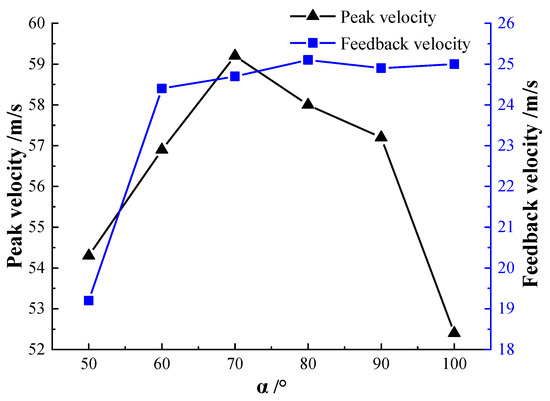
Figure 19.
Curves of peak velocity and feedback velocity with wall reflection angle.
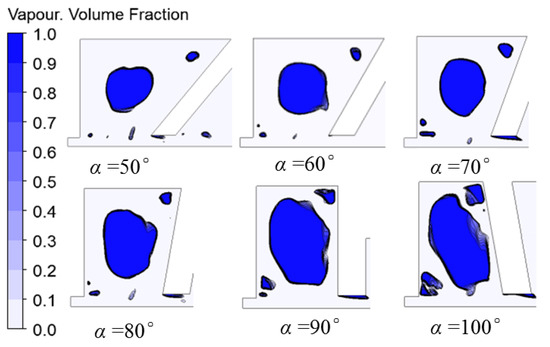
Figure 20.
Steam pocket regions of the nozzle with different wall reflection angles.
Figure 20 shows that the steam pocket region is affected by the wall reflection angle. As the angle increases, the steam pocket increases gradually and the serial bubbles decrease. Therefore, the oscillation frequency gradually decreases with increases in angle.
- 2.
- Influence of wall reflection angle on cavitation number
Curves of vapour volume fraction and cavitation number with time are shown in Figure 21. The critical cavitation number peaks at an angle of 60°.
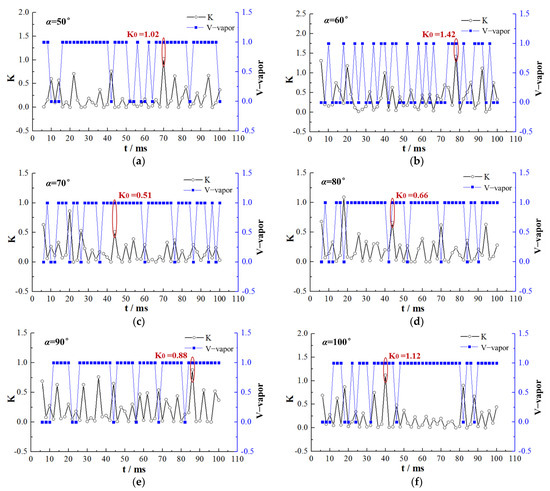
Figure 21.
Cavitation numbers of the nozzle at different wall reflection angles. (a) α = 50° (b) α = 60° (c) α = 70° (d) α = 80° (e) α = 90° and (f) α = 100°.
3.2. Synthesis of Results and the Influence of Operating Parameters on Jet Performance
- Synthesis of results
By analysing the influences of the structural parameters on jet performance, it was found that the peak velocity is greatest when the value of d1/d2 is 0.818. The cavitation capability is the strongest when d1/d2 = 0.818. Considering the cleaning requirements, the optimal value of d1/d2 is 0.818. When the value of D/d2 is 9.09, the nozzle has better cavitation capability, a better oscillation effect, and a greater peak velocity. The peak velocity and feedback velocity are highest when L/d2 = 3–3.5. The critical cavitation number peaks when L/d2 = 3–3.5. The nozzle has a good cavitation capability and oscillation effect at a wall reflection angle of 60°. At 70°, the peak velocity reaches its maximum value but the cavitation capability is very weak. Therefore, the angle should be set to 60–70°.
- 2.
- Influence of inlet pressure on jet performance
As noted above, the nozzle has optimal jet performance when its structural parameters are 9-100-60-35-11. The velocity contours under different inlet pressures are shown in Figure 22. The figure shows that as the inlet pressure increases, the peak velocity gradually increases and, at the same time, the velocity enhancement decreases. This is because as the inlet pressure increases in the cavity, there is an increase in the loss of kinetic energy, which leads to a gradual reduction in the peak velocity enhancement. After this, the disturbance wave and its velocity are rapidly increased and there is an increase in the inlet pressure. As the inlet pressure increases, the number of the disturbance wave increases significantly and its velocity increases. Then the disturbance frequency of the disturbance wave on the axis velocity increases, which finally results to the increase of the oscillation frequency of the pulsed jet.
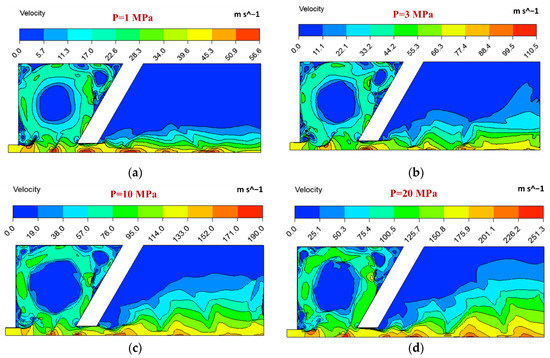
Figure 22.
Velocity contours of the nozzle at different inlet pressures. (a) P = 1 MPa (b) P = 3 MPa (c) P = 10 MPa and (d) P = 20 MPa.
4. Conclusions
This paper first analysed the factors influencing jet performance. Then, the flow field of the nozzle was analysed by numerical simulation, the results of which had high consistency with the experimental results. Finally, to determine the nozzle with optimal oscillation and cavitation capability, the influences of structural and operating parameters on jet performance were analysed. The following conclusions were obtained via analysis of the models:
- (1)
- A self-excited oscillating pulse jet formation mechanism was described. The results show that the number of serial eddies in the disturbance layer is proportional to the oscillation frequency. When the serial eddies remain the same, there is a larger steam pocket and lower oscillation frequency.
- (2)
- The influences of the key structural parameters of self-excited oscillating nozzles on peak velocity, oscillation frequency, and critical cavitation number were revealed. With increases in inlet diameter, cavity diameter, cavity length, and wall reflection angle, the oscillation frequency decreases. Peak velocity fluctuates with changes in the cavity diameter, while the critical cavitation number increases with cavity diameter. As the inlet pressure increases, the peak velocity gradually increases and the peak velocity enhancement decreases.
- (3)
- The working performance of a self-excited oscillating nozzle is influenced by its structural parameters and working pressure. The nozzle has a better cavitation capability, oscillation effect and greater peak velocity when d1/d2 = 0.818, D/d2 is approximately 9, L/d2 = 3–3.5, and the angle α= 60–70°. Then, in this situation, the self-excited oscillating nozzle has better cleaning ability at a constant working pressure. However, the increase in working pressure is beneficial to increasing the peak velocity and enhancing the cleaning ability of the self-excited oscillating nozzle.
Author Contributions
Conceptualization, methodology, and validation, B.F.; formal analysis and writing—original draft preparation, S.Z.; writing—review and editing, L.S. All authors have read and agreed to the published version of the manuscript.
Funding
This project was supported by the Natural Science Foundation of China (No. 51974036 and No. 51604039), the Yangtze Fund for Youth Teams of Science and Technology Innovation (No. 2016cqt01) and the New Generation Information Technology Innovation Program (No. 2019ITA04001).
Institutional Review Board Statement
Not applicable.
Informed Consent Statement
Not applicable.
Data Availability Statement
The data that support the finding of this study are available within the article.
Conflicts of Interest
The authors declare that they have no conflict of interest.
Nomenclature
| ν | Viscosity coefficient, dimensionless, ν = 1/Re |
| Re | Reynolds number, dimensionless |
| F | Body force, N |
| P | Fluid pressure, Pa |
| u | Velocity, m/s |
| Δi | Length of grid, m |
| τij | Grid dimension stress, N |
| υτ | Eddy viscosity coefficient, dimensionless |
| Cs | Smagorinsky constant, Cs = 0.1 |
| ij | Tensor of deformation rate |
| Δ | Filtering width, m, Δ = (Δx2 + Δy2)1/2 |
| ρ | Mixture density, kg/m3 |
| μ | Mixture dynamic viscosity, Pa·s |
| Velocity, m/s | |
| t | Time, s |
| n | Number of bubbles |
| r | Radius of the bubble, m |
| σ | Surface tension of the fluid, N |
| pvap | Pressure within the bubble, Pa |
| D | Cavity diameter, m |
| L | Cavity length, m |
| α | Reflection angle of wall, degree |
| d0 | Pipe diameter, m |
| a | Wave velocity, m/s |
| K | Cavitation number, dimensionless |
| pi | Absolute pressure of fluid, Pa |
| ps | Saturation pressure of fluid, Pa |
| Δx, Δy | The width of grid along with the X axis and Y axis direction, m |
| ρl, ρν | Liquid density, Vapour density, kg/m3 |
| μL, μν | Liquid dynamic viscosity, Vapour dynamic viscosity, Pa·s |
| βl, βν | Volume fraction of liquid, Volume fraction of vapour, % |
| d1, d2 | Inlet diameter, Outlet diameter, m |
References
- Domínguez, A.; Menéndez, J.A.; Inguanzo, M.; Pis, J.J. Investigations into the characteristics of oils produced from microwave pyrolysis of sewage sludge. Fuel Process. Technol. 2005, 86, 1007–1020. [Google Scholar] [CrossRef]
- Han, W.L. Storage Tank Corrosion and Its Protection Measures. Pet. Eng. Constr. 2010, 36, 41–47. [Google Scholar]
- Xu, R.L. Present Situation and Research of Treatment of Sludge from Oil-tanks. Petrochem. Saf. Technol. 2003, 19, 36–39. [Google Scholar]
- Shaheen, S.E.; Zhou, A.L. Chemical processing and machinery operation of tank cleaning. Foreign Oilfield Eng. 2000, 7, 48–50. [Google Scholar]
- Wartel, M. Method for Cleaning an Oil Storage Tank and Device for Implementing Same. European Patent EP1091812, 22 August 2007. [Google Scholar]
- Dixon, R. Storage Tank Cleaning Method and Apparatus. U.S. Patent EP2303475, 23 December 2009. [Google Scholar]
- Morel, T. Experimental study of a jet-driven Helmholtz oscillator. Am. Soc. Mech. Eng. 1978, 101, 383–390. [Google Scholar] [CrossRef]
- Liao, Z.F.; Tang, C.L. Theory of the self-excited oscillation pulsed jet nozzle. J. Chongqing Univ. 2002, 25, 24–27. [Google Scholar]
- Liao, Z.F.; Li, J.; Chen, D.; Deng, X.; Tang, C.; Zhang, F. Theory and experimental study of the self-excited oscillation pulsed jet nozzle. Chin. J. Mech. Eng. 2003, 16, 379–383. [Google Scholar] [CrossRef]
- Fang, Z.L.; Zeng, F.D.; Xiong, T.; Wei, W.; Jiang, P.; Wu, Q.; Wang, Y.; Fei, Y. Large eddy simulation of self-excited oscillation inside Helmholtz oscillator. Int. J. Multiph. Flow 2020, 126, 103253. [Google Scholar] [CrossRef]
- Liu, X.Y.; Xu, H.Z.; Zhao, L.; Yu, X.; Chen, H.; Zhang, S.; Ji, J. Investigation of the impact characteristics and pulse mechanism of a self-excited aspiration pulsed jet device. Exp. Therm. Fluid Sci. 2021, 124, 110371. [Google Scholar] [CrossRef]
- Wang, H.M.; Jiao, L. Numeireal simulation of self- excited oscillation Pulsed jet and analysis of Parameters’ influence. J. Zhejiang Univ. (Eng. Sci.) 2005, 39, 1450–1454. [Google Scholar]
- Hu, D.; Li, X.H.; Tang, C.-L.; Kang, Y. Analytical and experimental investigations of the pulsed air–water jet. J. Fluids Struct. 2015, 54, 88–102. [Google Scholar] [CrossRef]
- Tang, C.L.; Hu, D.; Zhang, F.H. Study on the frequency characteristic of self-excited oscillation pulsed water jet. Adv. Mater. Res. 2011, 317–319, 1456–1461. [Google Scholar] [CrossRef]
- Peng, G.Y.; Shimizu, S. Progress in numerical simulation of cavitation water jets. J. Hydrodyn. 2013, 25, 502–509. [Google Scholar] [CrossRef]
- Tamaki, N.; Shimizu, M.; Hiroyasu, H. Enhancement of the atomization of a liquid jet by cavitation in a nozzle hole. At. Sprays 2001, 11, 125–137. [Google Scholar]
- Payri, F.; Payri, R.; Salvador, F.J.; Martínez-López, J. A contribution to the understanding of cavitation effects in Diesel injector nozzles through a combined experimental and computational investigation. Comput. Fluids 2012, 58, 88–101. [Google Scholar] [CrossRef] [Green Version]
- Xiang, L.H.; Wei, X.S.; Chen, S.Y. Experimental study on the frequency characteristics of self-excited pulsed cavitation jet. Eur. J. Mech. B/Fluids 2020, 83, 66–72. [Google Scholar] [CrossRef]
- Huang, M.; Kang, Y.; Wang, X.C.; Hu, Y.; Cai, C.; Liu, Y.; Chen, H. Experimental investigation on the rock erosion characteristics of a self-excited oscillation pulsed supercritical CO2 jet. Appl. Therm. Eng. 2018, 139, 445–455. [Google Scholar] [CrossRef]
- Li, H.S.; Liu, S.Y.; Jia, J.G.; Wang, F.; Guo, C. Numerical simulation of rock-breaking under the impact load of self-excited oscillating pulsed waterjet. Tunn. Undergr. Space Technol. 2020, 96, 103179. [Google Scholar] [CrossRef]
- Egerer, C.P.; Hickel, S.; Schmidt, S.J.; Adams, N. Large-eddy simulation of turbulent cavitating flow in a micro channel. Phys. Fluids 2014, 26, 1–40. [Google Scholar] [CrossRef]
- Ji, B.; Luo, X.W.; Arndt, R.E.; Peng, X.; Wu, Y. Large Eddy Simulation and theoretical investigations of the transient cavitating vortical flow structure around a NACA66 hydrofoil. Int. J. Multiph. Flow 2015, 68, 121–134. [Google Scholar] [CrossRef] [Green Version]
- Ji, B.; Luo, X.W. Three-dimensional large eddy simulation and vorticity analysis of unsteady cavitating flow around a twisted hydrofoil. J. Hydrodyn. 2013, 25, 510–519. [Google Scholar] [CrossRef]
- Molina, S.; Salvador, F.J.; Carreres, M.; Jaramillo, D. A computational investigation on the influence of the use of elliptical orifices on the inner nozzle flow and cavitation development in diesel injector nozzles. Energy Convers. Manag. 2014, 79, 114–127. [Google Scholar] [CrossRef]
- Vinkovic, I.; Aguirre, C.; Simoë, S.; Gorokhovski, M. Large eddy simulation of droplet dispersion for inhomogeneous turbulent wall flow. Int. J. Multiph. Flow 2006, 32, 344–364. [Google Scholar] [CrossRef]
- Yu, Y.S.; Li, G.X. Multiphase Large Eddy Simulation of Diesel Fuel Spray Atomization. Chin. Intern. Com-Bustion Engine Eng. 2009, 30, 39–44. [Google Scholar]
- Huang, B.; Zhao, Y.; Wang, G.Y. Large Eddy Simulation of turbulent vortex-cavitation interactions in transient sheet/cloud cavitating flows. Comput. Fluids 2014, 92, 113–124. [Google Scholar] [CrossRef]
- Li, G.S.; Shen, Z.H. Theory and Application of Self-Resonating Cavitating Water Jet; Chain University of Petroleum Press: Dongying, China, 2008. [Google Scholar]
- Lai, S.Q.; Liao, Z.F. The Theory and Experimental Study of the Self-Excited Oscillation Pulsed Jet Nozzle (Pipeline Pulsed Flow Generator). Nat. Resour. 2013, 4, 395–403. [Google Scholar] [CrossRef] [Green Version]
- Zhang, Z.S.; Cui, G.X.; Xu, C.X. Theory and Application of Numerical Simulation of Large Eddy Simulation Turbulence; Qinghua University Press: Beijing, China, 2008. [Google Scholar]
- Du, Y.K.; Wang, R.H.; Ni, H.J. Large eddy simulation of self-oscillation pulsed water jet drawing in annulus fluid. J. Hydrodyn. (Ser. A) 2009, 24, 455–462. [Google Scholar]
- Li, H.S. Rock Breaking Performance of Self-Excited Oscillating Pulsed Waterjet. Ph.D. Thesis, China University of Mining and Technology, Beijing, China, 2020. [Google Scholar]
- Wang, P.; Ni, H.J.; Wang, R.H. Modulating downhole cuttings via a pulsed jet for efficient drilling-tool development and field testing. J. Nat. Gas Sci. Eng. 2015, 27, 1287–1295. [Google Scholar] [CrossRef]
- Keller, A.P. Cavitation Scale Effects—Empirically Found Relations and the Correlation of Cavitation Number and Hydrodynamic Coefficients. In Proceedings of the CAV 2001: Fourth International Symposium on Cavitation, California Institute of Technology, Pasadena, CA, USA, 20–23 June 2001. [Google Scholar]
Publisher’s Note: MDPI stays neutral with regard to jurisdictional claims in published maps and institutional affiliations. |
© 2021 by the authors. Licensee MDPI, Basel, Switzerland. This article is an open access article distributed under the terms and conditions of the Creative Commons Attribution (CC BY) license (https://creativecommons.org/licenses/by/4.0/).