Article

Community Structure of Bacteria and Archaea Associated with Geotextile Filters in Anaerobic Bioreactor Landfills

1
Department of Environmental Engineering, College of Engineering, Imam Abdulrahman Bin Faisal University, Dammam 34212, Saudi Arabia
2
Department of Epidemic Disease Research, Institute for Research & Medical Consultations (IRMC), Imam Abdulrahman Bin Faisal University, Dammam 34212, Saudi Arabia
3
Microbial Biotechnology Division, CSIR-Indian Institute of Integrative Medicine, Sanat Nagar, Srinagar 190 005, India
4
Environmental Engineering Department, Faculty of Engineering, Gebze Technical University, Gebze 41400, Turkey
5
Department of Stem Cell Research, Institute for Research & Medical Consultations (IRMC), Imam Abdulrahman Bin Faisal University, Dammam 31441, Saudi Arabia
*
Authors to whom correspondence should be addressed.
Processes 2021, 9(8), 1377; https://doi.org/10.3390/pr9081377
Submission received: 20 June 2021 / Revised: 2 August 2021 / Accepted: 4 August 2021 / Published: 6 August 2021

Abstract

:
Landfills are an example of an environment that contains highly complex communities of microorganisms. To evaluate the microbial community structure, four stainless steel pilot-scale bioreactor landfills with single- and double-layered geotextile fabric were used. Two reactors (R-1 and R-2) contained municipal solid waste (MSW) and sewage sludge, while the other two reactors (R-3 and R-4) contained only MSW. A single layer of geotextile fabric (R2GT3 and R3GT3) was inserted in the drainage layers of the two reactors (R-2 and R-3), while a double layer of geotextile fabric (R4GT2 and R4GT1) was inserted in one of the reactors (R-4). Scanning electron microscopy demonstrated that biomass developed on the geotextile fabrics after 540 days of bioreactor operation. The metagenomics analyses of the geotextile samples by 16S rRNA gene sequencing indicated that the geotextile bacterial communities were dominated by the phyla Firmicutes, Bacteroidetes, and Thermotogeae, while Proteobacteria were detected as the rarest bacterial phylum in all the geotextile samples. Treponema, Caldicoprobacter, and Clostridium were the most dominant anaerobic and fermentative bacterial genera associated with the geotextile fabric in the bioreactors. Euryarchaeota was the predominant archaean phylum detected in all the geotextile samples. In the archaeal communities, Methanosarcina, and Vadin CA11 were identified as the predominant genera. The diversity of microorganisms in landfill bioreactors is addressed to reveal opportunities for landfill process modifications and associated operational optimization. Thus, this study provides insights into the population dynamics of microorganisms in geotextile fabrics used in bioreactor landfills.

Graphical Abstract

1. Introduction

Municipal solid waste (MSW) generates high disposal costs for local authorities [1]. The organic fraction of these wastes presents the greatest difficulties in terms of disposal and management. Furthermore, sewage sludge, which is an organic form of waste, is also complicated to dispose of [2]. Although local governments often see it as a nuisance, organic waste, which is generated in large quantities every day in each city, is essentially a unique source of biomass [3]. Anaerobic waste bioreactors, also known as waste bioreactors or bioreactor landfills, represent some of the most important technologies available for the treatment of these organic wastes. Bioreactor landfills are designed to accelerate the stabilization of the landfilled waste and the production of the landfill gas (LFG) [4]. Similar to hydro, geothermal, wind, and solar energy sources, LFG or biogas is adopted as a renewable source of energy [5]. Many studies on anaerobic bioreactor landfills have shown that this technology provides highly efficient methanization from the laboratory scale to the field scale, providing waste stabilization faster than traditional landfills [6]. In the last decade, studies on the disposal of the organic fraction of urban solid wastes with bioreactor landfill technology have become a main focus of researchers. Numerous reports have been published on this subject, and this technology has been investigated in detail through laboratory experiments and field tests [7,8].
Typical anaerobic digesters, which mainly treat the organic fraction of wastes, provide efficient biological conversion [9]. However, obtaining only the organic part (mostly kitchen waste) of urban solid wastes is not cost-effective under most circumstances. In contrast, bioreactor landfill technology can be used to treat unsorted municipal solid waste [10]. It is a known fact that the stabilization of waste takes years in traditional landfill areas, which have been developed for the safe disposal of urban solid waste only (40–100 years) [11]. The most important environmental conditions that negatively affect the degradation of the wastes landfilled include insufficient or in some cases excessive water content, the irregularity of water flow and distribution on the horizontal–vertical axis, and uncontrolled temperature conditions [12,13]. These uncontrolled environmental conditions delay the onset of anaerobic degradation and slow down the degradation rate in solid waste landfills [12]. In some cases, some industrial and hazardous forms of waste are also mixed with urban solid wastes. These hazardous wastes often contain compounds that are toxic to methanogens. These are known as highly sensitive methane-producing microorganisms [14]. Under these adverse conditions, it takes time for anaerobic microorganisms to reproduce effectively by developing resistance to these toxic substances, resulting in an inability to produce a significant amount of LFG over the years.
In MSW landfills, biodegradable contents are converted to methane through a series of phases involving a number of anaerobic microorganisms [15,16]. These biodegradation phases include the aerobic, acidogenic, methanogenic, oxidation, and natural decomposition phases [17,18]. The hydrolysis and fermentation of complex organics are carried out by microorganisms known as acetogens or acid producers. The microbes known as methanogens (archaea) or methane producers are mostly involved in producing methane (CH4) and carbon dioxide (CO2), using acetate (C2H3O2), CO2, CO, H2, methanol (CH₃OH), methylamine (CH3NH2), propionate (C3H5O2), and butyrate (C4H2O−2).
In this study, the microbial consortium for four pilot-scale anaerobic bioreactor landfills containing MSW and sewage sludge was investigated. These bioreactor landfills also contained horizontally placed geotextile filters in their drainage layers as a biofilm medium for leachate treatment. The biomass-holding capacity of porous nonwoven geotextiles has been reported in the literature in detail [6,19,20]. In the current study, the diversity and composition of the bacterial and archaeal communities developed on geotextile filters placed in the drainage chamber of pilot-scale bioreactor landfills were examined after 540 days of anaerobic operation through the metagenomics approach. To understand the function and development of both bacterial and archaeal communities in the bioreactors associated with geotextiles filters, their identification and characterization are required. Routine microbial cultivation methods cannot be used to culture the whole microbial community due to the differences in nutrient demands; however, recent advances in next-generation sequencing (NGS) through the metagenomics analysis deliver a reliable identification of the microbial community. In recent years, Illumina sequencing has been used as a powerful tool to study microbial diversity in various environmental samples [21]. The identification of both bacterial and archaeal communities using the Illumina Miseq technology and their diversity analysis is expected to provide valuable information for the development of a novel process for the treatment of MSW and sewage sludge. This study aims to analyze the population dynamics of microorganisms in geotextile fabrics used in bioreactor landfills. The objective of this study was to address the diversity of microorganisms in landfill bioreactors in order to reveal opportunities for landfill process modifications and associated operational optimization.

2. Materials and Methods

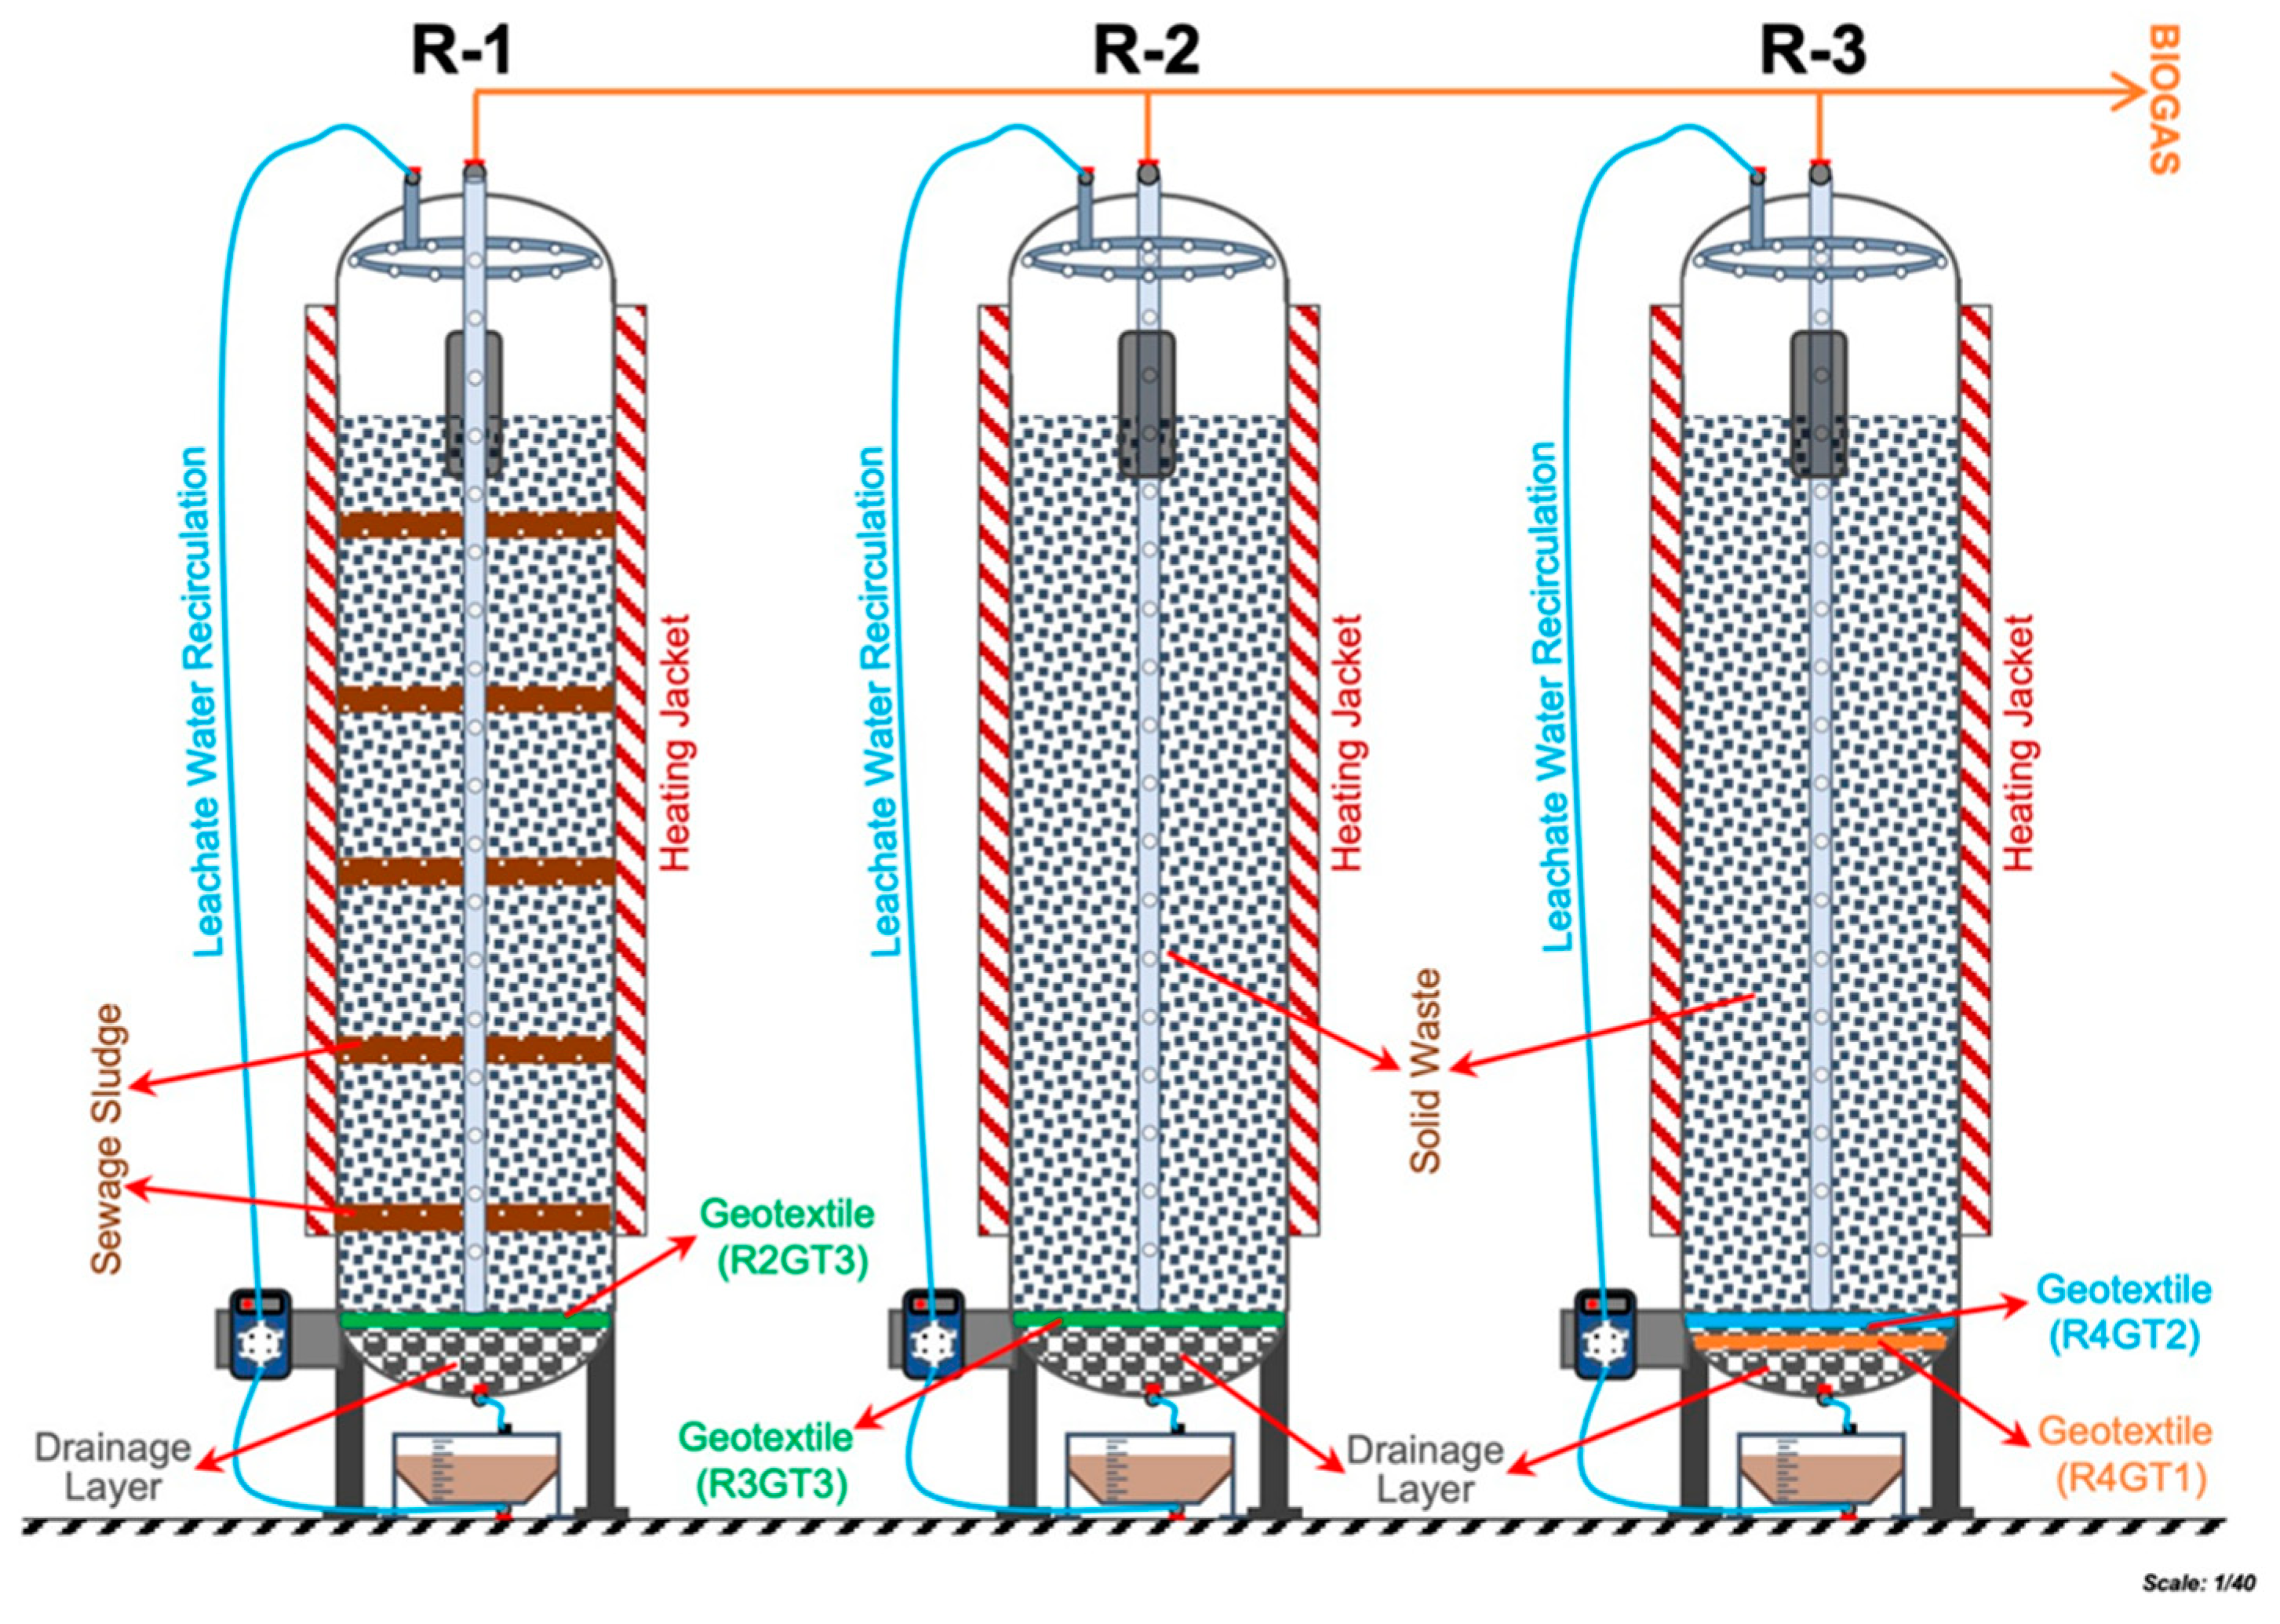
2.1. Bioreactor Setup

It is more meaningful if urban solid waste, which is known for its heterogenic structure, is treated in large reactors. In this study, instead of simulating a real landfill with hundreds of tons of waste in a single cell (or lot), 4 stainless steel and leak-proof pilot-scale reactors with a height of 3.5 m and a diameter of 80 cm (1.75 m3 of volume and 1 ton of waste) were used (Figure 1). It was expected that a layer of biofilm would form on the surface and in the pores of the geotextile fabrics to degrade the organics present in the leachate. While a single layer of geotextile fabric (R2GT3 and R3GT3) was used in 2 reactors (R-2 and R-3), a double layer of geotextile fabric (R4GT2 and R4GT1) was used in 1 reactor (R-4). Furthermore, 2 reactors (R-1 and R-2) contained solid waste and sewage sludge at a ratio of 1/20, respectively, while the other 2 reactors contained only solid waste. The effect of using geotextile layers on leachate quality in laboratory-scale and pilot-scale landfill bioreactors has been investigated in previous papers and is not included in this study [6,20].
The depth of the drainage layers was designated as 15 cm in total. A 10 cm coarse gravel layer (d50 = 12.5 mm) was placed at the bottom of the drainage layer, while a 5 cm fine gravel layer (d50 = 10 mm) was placed at the top. Geotextile fabrics were inserted into the drainage layers of R-2 (R2GT3), R-3 (R3GT3), R-4 (R4GT2 (upper), and R4GT1 (lower). The technical specifications of the geotextile fabrics used in this study are given in Table 1. Geotextiles are thin, durable, and permeable fabrics which are made of polypropylene (PP) or polyester (PET) materials and are widely used in several areas of civil, geotechnical, and environmental engineering. Geotextiles are used in the drainage layers of landfills to protect geomembrane layers from gravel and sharp solid particles. In addition, geotextiles are used in construction and geotechnical and environmental engineering for filtration, separation, drainage, or different applications. Starting 2 decades ago, geotextile fabrics have been used in the treatment of wastewater, stormwater, and leachate [20,22]. The formation of biofilm in the internal structure of geotextile fabrics was first observed in the 1990s [23]. In that first study, it was observed that the geotextiles used in the landfill areas were blocked due to leachate filtration and biofilm formation.

2.2. Sample Collection and Scanning Electron Microscopy Analysis

After 540 days of operation, the geotextile fabric was removed from each reactor and air-dried overnight. Then, two 1 cm × 1 cm geotextile specimens were cut from each sample for scanning electron microscope (SEM) and microbial analysis. Geotextile samples were gold-coated before the SEM analysis, which was carried out with Philips XL30S-FEG device. At the end of the operation, 1 cm2 samples of the geotextile materials were cut in a sterile environment and transferred to tubes filled with sterile glycerol. All sample tubes were kept closed at −40 °C until DNA extraction and library preparation were performed. Table 2 shows the geotextile sample IDs, their positions in the bioreactors, and the type of reactor feed.

2.3. Metagenomic DNA Extraction

The NGS method was used for the determination of bacterial and archaeal species that formed on the geotextile fibers or were suspended between the geotextile fibers. Geotextile samples were collected in a microcentrifuge tube using autoclaved forceps and were washed 3 times with the autoclaved deionized water. The tubes were centrifuged at 10,000× g for 5 min and the supernatant was discarded. DNA was extracted from the geotextile fibers using the DNeasy PowerBiofilm Kit according to the manufacturer’s instructions (QIAGEN Cat No./ID: 24000-50, Dusseldorf, Germany). The quality and quantification of the metagenomic DNA extracted from geotextile fibers were determined using 3 different methods. First, Nanodrop: A260/A280 measurements were performed to measure the purity of DNA. Then, agarose gel electrophoresis was used to determine DNA integrity or degradation and potential contamination. Finally, Qubit 2.0 was used to determine the concentration of DNA in the samples. The concentration and purity of metagenomic DNA were found to be suitable for the study (amount ≥ 120 ng, volume ≥ 20 μL, concentration ≥ 6 ng/μL, purity A260/A280 = 1.7–1.8, no degradation, no contamination).

2.4. Bacterial V3–V4 Amplicon Library Preparation and Sequencing

The V3–V4 region of the bacterial 16S ribosomal RNA gene, approximately 466 bp in length, was amplified using primers 341F and 806R (Table S1). After the control PCR (polymerase chain reaction) reactions, a paired-end library suitable for the Illumina HiSeq platform was prepared using the NEBNext Ultra DNA Library kit (New England Biolabs, Inc., Ipswich, MA USA) as per the guidelines of the manufacturer. The specific barcodes and adapter sequence were attached to the ends of the primers to prepare the 16S rRNA libraries (Table S2). The 16S rRNA gene library was used to obtain raw sequences by using the Illumina HiSeq platform.

2.5. Archaeal V4 Amplicon Library Preparation and Sequencing

The V4 region of the archaeal 16S ribosomal DNA, approximately 397 bp in length, was amplified using the primers 519F and 915R (Table S1) [24]. After the control PCR reactions, a paired-end library suitable for the Illumina HiSeq platform was prepared using the NEBNext (New England Biolabs) Ultra DNA Library kit as per the guidelines of the manufacturer. The specific barcodes and adapter sequences were attached to the ends of the primers to prepare the 16S rRNA libraries (Table S2). The 16S rRNA gene library was used to obtain raw sequences by using the Illumina HiSeq platform.

2.6. Processing of Raw Sequences

Before the bioinformatic analysis of the raw sequences was processed through the various data analyzing tools, the specific barcode and primer sequences of the samples were subtracted, and the sequence of each sample was recorded. After trimming the unwanted sequences, quality scores of the DNA sequences were analyzed using the Phred score, which was assessed by calculating the relationship between the error rate and the nucleotide quality value Qphred Equation (1). The relationship between the Phred score and the error rate is shown in the supporting information (Table S3).
Q p h r e d = [ 10 l o g ( e ) ]

2.7. Bioinformatics Analysis

Bioinformatics analyses were performed using Quantitative Insights into Microbiological Ecology (QIIME) v1.9.1 and Microbiome Helper software [25,26]. The FastQC v0.11.5 was used to check the quality scores of the sequences [27,28]. After removing the undesirable sequences from original paired-end data, a consensus V3 and V4 region sequence was constructed using the PEAR v0.9.10 program with a default setting [29]. The FASTX-Toolkit v0.0.14 was used to filter quality scores and lengths of the paired-end sequences [30]. Paired-end sequences of less than 400 bp and at 90% below the Q30 score were removed from the data. Chimeric sequences were removed from the data using the VSEARCH v2.4.3 algorithm [31]. The operational taxonomic units (OTUs) were assigned as a reference base using SortMeRNA v2.1 contained in the QIIME and de novo using SumaClust 1.0.31 [32]. OTUs were generated according to the GreenGenes database with a 97% similarity threshold [33]. Before the final assignments, low-confidence and singleton OTUs were removed. The final OTUs were normalized at a reading depth of 18435 reads.

2.8. Biodiversity Analysis

The alpha diversity was analyzed by calculating the Chao1 and metrics observed [34]. The beta diversity between the samples was calculated using the UniFrac matrix [35]. The statistical analysis of the generated OTUs was performed using the STAMP (statistical analysis of metagenomic profiles) v2 program [36].

2.9. Data Availability

The metagenomic data generated from the geotextile samples were deposited with the National Center for Biotechnology Information (NCBI) under the project title, “Metagenomic Analysis of Bacteria and Archaea in Landfill Bioreactor”, with the bioproject ID: PRJNA644277. BioSample accession numbers SRS6999806, SRS6999805, SRS6999804, SRS6999803, SRS6999802, SRS6999801, SRS6999800, and SRS6999799 represent the sample IDs R4GT2 bioreactor, R4GT1 bioreactor, R3GT3 bioreactor, R2GT3 bioreactor, R42 bottom bioreactor, R42 top bioreactor, R32 bioreactor, and R22 bioreactor, respectively.

3. Results and Discussion

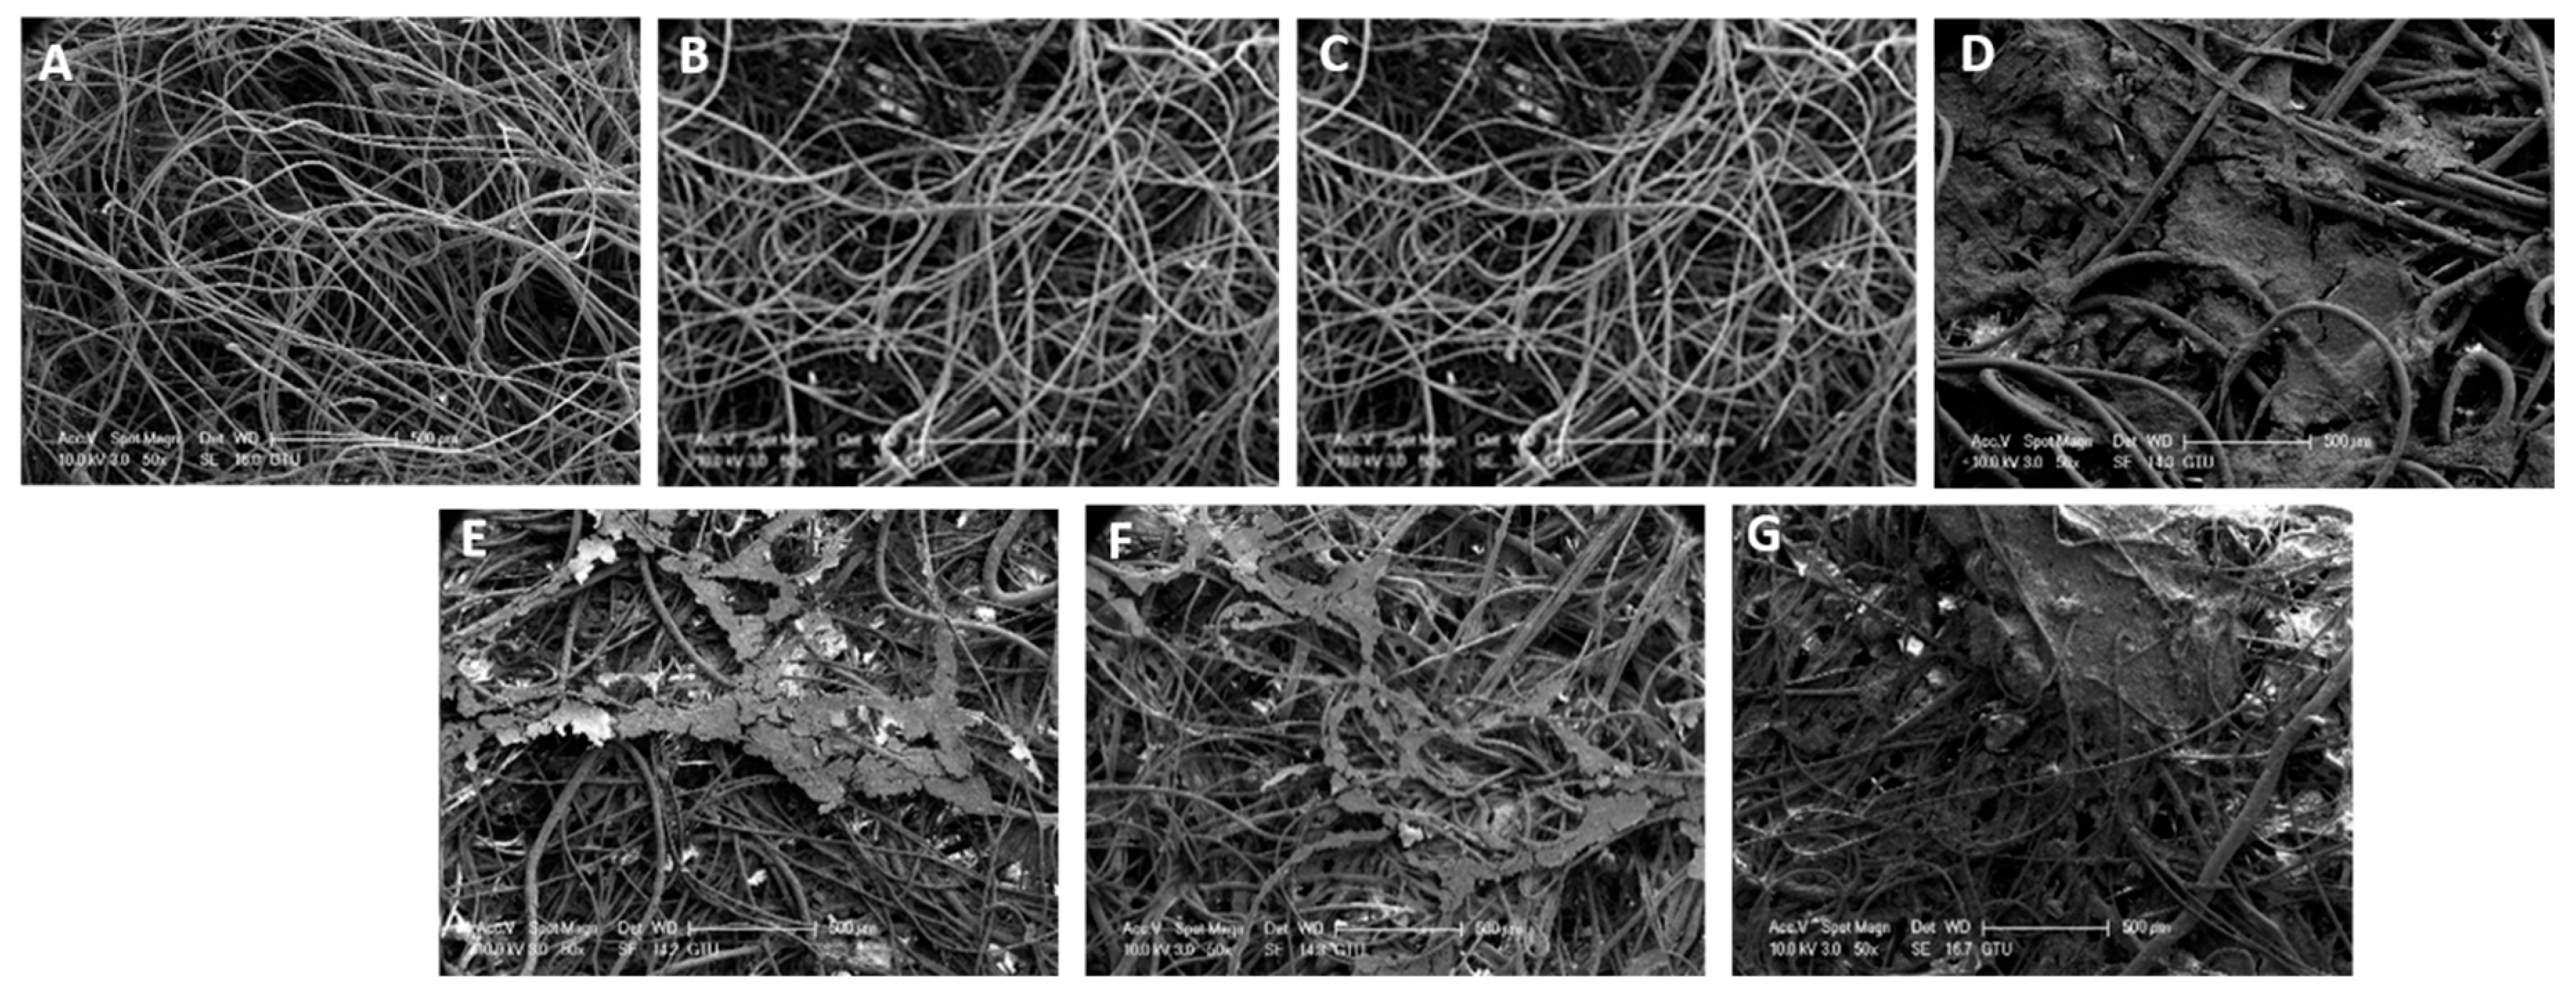
3.1. SEM Analysis of the Geotextile Fabrics

Many different types of microorganisms live in landfills, including bacteria and archaea. Such microbes have immense bioremediation potential [37]. Studying the composition and characterization of such microbial communities is a complex process due to the high physical and chemical multiplicity conditions of the landfills. Studies conducted in the past have shown that biomass can accumulate inside the porous structure of nonwoven geotextiles [19]. The SEM images of the clean geotextile samples were taken before the study (Figure 2A–C). After 540 days of operation, some microbial biomass formation was expected in the geotextile filters. To visualize this biomass, SEM images of the geotextile samples were taken at 50× magnification. These samples were previously removed from the reactors and air-dried. The geotextile samples R4GT1 and R2GT3 clearly demonstrated that a complex biomass structure developed between the geotextile fibers (Figure 2D). However, in case of R4GT2 and R3GT3, moderate biomass formed on the fibers (Figure 2E,F). Overall SEM analyses of geotextile samples confirmed biofilm formation in the geotextile samples.

3.2. Microbial Community Analysis

Many studies have previously been performed to deal with heterogeneity by examining the samples from specific landfills. Few studies reported that the sampling was done within an individual site of the landfill to understand the categorization of waste and soil of landfills [38]. These techniques provide limited information on existing diverse microorganisms and are also time-consuming and expensive. Therefore, through the currently available forefront technology, the present study examines various parameters of bioreactor landfills, including the biofilm characteristics of geotextiles, using high-throughput sequencing of the 16S rRNA gene libraries. This study illustrates the taxonomic distributions of microbes with respect to both bacteria and archaea.

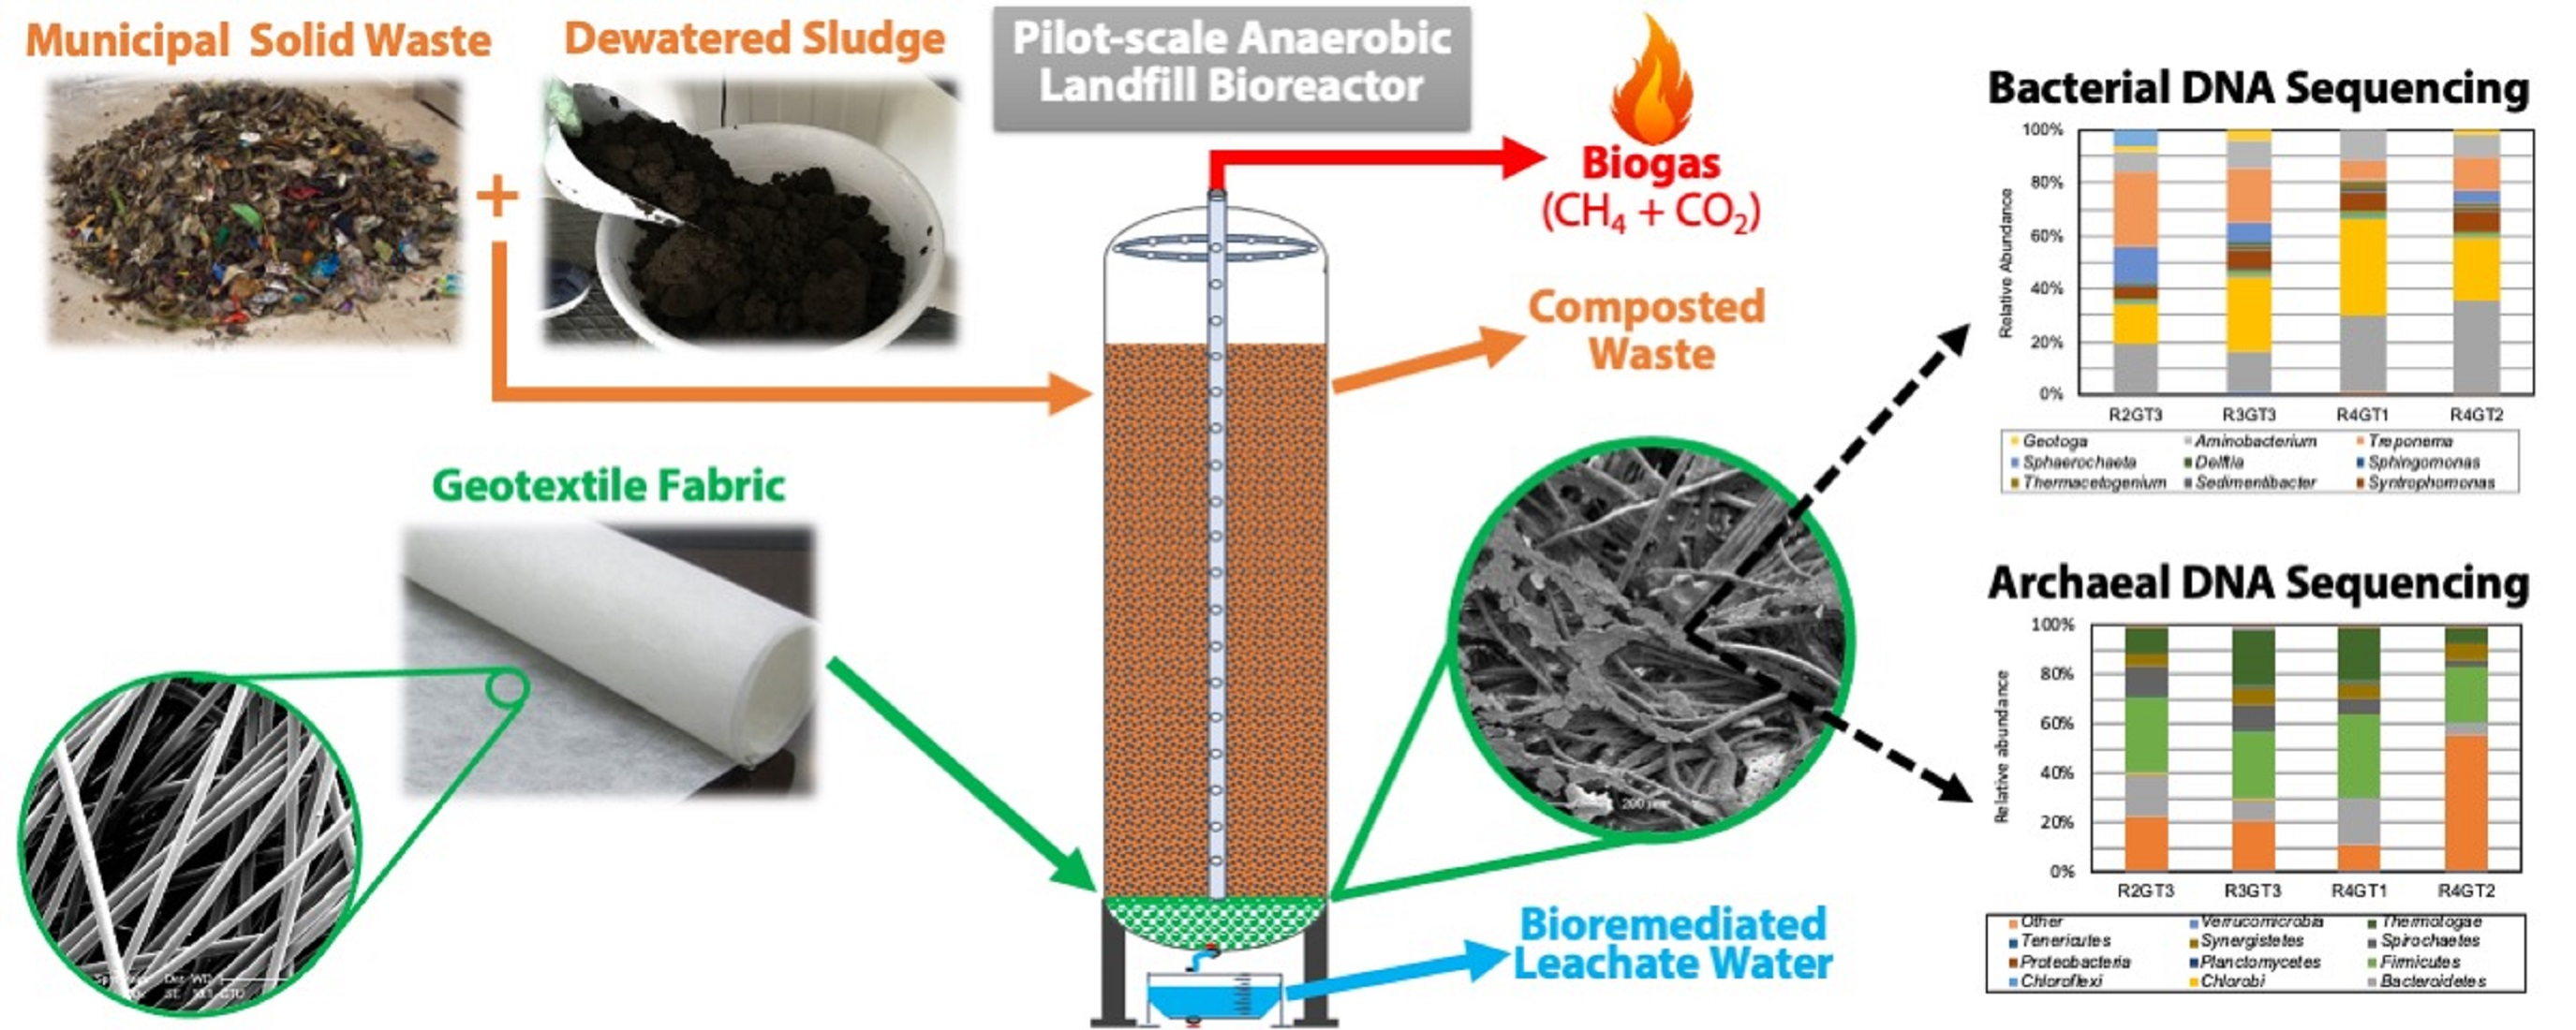
3.2.1. Bacterial V3–V4 Amplicon Sequencing and Taxonomic Identification

The bacterial V3–V4 amplicon was sequenced using the Illumina Hiseq high-throughput sequencing to assess the composition of bacteria associated with geotextile samples. The overall raw reads statistics of sample reads before and after merging and quality filtering are listed in Table 3. The average number of raw reads retrieved from each sample was 95,226 reads. The paired-end reads (tags) were generated based on the overlapped sequence of the reads. After filtering the low-quality reads followed by trimming the barcodes, adaptors, primers, and chimera sequences, eligible pair-end reads (PE) were obtained. In total, 77,978, 65,422, 77,708, and 80,885 tags were obtained from R2GT3, R3GT3, R4GT2, and R4GT1, respectively. For raw PE, four rows were taken as a unit to calculate the total amount of read1 and read2 in raw data files split by barcode. For combinations, the raw tags generated from PE reads based on overlap were taken, and for qualified tags, clean tags after qualification from raw tags under specific filtering conditions were considered. In the case of Nochime, effective tags after removing the chimera sequences were taken.
The relative abundance plot at the phylum and genus level based on OTUs is depicted in Figure 3a,b. The taxonomic composition and relative abundance of the most dominant bacterial phyla and genera of the four geotextile samples are depicted in Figure 3a,b. Bacterial phyla associated with all the samples were Firmicutes, Bacteroidetes, Thermotogae, Synergistetes, Tenericutes, Spirochaetes, and Proteobacteria. However, Actinobacteria was only identified in R3GT3. The most dominant sequenced phyla associated with the sample R2GT3 (44.1%) was Bacteroidetes; however, in samples R3GT3 (46.0%), R4GT2 (48.2%), and R4GT1 (82.4%), Firmicutes was the most dominant phylum (Figure 3a). The rarest bacterial phylum associated with all the geotextile sample was Proteobacteria. At the phylum level, a small fraction of OTUs did not show any alignments with known bacterial phyla, and were designated as uncharacterized. However, at the genera level, a large number of OTUs were not assigned to any known species and were designated as uncharacterized. Additionally, diverse bacterial genera were associated with geotextile samples, including Clostridium, Caldiciprobacter, Treponema, Aminobacterium, Syntrophomonas, Sphaerochaeta, Thermacetogenium, Geotoga, Delftia, Sphingomonas, Sedimentibacter, Ruminoccocus, Pelatomaculum, Lutispora, Caldiciprobacter, and Streptomyces at the genera level. Predominant identified genera associated with the R2GT3 and R4GT1 were Treponema and Caldiciprobacter, whereas Clostridium was the dominant bacterial genus in both the R3GT3 and R4GT2 samples (Figure 3b). Certain bacterial genera were unique, such as Streptomyces, Ruminococcus, and Sphingomonas, which were only identified in R3GT3. The genera Lutispora, Pelatomaculum, and Sedimentibacter were almost equally distributed in all the geotextile samples. The R3GT3 geotextile sample was more diverse at the genera level, whereas the samples R2GT3 and R4GT2 were less diverse among the samples.

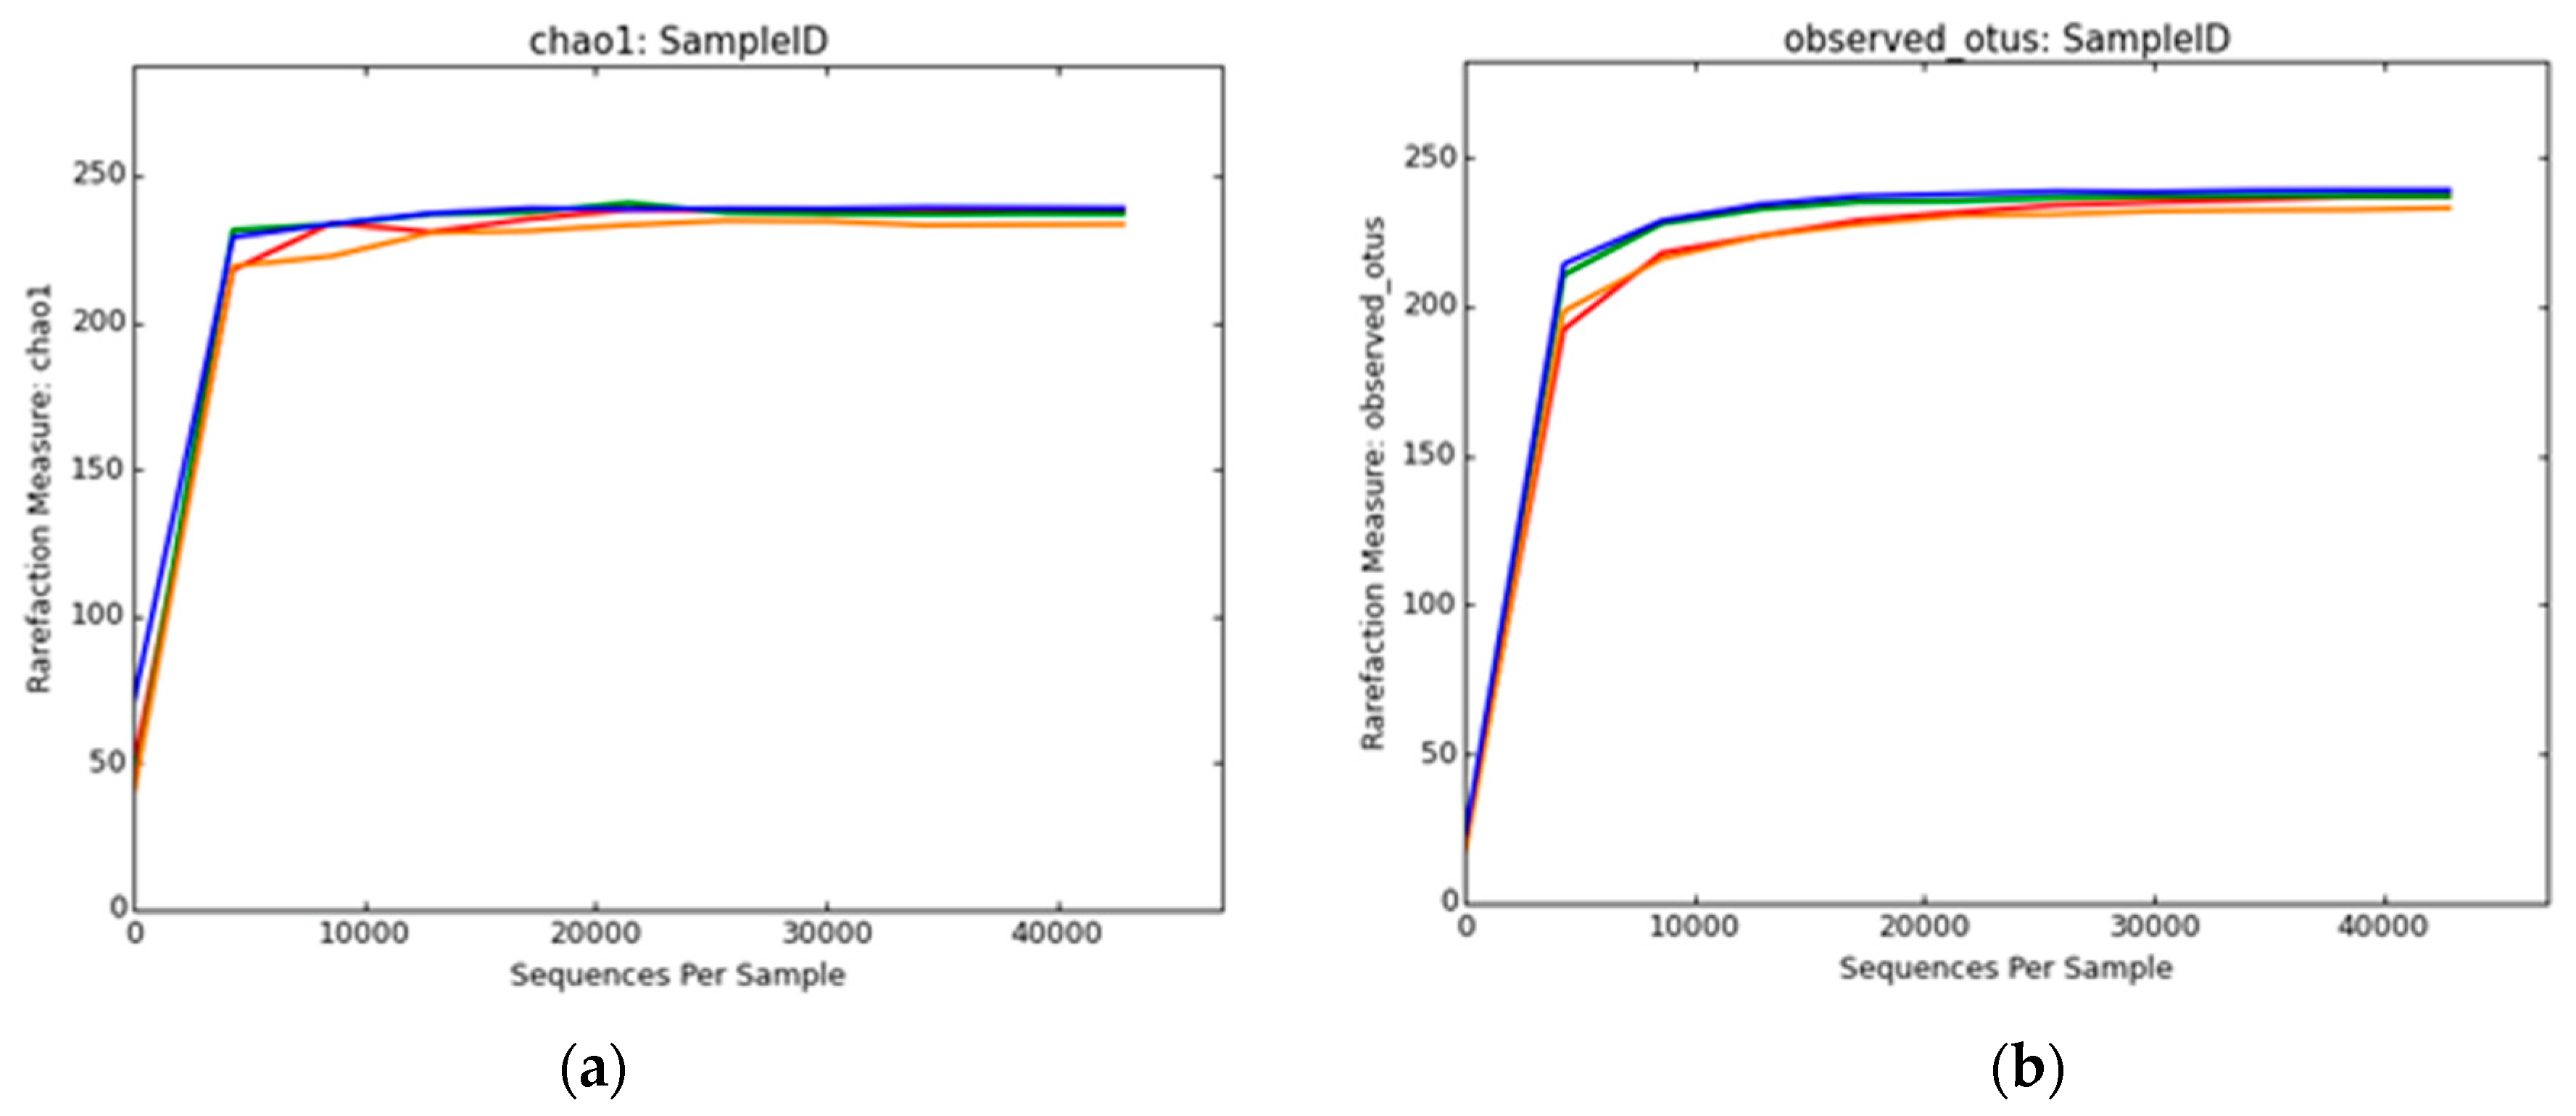
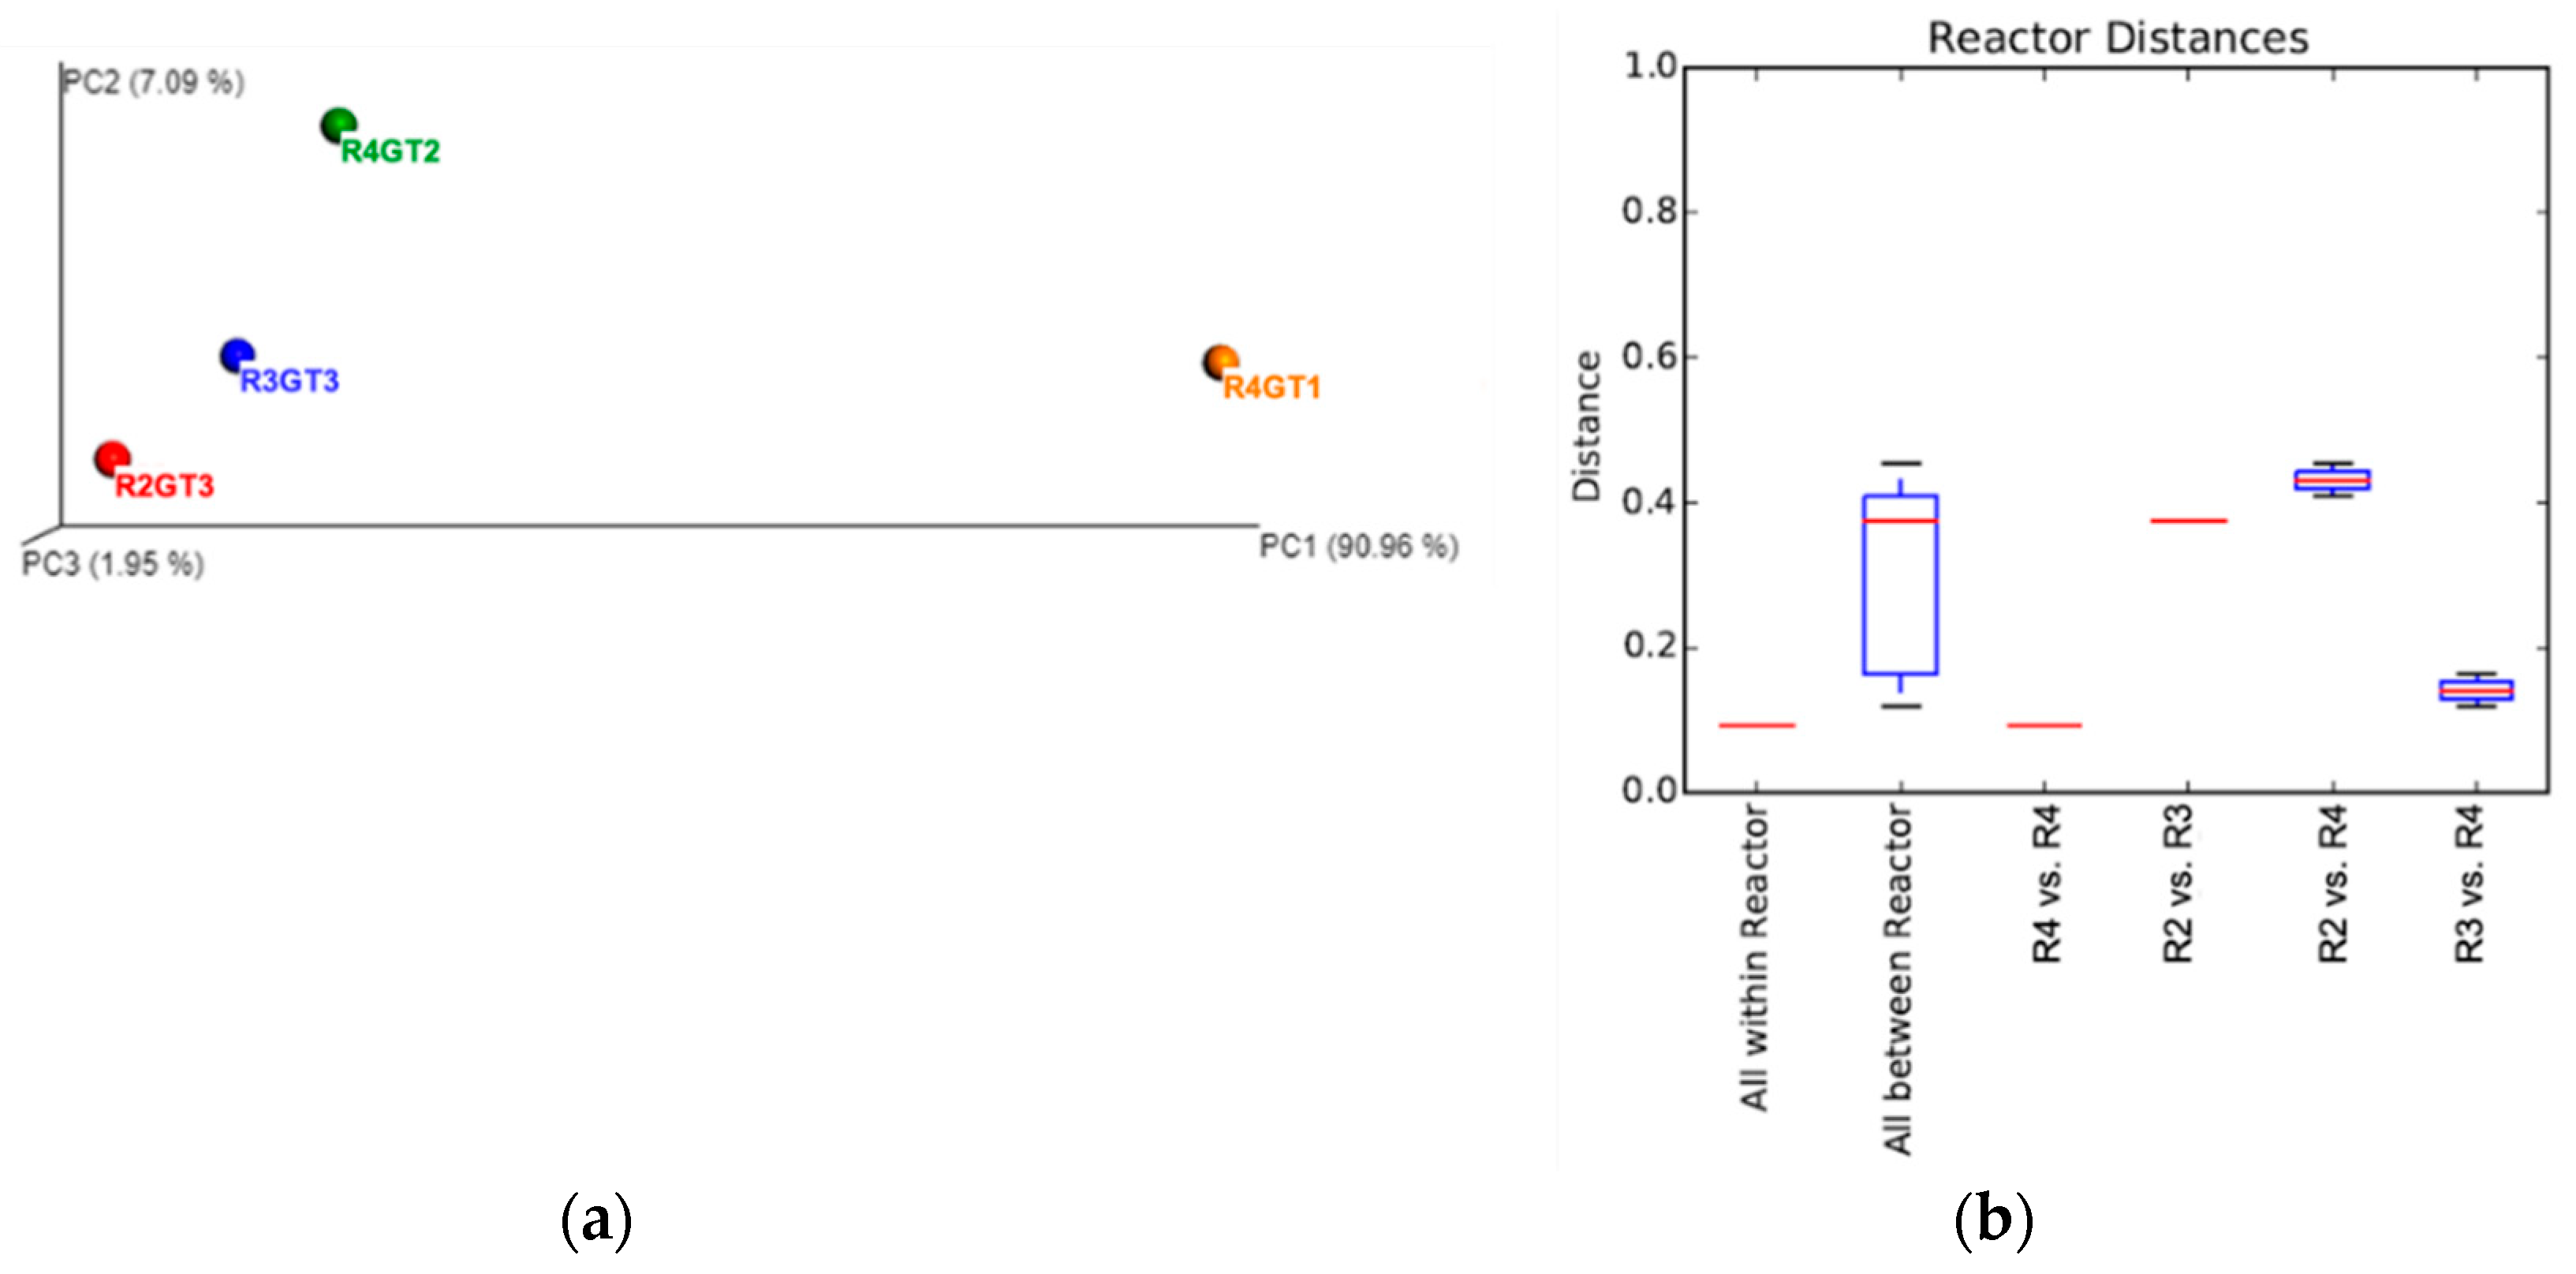
3.2.2. Bacterial Diversity Analysis

To determine the bacterial diversity in the geotextile samples, different diversity indices were measured. Alpha diversity in the geotextile samples was obtained based on rarefaction analysis. The rarefaction curve based on the Chao1 metrics showed a similar pattern of diversity in all the samples (Figure 4a). The rarefaction measure based on observed OTUs indicated that samples R3GT3 and R4GT2 showed relatively high abundance, in contrast to samples R2GT3 and R4GT1 (Figure 4b). Further, beta diversity analysis was performed to estimate the ecological similarity and dissimilarity of bacterial communities among different geotextile samples. The ecological dissimilarity was derived from the weighted UniFrac method, and principal coordinate analyses (PCoA) was used to visualize the data. The sample R4GT1 exhibited maximum dissimilarity between the four samples (Figure 5a). The distance matrix analysis within samples represented a significant distance, as well as between the other two samples, except for R4GT2 vs. R4GT2 (Figure 5b).

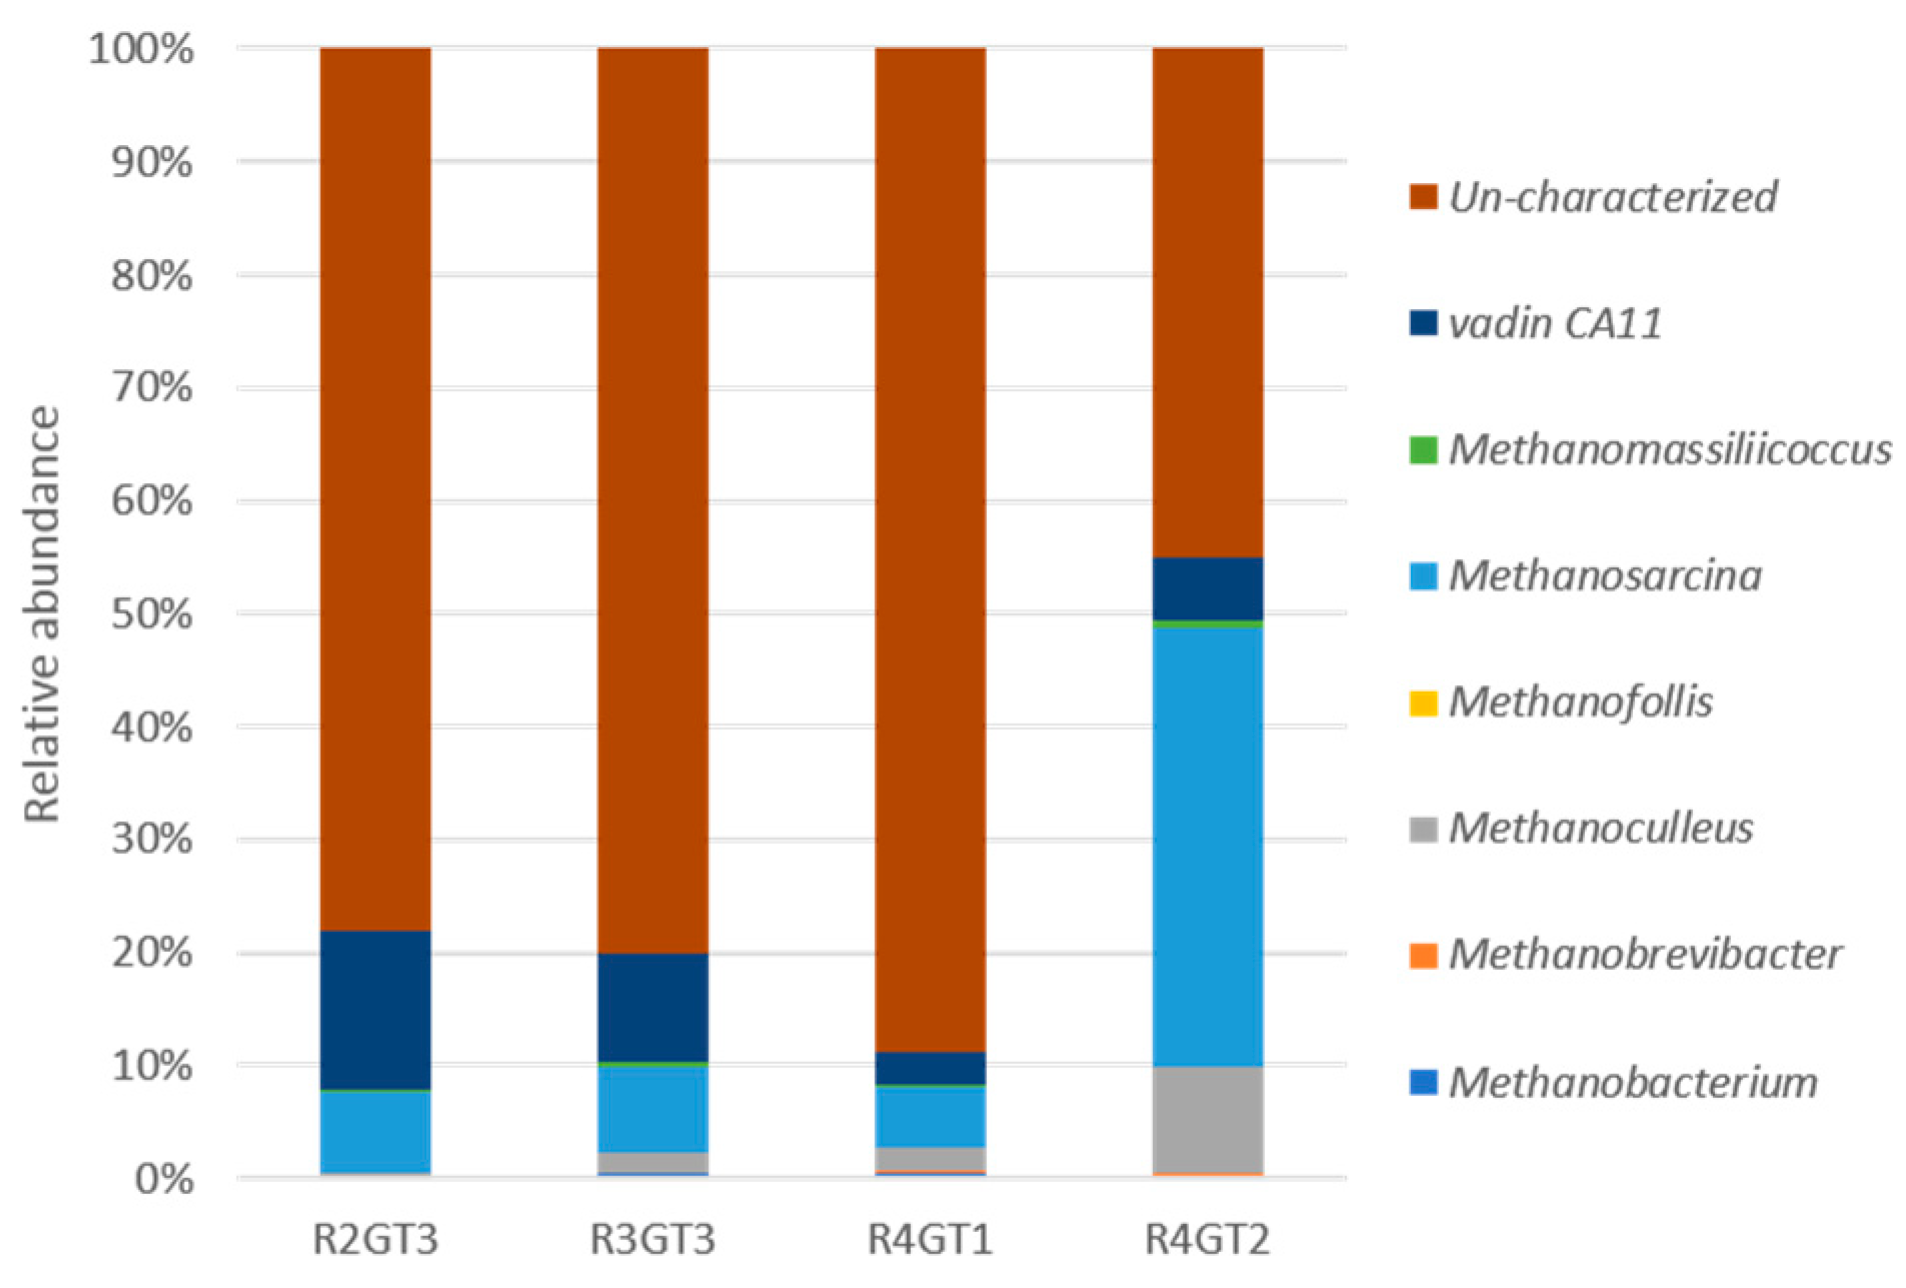
3.2.3. Archaeal V4 Amplicon Sequencing and Taxonomic Identification

The archaeal V4 amplicon was sequenced using Illumina Hiseq high-throughput sequencing to assess the composition of archaea associated with geotextile samples. The overall raw reads statistics of sample reads before and after merging and quality filtering are listed in Table 4. The numbers of raw reads retrieved from samples R2GT3, R3GT3, R4GT2, and R4GT1 were 131,103, 101,791, 58,195, and 45,258, respectively. The paired-end reads (tags) were generated based on the overlapped sequence of the reads. After filtering of the low-quality reads followed by trimming of the barcodes, adaptors, primers, and chimera sequences, eligible pair-end reads were obtained. A total of 96,773, 74,432, 39,024, and 28,378 tags were obtained from samples R2GT3, R3GT3, R4GT2, and R4GT1, respectively. Four rows are taken as a unit to calculate the total amount of read1 and read2 in raw data files split by barcode. For combinations, the raw tags generated from PE reads based on overlap were taken. Clean tags after qualification from raw tags under specific filtering conditions were considered. In the case of Nochime, effective tags after removing the chimera sequences were taken.
The relative abundance plot at the genus level based on OTUs is depicted in Figure 6. The taxonomic composition and relative abundance of the most dominant archaeal phyla and genera from the four geotextile samples were studied. The most dominant sequenced phylum associated with samples R2GT3 (22.0%), R3GT3 (20.0%), R4GT1 (11.2%), and R4GT2 (50%) was Euryarchaeota, and another phylum identified was Crenarchaeota, at < 1% in all the samples. A small fraction of OTUs did not show any alignments with known archaeal phyla. Moreover, the V4 amplicon also identified certain bacterial phyla which were excluded from the archaeal data. On the other hand, the diverse archaeal genera associated with geotextile samples were Vadin CA11, Methanomassiliicoccus, Methanosarcina, Methanofollis, Methanoculleus, Methanobrevibacter, and Methanobacteriu. At the genera level, the most predominant identified genus associated with all four was Methanosarcina, while the second most predominant was VadinCAII. However, the archaeal genus Methanofollis was unique to R4GT2, while Methanobrevibacter was absent only in the R2GT3 sample. A large fraction of archaeal OTUs at the genus level did not show any alignment with known archaeal genera, and were characterized as uncharacterized.

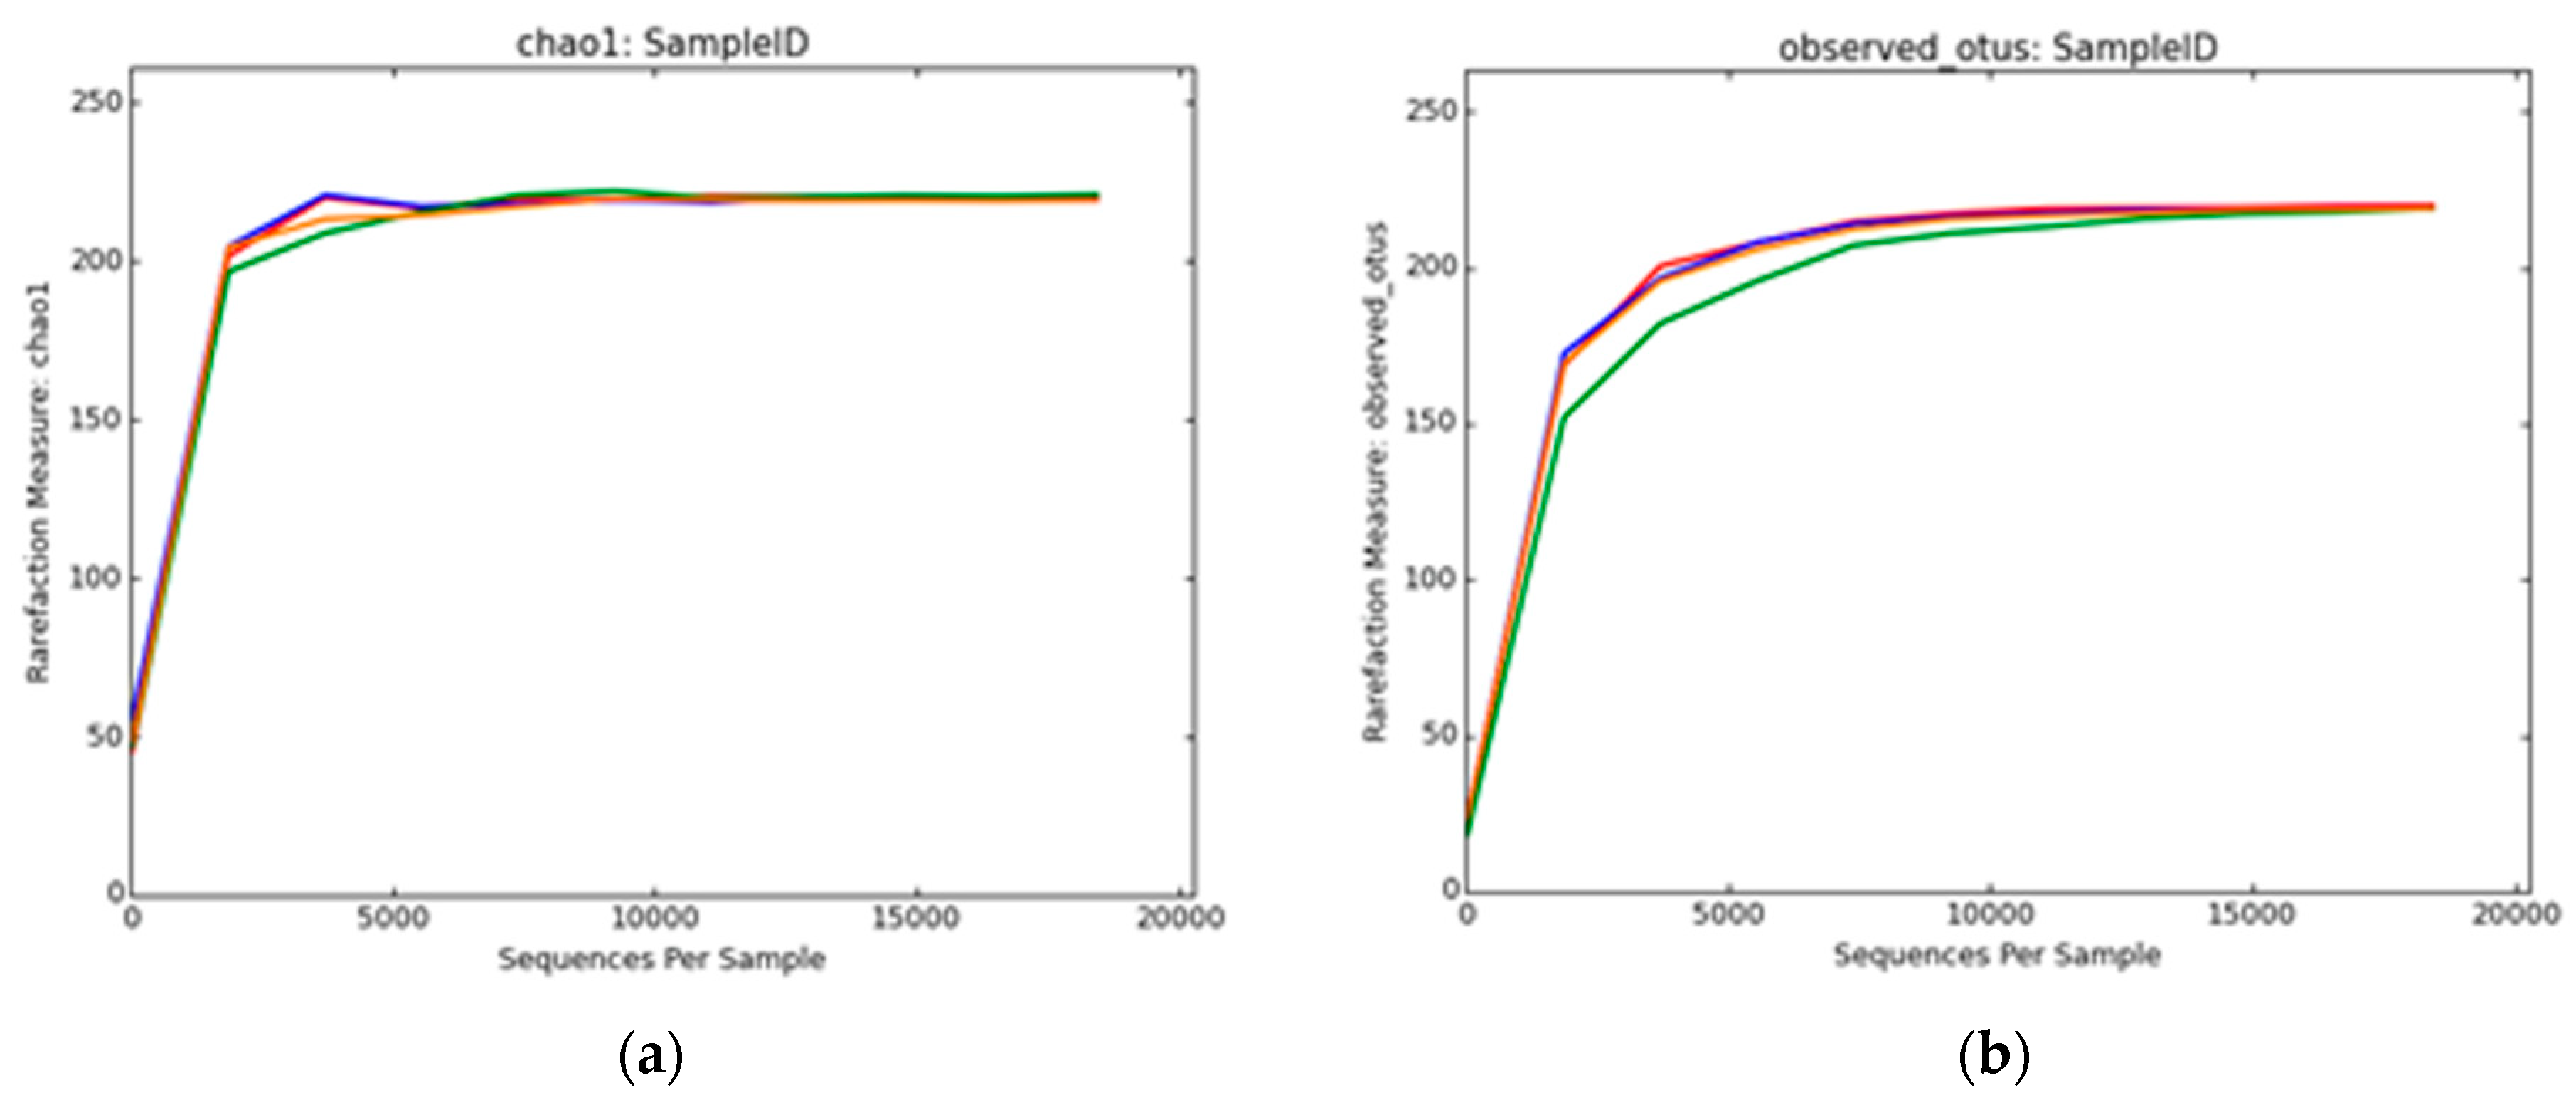
3.2.4. Archaeal Diversity Analysis

To determine the depth of archaeal diversity in the geotextile samples, different diversity indices were measured. The alpha diversity in the geotextile samples was obtained based on rarefaction analysis. The rarefaction curve based on the Chao1 metrics showed a similar pattern of diversity in all the samples (Figure 7a). The rarefaction measure based on observed OTUs indicated that samples R2GT1, R3GT3, and R4GT1 showed relatively similar abundance, in contrast to sample R4GT2, which showed lesser OTUs (Figure 7b).
Additionally, Figure 8 represents the beta diversity analysis used to estimate the diversity of the bacterial community among different geotextile samples. The ecological dissimilarity was derived from the weighted UniFrac method, and principal coordinates analysis (PCoA) was used to visualize the data. Sample R4GT2 showed the maximum dissimilarity between the four samples (Figure 8a), whereas Figure 8b illustrates the Weighted UniFrac distance box plot within and between the samples.
Alterations in parameters such as operating conditions and composition of the substrate of bioreactor landfills have a great influence on the occurrence of microbial consortium [39]. As presented in Figure 3, the most prominent bacterial phyla identified based on high-throughput sequencing were Firmicutes and Bacteroidetes, whereas Archaea and Methanogens (Figure 6) mostly included Euryarchaeota and a minor share of Crenarchaeota in the bioreactor landfills. These microbes are known to harbor the mcr gene and are typically obtained in bioreactor landfills. Three different pathways for methanogenesis exist, including the acetoclastic, hydrogenotrophic, and methylotrophic pathways [40]. These anaerobic microbial consortia mediate the breakdown of organic matter via the hydrolysis of big biopolymers. Polymer hydrolysis, achieved through a cascade of metabolic events, leads to small molecule production and finally to methane and carbon dioxide, which are the main energy units of biogas (LFG), and nutrient-rich digestate remnants [41].
The current study of metagenomic sequencing of geotextile fabrics showed that the percentages of Firmicutes, Bacteriodetes, and Euryachaeota were the same for all the bioreactor landfills and were dominant among all the samples. This signifies that these phyla may have a major part to play in the degradation of organic and inorganic matter, including heavy metal substances, in bioreactor landfills. Hence, it is assumed that the more prominently occurring bacterial and archaeal organisms, respectively, are important in such ecosystems [42]. The prominent phylum Bacteroidetes is known for its hydrolytic capabilities, depending upon the oxygen concentration, for survival. Alternately, the phylum Firmicutes has been observed to mediate the decomposition of cellulose in the landfills. Many members of Firmicutes have been reported to play an important part in fermentation in the anaerobic reactions [42,43].
The biodegradation of organic matter in bioreactor landfills containing layers of horizontally placed geotextile filters as a biofilm medium for leachate treatment is believed to be mediated by the above-mentioned consortium of microorganisms. The syntrophic association between acetogenic, fermentative, hydrolytic, and methanogenic microbes leads to the decomposition of organic polymers to carbon dioxide and methane [44]. Other studies also have found that the most abundant members are usually of low-GC content, i.e., the phyla Firmicutes and Bacteroidetes. Firmicutes is believed to dominate in the initial phases of degradation, while as in the thermophilic systems, Thermotogae is found in abundance [45]. The main pathway through which methanogenesis could take place is either acetoclastic or hydrogenotrophic, involving acetate or hydrogen carbonate as the substrate [44]. The prominent methanogenesis pathway for bioreactor landfills is still not fully known. However, methane in abundance is assumed to be produced through acetoclastic methanogenesis [46,47]. Methanogenesis has been indicated to initiate through a two-phase process, where carboxylic acids like acetate and butyrate pile up at the beginning of anaerobic digestion, permitting the growth of hydrogenotrophic methanogens which are acid tolerant. This leads to the proliferation and consumption of carboxylic acids, thereby allowing the growth of methanogens which are acetoclastic [48]. Earlier studies have shown that landfill microorganisms have the ability to remediate heavy metal elements in their surroundings. The response of microorganisms to metal contamination varies from compartmentalization to exclusion and binding protein synthesis, for example through metallothionein and complex product formation [49,50]. Therefore, Bacteroidetes and Firmicutes are hypothesized to carry the potential to remediate a wide range of forms of metal contamination. Similar studies have reported similar kinds of microorganisms in active and closed landfills that help in heavy metal reduction [51].

4. Conclusions

While many studies have been conducted on basic microbial metabolism, there are limited studies on the community structures and functions of microorganisms found in landfill bioreactors. Most studies on the microbial monitoring of landfill bioreactors have analyzed the microbial community structure from a taxonomic point of view. However, although monitoring their behavior is crucial for improving the performance of landfill bioreactors, fewer studies have focused on functional microbial populations. In addition, most of these studies investigated the bacterial populations responsible for nitrogen cycles and methane generation. The behavior of other functional populations is rarely elucidated. Combined leachate recirculation with anaerobic attached-growth biofilm reactors is a promising strategy to accelerate the formation of the methanogenic conditions in the landfills. After 540 days of operation, all four bioreactor landfills were still functioning well, without signs of clogging. The SEM visualization of the geotextile samples clearly showed the development of biofilm on the geotextile fibers. This model bioreactor landfill, particularly with geotextile fibers as biomass growth media, has considerable potential for in situ leachate remediation and enhanced landfill gas generation. The present study of metagenomics of bioreactor landfills was employed for the detailed analysis of the microbial diversity existing in the geotextile fabric within the bioreactors. The results highlight the variance found in the diversity of microbial flora among the geotextiles used. Furthermore, the bioreactors were found to be predominantly occupied by the phyla Bacteriodetes and Firmicutes for bacteria, whereas Euryarchaeota were seen in case of archaea. Accordingly, the wide microbial diversity and richness of geotextile filters could be a possible solution for enhanced remediation of a wide range of organic and inorganic pollutants existing in solid waste bioreactor landfills.

Supplementary Materials

The following are available online at https://www.mdpi.com/article/10.3390/pr9081377/s1, Table S1: Oligonucleotide primers used for the bacterial 16S rRNA (V3-V4 region) and 16S rRNA archaeal (V4 region) library preparation, Table S2: Specific barcodes and adapter sequence used for the bacterial 16S rRNA (V3-V4 amplicon) and 16S rRNA archaeal (V4 amplicon) library preparation.

Author Contributions

Conceptualization, C.Y. and S.R.; methodology, C.Y.; software, Y.K.; validation, T.A., B.P. and N.A.; formal analysis, S.R.U.H.; investigation, A.B.Y.; resources, C.Y.; data curation, Y.K.; writing—original draft preparation, C.Y.; writing—review and editing, S.R.; visualization, A.B.Y.; supervision, C.Y.; project administration, C.Y.; funding acquisition, C.Y. All authors have read and agreed to the published version of the manuscript.

Funding

This research was funded by Imam Abdulrahman bin Faisal University (IAU), project No. 2019-037-Eng, throughout the Deanship of Scientific Research (DSR).

Institutional Review Board Statement

Not applicable.

Informed Consent Statement

Not applicable.

Data Availability Statement

Not applicable.

Acknowledgments

The authors would like to thank Imam Abdulrahman bin Faisal University for academic support.

Conflicts of Interest

The authors declare no conflict of interest.

References

  1. Chu, Z.; Wang, W.; Zhou, A.; Huang, W.-C. Charging for municipal solid waste disposal in Beijing. Waste Manag. 2019, 94, 85–94. [Google Scholar] [CrossRef]
  2. Singh, V.; Phuleria, H.C.; Chandel, M.K. Estimation of energy recovery potential of sewage sludge in India: Waste to watt approach. J. Clean. Prod. 2020, 276, 122538. [Google Scholar] [CrossRef]
  3. Jayakrishnan, U.; Deka, D.; Das, G. Influence of inoculum variation and nutrient availability on polyhydroxybutyrate production from activated sludge. Int. J. Biol. Macromol. 2020, 163, 2032–2047. [Google Scholar] [CrossRef] [PubMed]
  4. Broun, R.; Sattler, M. A comparison of greenhouse gas emissions and potential electricity recovery from conventional and bioreactor landfills. J. Clean. Prod. 2016, 112, 2664–2673. [Google Scholar] [CrossRef]
  5. IEA. Energy Policies of IEA Countries: Turkey; IEA: Paris, France, 2016. [Google Scholar]
  6. Yaman, C.; Küçükağa, Y.; Pala, B.; Delice, G.; Korkut, N.E.; Akyol, A.; Kara, S. Enhancement of landfill gas production and waste stabilisation by using geotextile filter in a bioreactor landfill. Int. J. Glob. Warm. 2019, 17, 1–22. [Google Scholar] [CrossRef]
  7. Srivastava, A.N.; Chakma, S. Heavy metals speciation study revealing merits of anaerobic co-disposal of municipal solid waste with discrete paper mill sludges: An experimental investigation in simulated landfill bioreactors. J. Environ. Chem. Eng. 2020, 8, 104337. [Google Scholar] [CrossRef]
  8. Ali, M.; Yue, D. Population dynamics of microbial species under high and low ammonia nitrogen in the alternate layer bioreactor landfill (ALBL) approach. Bioresour. Technol. 2020, 315, 123787. [Google Scholar] [CrossRef]
  9. Peces, M.; Astals, S.; Jensen, P.D.; Clarke, W.P. Transition of microbial communities and degradation pathways in anaerobic digestion at decreasing retention time. New Biotechnol. 2021, 60, 52–61. [Google Scholar] [CrossRef]
  10. Kumar, G.; Reddy, K.R. Rapid stabilization of municipal solid waste in bioreactor landfills: Predictive performance using coupled modeling. Glob. Nest J. 2019, 21, 505–512. [Google Scholar] [CrossRef]
  11. Rich, C.; Gronow, J.; Voulvoulis, N. The potential for aeration of MSW landfills to accelerate completion. Waste Manag. 2008, 28, 1039–1048. [Google Scholar] [CrossRef]
  12. Benbelkacem, H.; Bayard, R.; Abdelhay, A.; Zhang, Y.; Gourdon, R. Effect of leachate injection modes on municipal solid waste degradation in anaerobic bioreactor. Bioresour. Technol. 2010, 101, 5206–5212. [Google Scholar] [CrossRef] [PubMed]
  13. Bilgili, M.S.; Demir, A.; Akkaya, E.; Ozkaya, B. COD fractions of leachate from aerobic and anaerobic pilot scale landfill reactors. J. Hazard. Mater. 2008, 158, 157–163. [Google Scholar] [CrossRef]
  14. O’Connor, O.A.; Dewan, R.; Galuzzi, P.; Young, L.Y. Landfill leachate: A study of its anaerobic mineralization and toxicity to methanogenesis. Arch. Environ. Contam. Toxicol. 1990, 19, 143–147. [Google Scholar] [CrossRef]
  15. Pedrazzi, S.; Santunione, G.; Minarelli, A.; Allesina, G. Energy and biochar co-production from municipal green waste gasification: A model applied to a landfill in the north of Italy. Energy Convers. Manag. 2019, 187, 274–282. [Google Scholar] [CrossRef]
  16. Pohland, F.G.; Kim, J.C. In Situ anaerobic treatment of leachate in landfill bioreactors. Water Sci. Technol. 1999, 40, 203–210. [Google Scholar] [CrossRef]
  17. Khanal, S.K. Microbiology and biochemistry of anaerobic biotechnology. Anaerob. Biotechnol. Bioenergy Prod. Princ. Appl. 2009, 29–41. [Google Scholar] [CrossRef]
  18. Gerardi, M.H. The Microbiology of Anaerobic Digesters; John Wiley & Sons: New York, NY, USA, 2003; ISBN 0471468959. [Google Scholar]
  19. Yaman, C.; Martin, J.P.; Korkut, E. Use of Layered Geotextiles to Provide a Substrate for Biomass Development in Treatment of Septic Tank Effluent Prior to Ground Infiltration. J. Environ. Eng. 2005, 131, 1667–1675. [Google Scholar] [CrossRef]
  20. Yaman, C.; Küçükağa, Y. Effect of a geotextile filter on leachate quality in a recirculated landfill bioreactor. Desalin. Water Treat. 2017, 80, 61–73. [Google Scholar] [CrossRef]
  21. Kozich, J.J.; Westcott, S.L.; Baxter, N.T.; Highlander, S.K.; Schloss, P.D. Development of a dual-index sequencing strategy and curation pipeline for analyzing amplicon sequence data on the miseq illumina sequencing platform. Appl. Environ. Microbiol. 2013, 79, 5112–5120. [Google Scholar] [CrossRef] [Green Version]
  22. Yaman, C. Improvement of leachate quality and waste stabilization in pilot-scale bioreactor landfills containing geotextile filters and sewage sludge. Desalin. Water Treat. 2019, 158, 41–58. [Google Scholar] [CrossRef] [Green Version]
  23. Koerner, G.R. Performance Evaluation of Geotextile Filters Used in Leachate Collection Systems of Solid Waste Landfills. Ph.D. Thesis, Drexel University, Philadelphia, PA, USA, 1993. [Google Scholar]
  24. Coolen, M.J.L.; Muyzer, G.; Rijpstra, W.I.C.; Schouten, S.; Volkman, J.K.; Sinninghe Damsté, J.S. Combined DNA and lipid analyses of sediments reveal changes in Holocene haptophyte and diatom populations in an Antarctic lake. Earth Planet. Sci. Lett. 2004, 223, 225–239. [Google Scholar] [CrossRef]
  25. Kuczynski, J.; Stombaugh, J.; Walters, W.A.; González, A.; Caporaso, J.G.; Knight, R. Using QIIME to analyze 16s rRNA gene sequences from microbial communities. Curr. Protoc. Microbiol. 2012, 27, 1E–5. [Google Scholar] [CrossRef] [Green Version]
  26. Comeau, A.M.; Douglas, G.M.; Langille, M.G.I. Microbiome Helper: A Custom and Streamlined Workflow for Microbiome Research. mSystems 2017, 2, e00127-16. [Google Scholar] [CrossRef] [Green Version]
  27. Cock, P.J.A.; Fields, C.J.; Goto, N.; Heuer, M.L.; Rice, P.M. The Sanger FASTQ file format for sequences with quality scores, and the Solexa/Illumina FASTQ variants. Nucleic Acids Res. 2009, 38, 1767–1771. [Google Scholar] [CrossRef] [PubMed] [Green Version]
  28. Andrews, S. FastQC: A quality control tool for high throughput sequence data—ScienceOpen. Babraham Inst. 2010. Available online: https://www.bibsonomy.org/bibtex/f230a919c34360709aa298734d63dca3 (accessed on 5 August 2021).
  29. Zhang, J.; Kobert, K.; Flouri, T.; Stamatakis, A. PEAR: A fast and accurate Illumina Paired-End reAd mergeR. Bioinformatics 2014, 30, 614–620. [Google Scholar] [CrossRef] [PubMed] [Green Version]
  30. Gordon, A.; Hannon, G.J. Fastx-Toolkit. FASTQ/A Short-Reads Preprocessing Tools (Unpublished). Available online: http://hannonlab.cshl.edu/fastx_toolkit (accessed on 10 October 2020).
  31. Rognes, T.; Flouri, T.; Nichols, B.; Quince, C.; Mahé, F. VSEARCH: A versatile open source tool for metagenomics. PeerJ 2016, 2016, e2584. [Google Scholar] [CrossRef] [PubMed]
  32. Caporaso, J.G.; Kuczynski, J.; Stombaugh, J.; Bittinger, K.; Bushman, F.D.; Costello, E.K.; Fierer, N.; Pẽa, A.G.; Goodrich, J.K.; Gordon, J.I.; et al. QIIME allows analysis of high-throughput community sequencing data. Nat. Methods 2010, 7, 335–336. [Google Scholar] [CrossRef] [Green Version]
  33. DeSantis, T.Z.; Hugenholtz, P.; Larsen, N.; Rojas, M.; Brodie, E.L.; Keller, K.; Huber, T.; Dalevi, D.; Hu, P.; Andersen, G.L. Greengenes, a chimera-checked 16S rRNA gene database and workbench compatible with ARB. Appl. Environ. Microbiol. 2006, 72, 5069–5072. [Google Scholar] [CrossRef] [Green Version]
  34. Chao, A. Nonparametric estimation of the number of classes in a population. Scand. J. Stat. 1984, 11, 265–270. [Google Scholar]
  35. Lozupone, C.; Lladser, M.E.; Knights, D.; Stombaugh, J.; Knight, R. UniFrac: An effective distance metric for microbial community comparison. ISME J. 2011, 5, 169–172. [Google Scholar] [CrossRef] [PubMed] [Green Version]
  36. Parks, D.H.; Tyson, G.W.; Hugenholtz, P.; Beiko, R.G. STAMP: Statistical analysis of taxonomic and functional profiles. Bioinformatics 2014, 30, 3123–3124. [Google Scholar] [CrossRef] [PubMed] [Green Version]
  37. Azari, M.; Walter, U.; Rekers, V.; Gu, J.D.; Denecke, M. More than a decade of experience of landfill leachate treatment with a full-scale anammox plant combining activated sludge and activated carbon biofilm. Chemosphere 2017, 174, 117–126. [Google Scholar] [CrossRef]
  38. Stamps, B.W.; Lyles, C.N.; Suflita, J.M.; Masoner, J.R.; Cozzarelli, I.M.; Kolpin, D.W.; Stevenson, B.S. Municipal solid waste landfills harbor distinct microbiomes. Front. Microbiol. 2016, 7, 534. [Google Scholar] [CrossRef] [PubMed] [Green Version]
  39. Sang, N.N.; Soda, S.; Sei, K.; Ike, M. Effect of Aeration on Stabilization of Organic Solid Waste and Microbial Population Dynamics in Lab-Scale Landfill Bioreactors. J. Biosci. Bioeng. 2008, 106, 425–432. [Google Scholar] [CrossRef]
  40. Thauer, R.K.; Kaster, A.K.; Seedorf, H.; Buckel, W.; Hedderich, R. Methanogenic archaea: Ecologically relevant differences in energy conservation. Nat. Rev. Microbiol. 2008, 6, 579–591. [Google Scholar] [CrossRef]
  41. Kougias, P.G.; Angelidaki, I. Biogas and its opportunities—A review. Front. Environ. Sci. Eng. 2018, 12, 14. [Google Scholar] [CrossRef]
  42. Köchling, T.; Sanz, J.L.; Gavazza, S.; Florencio, L. Analysis of microbial community structure and composition in leachates from a young landfill by 454 pyrosequencing. Appl. Microbiol. Biotechnol. 2015, 99, 5657–5668. [Google Scholar] [CrossRef] [PubMed]
  43. Song, L.; Wang, Y.; Tang, W.; Lei, Y. Bacterial community diversity in municipal waste landfill sites. Appl. Microbiol. Biotechnol. 2015, 99, 7745–7756. [Google Scholar] [CrossRef]
  44. Laloui-Carpentier, W.; Li, T.; Vigneron, V.; Mazéas, L.; Bouchez, T. Methanogenic diversity and activity in municipal solid waste landfill leachates. Antonie Van Leeuwenhoek Int. J. Gen. Mol. Microbiol. 2006, 89, 423–434. [Google Scholar] [CrossRef]
  45. Ziegler, A.S.; McIlroy, S.J.; Larsen, P.; Albertsen, M.; Hansen, A.A.; Heinen, N.; Nielsen, P.H. Dynamics of the fouling layer microbial community in a membrane bioreactor. PLoS ONE 2016, 11, e0158811. [Google Scholar] [CrossRef] [PubMed] [Green Version]
  46. Söllinger, A.; Urich, T. Methylotrophic methanogens everywhere—Physiology and ecology of novel players in global methane cycling. Biochem. Soc. Trans. 2019, 47, 1895–1907. [Google Scholar] [CrossRef] [PubMed]
  47. Zinder, S.H. Physiological Ecology of Methanogens. In Methanogenesis; Springer: Cham, Switzerland, 1993; pp. 128–206. [Google Scholar]
  48. Qu, X.; Mazéas, L.; Vavilin, V.A.; Epissard, J.; Lemunier, M.; Mouchel, J.M.; He, P.J.; Bouchez, T. Combined monitoring of changes in δ13CH4 and archaeal community structure during mesophilic methanization of municipal solid waste. FEMS Microbiol. Ecol. 2009, 68, 236–245. [Google Scholar] [CrossRef] [PubMed]
  49. Jayanthi, B.; Emenike, C.U.; Agamuthu, P.; Simarani, K.; Mohamad, S.; Fauziah, S.H. Selected microbial diversity of contaminated landfill soil of Peninsular Malaysia and the behavior towards heavy metal exposure. Catena 2016, 147, 25–31. [Google Scholar] [CrossRef]
  50. Karelová, E.; Harichová, J.; Stojnev, T.; Pangallo, D.; Ferianc, P. The isolation of heavy-metal resistant culturable bacteria and resistance determinants from a heavy-metal-contaminated site. Biologia 2011, 66, 18–26. [Google Scholar] [CrossRef]
  51. Zainun, M.Y.; Simarani, K. Metagenomics profiling for assessing microbial diversity in both active and closed landfills. Sci. Total Environ. 2018, 616–617, 269–278. [Google Scholar] [CrossRef]
Figure 1. Schematic representation of pilot-scale simulated anaerobic bioreactors.
Processes 09 01377 g001
Figure 2. Clean geotextile fabrics at 50× magnification: (A) R4GT1, (B) R4GT2, (C) R2GT3/R3GT3. Exhumed geotextile fabrics at 50× magnification: (D) R4GT1, (E) R4GT2, (F) R3GT3, (G) R2GT3.
Processes 09 01377 g002
Figure 3. (a) Taxonomic composition and relative abundance of most dominant bacterial phyla of the 4 geotextile samples; (b) taxonomic composition and relative abundance of most dominant bacterial genera of the 4 geotextile samples.
Processes 09 01377 g003
Figure 4. Bacterial alpha diversity in geotextile samples based on rarefaction analysis: (a) Rarefaction curves depicting Chao1 diversity; (b) Rarefaction analysis based on observed OTUs.
Processes 09 01377 g004
Figure 5. The beta diversity analysis of the geotextile samples: (a) Ecological dissimilarity; (b) Weighted UniFrac distance box plot within and between the samples.
Processes 09 01377 g005
Figure 6. Taxonomic composition and relative abundance of the most dominant archaeal genera of the 4 geotextile samples.
Processes 09 01377 g006
Figure 7. Archaeal alpha diversity in geotextile samples based on rarefaction analysis: (a) Rarefaction curves depicting Chao1; (b) Rarefaction analysis based on observed OTUs in geotextile samples.
Processes 09 01377 g007
Figure 8. Archaeal beta diversity analysis: (a) Ecological dissimilarity derived from weighted UniFrac method; (b) Weighted UniFrac distance box plot.
Processes 09 01377 g008
Table 1. Physical properties of geotextile filters used in the study.
NameType and ModelThickness
(mm)
Apparent
Opening Size
Permeability
(L m−2 s−1)
Production MaterialProduction Method
R4GT1TenCate TS501.91112113PolypropyleneNeedle-punched
R4GT2GeoTeknik 2001.408460(PP)Needle-punched
R3GT3 and R2GT3IzoTeknik 2001.9011095PolyesterNeedle-punched
Table 2. The geotextile samples for the SEM and microbial analysis.
Sample IDReactorPosition in the Drainage ChamberReactor Feed
R2GT3R2MiddleSolid Waste + Sewage Sludge
R3GT3R3MiddleSolid Waste
R4GT2R4UpperSolid Waste
R4GT1R4LowerSolid Waste
Table 3. Raw read statistics and sequence quality assessment of the V3–V4 region of bacterial 16S ribosomal gene sequences from R2GT3, R3GT3, R4GT2, and R4GT1.
SampleRaw PECombinedQualifiedNochimeAvgLen (nt)Q20 (%)Q30 (%)GC Content (%)Effective Rate (%)
R2GT399,37690,28380,24377,97841598.1996.2353.7878.47
R3GT384,32476,76968,39765,42241398.2096.2754.3877.58
R4GT298,28889,94280,49977,70841598.2396.2954.3079.06
R4GT198,91891,91882,88180,88540998.2696.3357.3081.77
Table 4. The raw reads statistics and sequence quality assessment of the V4 region of the archaeal 16S rRNA gene sequence from R2GT3, R3GT3, R4GT2, and R4GT1.
SampleRaw PECombinedQualifiedNochimeAvgLen (nt)Q20 (%)Q30 (%)GC Content (%)Effective Rate (%)
R2GT3131,103113,36099,61196,77338097.3094.5053.6573.81
R3GT3101,79187,52077,14474,43238197.3394.5554.5073.12
R4GT258,19547,64040,49939,02438096.8493.5753.9267.06
R4GT145,25834,06228,37828,37838396.5796.5755.7558.96
Publisher’s Note: MDPI stays neutral with regard to jurisdictional claims in published maps and institutional affiliations.

