Article

Thermodynamic, Economic and Environmental Analyses of Ammonia-Based Mixed Refrigerant for Liquefied Natural Gas Pre-Cooling Cycle

Department of Mechanical Engineering, The University of Texas at San Antonio, San Antonio, TX 78249, USA
*
Author to whom correspondence should be addressed.
Processes 2021, 9(8), 1298; https://doi.org/10.3390/pr9081298
Submission received: 8 July 2021 / Revised: 20 July 2021 / Accepted: 20 July 2021 / Published: 27 July 2021
(This article belongs to the Special Issue Green Processes for Sustainable Fuel Production)

Abstract

:
Analyzing the entire liquefaction cycle, using a large temperature span with many degrees of freedom, may not always result in a practical solution. The objective of this paper is to investigate the feasibility of using an environmentally friendly refrigerant compound, ammonia, in the mixed refrigerant (MR) for the liquefied natural gas (LNG) pre-cooling cycle through thermodynamic performance, economic analyses and environmental impact. Fifteen cases studies within three major mixed refrigerants groups of MR-1, MR-2 and MR-3 were developed by adding ammonia to various molar compositions of lighter and heavier hydrocarbons. The thermodynamic analysis shows increasing ammonia’s concentrations in the mixed refrigerant by 10% had the largest enhancement on coefficient of performance (COP) of MR-1 by 0.67 and decreased the specific energy consumption of the pre-cooling cycle by 128 kJ/kg compared to the base case. Economic analyses revealed that the mixed refrigerant MR-1, with ammonia, methane, ethane and propane, benefited the most from higher concentration of ammonia in the mixed refrigerant, which resulted in both lower annual capital and operational costs by $2.52 MM and $3.67 MM, respectively. Lastly, reducing the methane concentration in MR and replacing it with ammonia, decreased the amount of refrigerant leakage through compressor’s seals and reduced the global warming potential index (GWPI) of mixed refrigerant up to 24.3%.

1. Introduction

Natural gas (NG) accounts for 24% of the world’s energy consumption. NG, among other fossil fuels, has gained global attention and praise due to its lower impact on the environment compared crude oils [1]. It is predicted that more restrictions on the use of crude oil will prompt rapid natural gas growth. In addition, researchers have projected natural gas as the primary fuel source by 2030 [2]. Due to the long distance between where NG is produced and the physical market, liquefying NG has become the most economical option to transport this invaluable source of energy. Lowering NG temperature to −162 °C results in liquefying and shrinking the total volume by 600 times, and liquefied natural gas (LNG) has some major advantages. As such, the cost of transportation and storage is much lower compared to installing gas lines over thousands of miles [3].
The pre-cooling process has gained tremendous interest in recent decades. Nearly 80% of plants have implemented the pre-cooling cycle to enhance the efficiency of the liquefaction cycle and lower the cost of operations [4]. Some of the major benefits of integrating the pre-cooling process in the natural gas liquefaction cycle are debottlenecks, with the liquefaction process having all three cycles of pre-cooling, liquefying and sub-cooling of natural gas take place in a cold box. Splitting the refrigeration duty between two refrigeration cycles allows the LNG plant to better control and optimize the refrigerant flow in separate processes, which results in higher efficiency and lower equipment size. Depending on the feed condition of natural gas and LNG plant requirements, dedicated pre-cooling cycles can improve the overall efficiency of up to 20% [5]. Various single pure refrigerants such as propane, ammonia, carbon dioxide, ethane propylene and fluorocarbons have been proposed for the natural gas pre-cooling process in the LNG industry [5]. In order for an LNG plant to select an optimal refrigerant for the pre-cooling cycle, multiple factors such as the ambient temperature, cycle’s efficiency, refrigerant availability and refrigerant’s flammability need to be considered [6]. In recent decades, about 70% of plants employed propane as a pure refrigerant for their pre-cooling cycle and the remaining used single mixed refrigerant (SMR), dual mixed refrigerant (DMR) or cascade cycle [7]. Castillo and Dora [8,9] investigated thermodynamic and economic effects of pure refrigerants such as nitrogen, methane, ethane and propane on the natural gas pre-cooling cycle. It was determined that propane, due to its lower compressor power, makes it the most suitable for the pre-cooling cycle. However, in this study an alternative precooling refrigerant, ammonia, is investigated for its thermodynamic performance while being an environmentally friendly compound. Numerous studies have been performed recently to improve the efficiency of the current propane pre-cooling cycle. Mortazavi et al. [10] found that the replacing of the JT valves with turbo-expanders improves the pre-cooling cycle efficiency up to 7.07%. Kalinowski et al. [11] proposed the replacement of the evaporator with an absorption refrigeration system, utilizing waste heat from the electrical power generating gas turbines, and improved the efficiency of the cycle by saving 1.9 MW of energy consumption. Sanavandi and Ziabasharhagh’s [12] study shows that energy consumption of the propane pre-cooling cycle decreased by 55 kJ/kg by solving the optimal mixed refrigerant composition utilizing the BOX optimization technique in which the optimization algorithm is to search for the global optima rather than local optima. The above studies used an optimization solver to optimize the efficiency of the entire cycle using the most common natural gas liquefaction cycles, such as C3MR, DMR and SMR, while this study narrowed down the scope of the research to the natural precooling cycle by adding an uncommon compound to mixed refrigerant, ammonia.
Although many studies have been conducted focusing on improving the thermodynamic efficiency of the LNG liquefaction cycle, it is still inadequate from an actual plant operation perspective and the results are only relative and they will not work for every LNG plant. There are several known factors which have a significant impact on the LNG plant’s capital and operation cost such as ambient temperature, natural gas composition and methane concentration, feed pressure, plant size, production rate, equipment maintenance and downtime, product shipping logistic, etc [13]. Economics plays a key role for investors to decide the most feasible option for their specific LNG plant by comparing the return of investment of the available options. While the LNG plant’s energy consumption savings have a direct impact on operation costs, they will not always result in lower production costs [14]. Primabudi et al. [15] revealed that the propane pre-cooling cycle cost of a product increases from 5047 $/h to 52,776 $/h, with 71% of the investment costs coming from pre-cooling heat exchangers and main cryogenic heat exchangers. However, the exergy efficiency of the cycle suffered 18% when the main objective was altered to minimize the total cost of production. In this study, the goal is to improve the precooling heat exchanger efficiency by investigating impacts of adding ammonia to the MR on the exergy loss rate rather than improving the well-established conventional propane pre-cooling cycle. Zhang et al. [16] performed comprehensive technical and economic analyses on the natural gas liquefaction cycle. It was determined that the large-scale LNG plant primary energy input is lower than the small-scale by 0.018–0.260 GJ/GJ. LNG, however, the specific capital cost of major equipment of identical processes does not correlate and varies significantly from 124 to 2255 $/TPA.LNG due to different complexities of the facility.
Finally, in selecting a proper pure or mixed refrigerant (MR) for the LNG liquefaction cycle, the plant is obligated to comply with the current environmental standards and regulations which are enforced both national and global agencies such as EPA (Environmental Protection Agency), Intergovernmental Panel on Climate Change (IPCC), etc. In recent decades, the majority of these agencies have implemented more restricted regulations on reducing the amount of methane emission to the atmosphere. Methane is widely used in LNG refrigeration systems and is also a source of fuel for the gas turbine. Although refrigeration leaks through compressor valve seals have always been a major issue, scientists are actively looking for alternative refrigerants to replace or reduce the amount of methane concentration in the mixed refrigerant. As a result, ammonia, a less pollutant and more environmentally friendly compound, has gained global interest. Ammonia is recognized for its unique thermodynamic characteristics in the refrigeration cycle [17]. Nitrogen and hydrocarbons such as methane (C1), ethane (C2), propane (C3) and butane (C4) have been the most common refrigerants used for the LNG liquefaction cycle for decades. However, some of these components are relatively more pollutant compared to others. Each gas has a specific rate of absorbing energy and escaping the atmosphere. This leads to environmental pollution, which is measured by the global warming potential index (GWPI). The global warming potential index of pure refrigerants is listed in Table 1. GWPI measures the amount of energy that emissions from 1 ton of a gas will absorb over a given period, usually a 100-year timespan, compared with the emissions of 1 ton of CO2 (carbon dioxide) [18]. For example, propane, which is one of the most common components used for pre-cooling, has a GWPI of 4. This means that propane pollutes the environment four times more than carbon dioxide. Among the common hydrocarbon refrigerants used for the LNG liquefaction cycle, methane has the highest GWPI of 28, while the refrigerant ammonia has the lowest GWPI, calculating at zero. However, employing ammonia comes with the trade-off of toxicity level of this compound to animals and humans. Exposures between 20 and 25 ppm can cause complaints and discomfort in some workers unaccustomed to ammonia exposure but have little effect on pulmonary function or odor sensitivity. Concentrations of 100 ppm cause definite irritation of the respiratory tract and eyes, and exposures at 250 ppm ammonia are bearable for 30–60 min [19]. Temperature has only minor effects on ammonia toxicity expressed as total ammonia in water, and ionic strength of the water can influence ammonia toxicity, but pH has a very marked effect on toxicity [20].
The majority of recent publications revolve around optimizing the pre-established liquefaction cycles such as C3MR, SMR, DMR, Cascade and PRICO through the commercial software ASPEN, mainly using common refrigerants in the LNG industry. ASPEN can be an advantageous tool to optimize the LNG process, yet relying on the software alone can fail to obtain a thermodynamically feasible and practical solution. As it is stated earlier, there are variety of factors that can impact LNG plant operation, which leads to higher number of degrees of freedom in the optimization model, which can be complex; therefore, the results can be misleading due to the lack of considering the adequate interaction mechanism between these process parameters [7]. In addition, most literature targets optimization of the entire natural gas liquefaction cycle. Although it is beneficial to determine the potential improvement throughout the entire cycle, it is also challenging due to the large temperature span in the heat exchanger and the amount of equipment involved [22]. This paper studies only the NG pre-cooling cycle from thermodynamic, economic and environmental perspectives. There has been similar literature on energy production plants in which the thermodynamic, exergy and economic aspects of the plants were studied. Alizadeh et al. [23] performed energy, exergy and economic analyses on a heliostat solar receiver (HSR) utilizing solar energy to heat the pressurized exhaust air before entering the combustion chamber to produce more steam in the gas cycle and combined cycle. The results showed the use of HSR in gas and combined cycles increases the annual average energy efficiency up to 22% and exergy efficiency up to 23% while lowering the net present value. Esfandi et al. [24] investigated performance, viability and environmental impact of the hybrid combined system of wind turbine and solar dish collector for a residential application through energy, exergy, economic and exergoenvironmental analyses. The results showed exergy efficiency of systems varied from 8% to 24.7% with a payback period time of 15.6 to 21.4 years. The main objective and novelty of this study is to investigate the relative impact of mixing an environmentally friendly compound, ammonia, with hydrocarbons as a single mixed refrigerant for the NG pre-cooling cycle only. The goal is to find potential improvements of the natural gas pre-cooling cycle using ammonia-based MR in conjunction with enhancing the pre-cooling cycle’s thermodynamic efficiency, economic benefits and environmental impacts. The study cases in this paper are aimed at lowering more harmful compounds, specifically methane’s concentration, by incorporating higher concentrations of ammonia in the mixed refrigerant with the presence of other hydrocarbons from ethane, propane, butane and pentane. To fully determine the effects of ammonia in a mixed refrigeration system of the NG pre-cooling cycle, three important objectives are considered in this study: (1) the cycle’s coefficient of performance and exergy analysis; (2) the capital and operational cost; and (3) the impact of mixed refrigerant leakage on the environment.

2. System Description

LNG plants, depending on the size and the design specification, decide whether to have a pre-cooling cycle with a separate heat exchanger(s) or have the entire NG cooling, liquefying and sub-cooling processes take place inside the cold box. In this study, as with most medium- to large-size LNG plants, the liquefaction cycle has a dedicated pre-cooling cycle with a primary refrigeration system. Having a separate pre-cooling cycle from the cold box comes with multiple advantages. The most noted include better control of each stage of the liquefaction process and reducing the capital cost by using smaller cold boxes for liquefaction and sub-cooling [3,5]. However, the proposed pre-cooling cycle is only limited for medium- to large-scale LNG plants due to the number refrigerants being used for the precooling cycle. Having four to five compounds in a mixed refrigerant only for a precooling cycle adds complexity to the operation, logistic and controllability of the refrigeration cycle and that is not a feasible option for smaller scale LNG plants.

Proposed Natural Gas Pre-Cooling Cycle Using Ammonia Based Refrigerant

Figure 1a,b illustrate the proposed pre-cooling cycle where the mixed refrigerant is composed of ammonia and hydrocarbons, C1, C2, C3, C4 and C5. In both proposed precooling cycles, natural gas enters the heat exchanger at slightly above the ambient temperature of 18 °C and a feed pressure of 50 bar. The pressure loss of NG across the heat exchanger is considered to be 0.5 bar for the purpose of this study. The discharge temperature of the pre-cooled natural gas exiting the heat exchanger needs to be evaluated depending on the molar composition of each MR. The natural gas molar composition listed in Table 2 shows that it mainly consists of methane, some ethane and a low percentage of heavier hydrocarbons and nitrogen. The molar composition of natural gas is developed based off of lean natural gas concept which has minimum of 90% methane, 6–8% ethane and the remaining is heavier hydrocarbon and nitrogen [25]. Most LNG plants allow up to 2–3% nitrogen and if there is a higher percentage of nitrogen in the well, plants will remove the excess nitrogen through a treatment process [26,27]. This is simply due to nitrogen not contributing any to the natural gas heating value.
The pre-cooling cycle displayed in Figure 1a is used when ammonia is mixed with lighter hydrocarbons, methane, ethane and propane where the MR stays at a gaseous phase throughout the entire process. However, Figure 1b displays a cycle when additional heavier hydrocarbons such as C4 and C5 are added to the mixture. There are a total of fifteen MR cases tested on the proposed pre-cooling cycle which are divided into three major blends of MR-1, MR-2 and MR-3 with five various molar compositions for each blend. The rationale behind developing these study cases is to investigate whether there is a trend in the results as molar concentration of ammonia increases among three blends rather than optimizing the cycle without considering the practicality of the solution. Furthermore, the strategy behind these fifteen case studies is to reduce molar concentration of a more pollutant compound, methane with a GWPI of 28, in the MR with an increment of 2.5%, and replace it with an environmentally friendly component, ammonia with a GWPI of zero. The detailed molar compositions of the mixed refrigerant for each case study are presented in Table 3.
In both proposed cycles, there are three to four compressors from low pressure (LP) to high pressure (HP) that are employed. Compressing the MR causes the MR temperature to rise above ambient temperature. Within the fifteen cases that were evaluated, the MR experienced a 50 to 70 °C increase at the compressor outlet. Air coolers were employed after each compression stage to lower the MR temperature nearer to ambient temperature of 20 °C. These air-cooled heat exchangers consist of a finned tube bundle with rectangular box headers enclosed in a plenum chamber to direct the air. The fan then forces the air through a horizontal tube bundle to remove the heat. Using an air cooler may not be the optimal way to lower the MR temperature, but it is the most cost-effective method for the NG precooling cycle. The air-cooler’s electric fan motor does not consume much power compared to the compressor drivers, which lowers the operation cost of the plant. Having additional heat exchangers with refrigeration systems adds complexity and extra cost. While many LNG plants are built offshore, using water for the cooling process may not be possible due to environmental restrictions and regulations. This makes air-coolers the most economical and environmentally friendly option because they use a free source of cooling fluid, ambient air, to cool down the hot compressed MR. If the proposed pre-cooling cycle was tested for lower or higher ambient temperature, it will affect the heat load, and as a result impact the mass flow rate off MR and potentially vary the molar composition of the MR needed to maintain target efficiency of the cycle. As the ambient temperature goes up, the mass flow rate of MR increases, which leads to a higher compression power and lower efficiency of the proposed pre-cooling cycle, and vice versa for a lower ambient temperature.
Mixed refrigerants go through a multi-stage compression with the compression ratio of anywhere from three to four depending on the MR molar composition of each case study presented in this paper. These compressors are typically driven by gas turbines, and depending on the size of the LNG plant, they consume 5–8% of the produced natural gas [13]. For five cases in MR-1, the blend was compressed through LP compressors to 4 bar and then to 15 bar. Then, the MR blend passed through to a high pressure compressor where it was compressed up to 40 bar. The reason MR-1 was required to be pressurized to a relatively higher value is due to the gaseous phase and lower density of the MR. Consequently, MR-2 and MR-3 went through four stages of compression and in all 10 cases for both blends, they were initially compressed to 4 bar and 13–15 bar through the 2nd compressor. After each compression, the MR temperature elevated above ambient temperature and, to avoid the MR temperature exceeding the compressor discharge temperature limit through next compression cycle, the MR was cooled to approximately ambient temperature through a series of air coolers. At this state, the MR-2 and MR-3 vapor quality was less than one, and therefore the liquid and vapor MR were separated through a separator vessel. The vapor MR was then compressed further up to nearly 60 bar in order to reach the required cooling capacity. The reason the vapor MR required such a high pressure was mainly due to its relatively low density. Subsequently, both liquid and vapor MR went through a rapid isenthalpic expansion, which caused the working fluid temperature to drop due to the pressure drop. In all fifteen cases pressure dropped through first JT valves within a range of 2–3 bar. Subsequently, to benefit the additional cooling capacity, the MR after it left the heat exchanger went through another set of JT valves, but this time its pressure dropped to slightly above atmospheric pressure, to 1.15 bar. JT valves are inexpensive, and are a more simple approach compared to using turbo-expanders for the refrigeration cycle. For the five cases for MR-1, the temperature lowered to approximately −28 °C and they left the heat exchanger at 0 °C, plus their temperature dropped to −3 °C through the second JT valve. For MR-2 and MR-3, there were four JT valves, two for vapor MR and two for liquid MR. In all 10 cases for these two blends, the pressure drop through the first JT valve caused the vapor MR temperature to drop up to approximately −28 °C. The liquid MR temperature also dropped up to −8 °C for MR-3 and −27 °C for MR-2. The main advantage of having a series of JT valves is to allow for multiple entries of working fluids to the heat exchanger with variable composition, which enhances the efficiency of the heat exchanger by lowering the exergy loss rate in the heat exchanger. Most medium- to large-scale LNG plants prefer using a series of JT valves for the liquefaction process rather than improving the cycle performance slightly by investing a considerable amount of capital investment, such as maintenance cost on turbo-expanders [28]. Nevertheless, the JT valves have a lower thermodynamic efficiency compared to expanders, which results in a lower overall performance of the liquefaction process [29]. The temperature and pressure values of each case study are listed in Appendix A.

3. Methodology and Governing Equations

3.1. Thermodynamic Analysis

The liquefaction process consumes a high amount of energy and is fairly expensive. LNG plants are constantly seeking improvements in the liquefaction process to lower the cost of production and enhance the cycle performance [30]. Exergy analysis is being employed in this study to identify the components with high energy consumption and higher exergy loss. Exergy analysis also evaluates the amount of irreversibility associated with the heat transfer process with a finite temperature difference. The exergy loss can be found in each component of the cycle from compressors, heat exchangers, JT valves and other equipment. Typically, a widespread concern amongst many LNG plants is the main source of exergy loss in the heat exchangers and compressors. The reason most LNG plants put such high emphasis on these two pieces of equipment is that the compressors consume a large amount of energy [31]. Consequently, this contributes to higher operating costs. In addition, the heat exchanger increases the capital costs of the plant [32]. Developing an energy efficient pre-cooling process would require minimizing the exergy loss in the heat exchanger. This can be achieved by reducing the gap between the two hot and cold composite curves. The gap between the two composite curves represents the exergy loss or the entropy generation in the heat exchanger. Studies show that the mixed refrigerant cycles have greater cycle efficiency compared to single component refrigerant cycles [33]. Exergy analysis in this study explores whether the pre-cooling cycle with added ammonia to the selected refrigerants is an energy efficient system or not.

3.1.1. Energy and Exergy Analysis

Exergy is a measure of the maximum available energy that can be used when bringing a process stream to its thermodynamic equilibrium state [34,35]. This can be determined by the enthalpy and entropy changes. The flow exergy values for each hot and cold streams are evaluated using the following equation:
    e f = h h 0       T 0       ( s s 0       )
where ef, h and s represent flow exergy (kJ/kg), specific enthalpy (kJ/kg) and specific entropy (kJ/kg·K) respectively; h0 and s0 represent specific enthalpy and specific entropy at the dead state of T0 and P0. [30].
The reason exergy analysis is critical, even when pinch analysis is performed on the heat exchanger, is attributable to the fact that the minimum temperature approach alone cannot enhance the mixed refrigeration cycle. Lee and Moon [15] has conducted studies and determined how friction in the valve, compressor and heat exchanger is critical to a plant’s operation efficiency. Due to the nature of the liquefaction processes and inevitable irreversibilities, some exergy will be destroyed during the heat transfer process between the mixed refrigerant and natural gas. The rate of exergy loss can be attributed to the rate of entropy generation ( S ˙ G e n ) by the Gouy-Stodola theorem as follows [36]:
d E c v d t = j ( 1 T 0 T j ) Q ˙ j ( W ˙ c v ) + i ( m ˙ i   .   e f , i ) o ( m ˙ o   .   e f , o ) E ˙ l
In a practical LNG liquefaction process, it is almost impossible to define a system without irreversibilities. Most of the irreversibilities in the LNG liquefaction process are caused by energy losses in the major equipment such as compressors, heat exchangers and JT valves [36]. To evaluate the rate of exergy loss for the major equipment shown in Figure 1 at a steady state, the energy balance must be developed first at a steady state, as follows: dEcv/dt is equal to zero, where ṁ, i and o represent the mass flow rate of the fluid, the inlet stream and outlet stream, respectively. The energy balance and exergy loss rate of each equipment is listed in Table 4.
Following the second law of thermodynamics, the exergy loss is present within the system is presented by Equation (3), where S ˙ G e n is the rate of entropy generated.
E ˙ l = T 0       . S ˙ G e n
Equation (4) represents specific energy consumption (SEC), which evaluates the amount of compressor shaft work it takes to pre-cool 1 kg of natural gas to approximately −30 °C. Evaluating SEC will allow us to determine the feasibility of addition of ammonia for each case study in the proposed pre-cooling cycle.
S E C = W ˙ c o m p r e s s o r s m ˙ N G , P r e c o o l e d = m ˙ M R m ˙ N G , P r e c o o l e d Δ h c o m p r e s s o r s
Wcompressor is the energy consumption of the compressors (kJ/kg), m ˙ M R and m ˙ N G ,   p r e c o o l e d   are mass flow rate of mixed refrigerant and pre-cooled natural gas (kg/s) respectively. To calculate the compressor shaft work, Equation (5) is applied with a compressor’s isentropic efficiency (ηIsen) of 85%.
W ˙ c o m p r e s s o r = m ˙ M R ( h 2 , I s e n h 1 ) η I s e n

3.1.2. Pre-Cooling Cycle Performance

To analyze the overall performance of the proposed natural gas pre-cooling cycle, the coefficients of performance and exergy efficiency of the precooling cycle are evaluated. The following equation represents the first thermodynamic energetic efficiency of the cycle: the ratio of thermal energy absorbed by the mixed refrigerant to the rate of compression power by compressors.
C O P = Q ˙ a b s o r b e d W ˙ c o m p r e s s o r s
To enhance the COP of the cycle in this study, the goal is to lower the energy consumption through the compressors which are implemented for the natural gas pre-cooling cycle shown in Figure 1. The mixed refrigerant’s molar composition, mass flow rate, inlet temperature and compression ratio have a direct impact on the compressor’s shaft work. The mass flow rate required to achieve the desired cooling load affects the coefficient of performance of the cycle. The main objective of thermodynamic analyses of this study is to enhance the process through lowering the compression power.
Pinch analysis provides another effective approach to reduce the exergy loss in the heat exchanger and the compression power of MR. The combination of these two factors enhances the cycle performance [37,38,39]. Other critical factors that play important roles in the cycle’s thermodynamic performance are the MR mass flow rate and pressure. The process improvement is mainly to lower the compression power while constraining the MTA (minimum temperature approach) value to at least 2 °C in the heat exchanger to enhance the objectives of most LNG plants per follow Equation (7).
f ( x ) = j ( W ˙ j m ˙ L N G )

3.2. Economic Analysis

3.2.1. Operation and Capital Cost

The results of the exergy analysis and its recommendations, without evaluating the economic benefits, are that it is not always the most suitable method to enhance a plant’s efficiency. The below equation represents the specific production cost ($/kg) of 1 kg of pre-cooled natural gas;
S P C = C a m o r t i z e d   c a p e x + C a m o r t i z e d   o p e x
where Camortized capex and Camortized opex are amortized capital costs ($/kg) and amortized operating costs ($/kg) respectively. The amortized capital cost is calculated using Equation (9):
C a m o r t i z e d   c a p e x = C s p e c i f i c   c a p e x ( r ( 1 + r ) n ( 1 + r ) n 1 )
where r and n are the discount rate and plant life, respectively. In this study r and n are assumed to be 12% and 20 years [40], respectively. Cspecific capex ($/(kg/year)) is the specific capital cost (Equation (10)), which is calculated as Ccapex ($) divided by capacity Y (kg/year). Ccapex ($) is the total capital cost, which is the total purchased-equipment cost multiplied by an installation factor (I) [40]. The installation factor of 4.74 is assumed for the calculations [35].
C s p e c i f i c   c a p e x = C c a p e x / y = I P E C Y
PEC ($) is the purchased-equipment cost for individual equipment, which is estimated using the following Equation (11):
log 10 ( P E C ) = K 1 + K 2 log 10 P + K 3 ( log 10 P ) 2
where PEC ($) is the equipment purchase cost, and P is the capacity parameter, i.e., fluid power (kW) for the compressors and turbines, area (m2) for heat exchangers and intercoolers. In addition, K1, K2 and K3 are capacity based constants specific for each equipment piece and are given in Table 5 [41]. This model is developed based off of using mainly carbon steel for fabricating the equipment listed in Table 5. The UA value which is the heat transferred area A (m2), multiplied by overall heat transfer coefficient also known as thermal transmittance U (W/m2·°C), is calculated from the following fundamental heat transfer Equation (12);
A = Q ˙ U 0 . Δ T l m
where ΔTlm and Q ˙   are logarithmic mean temperature difference (°C) and heat flow rate (kW), respectively.
To evaluate the operation and maintenance cost (COMC), the total purchased equipment cost (PEC) in Equation (14) is multiplied by an operation and maintenance cost factor (cf) of 2% [42]. Equation (15) represents the fuel cost which is evaluated by taking the total energy consumption through the compressors (Wtotal, kW) divided by the gas turbine efficiency, then multiplied by fuel cost (CFC, $/year), the availability of a plant in terms of the total number of operation hours throughout the year (t, hours/year), and Cfuel which is the cost of natural gas per Giga-Joule ($/GJ) [43].
C a m o r t i z e d   o p e x = C o p e x / y = ( C O M C + C F C ) / Y
C O M C = c f P E C
C F C = W t o t a l η G T t C f u e l 3600 / 1,000,000

3.3. Environmental Analysis

In order to investigate the environmental impact of the proposed mixed refrigerant, the global warming potential index (GWPI) is evaluated for all fifteen case studies. Table 1 lists the GWPI of the pure refrigerants. The following equations are utilized to evaluate the environmental benefits of lowering the methane concentration in the MR and replacing it with the environmentally friendly refrigerant, ammonia. To calculate the GWPI of a blend, the mass fraction of each refrigerant needs to be multiplied by its GWPI from Table 1 as shown in Equation (16) [44,45].
G W P I M R = k ( F R e f r i g , k   . G W P I R e f r i g , k )
Refrigerant leakage through compressor seals is inevitable and this is mainly due to compressor valve seals breaking over time. To evaluate the environmental consequences of mixed refrigerant leakage, the annual leak rate is calculated for the fifteen case studies listed in Table 3. Equation (17) shows the annual leak rate equivalent to tonne-CO2;
L R M R , A n n u a l = m ˙ M R t L R G W P I M R 3600 / 1000
where the mixed refrigerant mass flow rate of a mixed refrigerant is multiplied by number of operation hours in a year (t), leak rate (LR) which is considered to be 0.5%, and GWPI [46,47]. Due to continuous refrigerant leakage, LNG plants need to purchase the makeup refrigerants. Equation (18) shows the annual cost of a makeup refrigerant; CAMU is annual make-up cost of MR and t is availability (hr/yr):
C A M U = C L R t
where CLR is the cost of MR leak rate per hour ($/h) and t is the operation hours in a year. To calculate CLR, the equation shows the mass flowrate of MR is multiplied by the leak rate LR of 0.5% and the cost of MR, CMR ($/kg.MR) as shown in Equation (19).
C L R = m ˙ M R L R C M R
To evaluate CMR, the cost of each proposed mixed refrigerant ($)/kg and the mass fraction F is multiplied by the cost of each individual component as shown in Equation (20). The price of considered refrigerant compounds in this study are: methane $0.21/kg, ethane $0.534/kg, propane $0.679/kg, butane $0.702/kg, pentane $0.731/kg and ammonia $0.25/kg [48].
C M R = k ( F R e f r i g , k   . C R e f r i g , k )

4. Results and Discussion

The base case for each group of mixed refrigerant, MR-1, MR-2 and MR-3, were considered with 20% ammonia and 30% methane; methane’s concentration was gradually decreased to 20% and replaced with ammonia up to 30%. The proposed pre-cooling cycle’s thermal performance, economic and environmental impacts were investigated for a small size LNG train with a NG feed mass flow rate of 50,000 kg/h. The thermophysical properties needed for the analysis were computed by using equation of states through REFPROP software version 10.0 [49]. In addition, the cycle was simulated in ASPEN HYSYS to validate the results [50].

4.1. Thermodynamic Performance of Proposed NG Pre-Cooling Cycle

The required energy consumption for the proposed MR cycle was calculated for each case and the results are summarized in Table 6. The specific energy consumption (SEC) represents the amount of energy (kJ/kg) it takes to compress the MR to a desired cooling load through a series of low and high pressure compressors. Figure 2 shows the presence of heavier refrigerant compounds C4 and C5 resulted in lower energy consumption. This is attributed to heavier molecular weight and, subsequently, higher density of the refrigerant blend, which takes less compression to meet the cooling capacity requirement. Reducing the molar concentration of methane by 10% and replacing it with ammonia in MR-1, MR-2 and MR-3 resulted in reduced energy consumption by 127.7, 56.5 and 56.4 kJ/kg, respectively. This shows that the blend of ammonia with methane, ethane, propane, butane and pentane in MR-3 has the highest relative energy consumption savings in terms of magnitude.
The coefficient of performance, COP, is calculated using Equation (6) to evaluate the thermodynamic performance of the ammonia-based mixed refrigeration cycle. Figure 3 shows that adding higher concentrations of ammonia to various blends enhances the natural gas pre-cooling cycle’s coefficient of performance. The increase of ammonia molar concentration while lowering the methane concentration in the MR has the highest impact on MR-3 with COP 1.72. The results from Table 6 show that as the ammonia’s concentration increased from 20% to 30%, the COP of MR-1 and MR-2 improved by 0.67 and 0.51. The dominant factor that resulted in higher COP for MR-3 compared to MR-1 and MR-2 was the lower mass fraction which led to a lower energy consumption of the compressors. The results in Table 6 show that the mass fraction of MR-3e has the lowest mass fraction among all 15 cases with 0.234. This is due to the presence of compound such butane and pentane with higher density values on the enthalpy change of the working fluid.

4.1.1. Exergy Loss of Individual Equipment

Exergy analysis of individual equipment enables us to find the potential improvement of each component. Figure 4 displays graphical presentation of the exergy loss percentage of individual major equipment between the base case with 20% ammonia and the MR with 30% ammonia for all three groups of mixed refrigerants. The results show MR-3 has a relatively lower exergy loss rate in both the compressor and heat exchanger with 7.3 kJ/kg and 4.5 kJ/kg, respectively. This is a result of higher density of MR as a result of heavier hydrocarbons in the mixed refrigerant. Nevertheless, this has a direct impact on the operational cost of compressors by enhancing the amount of useful work. Additionally, it is clear from Figure 4 and Table 7 that the JT valves in all three MRs have the highest exergy loss percentage among other major equipment, with 55.6%, 41.4% and 39.1 for MR-1, MR-2 and MR-3, respectively. This mainly due to the larger entropy changes as a result of larger temperature gradients between the inlet and outlet of the valve. However, MR-1, among the three MRs, has the highest improvement on the heat exchanger exergy loss percentage compared to other equipment. The common practice to reduce the exergy loss by JT valves is to replace them with turbo-expanders which enhance the cycle’s overall exergy efficiency by reducing the energy consumption [22]. However, this comes with the tradeoff of higher capital costs and routine maintenance. Furthermore, having a turbo-expander as additional equipment in the liquefaction cycle leads to a higher risk of production line interruption due to potential equipment failure or repairs.
The exergy loss values of each equipment for all three groups of mixed refrigerants are listed in Table 7. In terms of magnitude of exergy loss, compressors for MR-3 with the average exergy loss rate of 10.5 kJ/kg have the lowest exergy loss rate compared to two other MRs and that is mainly due to the lower entropy change due to lower pressure ratio between inlet and discharge. Even though an air cooler has relatively high exergy loss compared to heat exchanger and compressors, it is not a concern for an LNG plant’s operations due to its high reliability, low operating cost, and low capital cost of equipment.

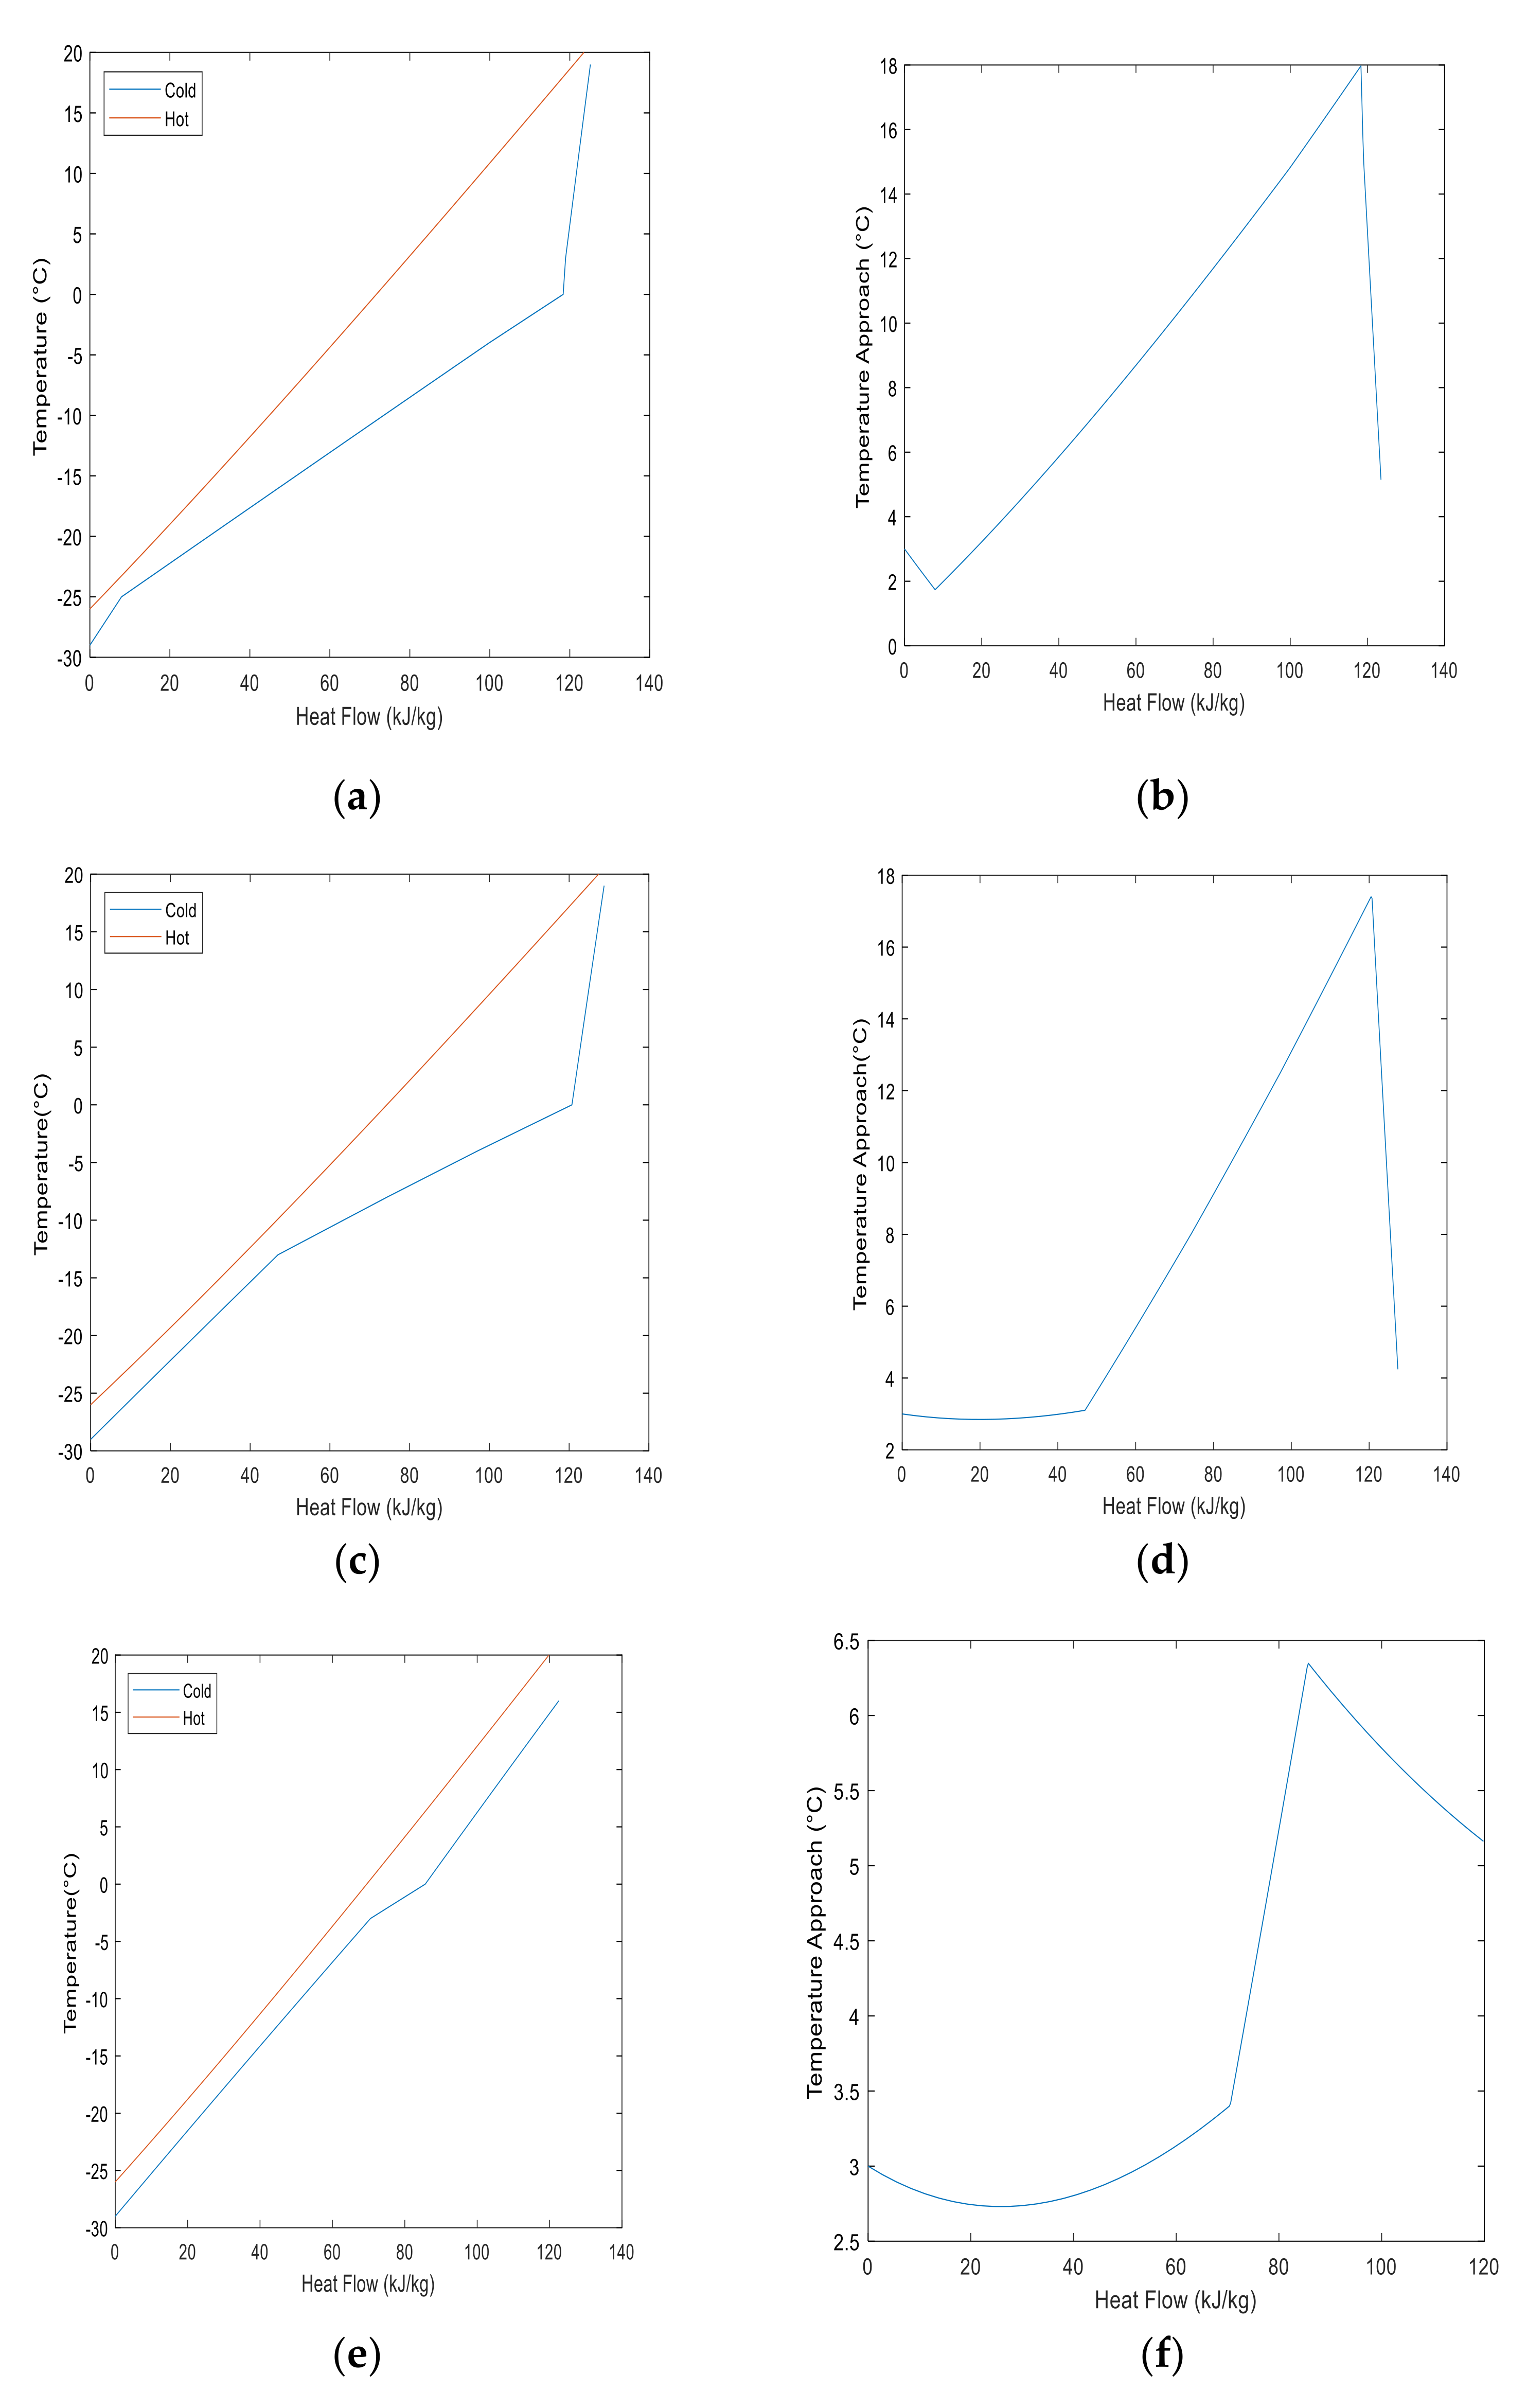
4.1.2. Heat Exchanger Sizing

Figure 5 shows the variation of a heat exchanger’s UA value per kilogram feed natural gas for fifteen case studies, and the concentration of ammonia in each blend. Since the mass flow rate of a mixed refrigerant plays a key role on a heat exchanger’s sizing, the heat exchanger’s UA values are compared side by side with the mass fraction of MR per feed NG. Both UA and mass fraction plots in Figure 5 display similar trends of results. This indicates that as the MR mass flowrate decreases, consequently, the heat exchange UA value decreases. It is clear from both plots that ammonia’s higher concentration had a positive impact impact on MRs’ mass fraction and heat exchanger’s UA value. Although MR-3 has the lowest UA value, MR-1 has the largest improvement in which the UA value decreased by 14.4 (kJ/kg·K), while the UA value for MR-2 and MR-3 decreased by 4.3 and 6.3 (kJ/kg·K) respectively. Even though these results are relative rather than optimized, comparing the base case of each MR with 20% ammonia and the case of each MR with 30% ammonia, MR-1 has shown significant improvement compared to MR-1 and MR-3 as result of higher concentrations of ammonia in the mixed refrigerant.
The composite curves play an important role in the liquefaction cycle performance when determining whether the proposed MR enhances the heat exchanger performance or not. The following plots in Figure 6 represent NG and MR composite curves, and the temperature approach between the two curves for case studies MR-1e, MR-2e and MR-3e. The area between the hot and cold streams represents the exergy loss rate in the heat exchanger. The results show that MR-3e has a relatively much smaller area between hot and cold streams compared to the other two mixed refrigerants. Even though MR-1e and MR-2e have similar curves, it can be observed that the gap between hot and cold streams for MR-2e in Figure 6c is relatively smaller than MR-1e in Figure 6e for temperatures ranges from −28 °C to 0 °C, especially from −28 °C to −15 °C. As a result, the smaller gap between hot and cold streams makes MR-3e a better choice over MR-2e for the pre-cooling process due to lower exergy loss in the heat exchanger. It is clear from Table 7 that the exergy loss rate of MR-3e is smaller with 4.5 kJ/kg compared to MR-2e and MR-3e with an exergy loss rate of 6.6 kJ/kg and 11.4 kJ/kg, respectively. Furthermore, it can be noted the temperature approach for MR-1e and MR-2e did not exceed 18 °C and 6.5 °C for MR-3e, the minimum temperature approach for all three cases were close to 2 °C. To determine which mixed refrigerant option is most suitable for the overall NG pre-cooling cycle, the heat exchanger composite curves may not present the best solution solely. Depending on the LNG plant’s operation parameters and objectives, the liquefaction process’s energy consumption, and the cycle’s thermal, play important roles in determining the most feasible mixed refrigerant option. For example, the specific energy consumption results from Table 6 shows MR-3 has relatively lower values compared to MR-1 and MR-2, which makes the MR-3 the most suitable option from an energy consumption perspective. However, MR-2 proved to be a better option for the heat exchanger performance when ammonia’s concentration increased and that is due to lower exergy loss rate difference between the base case and fifth case by 3 kJ/kg.

4.1.3. Energy Comparison Results with Literature

In many cases, recent studies have performed comprehensive analyses to lower the energy consumption of the entire liquefaction cycles. Although, these studies used powerful optimization techniques with beneficial results, not all cases are practical for every LNG plant. Each specific LNG plant, depending on equipment, size of the plant, geographical location of plant, NG composition, available refrigerants, and economic factors, decides on the main objective of design and operation of the NG liquefaction process. Therefore, the direct comparison of results may not lead to a practical conclusion. The goal of Table 8 is to look at various liquefaction processes such as C3MR [51,52], SMR [53,54], and DMR [55] to obtain a broader perspective of the total shaft work being presented for each liquefaction process.
The NG pressure in literature varies from 40 bar to 55 bar with methane concentration variation of 82% to 91.4%. In this study, the natural gas feed pressure is considered 50 with a methane concentration of 90%. The precooling temperature from five different literatures shows −20.4 °C to −35.8 °C, while, in this study, it varies from −26 °C to −28 °C. While the comparison of literature values for the entire cycle is not a fair comparison to only pre-cooling cycle with multiple compounds, but it can be stated that the lower SEC values of MR-1, MR-2 and MR-3 considering the precooling takes 20% to 40% or total liquefaction energy consumption [4], show the significance of ammonia’s heat vaporization effect in the mixed refrigeration cycle. The reason that the specific energy consumption of MR-3 may seem to be too optimistic is mainly due to the presence of a high density and high boiling temperature compound, pentane, which is uncommon in the LNG refrigeration cycle. This compound is not favorable to sub-cooling process due to a higher freezing temperature of −129 °C than LNG temperature of −162 °C. This can potentially cause blockage in the refrigeration cycle and damage the equipment. However, pentane will not cause any interruption to the precooling cycle since the target pre-cooling temperature of −30 °C is far above the pentane freezing temperature.

4.2. Economic Benefits of Proposed Pre-Cooling Cycle

The economic analysis is performed per one small train with a feed natural gas flow rate of 50 × 103 kg/h. In this study, production cost is divided into two major groups of operation and capital cost. The capital cost breakdowns of major equipment are listed in Table 9. It is clear from Figure 7 that the capital cost of a gas turbine is relatively higher than other equipment. Comparing the capital cost trend for each case study in conjunction with increasing ammonia’s concentration for each blend shows MR-1 having the highest cost savings by $ 2.44 MM, whereas MR-1 and MR-3 equipment cost savings are $ 0.607 MM and $ 0.696 MM, respectively. However, the higher concentration of ammonia in all three blends did not have a significant impact on the capital cost of the air coolers.
The specific production cost per kilogram of pre-cooled natural gas of each mixed refrigerant case is evaluated using Equation (8) and the results are shown in Figure 8 and Table 10. The results show that the amortized operation cost captures larger portions of total costs of the proposed pre-cooling cycle for each case. This is mainly due to the relatively higher energy consumption by the compressor’s driver and gas turbine compared to maintenance cost of these equipment. Figure 9 shows that the fuel cost is the dominant factor in annual operational costs. It is clear from Figure 2 that the specific energy consumption of the pre-cooling process using MR-3 is lower than MR-1 and MR-2, which leads to similar trends in operational costs. In addition, when comparing the fifteen case studies within three major blends, we see that increasing the ammonia’s concentration by 10% resulted in specific production costs of pre-cooled natural gas decreases by 59.8%, 40.1%, and 51% for MR-1, MR-2 and MR-3, respectively. Since the isentropic efficiency of a compressor and the thermal efficiency of a gas turbine are predetermined factors of operational cost, LNG plants can only lower the energy consumption through the mixed refrigerant mass flow rate and the molar composition. Among the three refrigerant blends, MR-1 showed the highest cost savings in fuel cost by $ 3.67 MM while MR-2 and MR-3 fuel costs dropped by $ 1.62 MM and $ 1.61 MM, respectively.

4.3. Environmental Impacts of Ammonia in Mixed Refrigeration Cycle

The environmental impact of mixed refrigerant leakage though the compressors are evaluated in this study while considering the leak rate of 0.5% of MR mass flow rate [56]. The annual leak rates of the fifteen case studies have been evaluated using Equation (17). The results are listed in Table 11 for each blend equivalent to tonne-CO2. Figure 10 shows that the annual leak rate of MR-1 has the highest leak rate with 13.96 × 10³ tonne-CO2/year and MR-3 with leak rate 3.91 × 10³ tonne-CO2/year has the lowest value among all three blends. However, it is clear from Table 11 that reducing methane concentration by 10% and replacing it with ammonia decreases the annual leak rate by 8.83 × 10³, 3.11 × 10³ and 3.8 × 10³ tonne-CO2/year and GWPI by 24.3%, 23.2% and 17.4% for MR-1, MR-2 and MR-3, respectively. This is mainly due to the larger mass flow rate and higher GWPI of MR-1 compared to MR-2 and MR-3. Therefore, it can be stated that MR-2 has a relatively lower negative impact on the environment compared to the other two MRs. Therefore, it can be stated that MR-2, with the lower leak rate, is the most suitable option for the proposed pre-cooling cycle from an environmental perspective.
Not only does the mixed refrigerant leakage have a negative environmental impact, it also creates additional operation challenges and costs for the LNG plants due to the constant purchasing of the makeup refrigerant. This adds more complexity to the plant’s operations because there are special storage conditions required for each refrigerant, plus logistical complexities for each refrigerant compound. The annual costs of make-up refrigerants due to leakage for each fifteen case studies were evaluated using Equation (18). Figure 11 shows MR-1 has the highest cost of make-up refrigerant of $0.835 MM/year, whereas MR-3 has the lowest cost of $0.135 MM/year. This is a direct result of mixed refrigerant molar composition and mass flow, and as such the case study with the higher MR mass flow rate is likely to have a higher annual make-up refrigerant cost.

5. Conclusions

In summary, the performance of a proposed LNG pre-cooling cycle was investigated for ammonia-based mixed refrigerants. Fifteen case studies were developed with three major mixed refrigerants to investigate the process efficiency of ammonia in a mixed refrigeration cycle through thermodynamic, economic and environmental analyses. The analyses were performed for a small LNG train with a feed natural gas mass flow rate of 5 × 10⁴ kg/h. The major findings are summarized as follows.
(1)
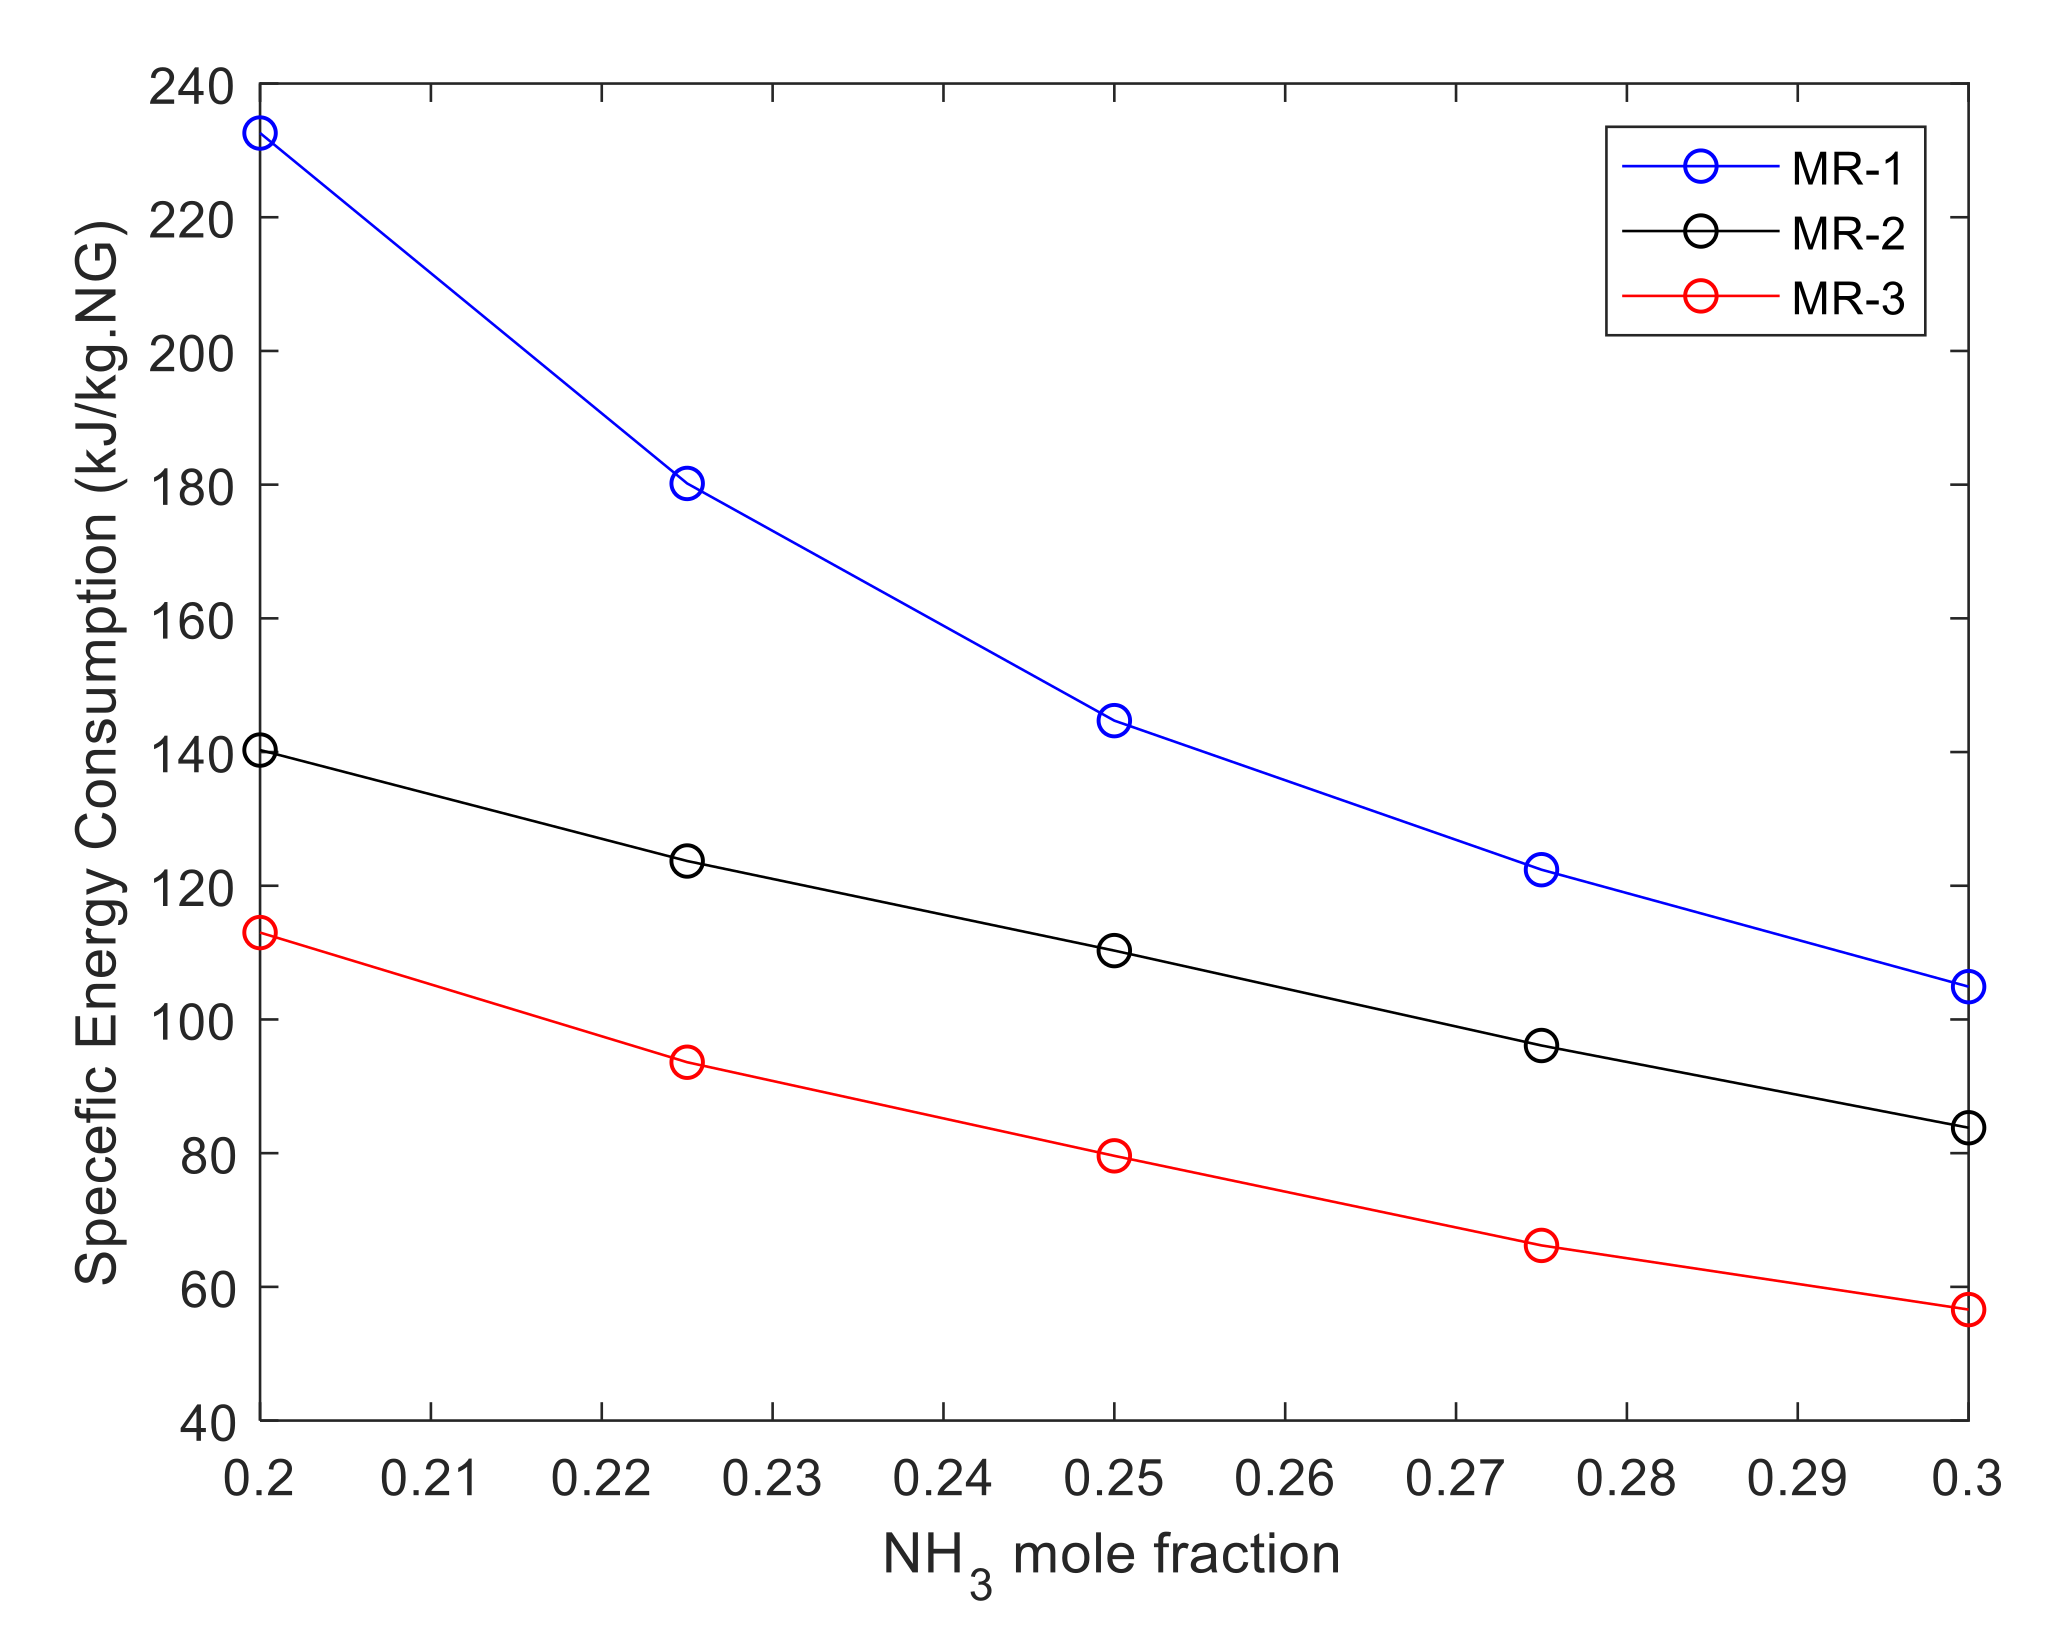
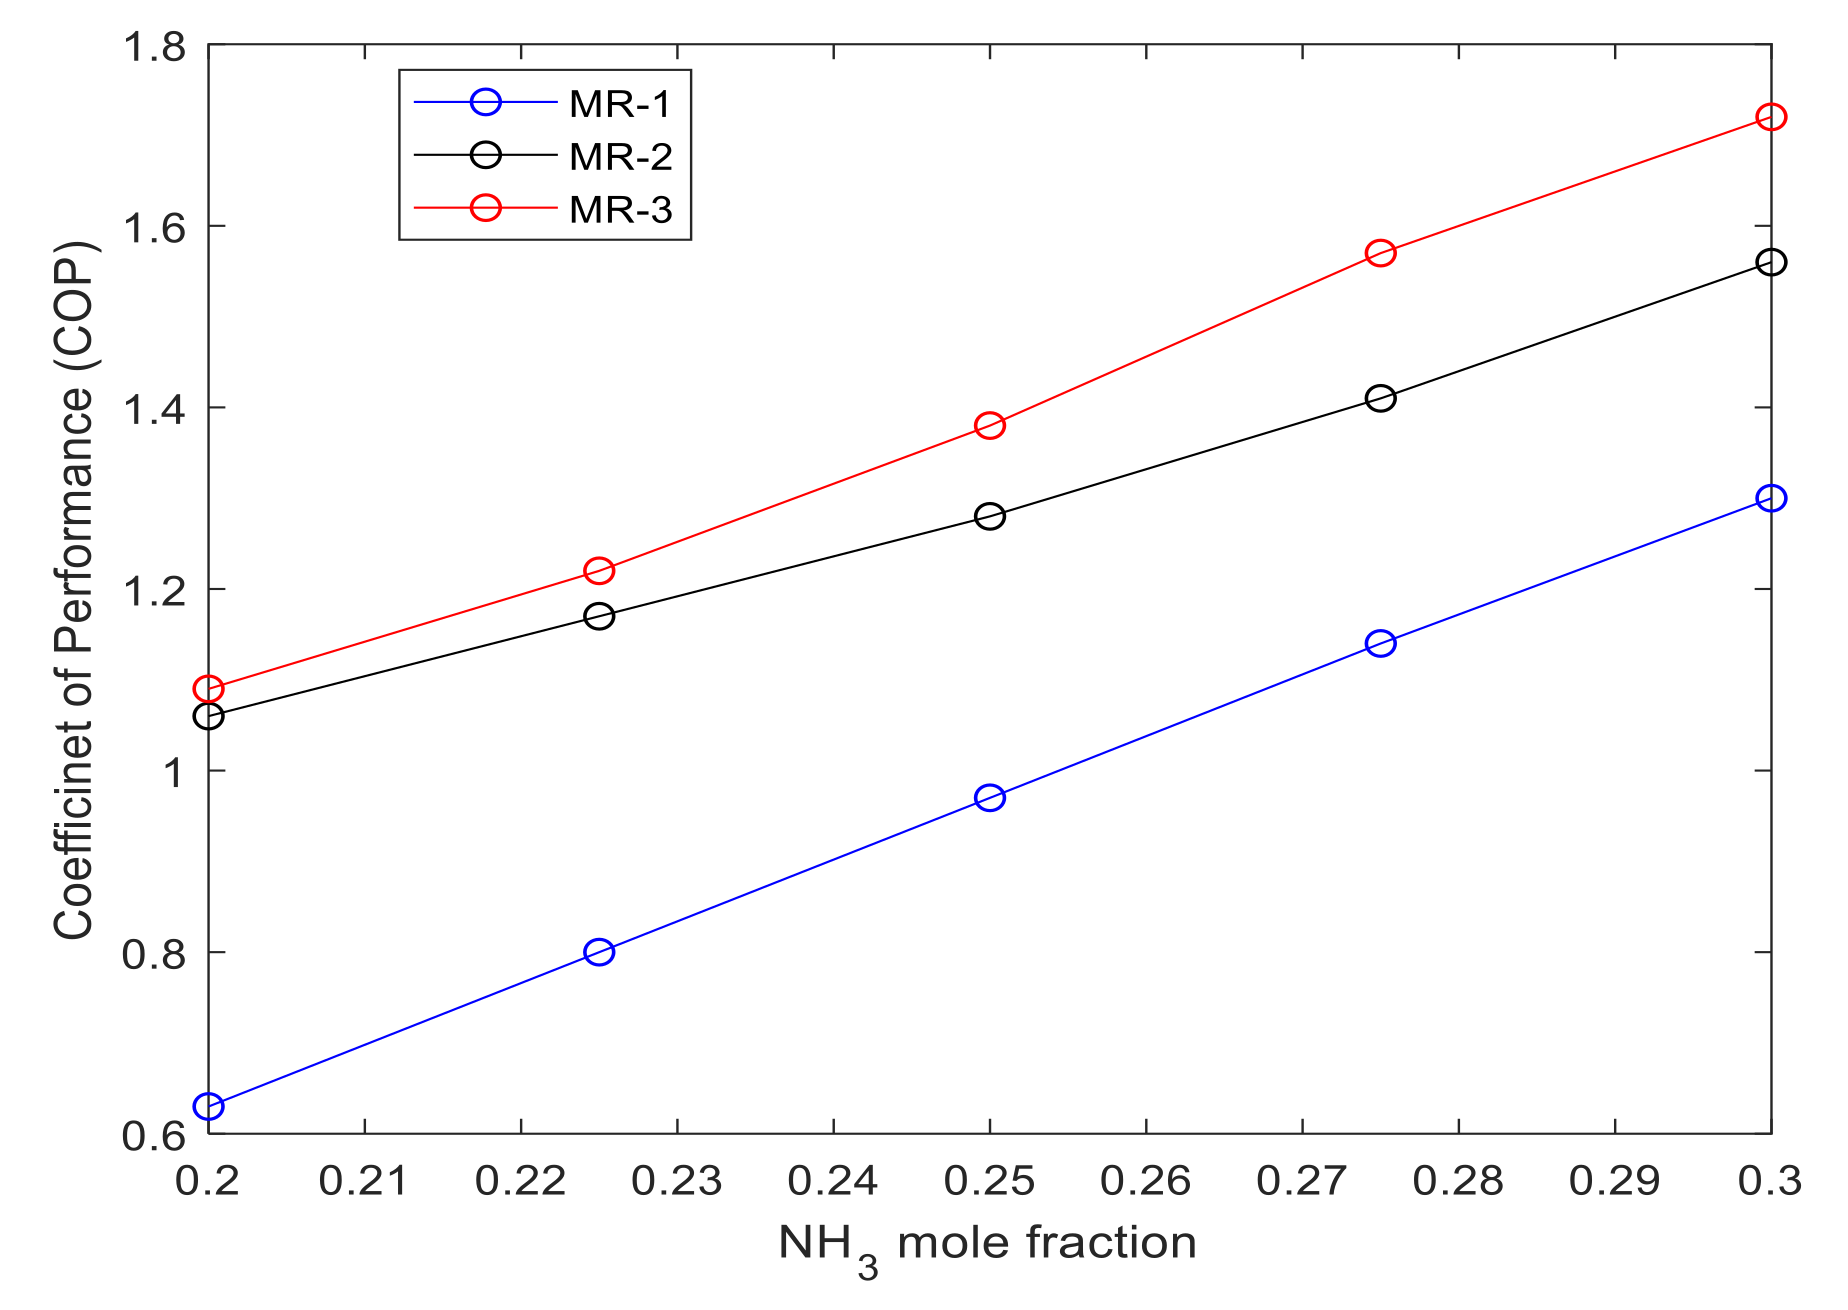
Thermodynamic analyses shows increasing ammonia’s concentration in the mixed refrigerant reduced the exergy loss rate in all four major pieces of equipment of the proposed pre-cooling cycle. The JT-valve showed the largest improvement among other equipment and specifically on MR-1 by reducing the exergy loss rate by 85.4 kJ/kg. Results indicate that increasing ammonia’s concentration in the mixed refrigerant by 10% enhanced the COP of MR-1, MR-2 and MR-3, to 1.30, 1.56 and 1.72, respectively. The similar trend of results for COP correlates with the specific energy consumption (SEC) of the cycle in which, as ammonia’s concentration increases in each MR, the SEC decreases. Among three major MRs, MR-1 has the highest improvement of specific energy consumption by 128 kJ/kg.
(2)
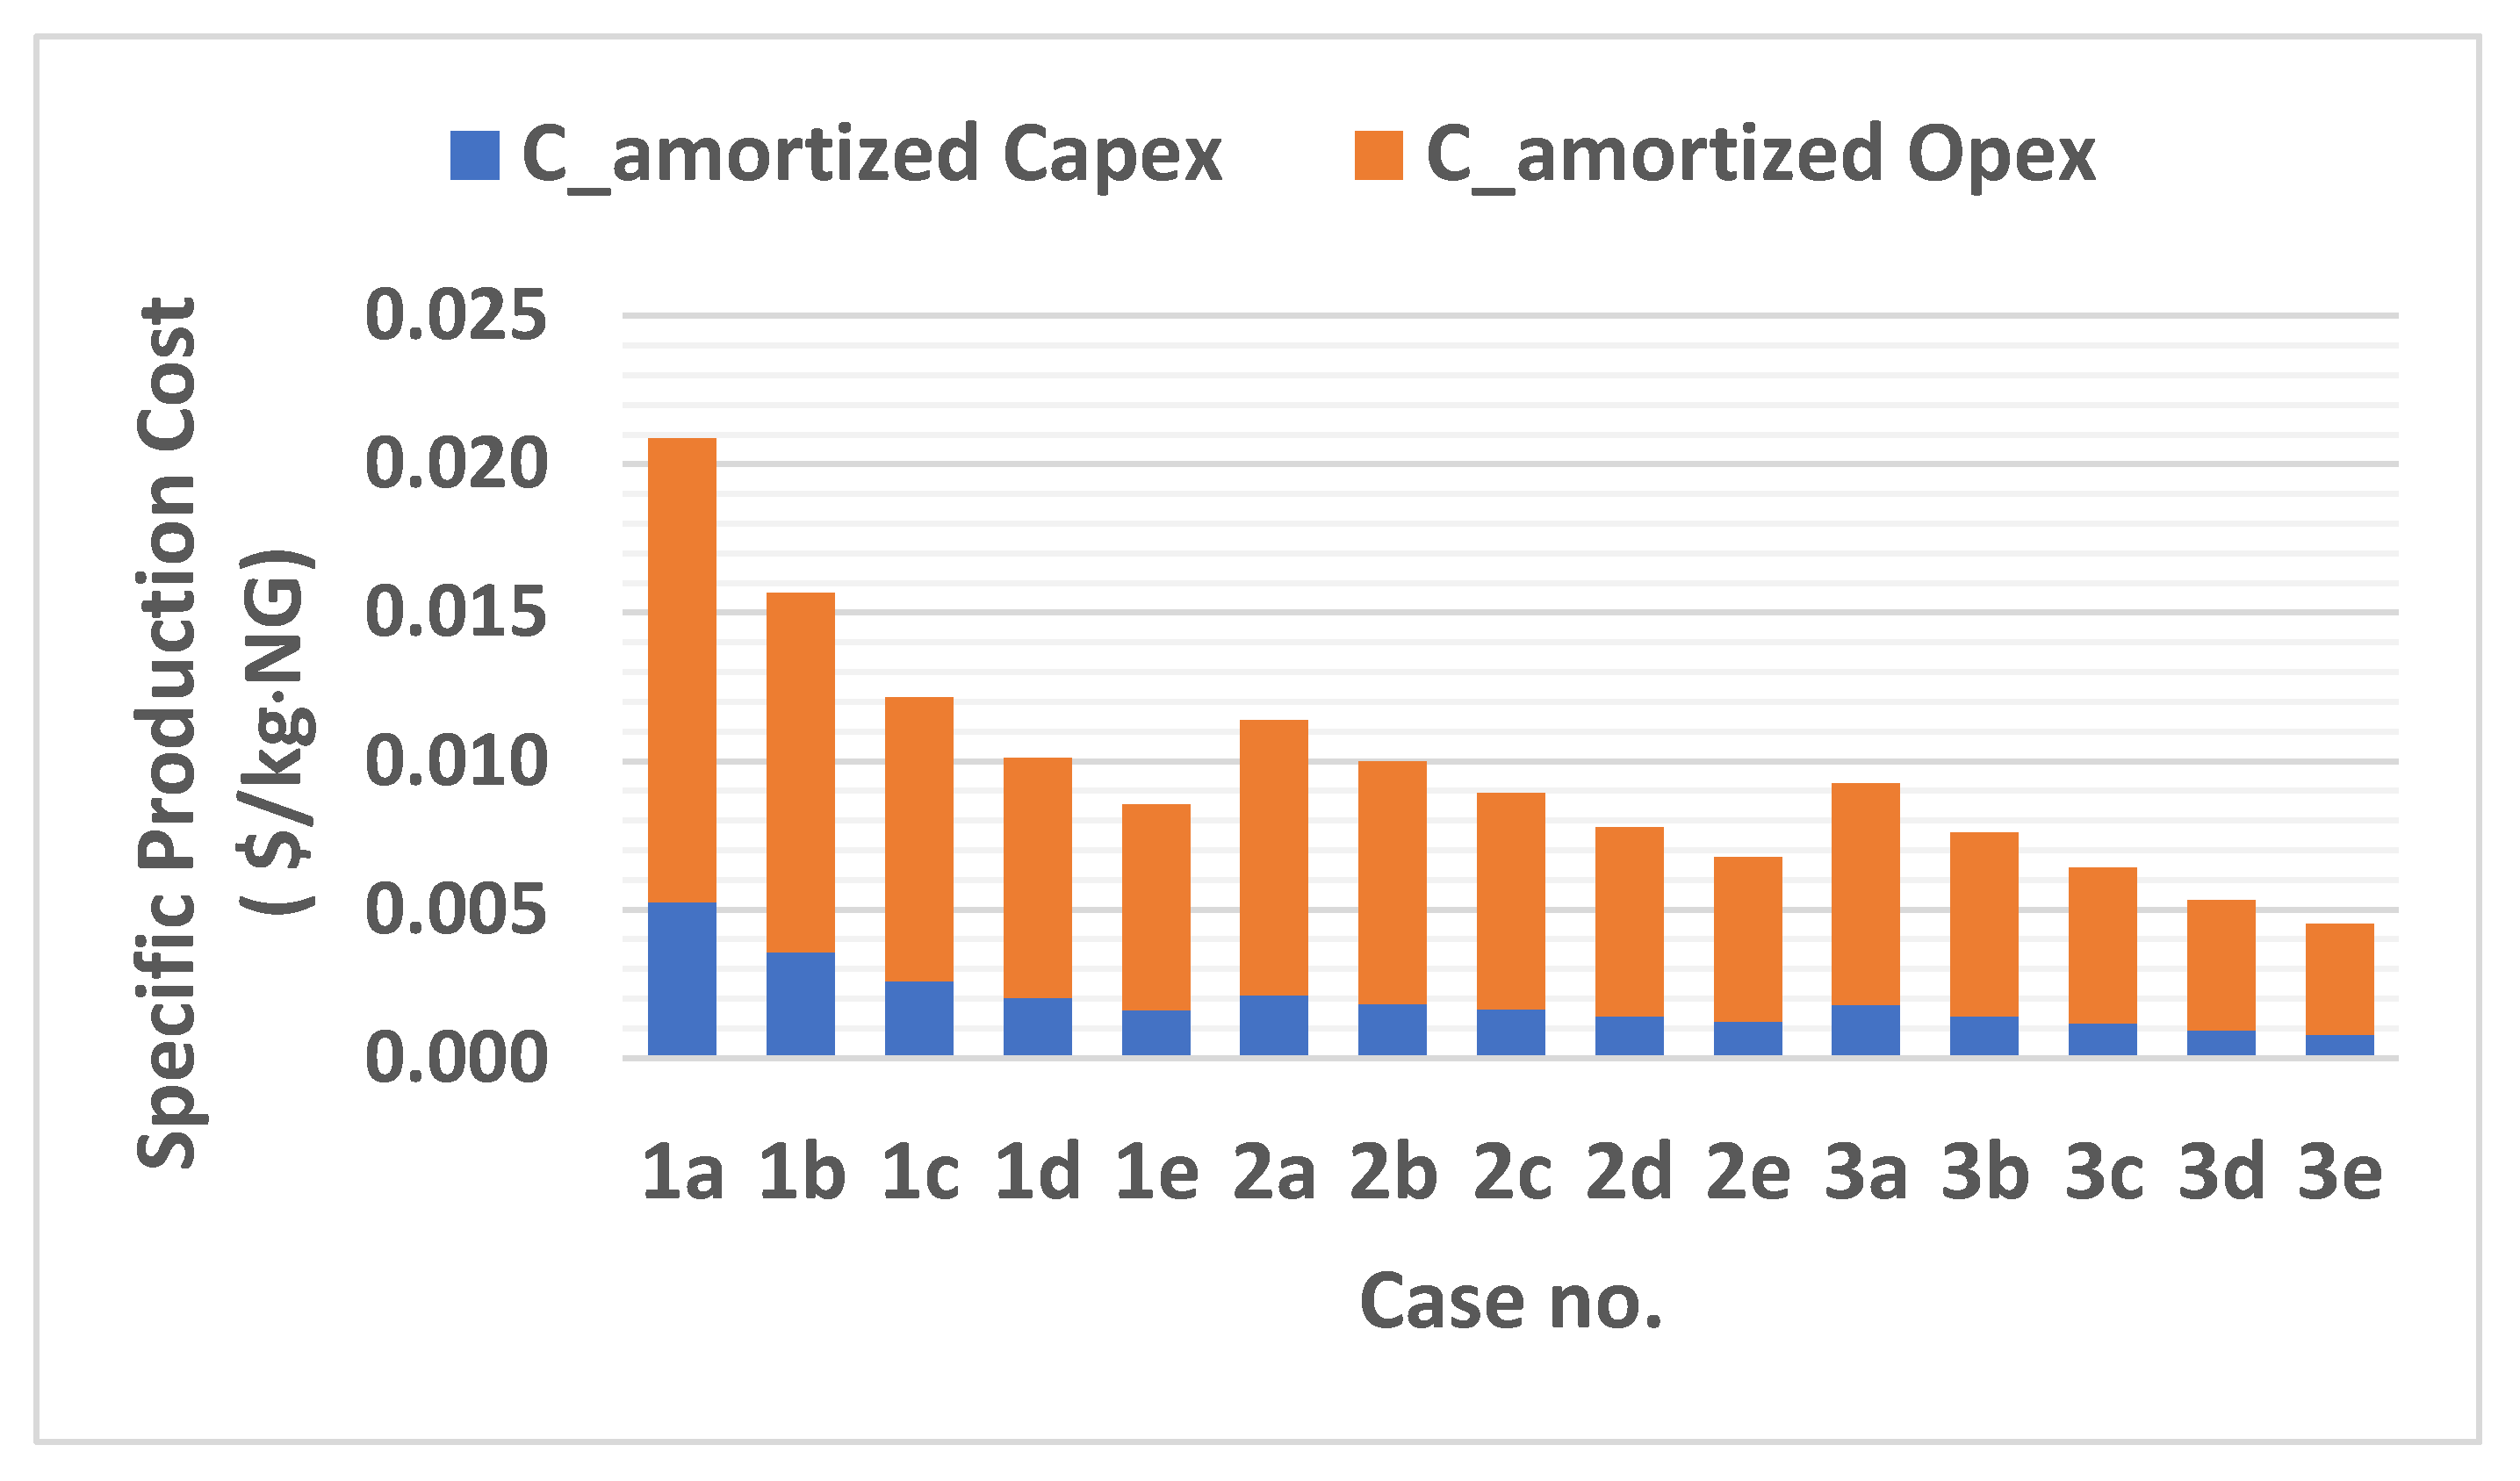
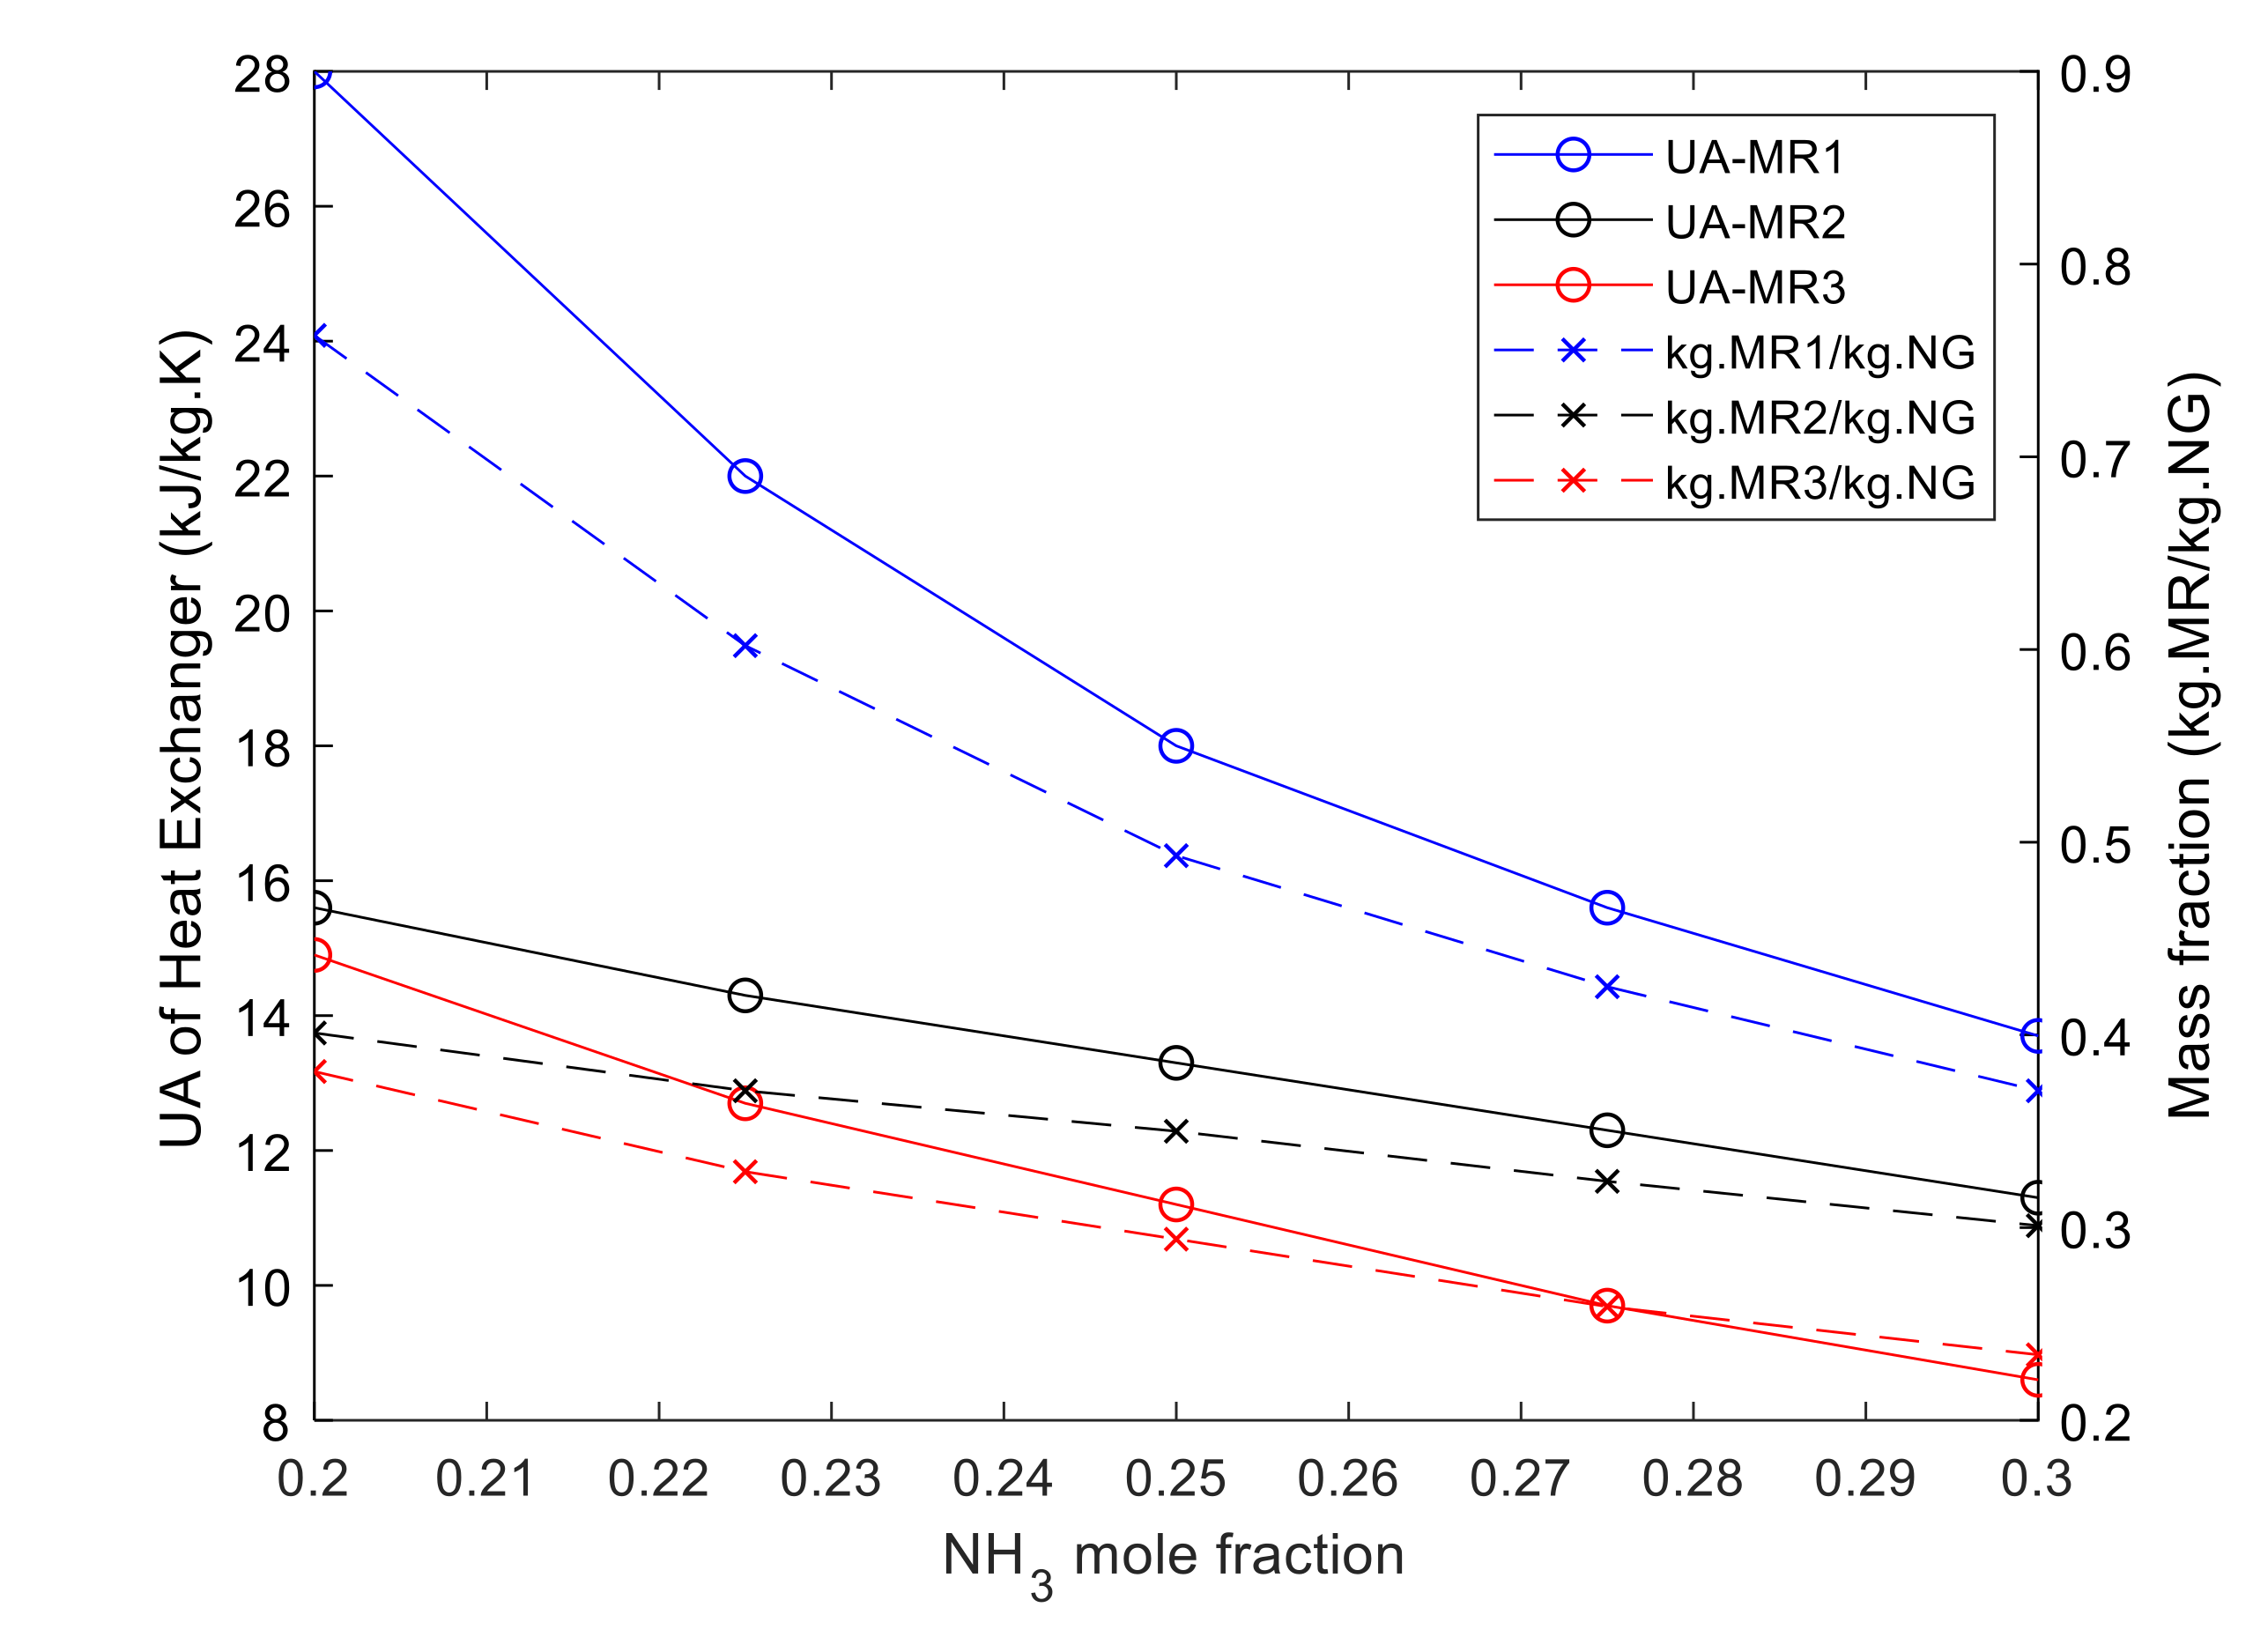
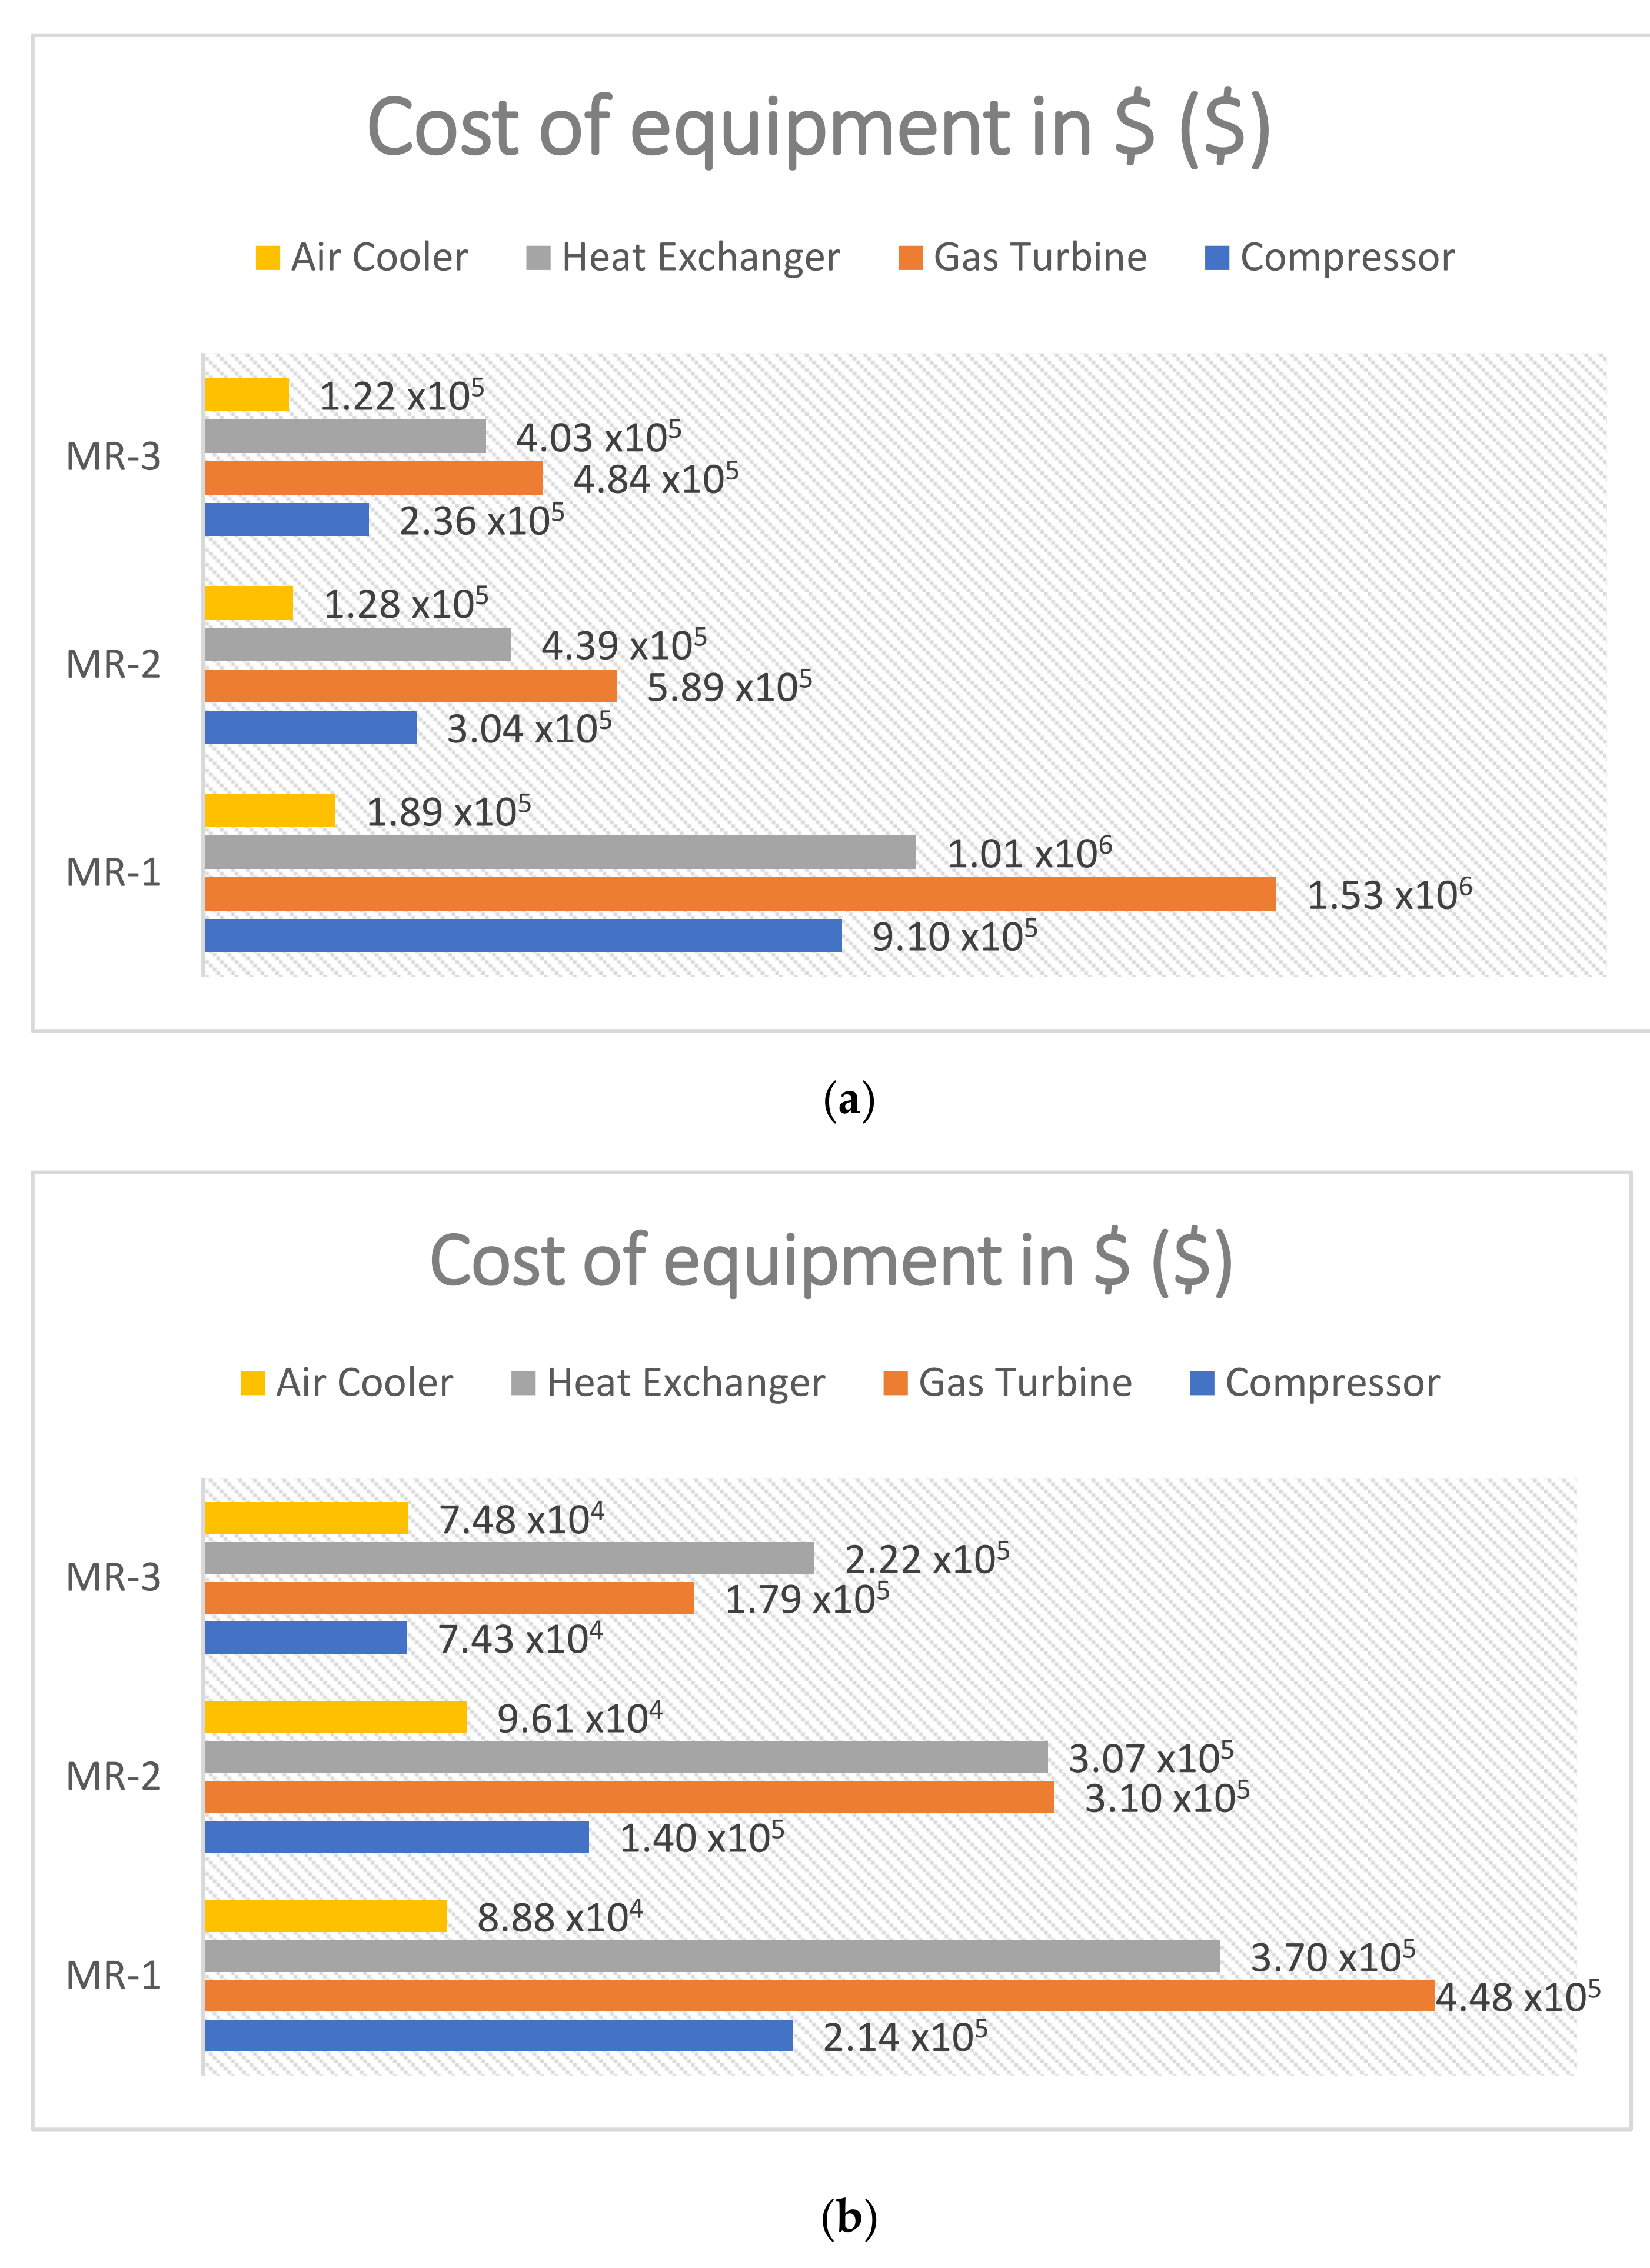
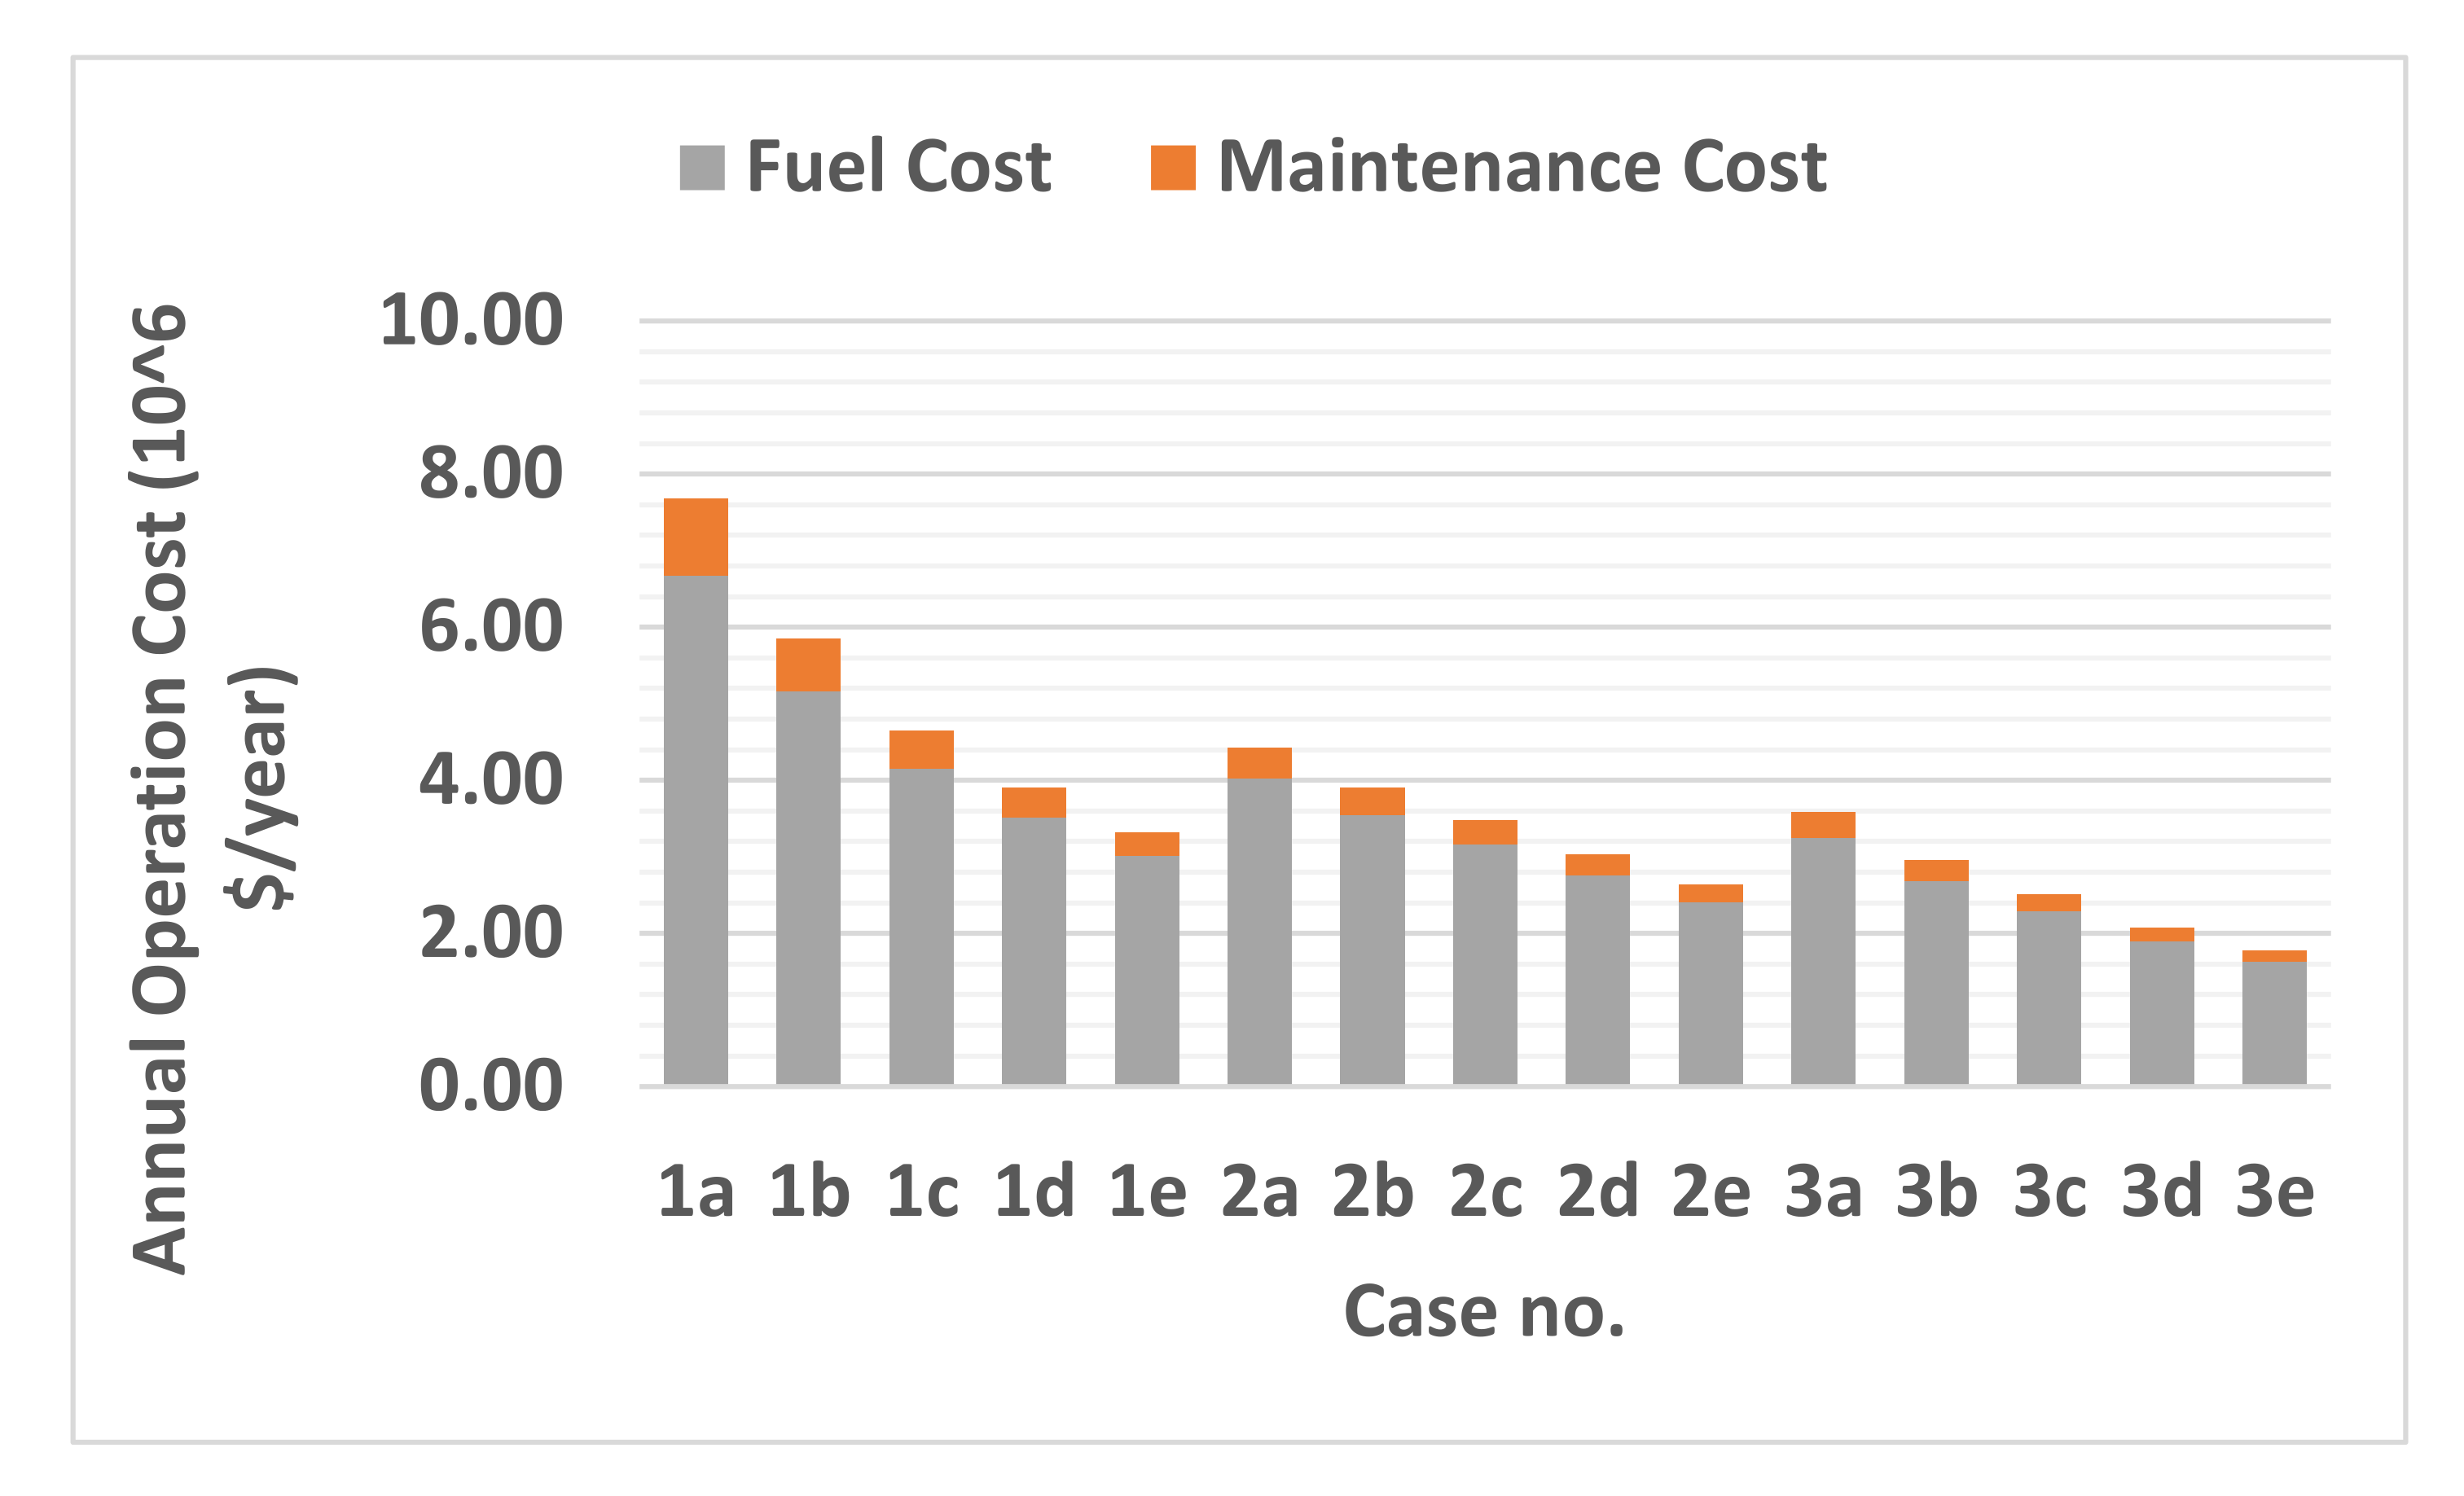
Economic analyses indicate increasing ammonia’s molar concentration in the mixed refrigerant causes lower capital and operational costs due to lower energy consumption. This resulted in specific production costs production costs to decrease by 59.8%, 40.1%, 51%, respectively, when MR-1, MR-2 and MR-3 were employed for the natural gas pre-cooling cycle. It is clear from the results that higher concentrations of ammonia resulted in lower mass flow rates of mixed refrigerants which consequently reduce the capital cost of heat exchangers due to smaller UA value and smaller size compressors. MR-1, among three major blends, had the highest cost savings on total capital cost of major equipment by $0.696 MM, $1.08 MM and $0.646 MM for the compressor, gas turbine and heat exchanger respectively. Overall, MR-1 benefited economically the most among the three major blends by saving $2.52 MM in capital cost and $3.67 MM in annual operation cost.
(3)
Environmental analyses revealed that reducing methane concentration in the mixed refrigerant by 10% and replacing it with ammonia can reduce the global warming potential index up to 24.3%. Plus, this reduces the annual leakage of mixed refrigerant through compressor seals up to 8.8 × 10³ equivalent tonne-CO2. In addition to the environmental benefits of adding ammonia to the mixed refrigerant, lower leakage rates also lead to lowering operational costs from purchasing additional make-up refrigerants. However, this comes with the disadvantage of ammonia being a toxic compound. Depending on the concentration of this ammonia in parts in million, it could have low to high toxicity level on humans and animals.

Author Contributions

R.S. was responsible for process design, analysis, methodology, writing, and editing the manuscript. R.M. supervised and directed the research. All authors have read and agreed to the published version of the manuscript.

Funding

This research received no external funding.

Institutional Review Board Statement

Not applicable.

Informed Consent Statement

Not applicable.

Data Availability Statement

Not applicable.

Acknowledgments

The work presented in this paper supported by mechanical engineering department of UTSA (University of Texas at San Antonio).

Conflicts of Interest

The authors declare no conflict of interest.

Nomenclature

Roman Letters
ASurface area (m2)
CCost ($)
COPCoefficient of performance
Elexergy loss, (kW)
E ˙ l rate of exergy loss, (kW/kg·NG)
efflow exergy, (kJ/kg·s)
FMass fraction (kg.MR/kg·NG)
GWPIGlobal warming potential index
henthalpy, (kJ/kg)
h 0 dead-state enthalpy, (kJ Kg)
L N G liquid natural gas
LRLeak rate
m ˙ mass flow rate, (kg/s)
U S D   M M million dollars
M R mixed refrigerant
M T A minimum temperature approach, (°C)
nPlant life in years
N G natural gas
PECPurchase equipment cost, ($)
rDiscount rate
sentropy, (kJ/kg·K)
s 0 dead-state entropy, (kJ/kg·K)
SPCSpecific production cost ($/kg)
Ttemperature, (°C)
toperation hours in a year
T 0 dead-state temperature, (K)
T j boundary temperature, (K)
U0Overall heat transfer coefficient (kW/m2·°C)
YCapacity (kg/year)
Greek Letters
ΔTLMLog Mean Temperature Difference (°C)
ε Exergy efficiency
η G T Gas turbine efficiency
Subscripts and Superscripts
AMUAnnual refrigerant make-up
cvcontrol volume
fFlow
FCFuel cost ($)
Gengeneration
HPhigh pressure
iinlet
cfCost factor
jboundary
lloss
LPlow pressure
MRMixed refrigerant
ooutlet
OMCoperation and maintenance cost
OpexOperation
refrigrefrigerant

Appendix A

Table A1. Temperature (°C) and Pressure (bar) data of proposed pre-cooling cycles.
Case no.T1P1T2P2T3P3T4P4T5P5T6P6
MR-11a181.01573.0420492.415201581.7240
1e181.01570.9420489.815201543.9533
MR-22a181.01571.7420490.414.92014.92014.9
2e181.01568.2420486.71520152015
MR-33a181.01578.1520566.91320132013
3e181.01557.93.4203.479.51320132013
Case no.T7P7T8P8T9P9T10P10T11P11T12P12
MR-11a2040−28.38303−2.251.1
1e2033−28.47303−2.741.1
MR-22a77.130203070.44602060−28.64504.9
2e77.630203073.341622062−26.12504.9
MR-33a77.230203070.44602060−28.64504.9
3e77.730203073.34622062−26.2504.9
Case no.T13P13T14P14T15P15T16P16T17P17T18P18
MR-11a
1e
MR-22a−3.471.1181.012014.9−25.5970.4552.192.571.1
2e−3.371.1181.012015−27.132.252.192.501.1
MR-33a−3.471.1181.012013−12.452.202.19−8.191.1
3e−3.381.1181.012013−12.72.202.19−8.251.1
Case no.T19P19
MR-11a
1e
MR-22a181.01
2e181.01
MR-33a181.01
3e181.01

References

  1. Boretti, A. Numerical Analysis of High-Pressure Direct Injection Dual-Fuel Diesel-Liquefied Natural Gas (LNG) Engines. Processes 2020, 8, 261. [Google Scholar] [CrossRef] [Green Version]
  2. Economides, M.J.; Wood, D. The state of natural gas. J. Nat. Gas Sci. Eng. 2009, 1, 1–13. [Google Scholar] [CrossRef]
  3. Cho, H.J.; Yeo, Y.-K.; Kim, J.-K. Optimal Design of Natural Gas Liquefaction Processes. Korean Chem. Eng. Res. 2013, 51, 25–34. [Google Scholar] [CrossRef] [Green Version]
  4. Castillo, L.; Dahouk, M.M.; Di Scipio, S.; Dorao, C. Conceptual analysis of the precooling stage for LNG processes. Energy Convers. Manag. 2013, 66, 41–47. [Google Scholar] [CrossRef]
  5. Precooling Strategies for Efficient Natural Gas Liquefaction. Available online: http://gasprocessingnews.com/features/201710/precooling-strategies-for-efficient-natural-gas-liquefaction.aspx (accessed on 18 July 2021).
  6. Wang, Z.; Han, F.; Ji, Y.; Li, W. Combined Analysis of Parameter Sensitivity and Exergy for Natural Gas Liquefaction in Cryogenic Fuel Production Process. Processes 2020, 8, 561. [Google Scholar] [CrossRef]
  7. Vikse, M.; Watson, H.A.J.; Gundersen, T.; Barton, P.I. Simulation of Dual Mixed Refrigerant Natural Gas Liquefaction Processes Using a Nonsmooth Framework. Processes 2018, 6, 193. [Google Scholar] [CrossRef] [Green Version]
  8. Castillo, L.; Dorao, C. On the conceptual design of pre-cooling stage of LNG plants using propane or an ethane/propane mixture. Energy Convers. Manag. 2013, 65, 140–146. [Google Scholar] [CrossRef]
  9. Castillo, L.; Dorao, C. Influence of the plot area in an economical analysis for selecting small scale LNG technologies for remote gas production. J. Nat. Gas Sci. Eng. 2010, 2, 302–309. [Google Scholar] [CrossRef]
  10. Mortazavi, A.; Somers, C.; Hwang, Y.; Radermacher, R.; Rodgers, P.; Al-Hashimi, S. Performance enhancement of propane pre-cooled mixed refrigerant LNG plant. Appl. Energy 2012, 93, 125–131. [Google Scholar] [CrossRef]
  11. Kalinowski, P.; Hwang, Y.; Radermacher, R.; Al Hashimi, S.; Rodgers, P. Application of waste heat powered absorption re-frigeration system to the LNG recovery process. Int. J. Refrig. 2009, 32, 687–694. [Google Scholar] [CrossRef]
  12. Sanavandi, H.; Ziabasharhagh, M. Design and comprehensive optimization of C3MR liquefaction natural gas cycle by con-sidering operational constraints. J. Nat. Gas. Sci. Eng. 2016, 29, 176–187. [Google Scholar] [CrossRef]
  13. Katebah, M.A.; Hussein, M.M.; Shazed, A.; Bouabidi, Z.; Al-Musleh, E.I. Rigorous simulation, energy and environmental analysis of an actual baseload LNG supply chain. Comput. Chem. Eng. 2020, 141, 106993. [Google Scholar] [CrossRef]
  14. Lee, I.; Moon, I. Total Cost Optimization of a Single Mixed Refrigerant Process Based on Equipment Cost and Life Expectancy. Ind. Eng. Chem. 2016, 55, 10336–10343. [Google Scholar] [CrossRef]
  15. Primabudi, E.; Morosuk, T.; Tsatsaronis, G. Multi-objective optimization of propane pre-cooled mixed refrigerant (C3MR) LNG process. Energy 2019, 185, 492–504. [Google Scholar] [CrossRef]
  16. Zhang, J.; Meerman, H.; Benders, R.; Faaij, A. Technical and economic optimization of expander-based small-scale natural gas liquefaction processes with absorption precooling cycle. Energy 2020, 191, 116592. [Google Scholar] [CrossRef]
  17. Yilmaz, B.; Mancuhan, E.; Erdonmez, N. A Parametric Study on a Subcritical CO2/NH3 Cascade Refrigeration System for Low Temperature Applications. J. Energy Resour. Technol. 2018, 140, 092004. [Google Scholar] [CrossRef]
  18. Zhu, J.L.; Li, Y.X.; Wang, W.C. Offshore adaptability of the dual nitrogen expander process with CO2 pre-cooling. Nat. Gas. Ind. 2012, 32, 89–95. [Google Scholar]
  19. Ip, A.Y.K. Ammonia production, excretion, toxicity, and defense in fish: A review. Front. Physiol. 2010, 1, 134. [Google Scholar] [CrossRef] [PubMed] [Green Version]
  20. Department of Health and Human Services. Toxicological Profile for Ammonia; U.S. Department of Health and Human Services, Public Health Service, Agency for Toxic Substances and Disease Registry: Atlanta, GA, USA, 1990.
  21. Understanding Global Warming Potentials/US EPA, 2020, US EPA. Available online: https://www.epa.gov (accessed on 17 October 2020).
  22. Kamath, R.S.; Biegler, L.T.; Grossmann, I.E. Modeling multistream heat exchangers with and without phase changes for sim-ultaneous optimization and heat integration. AIChE J. 2011, 58, 190–204. [Google Scholar] [CrossRef]
  23. Alizadeh, S.M.; Ghazanfari, A.; Aliehyaei, M.; Ahmadi, A.; Jamali, D.H.; Nedaei, N.; Davarpanah, A. Investigation the Integration of Heliostat Solar Receiver to Gas and Combined Cycles by Energy, Exergy, and Economic Point of Views. Appl. Sci. 2020, 10, 5307. [Google Scholar] [CrossRef]
  24. Ehyaei, M.; Baloochzadeh, S.; Ahmadi, A.; Abanades, S. Energy, exergy, economic, exergoenvironmental, and environmental analyses of a multigeneration system to produce electricity, cooling, potable water, hydrogen and sodium-hypochlorite. Desalination 2021, 501, 114902. [Google Scholar] [CrossRef]
  25. Mokhatab, S.; Poe, W.; Mak, J. Handbook of Natural Gas. Transmission and Processing; Gulf Professional Publishing: Waltham, MA, USA, 2012. [Google Scholar]
  26. Watson, H.A.J.; Khan, K.; Barton, P.I. Multistream heat exchanger modeling and design. AIChE J. 2015, 61, 3390–3403. [Google Scholar] [CrossRef]
  27. Mokhatab, S. An optimum lineup for sour gas processing. Chapter 3 Basic Concepts of Natural Gas Processing. Petrol. Technol. Quart. 2010, 135. [Google Scholar]
  28. Ancona, M.; Bianchi, M.; Branchini, L.; De Pascale, A.; Melino, F. Performance Increase of a Small-scale Liquefied Natural Gas Production Process by Means of Turbo-expander. Energy Procedia 2017, 105, 4859–4865. [Google Scholar] [CrossRef]
  29. Brodyanskii, V.M.; Grezin, A.K.; Yagodin, V.M.; Nikol’Skii, V.A.; Tashchina, A.G. Efficient throttling cryogenic refrigerators which operate on mixtures. Chem. Pet. Eng. 1971, 7, 1057–1061. [Google Scholar] [CrossRef]
  30. Ghorbani, B.; Shirmohammadi, R.; Mehrpooya, M. A novel energy efficient LNG/NGL recovery process using absorption and mixed refrigerant refrigeration cycles—Economic and exergy analyses. Appl. Therm. Eng. 2018, 132, 283–295. [Google Scholar] [CrossRef]
  31. Jayakody, H.; Al-Dadah, R.; Mahmoud, S. Cryogenic Energy for Indirect Freeze Desalination—Numerical and Experimental Investigation. Processes 2019, 8, 19. [Google Scholar] [CrossRef] [Green Version]
  32. Mehrpooya, M.; Sharifzadeh, M.M.M.; Zonouz, M.J.; Rosen, M.A. Cost and economic potential analysis of a cascading power cycle with liquefied natural gas regasification. Energy Convers. Manag. 2018, 156, 68–83. [Google Scholar] [CrossRef]
  33. Wang, M.; Khalilpour, R.; Abbas, A. Thermodynamic and economic optimization of LNG mixed refrigerant processes. Energy Convers. Manag. 2014, 88, 947–961. [Google Scholar] [CrossRef]
  34. Remeljej, C.; Hoadley, A. An exergy analysis of small-scale liquefied natural gas (LNG) liquefaction processes. Energy 2006, 31, 2005–2019. [Google Scholar] [CrossRef]
  35. He, T.; Ju, Y. Design and Optimization of a Novel Mixed Refrigerant Cycle Integrated with NGL Recovery Process for Small-Scale LNG Plant. Ind. Eng. Chem. Res. 2014, 53, 5545–5553. [Google Scholar] [CrossRef]
  36. Khan, N.B.N.; Barifcani, A.; Tade, M.; Pareek, V. A case study: Application of energy and exergy analysis for enhancing the process efficiency of a three stage propane pre-cooling cycle of the cascade LNG process. J. Nat. Gas. Sci. Eng. 2016, 29, 125–133. [Google Scholar] [CrossRef] [Green Version]
  37. Lee, G.C. Optimal Design and Analysis of Refrigeration Systems for Low Temperature Processes. Ph.D. Thesis, School of Chemical Engineering and Analytical Science, The University of Manchester, Manchester, UK, 2001. [Google Scholar]
  38. Demirel, Y. Using the second law of thermodynamics. In Nonequilibrium Thermodynamics; Elsevier: Amsterdam, The Netherlands, 2002. [Google Scholar]
  39. Venkatarathnam, G.; Murthy, S.S. Effect of mixture composition on the formation of pinch points in condensers and evaporators for zeotropic refrigerant mixtures. Int. J. Refrig. 1999, 22, 205–215. [Google Scholar] [CrossRef]
  40. Raj, R.; Suman, R.; Ghandehariun, S.; Kumar, A.; Tiwari, M.K. A techno-economic assessment of the liquefied natural gas (LNG) production facilities in Western Canada. Sustain. Energy Technol. Assessments 2016, 18, 140–152. [Google Scholar] [CrossRef]
  41. Turton, R.; Shaeiwitz, J.; Bhattacharyya, D.; Whithing, W. Analysis, Synthesis and Design of Chemical Processes; Pearson Education Inc.: Upper Saddle River, NJ, USA, 2018. [Google Scholar]
  42. He, T.; Liu, Z.; Ju, Y.; Parvez, A. A comprehensive optimization and comparison of modified single mixed refrigerant and parallel nitrogen expansion liquefaction process for small-scale mobile LNG plant. Energy 2019, 167, 1–12. [Google Scholar] [CrossRef]
  43. Bhattacharyya, S.C. Energy Economics; Springer: London, UK, 2011. [Google Scholar]
  44. International Gas Union. Natural Gas Conversion Pocketbook. 2012. Available online: http://members.igu.org/old/IGU%20Events/wgc/wgc-2012/wgc-2012-proceedings/publications/igu-publications (accessed on 19 April 2021).
  45. Linde. Refrigerants Environmental Data. Ozone Depletion and Global Warming Potential. Available online: https://www.linde-gas.com/ (accessed on 19 April 2021).
  46. Qin, Y.; Li, N.; Zhang, H.; Liu, B. Energy and exergy performance evaluation of a three-stage auto-cascade refrigeration system using low-GWP alternative refrigerants. Int. J. Refrig. 2021, 126, 66–75. [Google Scholar] [CrossRef]
  47. Climate and Clean Air Coalition (CCAC); Technical Guidance Document Number 4: Reciprocating Compressors Rod Seal/Packing Vents; CCAC: Paris, France, 2017.
  48. Society, A.P. Energy units. Am. Phys. Soc. 2016. Available online: https://www.aps.org/policy/reports/popa-reports/energy/units.cfm (accessed on 19 April 2021).
  49. REFPROP, version 10.0; Reference Fluid Thermodynamic and Transport Properties; NIST: Gaithersburg, MD, USA, 2018.
  50. Aspen HYSYS v12, version 12; Aspen Technology Inc.: Bedford, MA, USA, 2020.
  51. Helgestad, D.E. Modelling and Optimization of the C3MR Process for Liquefaction of Natural Gas. Specialization Project, TKP 4550 Process Systems Engineering; Norges Teknisk Naturviten Skapelige University (NTNU): Stavanger, Norway, 2009. [Google Scholar]
  52. Wang, M.; Khalilpour, R.; Abbas, A. Operation optimization of propane precooled mixed refrigerant processes. J. Nat. Gas. Sci. Eng. 2013, 15, 93–105. [Google Scholar] [CrossRef]
  53. Cao, W.-S.; Lu, X.-S.; Lin, W.; Gu, A.-Z. Parameter comparison of two small-scale natural gas liquefaction processes in skid-mounted packages. Appl. Therm. Eng. 2006, 26, 898–904. [Google Scholar] [CrossRef]
  54. Khan, M.S.; Lee, M. Design optimization of single mixed refrigerant natural gas liquefaction process using the particle swarm paradigm with nonlinear constraints. Energy 2013, 49, 146–155. [Google Scholar] [CrossRef]
  55. Qyyum, M.A.; Ahmed, F.; Nawaz, A.; He, T.; Lee, M. Teaching-learning self-study approach for optimal retrofitting of dual mixed refrigerant LNG process: Energy and exergy perspective. Appl. Energy 2021, 298, 117187. [Google Scholar] [CrossRef]
  56. Lee, S.; Lim, D.; Park, K. Optimization and Economic Analysis for Small-Scale Movable LNG Liquefaction Process with Leakage Considerations. Appl. Sci. 2020, 10, 5391. [Google Scholar] [CrossRef]
Figure 1. Natural gas liquefaction’s pre-cooling cycle using ammonia-based mixed refrigerants with compounds; (a) NH3/C1/C2/C3; (b) NH3/C1/C2/C3/C4–C5.
Processes 09 01298 g001
Figure 2. Specific Energy Consumption of each case study for each group of mixed refrigerant MR-1, MR-2 and MR-3.
Processes 09 01298 g002
Figure 3. COP of each case study for each group of mixed refrigerant MR-1, MR-2 and MR-3.
Processes 09 01298 g003
Figure 4. Exergy loss percentage of individual major equipment for the mixed refrigerants MR-1, MR-2 and MR-3 for; (a) base case with 20% NH3; (b) 30% NH3.
Processes 09 01298 g004aProcesses 09 01298 g004b
Figure 5. Comparison of heat exchanger UA value for each group of mixed refrigerant, MR-1, MR-2 and MR-3.
Processes 09 01298 g005
Figure 6. Comparison of NG and MR composite curves. (a) NG and MR case study-1e; (b) Temperature approach of case study-1e; (c) NG and MR case study-2e; (d) Temperature approach of case study-2e ; (e) NG and MR case study-3e; (f) Temperature approach of case study-3e.
Processes 09 01298 g006
Figure 7. Capital cost of major equipment of natural gas pre-cooling cycle for one train. (a) MR-1, MR-2 and MR-3 base case with 20% ammonia; (b) MR-1, MR-2 and MR-3 with 30% ammonia.
Processes 09 01298 g007
Figure 8. Specific production cost for each case study.
Processes 09 01298 g008
Figure 9. Annual operating cost break down for each case study.
Processes 09 01298 g009
Figure 10. GWPI and annual leak rates of each case study in MR-1, MR-2 and MR-3.
Processes 09 01298 g010
Figure 11. Annual cost of make-up refrigerants due to leakage.
Processes 09 01298 g011
Table 1. Global warming potential index of pure refrigerants [21].
RefrigerantGWPI
Methane28
Ethane6
Propane4
Butane5
Pentane11
Ammonia0
Table 2. Feed natural gas molar composition and specifications.
NG Molar Composition, %Value
Methane (C1)90
Ethane (C2)8
Propane (C3)1
Butane (C4)0.3
Pentane (C5)0.2
Nitrogen (N2)0.5
NG Feed Pressure (bar)50
NG Discharge Pressure (bar)49.5
NG Feed Temperature (°C)20
Table 3. Molar compositions of mixed refrigerant for each case study.
Case No.Ammonia
NH3
Methane
(C1)
Ethane
(C2)
Propane
(C3)
Butane
(C4)
Pentane
(C5)
MR-11a
(Base Case)
2030252500
1b22.527.522.527.500
1c2525203000
1d27.522.517.532.500
1e3020153500
MR-22a
(Base Case)
2030252050
2b22.527.522.5216.50
2c2525202280
2d27.522.517.5239.50
2e302015241130
MR-33a
(Base Case)
2030251087
3b22.527.522.51197.5
3c25252012108
3d27.522.517.513118.5
3e30201514129
Table 4. Energy and exergy relations used for major equipment in the proposed pre-cooling cycle.
ComponentEnergyExergy
Compressor W ˙ c o m p = m ˙ ( h i h o ) E ˙ l = ( m ˙ i   .   e f , i ) ( m ˙ o   .   e f , o ) W ˙ c o m p
Heat Exchanger k ( m ˙ c , k   .   Δ h c , k ) = k ( m ˙ H , k   .   Δ h H , k ) E ˙ l = i ( m ˙ i   .   e f , i ) o ( m ˙ o   .   e f , o )
JT Valve   h i = h o E ˙ l = ( m ˙ i   .   e f , i ) ( m ˙ o   .   e f , o )
Air Cooler k ( m ˙ k   .   Δ h k ) A i r = k ( m ˙ k   .   Δ h k ) M R E ˙ l = i ( m ˙ i   .   e f , i ) o ( m ˙ o   .   e f , o )
Table 5. Equipment purchase cost constants [41].
Equipment TypeEquipment DescriptionK1K2K3
CompressorCentrifugal2.28971.3604−0.1027
TurbineAxial gas turbine2.70511.4398−0.1776
Heat exchangerFlat plate4.6656−0.15570.1547
Heat exchangerAir cooler4.03360.23410.0497
Table 6. Thermodynamic cycle performance comparison of each case study.
Case No.Mass Fraction
kg·MR/kg·NG
Specific Energy Consumption
(kJ/kg)
Coefficient of Performance
(COP)
MR-11a
MR-1 Base Case
0.763232.60.63
1b0.602180.10.80
1c0.493144.70.97
1d0.425122.41.14
1e0.371104.91.30
MR-22a
MR-2 Base Case
0.401140.31.06
2b0.371123.71.17
2c0.35110.31.28
2d0.32496.11.41
2e0.30183.81.56
MR-33a
MR-3 Base Case
0.381113.01.09
3b0.32993.61.22
3c0.29479.61.38
3d0.25966.21.57
3e0.23456.61.72
Table 7. Exergy loss of individual equipment of proposed NG pre-cooling cycle.
Case No.Compressor (kJ/kg)Heat Exchanger (kJ/kg)JT Valve (kJ/kg)Air Cooler (kJ/kg)
MR-1
1a29.911.9112.028.9
1b23.212.476.623.2
1c18.612.453.619.6
1d15.811.938.017.7
1e13.511.426.616.3
MR-22a18.09.640.723.5
2b15.98.534.620.8
2c14.27.630.118.2
2d12.47.025.615.6
2e10.86.621.713.4
MR-33a14.66.338.716.3
3b12.05.829.614.7
3c10.25.123.413.3
3d8.54.718.111.4
3e7.34.514.310.5
Table 8. Results obtained from Literature.
Helgestad (2009)Wang et al. (2013)Cao et al. (2006)Khan and Lee (2013)Qyyum et al. (2020)MR-1
Case 1a–1e
MR-2
Case 2a–2e
MR-3
Case 3a–3e
ProcessC3MRC3MRSMRSMRDMRSMRSMRSMR
NG Specs
Inlet pressure (bar)4050505055505050
Inlet Temeprature (°C)2525323225181818
Methane (mol %)89.790.9782.091.487.2909090
Pre-cooling Temperature (°C)−35.8−20.4−25.5−28.5−27.1−26.2
Overall Cycle
Specific Energy Consimption(SEC), kJ/kg110610461724.21370.01285.2
Precooling SEC (KJ/kg)104–23284–14057–113
Table 9. Cost of individual major equipment of proposed pre-cooling cycle.
Case No.Compressors ($ MM)Gas Turbines ($ MM)Heat Exchanger ($ MM)Air Cooler ($ MM)Total ($ MM)
MR-11a0.9101.5291.0160.1893.645
1b0.5731.0360.7250.1472.481
1c0.3850.7390.5490.1191.792
1d0.2840.5710.4460.1021.403
1e0.2140.4480.3700.0891.121
MR-22a0.3040.5890.4390.1281.461
2b0.2500.5020.3990.1191.269
2c0.2120.4380.3720.1121.133
2d0.1720.3680.3370.1030.981
2e0.1400.3100.3070.0960.854
MR-33a0.2360.4850.4030.1221.246
3b0.1710.3670.3340.1050.977
3c0.1310.2910.2900.0940.806
3d0.0960.2230.2500.0830.652
3e0.0740.1790.2220.0750.550
Table 10. Capital, operation and specific production cost of each case study.
MRCase No.Camortized Capex
($/kg)
Camortized Opex
($/kg)
Specific Production Cost ($/kg)
MR-11a0.005260.01560.0231
1b0.003580.01210.0171
1c0.002590.00960.0132
1d0.002020.00810.0109
1e0.001620.00690.0092
MR-22a0.002110.00930.0122
2b0.001830.00820.0107
2c0.001640.00730.0096
2d0.001420.00630.0083
2e0.001230.00550.0073
MR-33a0.001800.00750.0100
3b0.001410.00620.0082
3c0.001160.00530.0069
3d0.000940.00440.0057
3e0.000790.00370.0049
Table 11. GWPI, mixed refrigerant annual leak rates and annual costs of each case study.
Case No.GWPILeak Rate (kg·MR/h)Annual Leak Rate (Tonne/Year)Annual Leak, Equivalent to Tonne-CO2Annual Cost of MR Leak
($ MM)
MR−11a8.351911,31813,9600.835
1b7.831511,08010,3170.667
1c7.3112393178930.553
1d6.8110681263370.483
1e6.329387851340.427
MR−22a8.3510081273320.380
2b7.849376763670.342
2c7.348871056280.314
2d6.878165948740.283
2e6.417583442280.256
MR−33a9.249572177100.249
3b8.818264463490.208
3c8.407456754100.181
3d8.016551245420.154
3e7.6359131839100.135
Publisher’s Note: MDPI stays neutral with regard to jurisdictional claims in published maps and institutional affiliations.

