Article

Safety Considerations by Synergy of HAZOP/DMRA with Safety Color Maps—Applications on: A Crude-Oil Processing Industry/a Gas Transportation System

by
Panagiotis K. Marhavilas
*,
Michail Filippidis
,
Georgios K. Koulinas
and
Dimitrios E. Koulouriotis
Department of Production and Management Engineering, Democritus-University of Thrace, Vasil. Sofia’s 1 St., 67132 Xanthi, Greece
*
Author to whom correspondence should be addressed.
Processes 2021, 9(8), 1299; https://doi.org/10.3390/pr9081299
Submission received: 24 June 2021 / Revised: 23 July 2021 / Accepted: 25 July 2021 / Published: 27 July 2021

Abstract

:
A collaborative framework by the synergy of Hazard and Operability (HAZOP) process and the Decision-Matrix Risk Assessment (DMRA) in association with safety-color mapping (SCM) is presented, in order to identify critical points and prioritize risks, and also to visualize the occupational safety and health (OSH) situation, at the workplaces (i) of a sour crude-oil processing industry (SCOPI), and (ii) of a measurement and regulatory station (MRS) in a gas transportation system (GTS), situated in Greece. Firstly, the conventional HAZOP analysis is executed in order to identify the potential fault causes of abnormal conditions (deviations) in the plants. The application of the DMRA-modus is valuable to rank the identified risks (hierarchy of risks). In view of the results, both of the HAZOP pattern (for identifying the hazards) and also the DMRA one (for assessing and ranking the risks), SCMs have been derived for the specific workplaces of the SCOPI and the MRS/GTS station, which could be a precious means for safety managers to appraise the urgency of investing limited budgets in measures preventing particular types of deviations, and also protecting the employees.

1. Introduction

Without doubt, the variety of risk analysis and assessment (RAA) techniques in the field of occupational safety and health (OSH) is such that there is an abundance of well-organized methods for the majority of cases, and numerous studies build up hybrid-models amalgamating individual RAA processes. Nevertheless, each RAA procedure has precise limitations or constraints in its performance to various incidents, and therefore, a discreet technique cannot achieve the optimal risk-assessment outcome at the workplaces. On the other hand, cooperative methodologies, incorporating qualitative and/or quantitative, hybrid, probabilistic, stochastic (STO) and/or deterministic (DET), multicriteria decision-making (MCDM) and/or Fuzzy-OSH, automated RAA techniques, etc., for instance the ones which combine QRA, HAZOP, XPA-HAZOP, DMRA, AHP, Fuzzy-AHP, FEAHP, TSP, PRAT, FTA, BIM, QFD, FMECA, PHSA, SCEA, FMEDA, LOPA and so forth, would be more effectual on the OSH field [1,2,3,4,5,6,7,8,9,10,11,12,13,14,15,16,17,18,19,20,21,22,23,24,25]. In the last decade, many articles have continued incorporating DET methods (such as the well-known FTA) in OSH-RAA, such as: (i) the work of Mutlu et al. (2019) [26], which integrates FTA with Failure-Mode and Effect-Analysis (FMEA) and BIFPET, (ii) the articles of Babaei et al. (2018) [27] and Yasli and Bolat (2018) [28], which incorporate FTA in fuzzy OSH-RAA methods, (iii) the paper of Gul and Ak (2018) [29], which uses the cooperation of MCDM with FTA, (iv) the work of Fuentes-Bargues et al. (2017) [30], which combines HAZOP with FTA in RAA of fuel storage-terminals, and (v) the article of Marhavilas et al. (2020) [31,32], which mingles two different configurations of the MCDM method, initially the Analytical Hierarchy Process (the typical-AHP), and afterwards the Fuzzy-Extended AHP (the FEAHP), along with the Proportional Risk Assessment Technique (PRAT) and the analysis of Time-Series Processes (TSP), and lastly with the FTA, in sustainable constructions engineering projects. The reason for incorporating the above curt list of references, concerning these RAA techniques, is to show that all these techniques could be significant separate elements in RAA hybridization processes. In other words, this list of sources constitutes a simple illustration of the techniques that could be combined in order for any safety manager to develop more powerful RAA methods.

1.1. The Concept of Safety Colors (SC)

The term “safety-colors” is utilized to define the standard usage of colors for safety aims in a facility. Thus, several installations have found that the appropriate utilization of color could dramatically improve the visibility of signs, and its handling is frequently instructed by industrial regulations. On the other hand, safety colors are not widely used in the field of occupational safety and health, although it is obvious that their exploitation can increase the visibility of the OSH-status in the workplace of a company, so that their usefulness becomes vital, day after day, for the businesses (especially for the process industries).

1.2. The Concept of Hazard and Operability Analysis (HAZOP)

The concept of HAZOP was revealed with the purpose of identifying potential hazards which are present in facilities and equipment that operate using (or producing) greatly dangerous materials [33,34,35,36,37,38]. The major concern was to abolish any hazards that could potentially lead to serious accidents, such as explosions and fires, toxic releases, etc., according to Swann and Preston (1995) [39]. According to the scientific literature, HAZOP methodology is considered as a powerful and effectual means for determining hazards, and has been widely utilized (since the early years of the 1960s), among others, for preventing accidents and validating appropriate engineering practices, for investigating accidents and upgrading the safety levels, and on the other hand, for enhancing the reliability of any system through the decrease of operational faults, such as technical projects, facilities and equipment of process industries, OSH workplaces, etc, according to Alaei et al. (2014), Mentzer et al. (2014) and O Herrera et al. (2018) [40,41,42]. Nevertheless, over the years, HAZOP’s utilization has disseminated to many other kinds of facilities due to its capability not only to determine hazards, but also to determine functional deviations from the preferred state. Consequently, it constitutes a dominant technique to improve the safety level of various types of systems [30,40,41,42,43]. However, the ordinary form of HAZOP presents various drawbacks, and consequently the evolution of this process is underway, in such a manner that, day after day, additional other techniques are being incorporated in the HAZOP methodology in order to efficiently contribute to its power upgrading [43,44].

1.3. The Concept of Decision-Matrix Risk Assessment (DMRA)

The decision-matrix risk assessment is a disciplined way for appraising risks and consists of classifying and measuring risks on a judgment basis for probability and also for consequence. It relies on a two-dimensional table, the first dimension for showing the severity escalation, and the next for the hazard probability score, while their coupling determines the risk level [45,46].

1.4. Objectives

This work aims to combine multiple well-established safety RAA techniques in order to generate a distinctive sturdy method (the HAZOP/DMRA/SCM one) to pinpoint the riskiest areas of a workplace and to identify its possible consequences and causes.
To achieve the article’s main objective, the accession of the following necessary issues is truly essential, i.e., the embodiment of (i) a succinct presentation of the conventional HAZOP “mechanism”, and (ii) an implementation of the united HAZOP-DMRA formula. Firstly, the cooperative HAZOP-DMRA scheme is performed for two case studies in a sour crude-oil processing industry, and also in a measurement and regulatory station of a gas transportation system, which are extremely noteworthy as far as OSH is concerned, since they combine a lot of hazards, for instance flammable gases and/or liquids and/or toxic gases [47]. Finally, one last significant topic is realized, i.e., yielding SCMs concerning the workplaces of the above referred SCOPI and MRS/GTS. This action will map the facilities’ OSH and reveal their safety level, on the one hand, and on the other, could constitute a versatile tool for the safety officers to ameliorate OSH.

1.5. Structure of the Article

The article is structured as follows: Section 1 is the introduction, Section 2 presents the materials and methods, which involves elements of the theoretical background of HAZOP’s, SCM’s and DMRA’s issues, Section 3 outlines a concise technical presentation of a specific SCOPI and of a MRS/GTS station and Section 4 illustrates the implementation of the methodology, that comprises, on the one hand, a HAZOP-DMRA hybridization (on a SCOPI and also on a MRS/GTS as two case studies), and on the other hand, a HAZOP-DMRA-SCM amalgamation. Section 5 presents the results of the two cases, Section 6 presents a discussion that concerns key topics and future research directions, and in Section 7, the conclusions are provided.

2. Materials and Methods
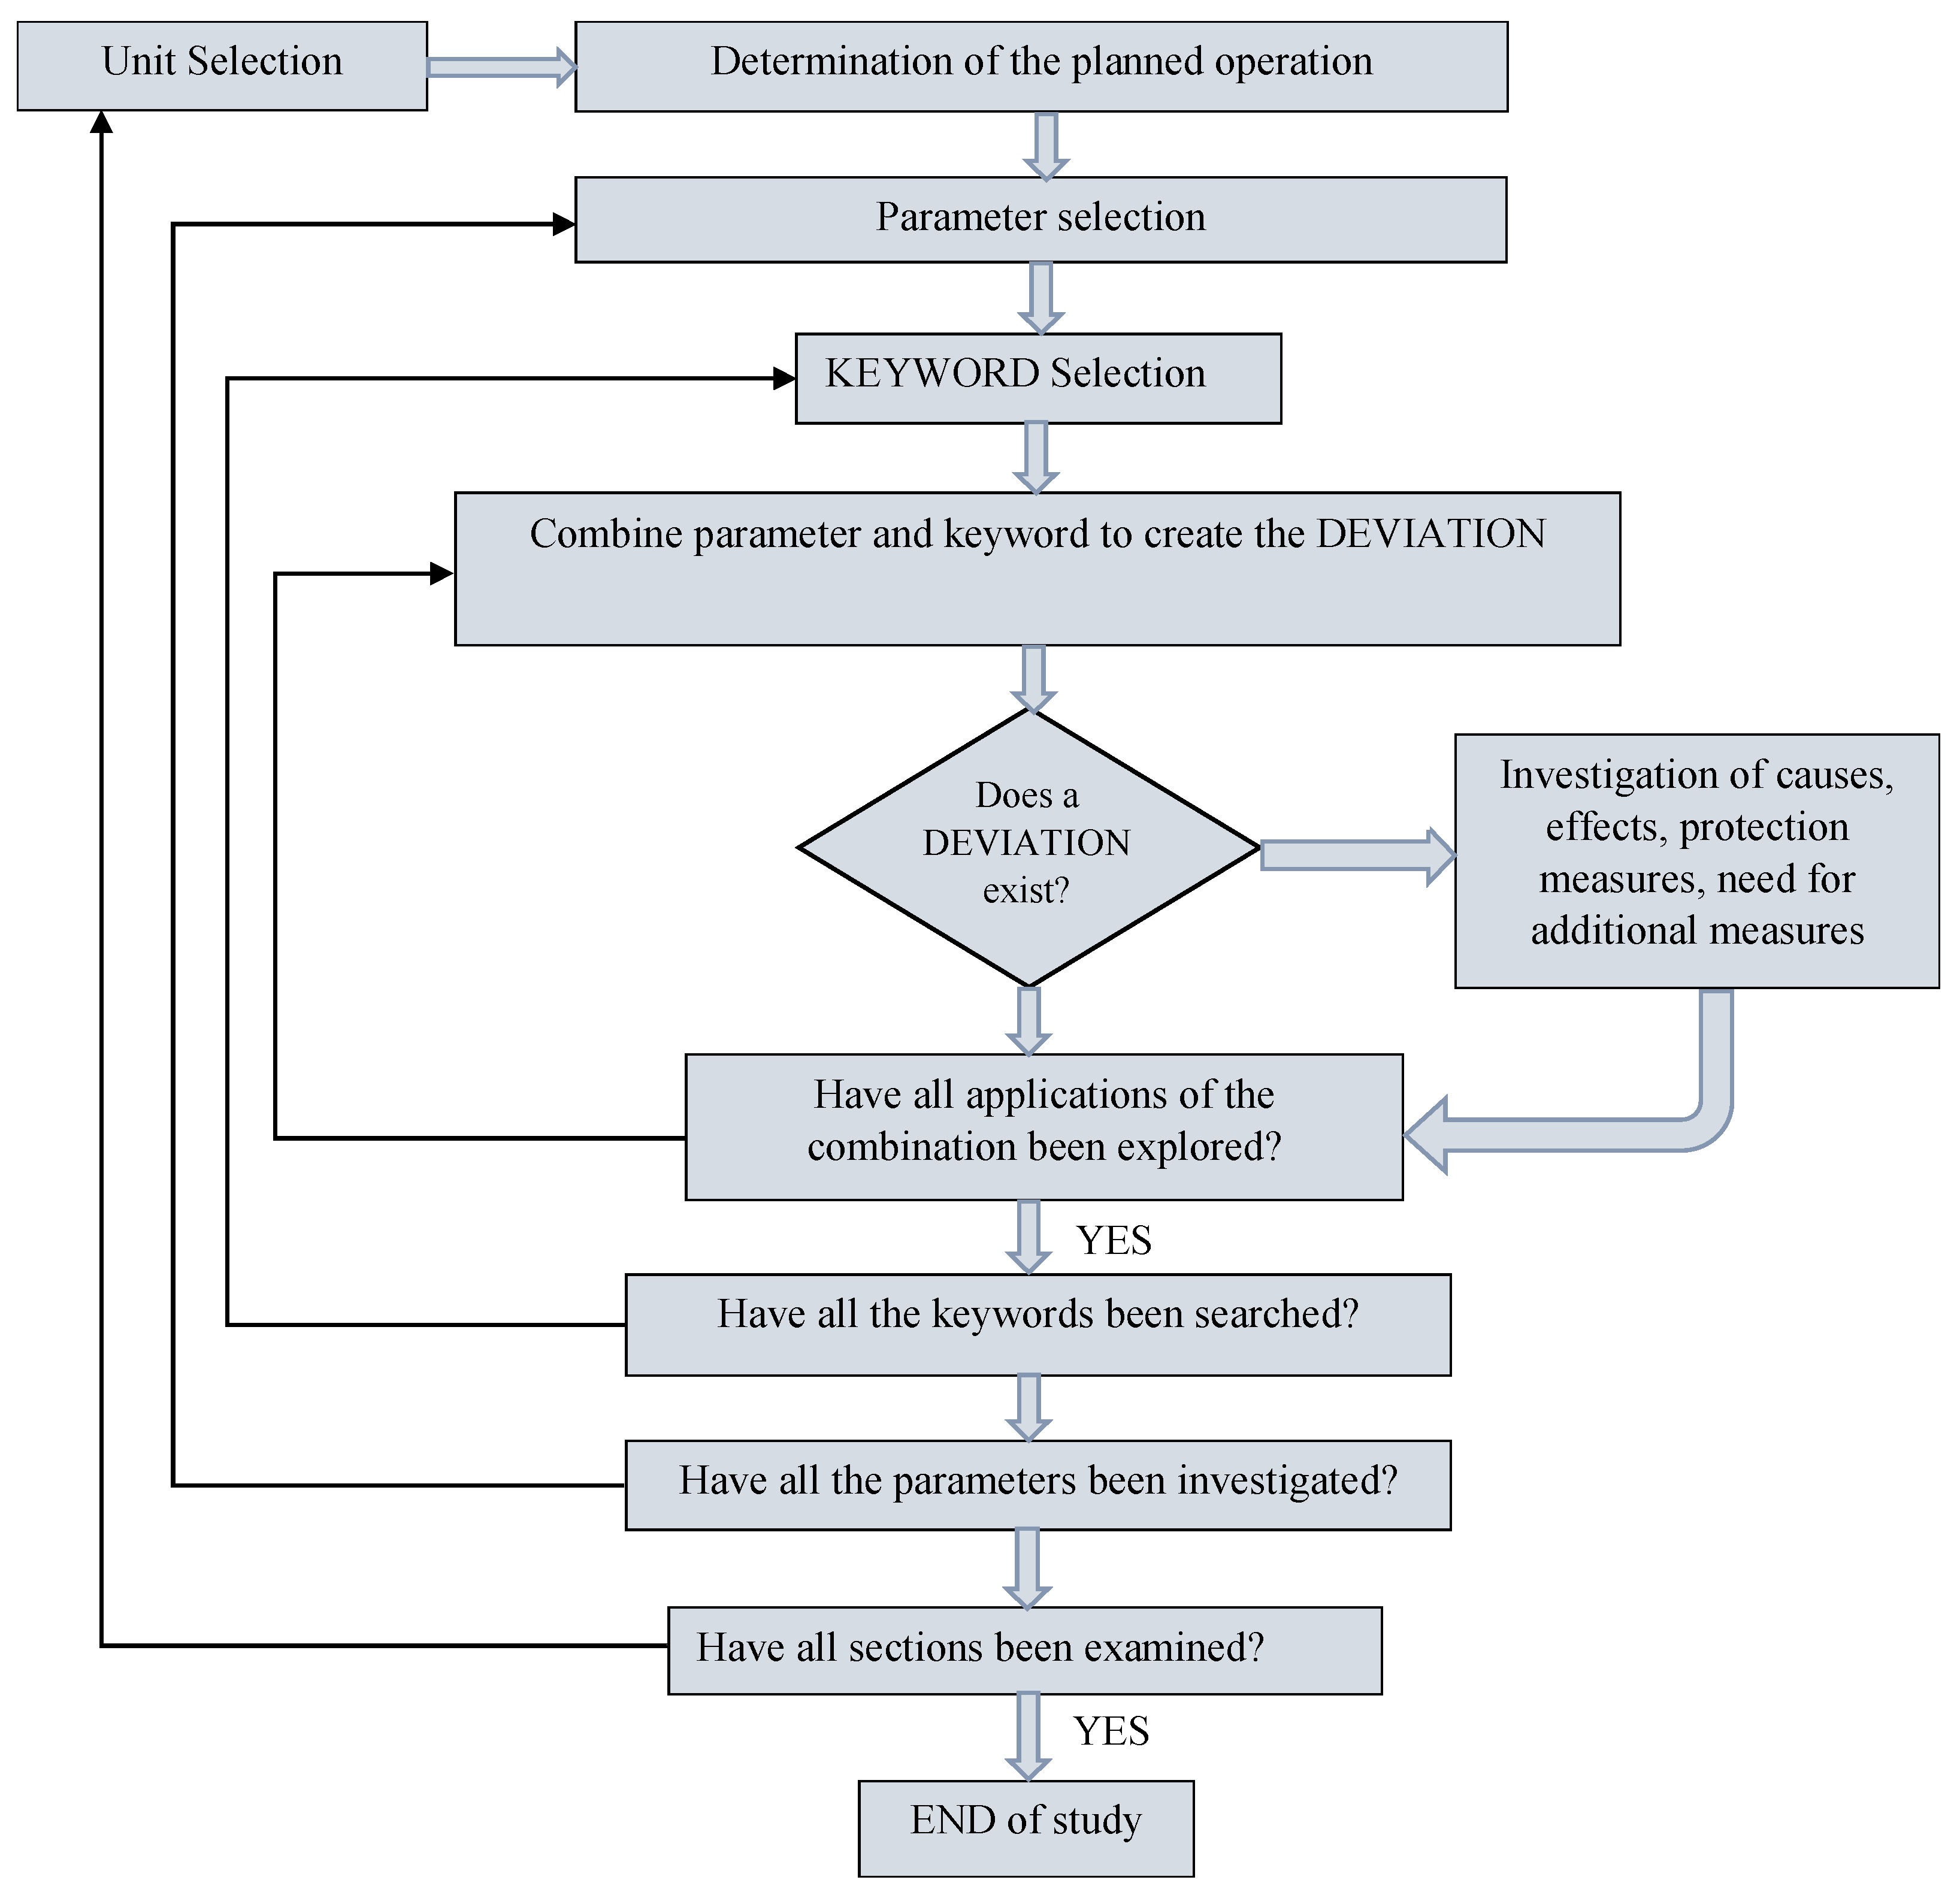
2.1. HAZOP Process

The process of HAZOP requires the rigorous efforts of a team of experts in a management system. The scope of the definition process takes into account the following factors [33,34,35,36,37,38,48]: (i) “why”, “when”, “how” and “where” HAZOP has to be conducted, and (ii) “who” has to be involved. HAZOP cannot be carried out at the conceptual phase of a project, due to a lack of any detailed Piping and Instrumentation Diagrams (PIDs) at that moment. The PIDs become available during the design phase and are accurate to a high degree. There are two objectives in HAZOP studies executed in existing plants before a major repair: (i) to identify new or unidentified hazards and (ii) to support maintenance preparation, especially when there is active equipment in the area adjacent to the maintenance workplace.
There are two issues that a HAZOP team leader must take into consideration when defining the specific nodes (that means the installation’s separate units) for the analysis: (a) the equipment in the node has to fulfill the same design purpose, and (b) the sections must be as equal in size as possible. The focus of the selected nodes is the effects of deviations inside the lines, vessels, etc. The execution stage of HAZOP, regarding a part of the system with particular operation and interconnectivity, goes along with the organization into nodes (i.e., operational sections). The selection of nodes involves the identification of a group of lines and equipment that can be reviewed together, because they share the same design intent. The data that are essential for this process are, according to Kletz (1999) [35], the subsequent: (a) process description, (b) Process Flow Diagrams (PFDs) and (c) Piping and Instrumentation Diagrams (PIDs). The technique relies on the usage of precise guidewords, such as the following: “more”, “no”, or “less”, in association with a variety of parameters, for instance “flow”, “temperature” and “pressure”, in order to define deviations from the ordinary operation. This process is applied on every node. Therefore, the HAZOP experts, after the examination of all potential deviations of a node, proceed to the investigation of realistic causes and probable consequences. For each “cause/consequence” grouping, which composes a scenario, existing safeguards must be determined that might detect/prevent/control or moderate the harmful situation [35,38,49,50].
Figure 1 outlines the HAZOP flow-chart, which we used in this article to HAZOP analyze a SCOPI and an MRS/GTS station.

2.2. Safety Color Maps

The Occupational Safety/Health Administration (OSHA) proposes a number of recommendations regarding colors that could be utilized to ameliorate safety. The main set of safety colors distributed by OSHA covers the wide classes of hazards that happen in facilities, and how individuals should be warned about them [51]. In this article, we use the following four key-types of warning language and the corresponding colors for generating a SCM in the SCOPI and MRS/GTS described in the succeeding sections:
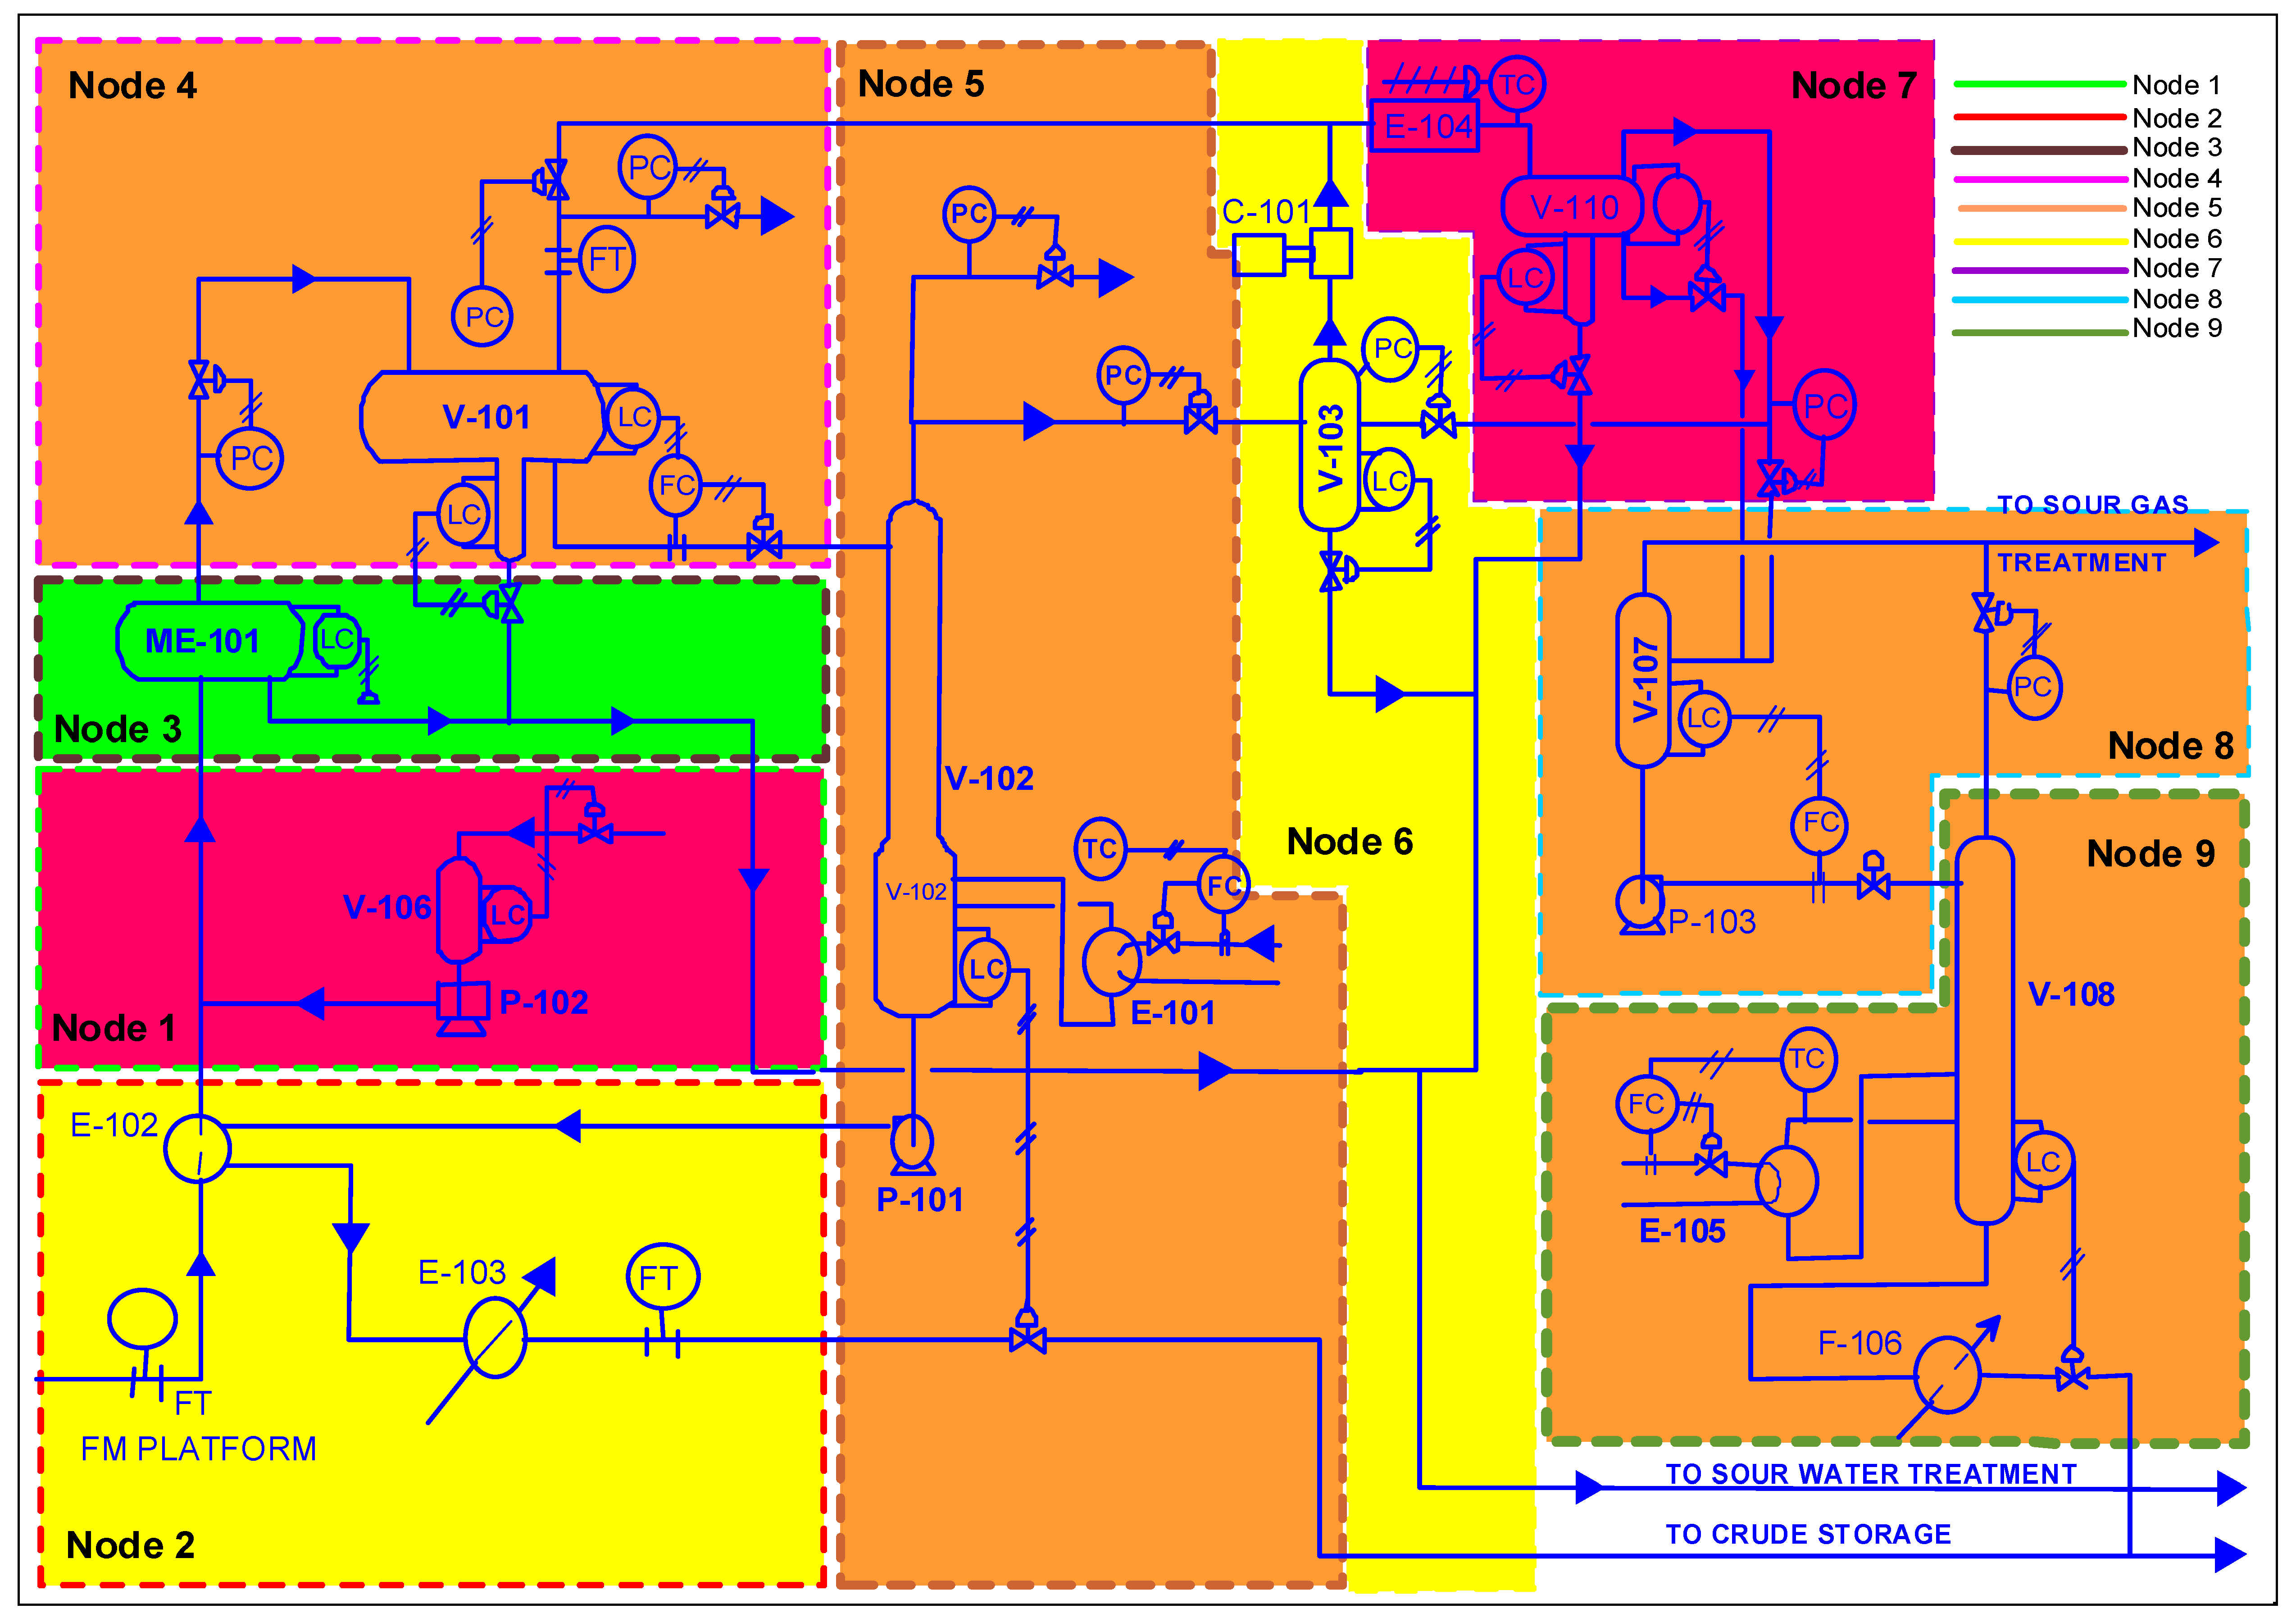
  • “Danger”: It is used when there is a direct jeopardy (critical risk or high risk) for an injury and/or death, and for alerting persons to a hazard. In these cases, OSHA uses the red color for the signs and the other safety signals.
  • “Warning”: This category is used when a risk is present (of moderate level), which on the other hand is not so serious or so immediate, as when it is used. The SC associated with this type is the orange color.
  • “Caution”: This class is for alerting people to a potential risk (minor or low risk level), and the color used is yellow.
  • “NSR” (no special risk): This mark denotes the lack of special risk, and the color used is green.
The utilization of SCs is a noteworthy tactic of communicating perils to employees and workers, and hence, the ANSI institute has set detailed rules outlining what is the meaning of precise colors. There are various standards in use regarding safety colors, from a diversity of organizations, such as OSHA, ANSI, etc. Each color is assigned a separate significance, to a specific situation, which allows employees to directly define what type of safety hazard is present in the workplace, even if they are not able to read any specific notice. Although there are numerous organizations that designate different notions to the safety colors, many of them present noteworthy overlaps. This is a deliberate measure to ensure that standards are applied in as wide a range of situations as possible.
A facility can use safety colors everywhere that they are essential. Nevertheless, in most circumstances, there are ordinary methods wherein these colors are used through multiple facilities, and even in numerous industries. One of the greatest ways to ensure a facility obtains the finest benefits from the usage of SCMs is to learn from the confirmed strategies of other corporations. The issue “how to add safety colors” is significant, and when a safety manager decides which colors he will use where, it is crucial to acquire the knowledge of the most effective ways of using them in an area. There are various choices, and the optimum solution depends on each situation. Taking the time to appraise a facility and select the finest method ensures that these safety colors are simply visible and remain in place for an extended period of time. In this work, we used the DMRA risk-matrix tool as a handy way to add safety colors and also yield a SCM concerning the worksites of a SCOPI and MRS/GTS station.

2.3. The DMRA Process

The literature presents a DMRA approach which is based on two tables, one for depicting the criticalness scale (i.e., the severity of consequences, S), and the other for the hazard probability ratings (i.e., the frequency rating, L). Thus, the quantity of risk (R) is provided by the equation of R = S∙L [45].
Table 1 shows the fundamental risk ranking-criteria [52] after combining the severity levels with the cause frequency levels. Table 2 presents the risk-matrix parameters about the severity and likelihood [40], while Table 3 illustrates the generated risk-matrix using the OSHA’s recommended color coding. Therefore, after assigning a value for the severity (S) and the likelihood (L) for any defined hazard in the HAZOP process, the risk-matrix should be used in order to acquire a distinct risk value, i.e., the risk assessment of that specific risk.

3. A Concise Technical Presentation of the Industrial Plants
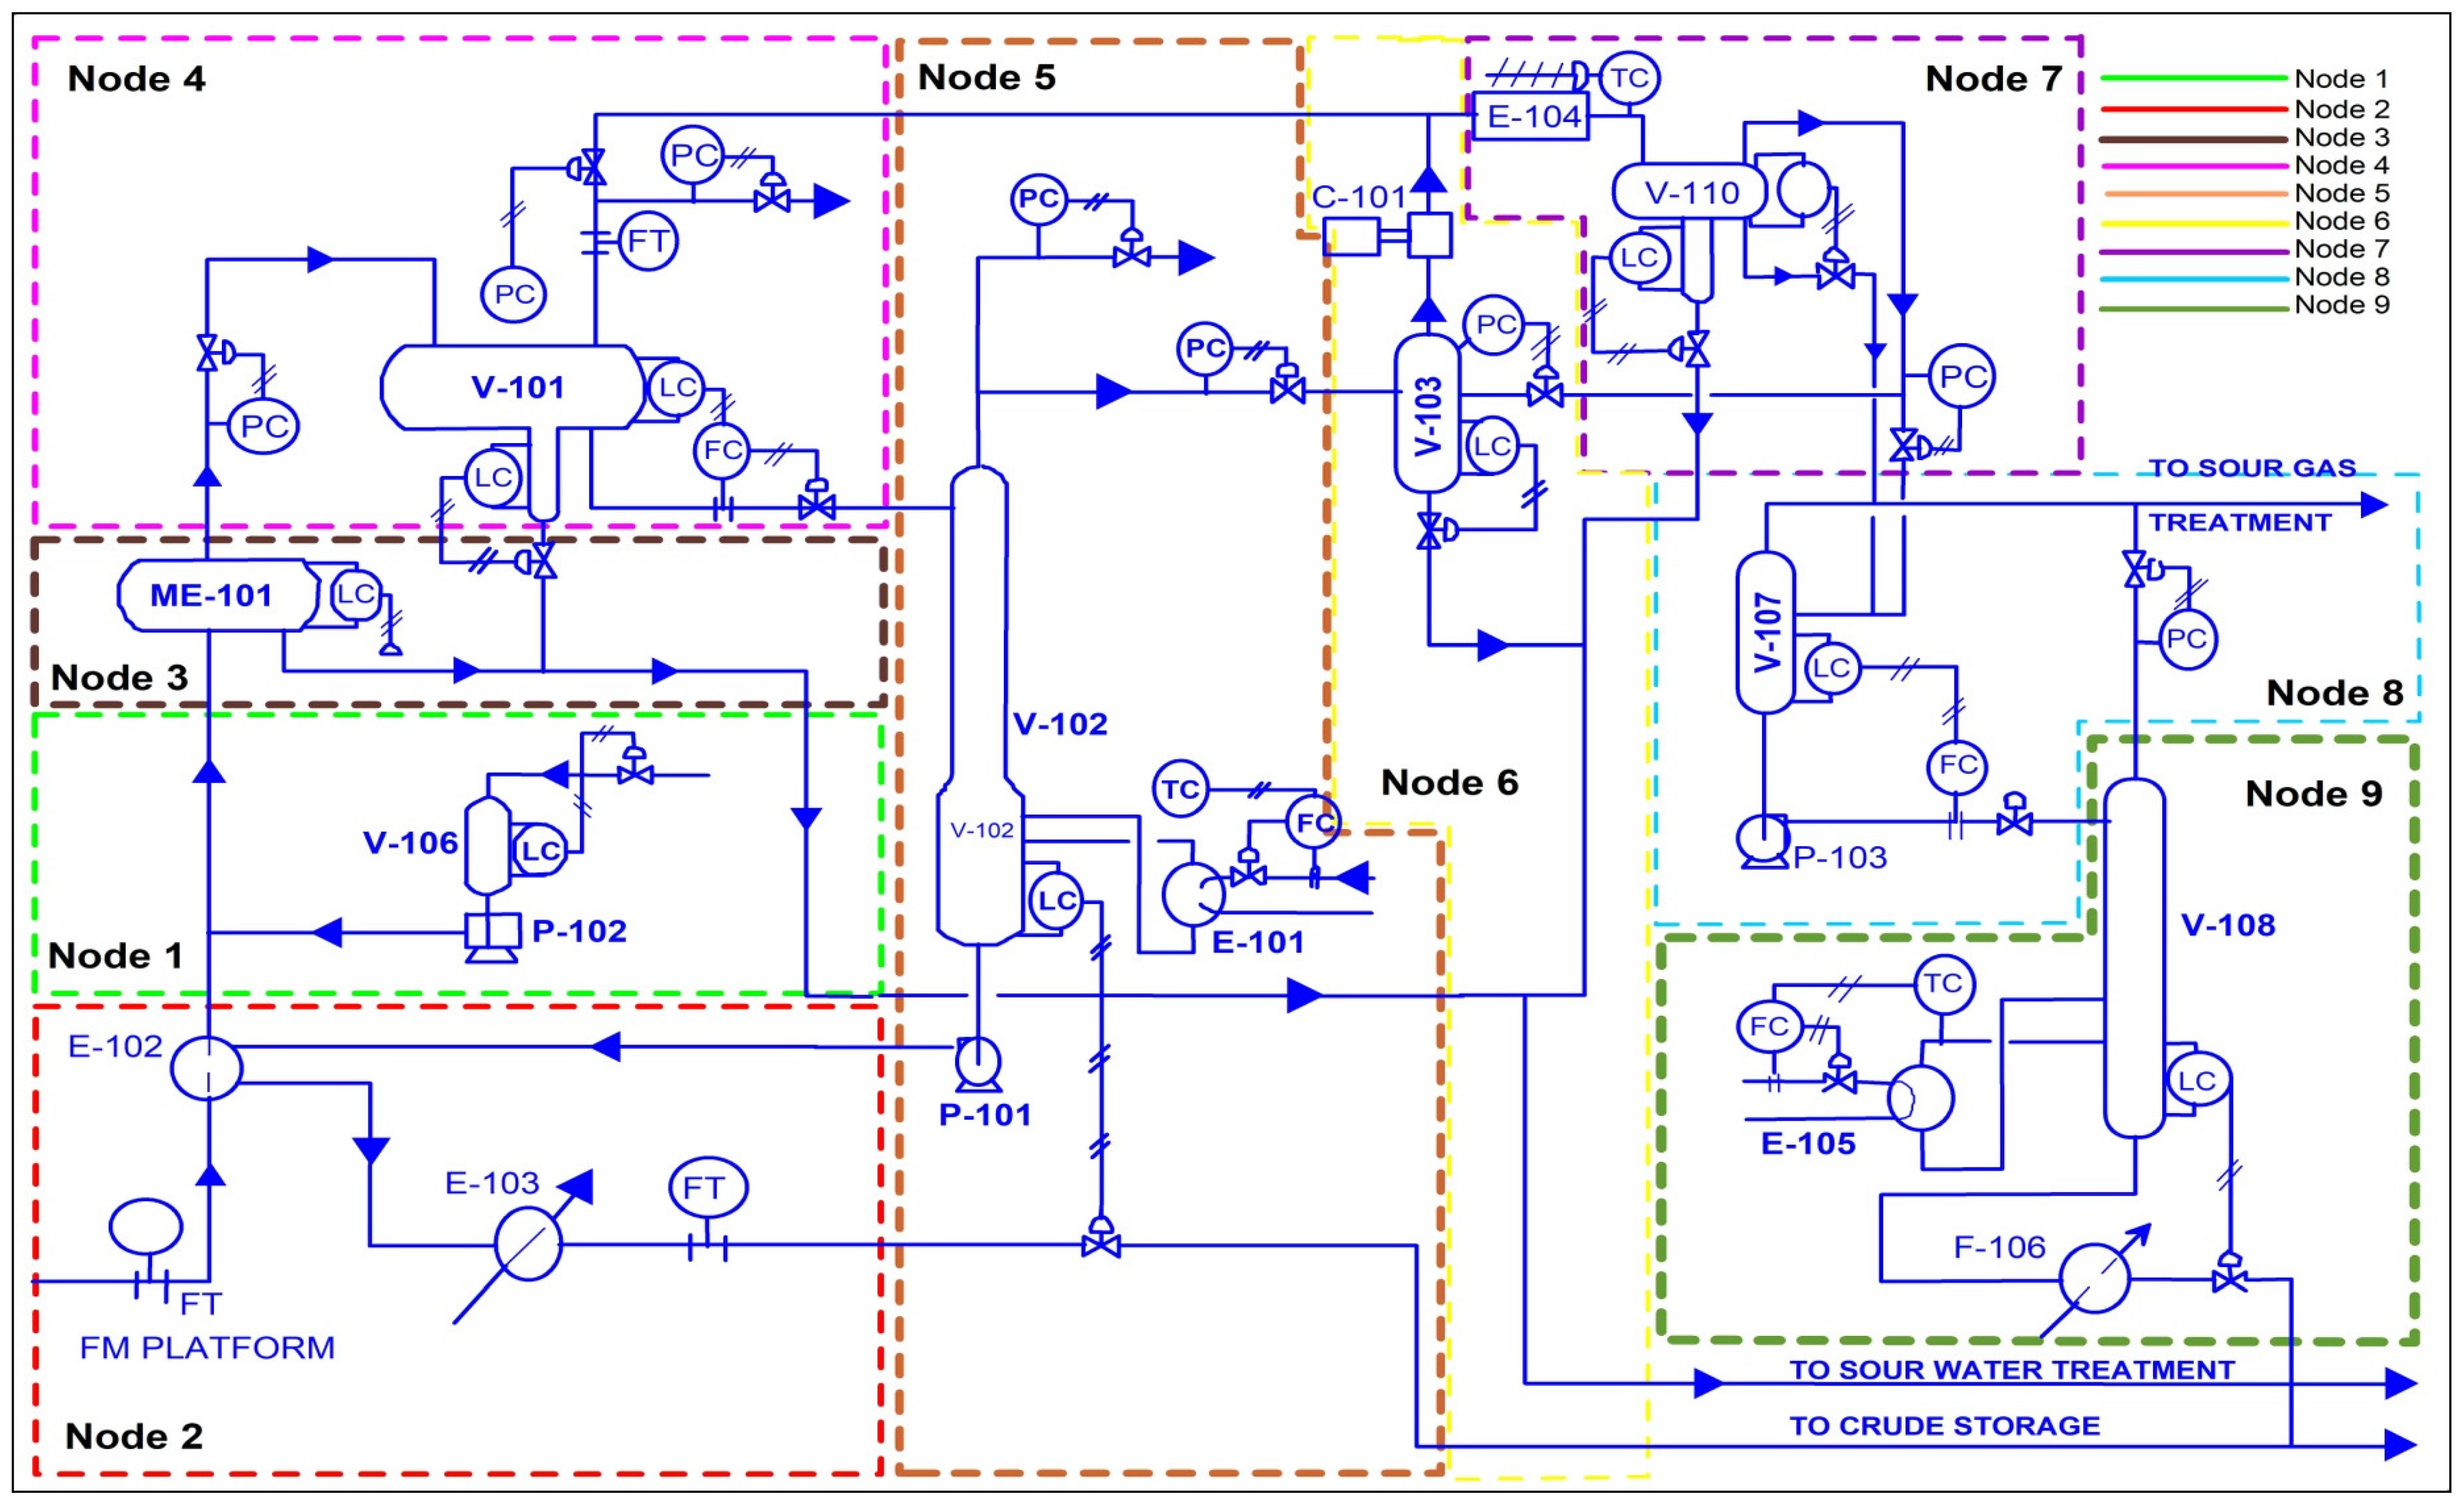
3.1. The SCOPI

A crude stabilization facility processes sour crude oil produced in the oil production platform, i.e., crude oil that comprises hydrogen sulfide, and derives marketable crude-oil. Thus, the subsequent processes have to be taken into consideration:
  • The crude-oil desalinization and stabilization.
  • Gas compression.
  • Natural Gas Liquids (NGL) stripping.
The installation is designed to take away water, suspended particles, salts, hydrogen sulfide and a great part of the vaporizable hydrocarbons from the sour crude oil in order to stabilize it.
The facility’s equipment is separated in vessels, pumps and compressors, heat exchangers and control valves. In Figure 2, we illustrate the process flow diagram of the SCOPI. Although the reader could find a thorough documentation in the articles of Filippidis (2017) [53] and of Marhavilas et al. (2019) [16], a succinct description of various basic parts of a specific node’s equipment (i.e., of Node#7), which will be studied in this article by HAZOP, is presented below:
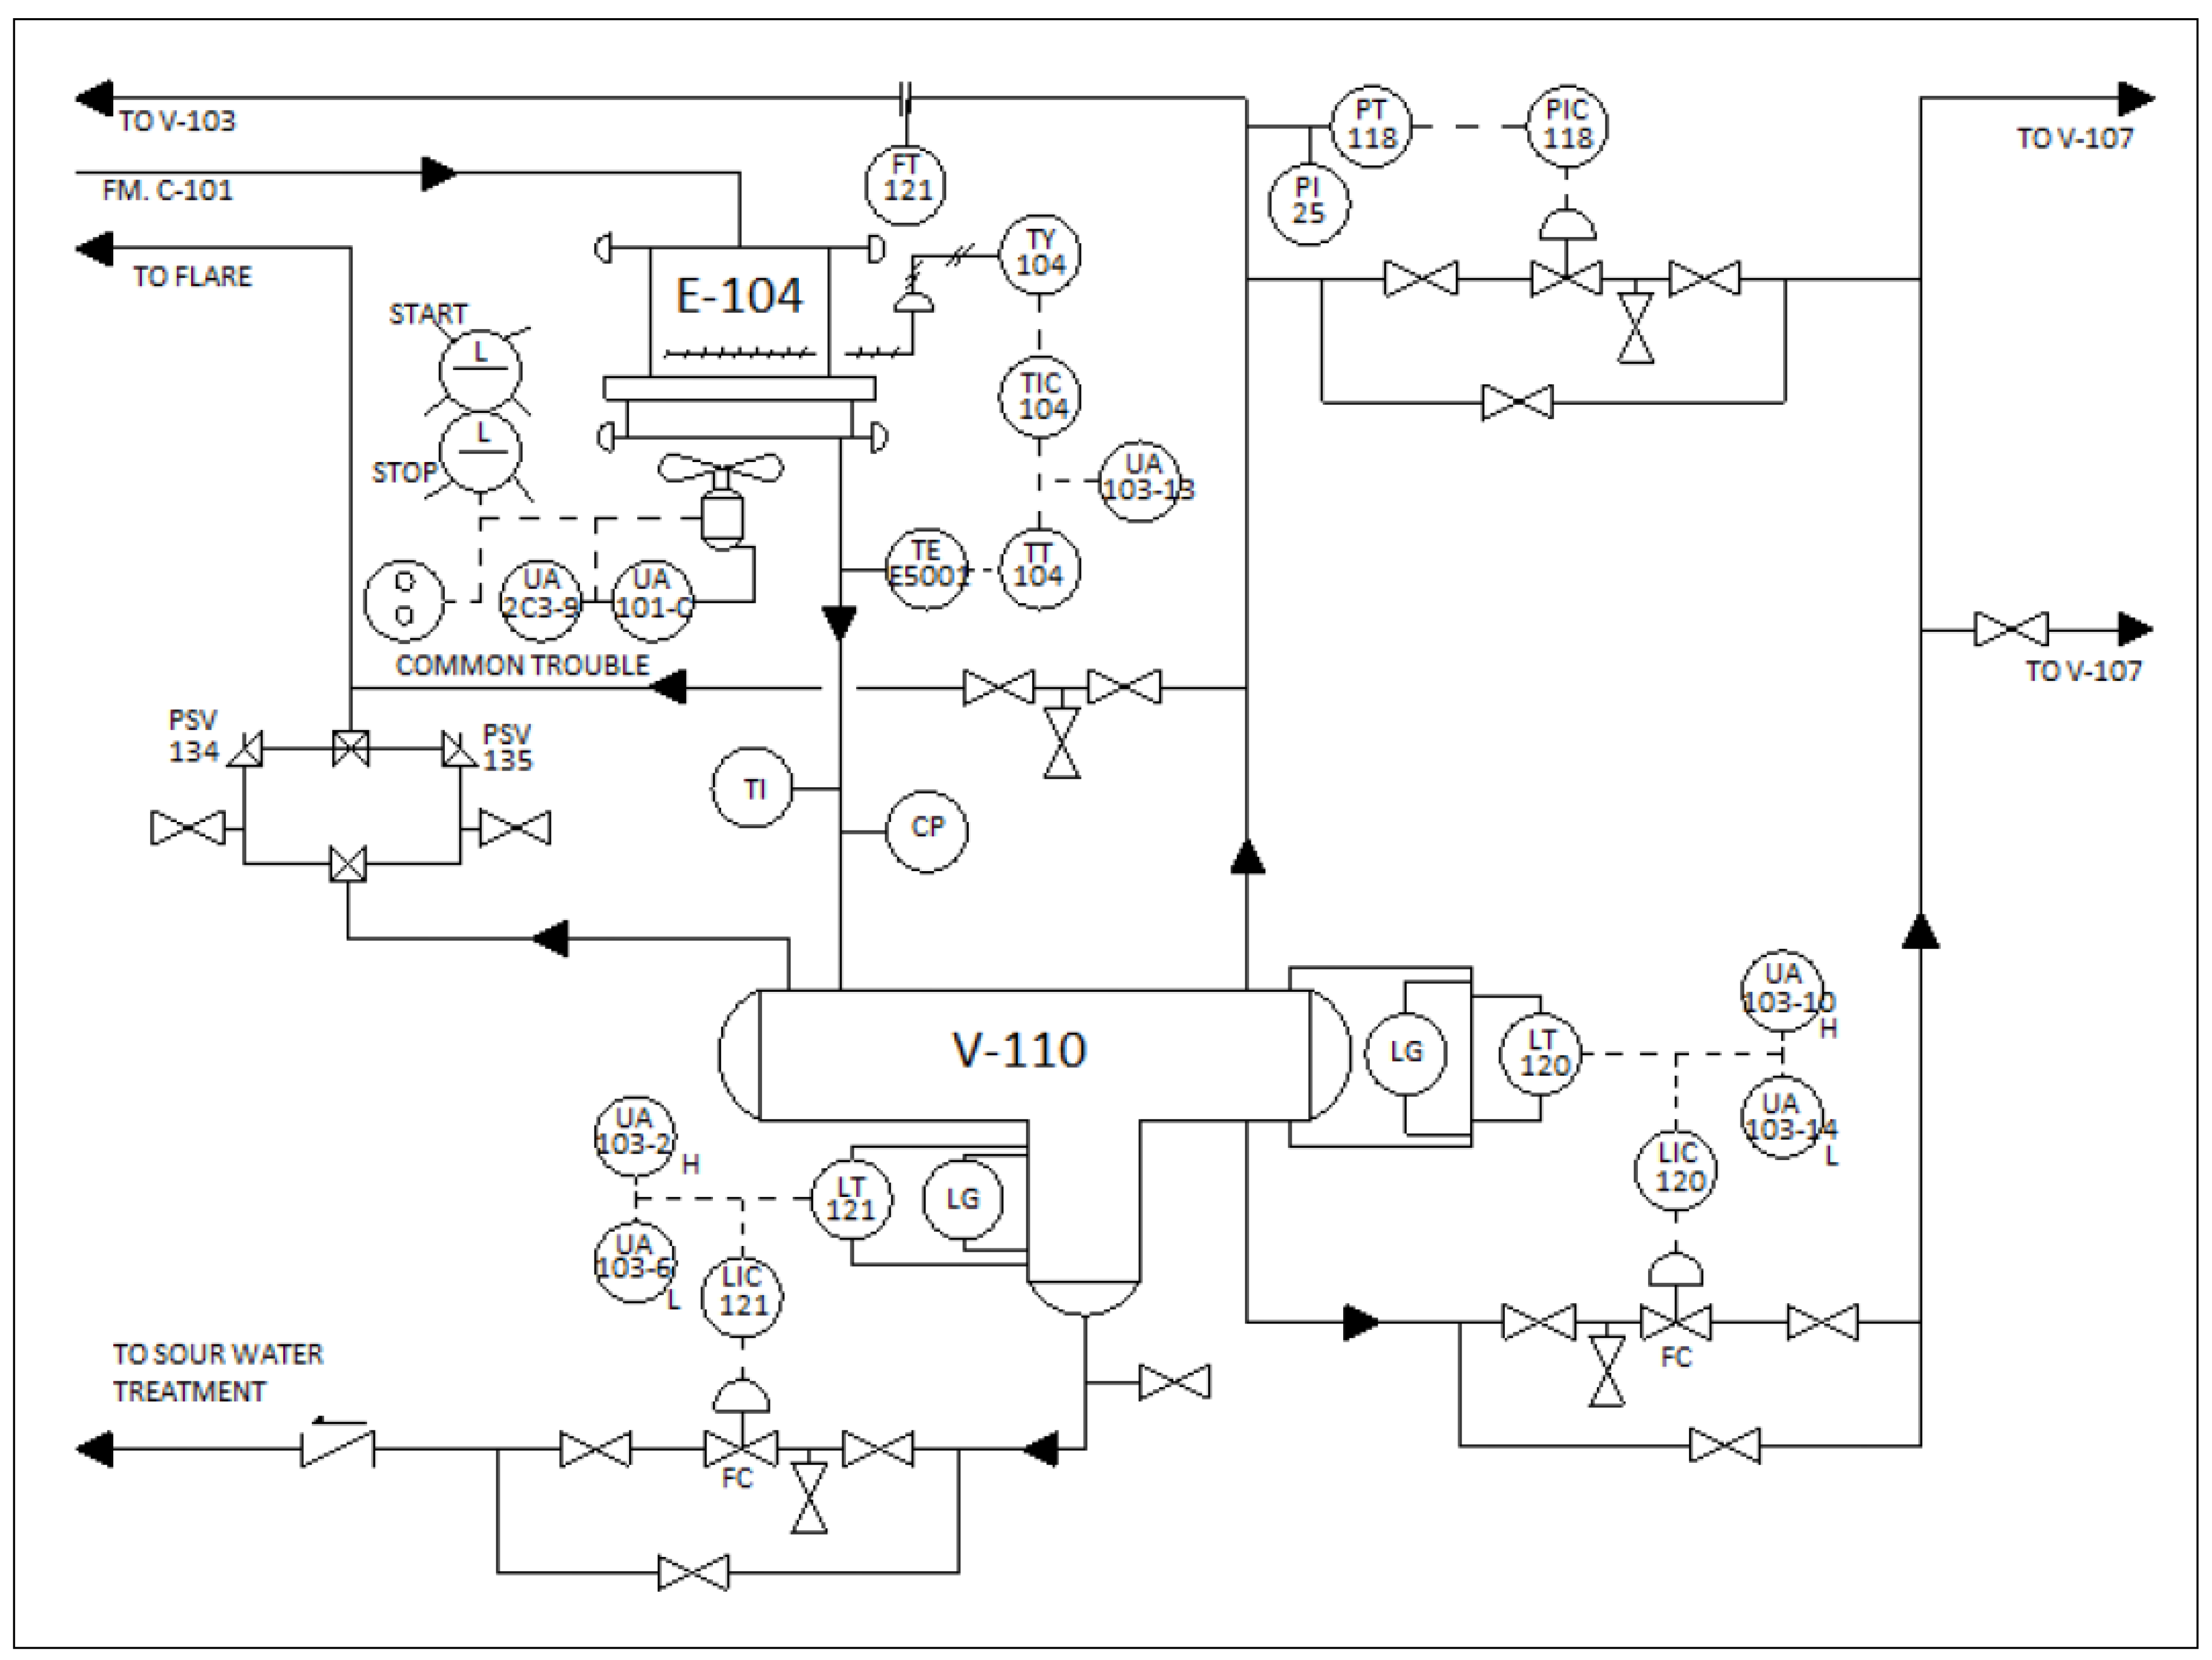
  • Vessels: Such as the component of V-110, which is a 3-phase separator.
  • Heat Exchangers: Such as the component of E-104, which is an air-cooled heat exchanger, that is used to cool the stream of sour gas coming from V-101 and C-101.
  • Pumps and Compressors: There are three pumps and one compressor in the in-stallation, like the following:
    • P-103: This component is a centrifugal pump to send the sour NGL from the bottom of V-107 to V-108 for stripping.
    • C-101: This component is a 2-stage double-action reciprocating gas-compressor which is used to pressurize gas coming from the top of V-102 in order to be merged with the gas released from V-101.
  • Control Valves: The facility includes three kinds of control valves, that is to say the pressure valves (PV), the flow valves (FV) and the level valves (LV), which control the respective element.
  • Relief Valves: The installation includes a number of pressure-relief valves (RV) and alarm switches to ensure its safe operation, as follows:
    • Tag No PSV: 134–135
    • Location: V-110 gas phase
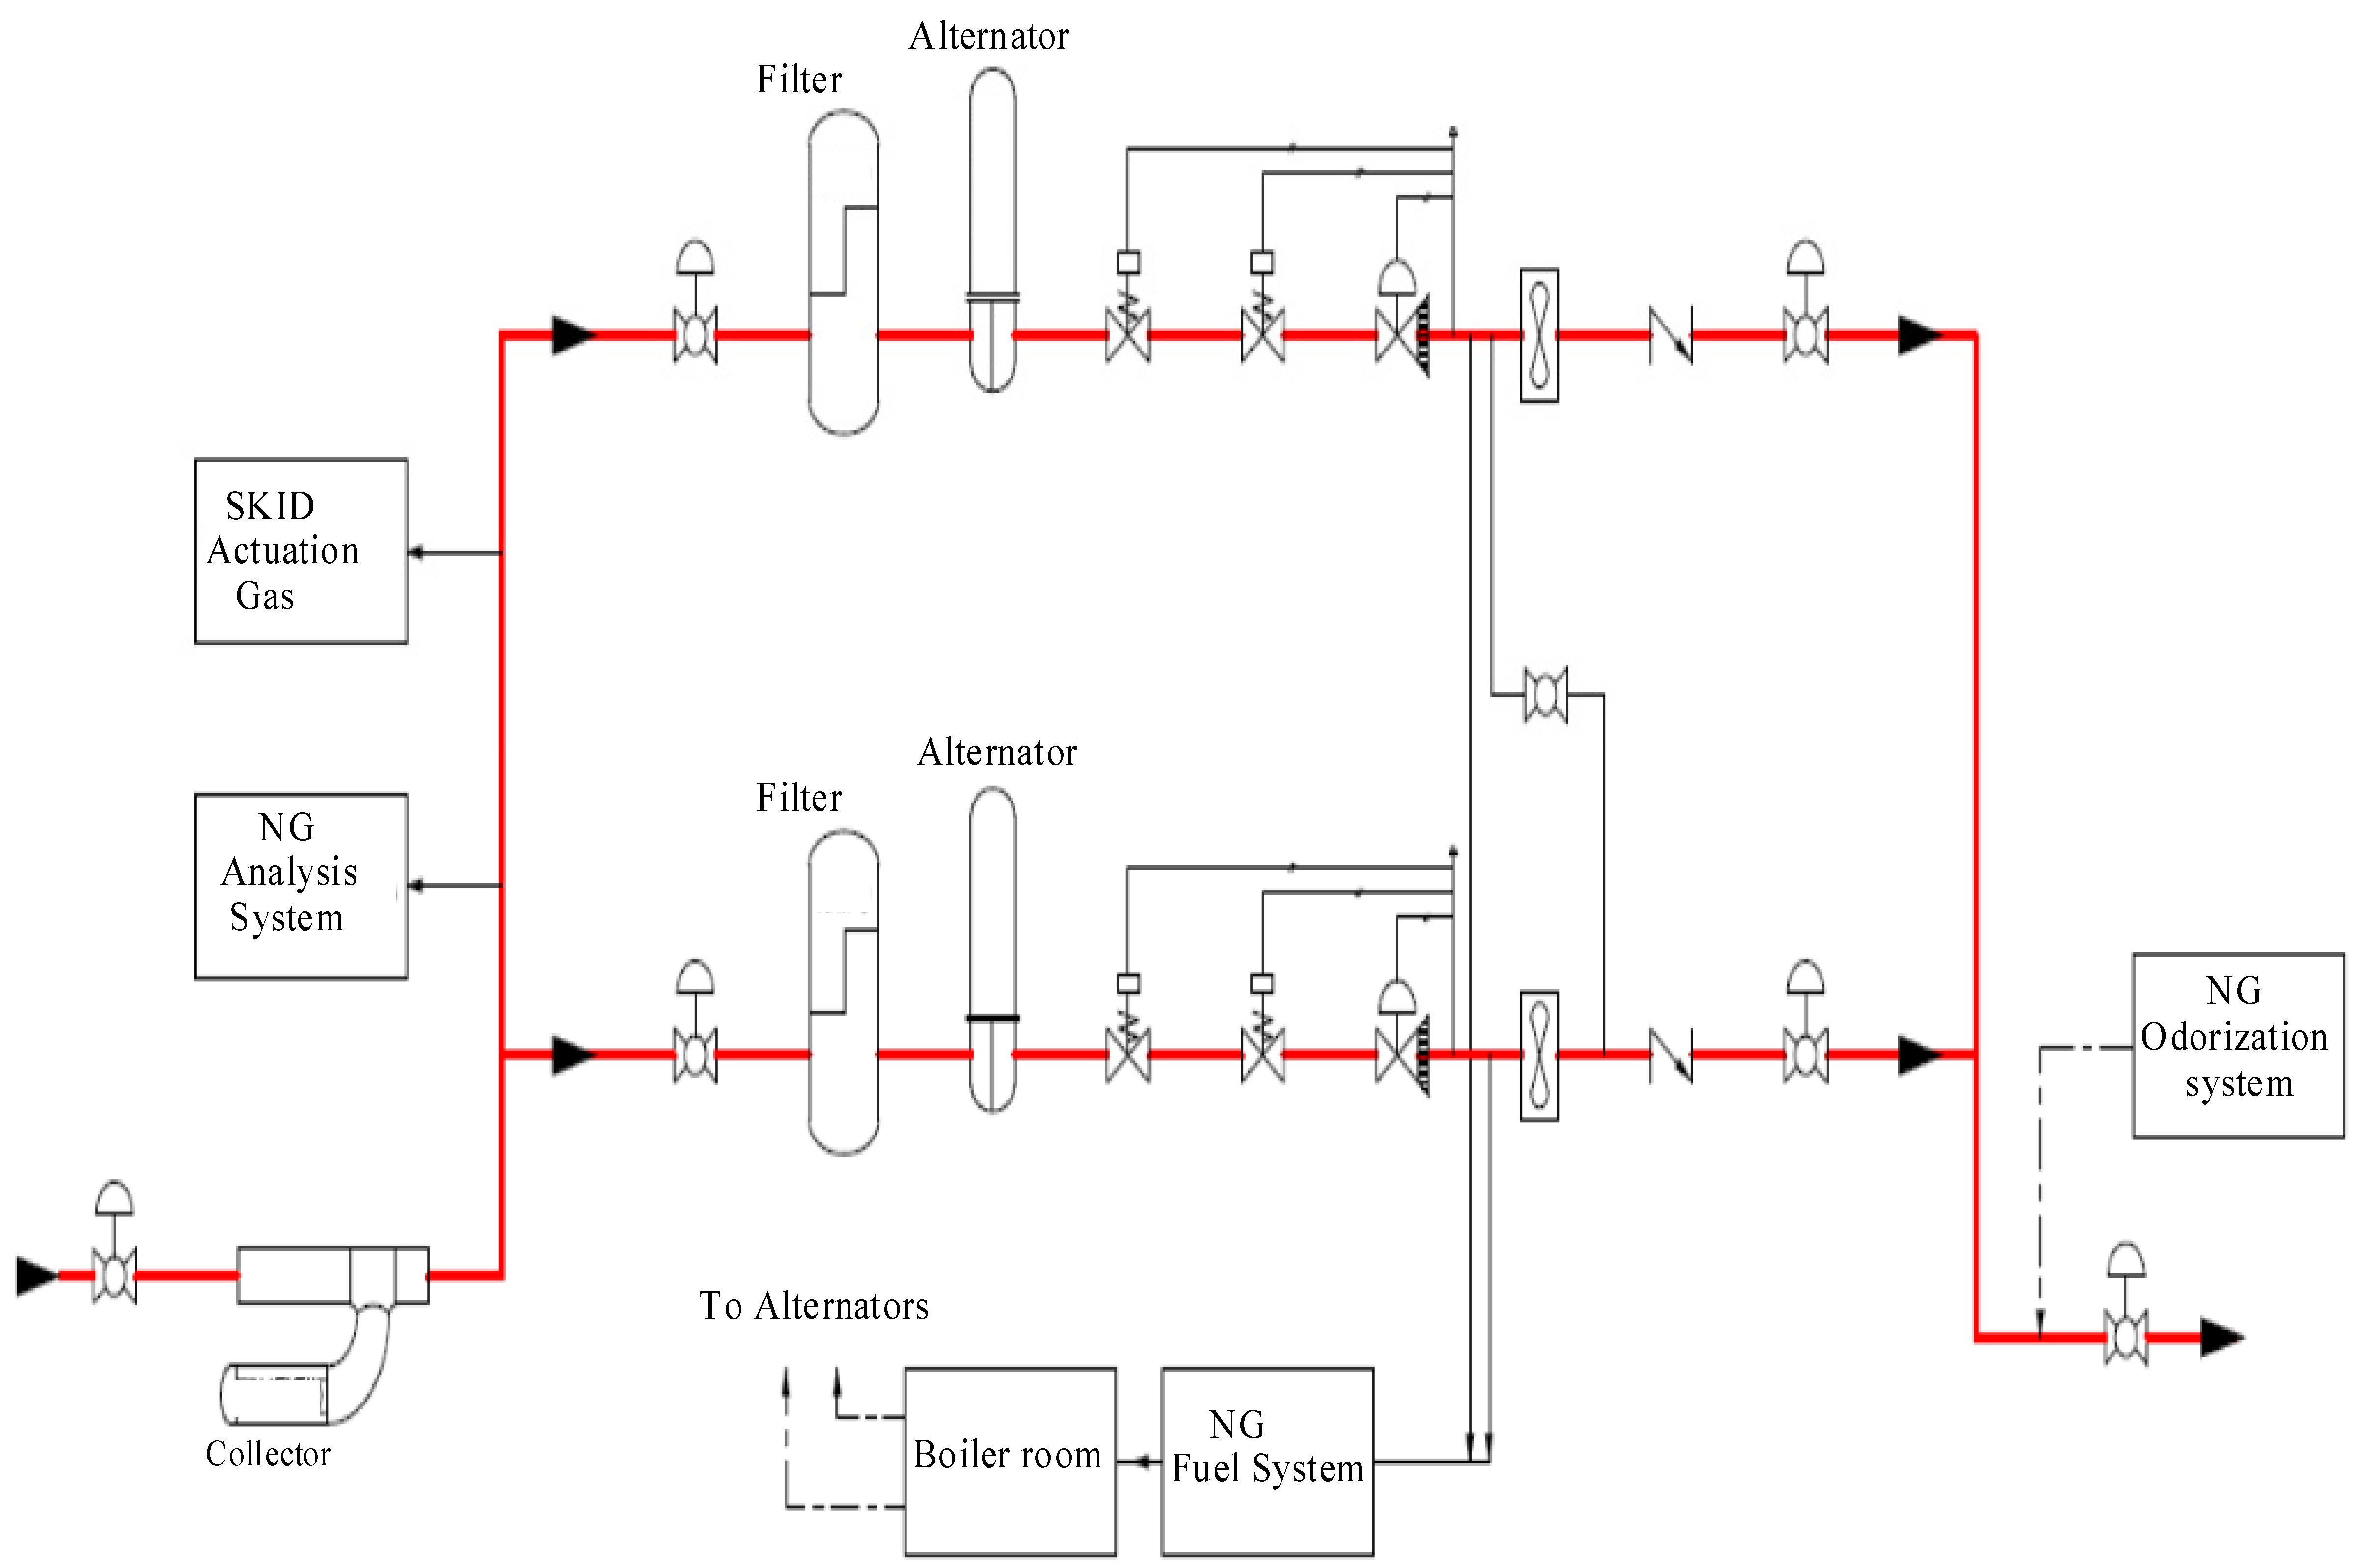
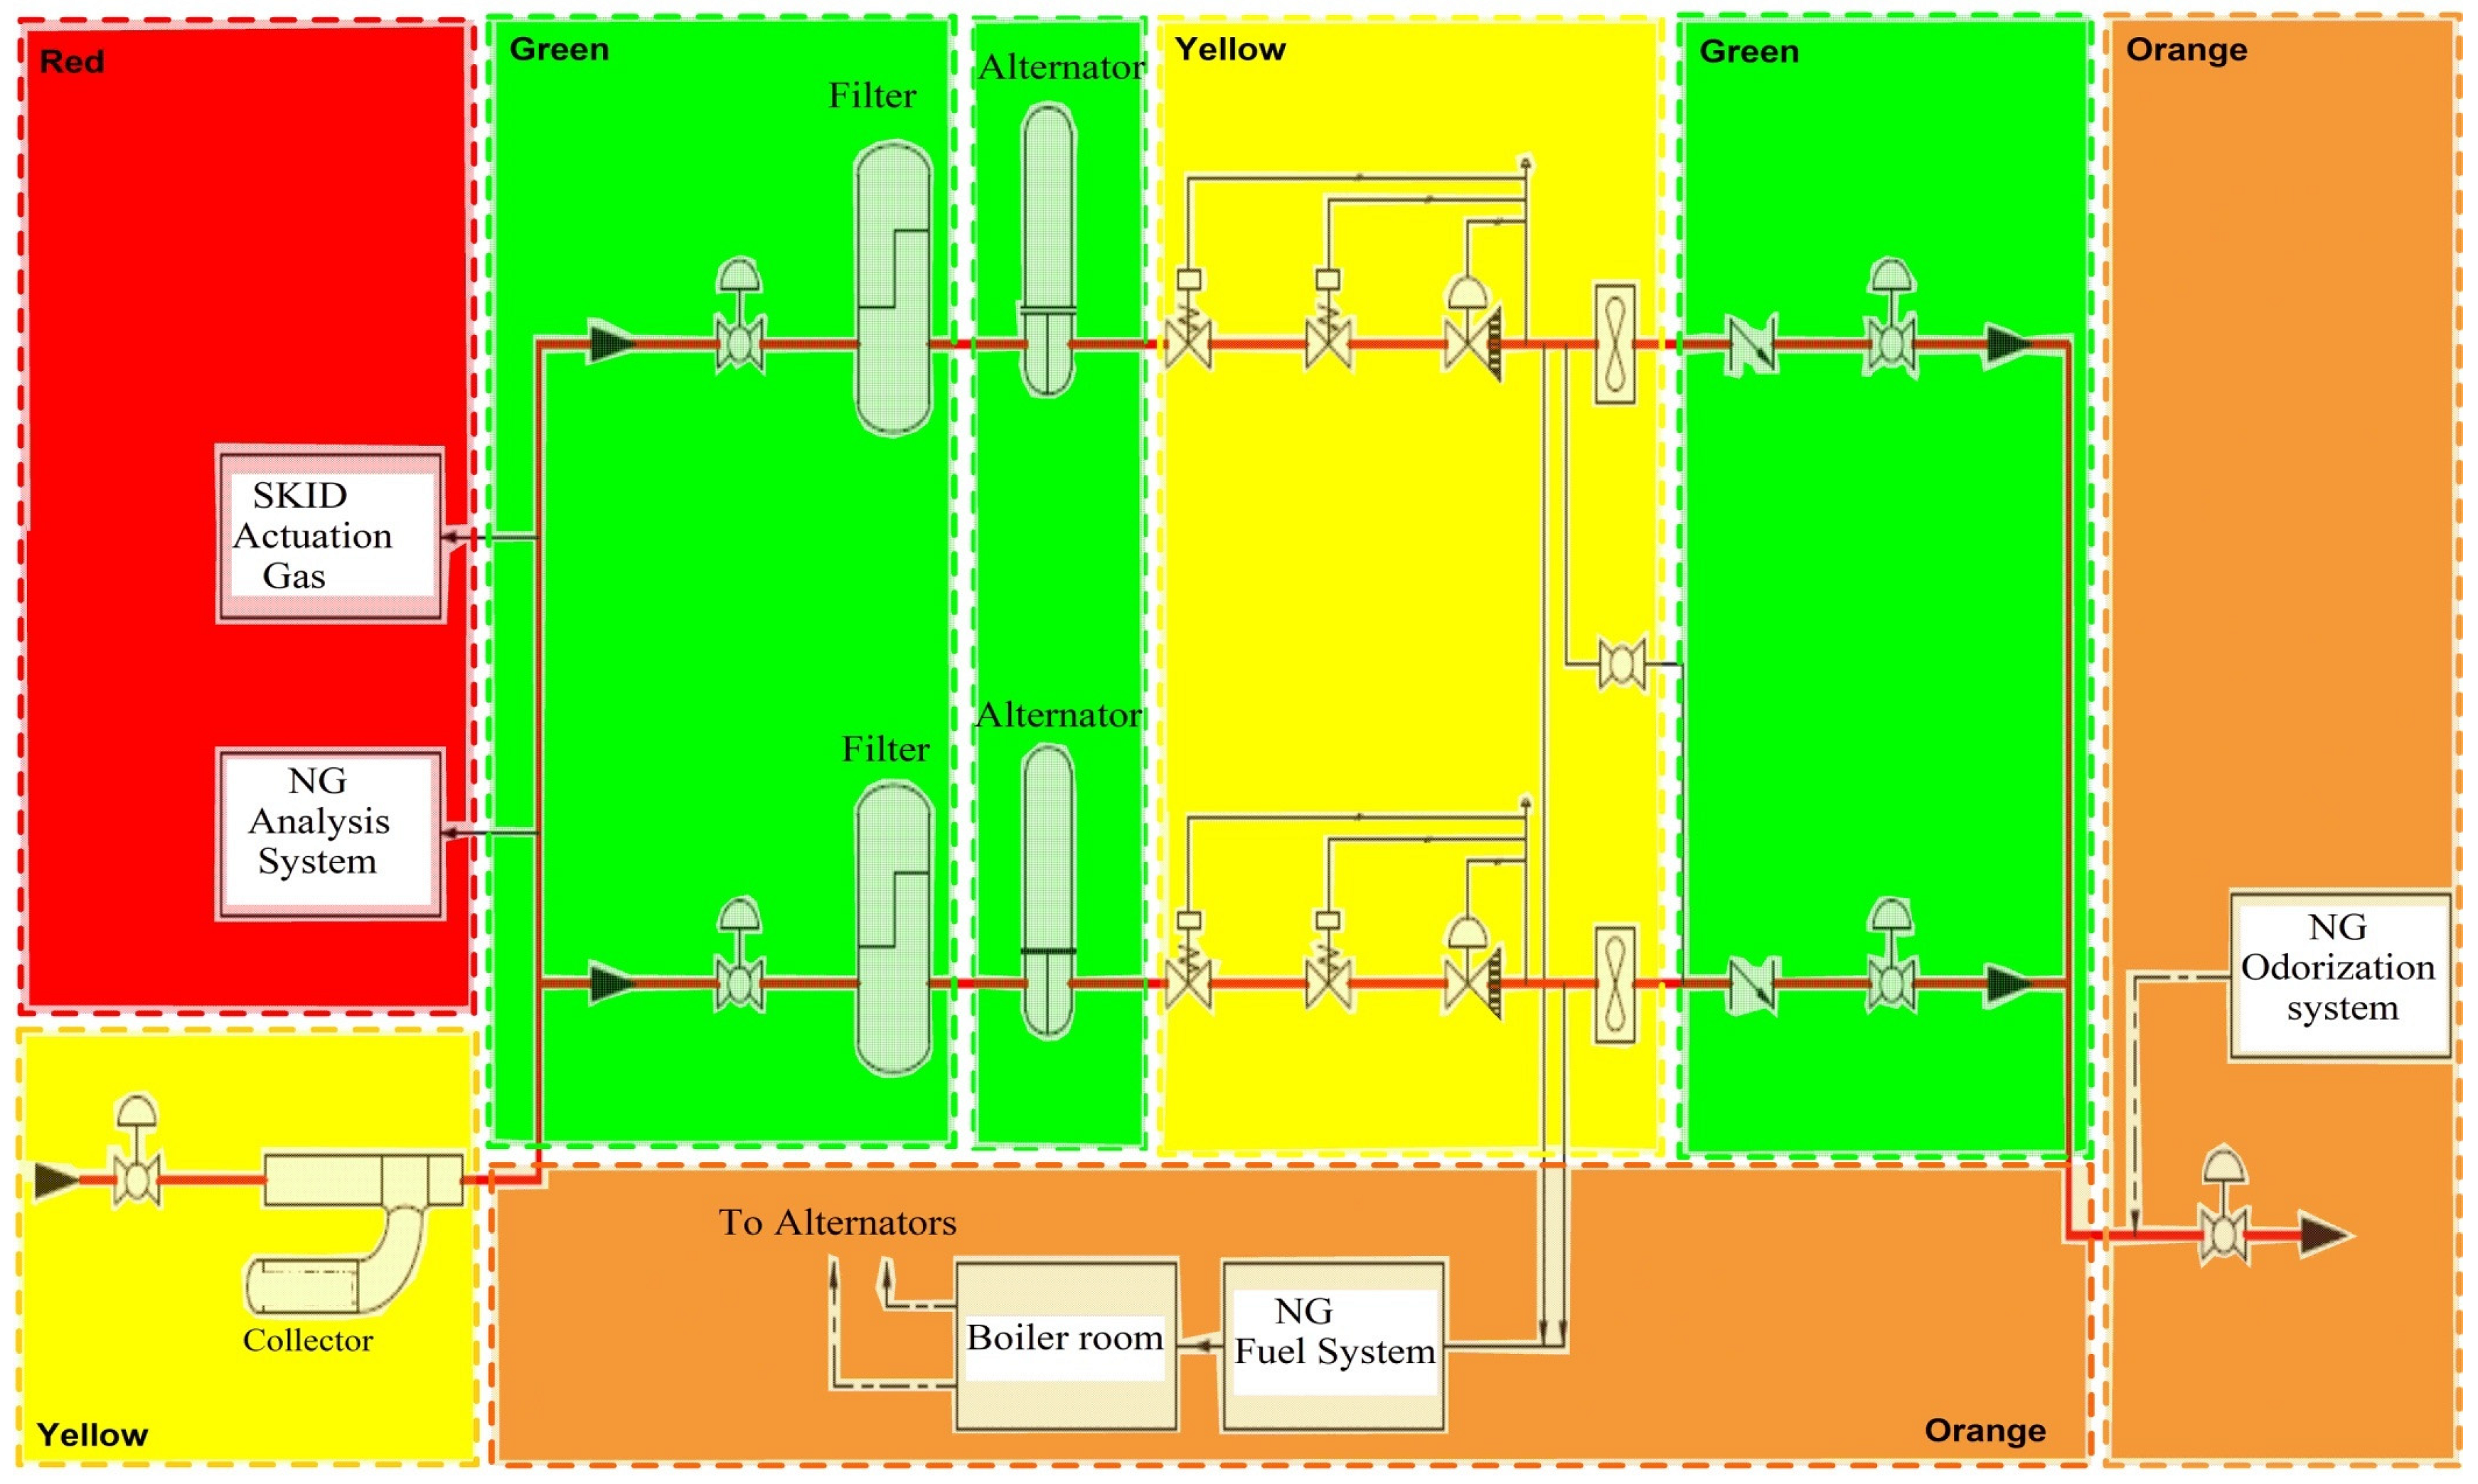
3.2. The MRS/GTS

The unit of pressure measurement and reduction in a gas transportation system constitutes a measurement and regulatory station. More specifically, the MRS/GTS stations are installed above-ground for the proper management of natural gas, wherein the pressure’s degradation and also the measurement of the quantity of the supplied natural gas (NG) are achieved. The MRS/GTS stations supply plants which use lower operating pressures than transportation networks, such as NG distribution networks or huge industrial plants. The MPS are the terminals of a gas transportation system, and from a commercial point of view, are considered as “exit points” for the transported NG’s product.
The MRS/GTS of the present case study operates without a permanent physical presence of personnel (unmanned installation), and was built based on the standard ASME/ANSI B.31.8 with a design pressure of 70 bar and a design temperature range from −15 to 50 °C. It has been dimensioned for a capacity of 100,000 Nm3/h (maximum NG speed 20 m/s), with the ability to reduce the pressure from 70 bar (the transmission network design pressure) to 19 bar (the distribution network design pressure). The MRS/GTS operation is monitored remotely by signaling ~500 status signals and commands.
The whole MRS/GTS equipment is installed indoors with the exception of the input/output isolation device. In Figure 3, we illustrate the process flow diagram of a MRS/GTS station. Even though the reader could find a detailed documentation of the facility in the study of Petropoulos (2021) [54], the main subsystems of the specified installation are the following:
-
Input/output isolation device
-
Liquid collector (catcher)
-
NG measuring/regulating lines (skids)
-
NG preheating hot water boilers
-
Fuel gas for the boilers
-
Actuation gas for pneumatic valves
-
NG odorization system
-
NG analysis system
-
MRS/GTS other equipment/basic process support systems (local control center, backup power supply systems, security and protection systems)
Figure 2. The process flow diagram of the SCOPI’s units.
Processes 09 01299 g002
Figure 3. The process flow diagram of an MRS/GTS station.
Processes 09 01299 g003

4. Implementation of the Methodology

4.1. First Step: Implementation of a HAZOP-DMRA Hybridization

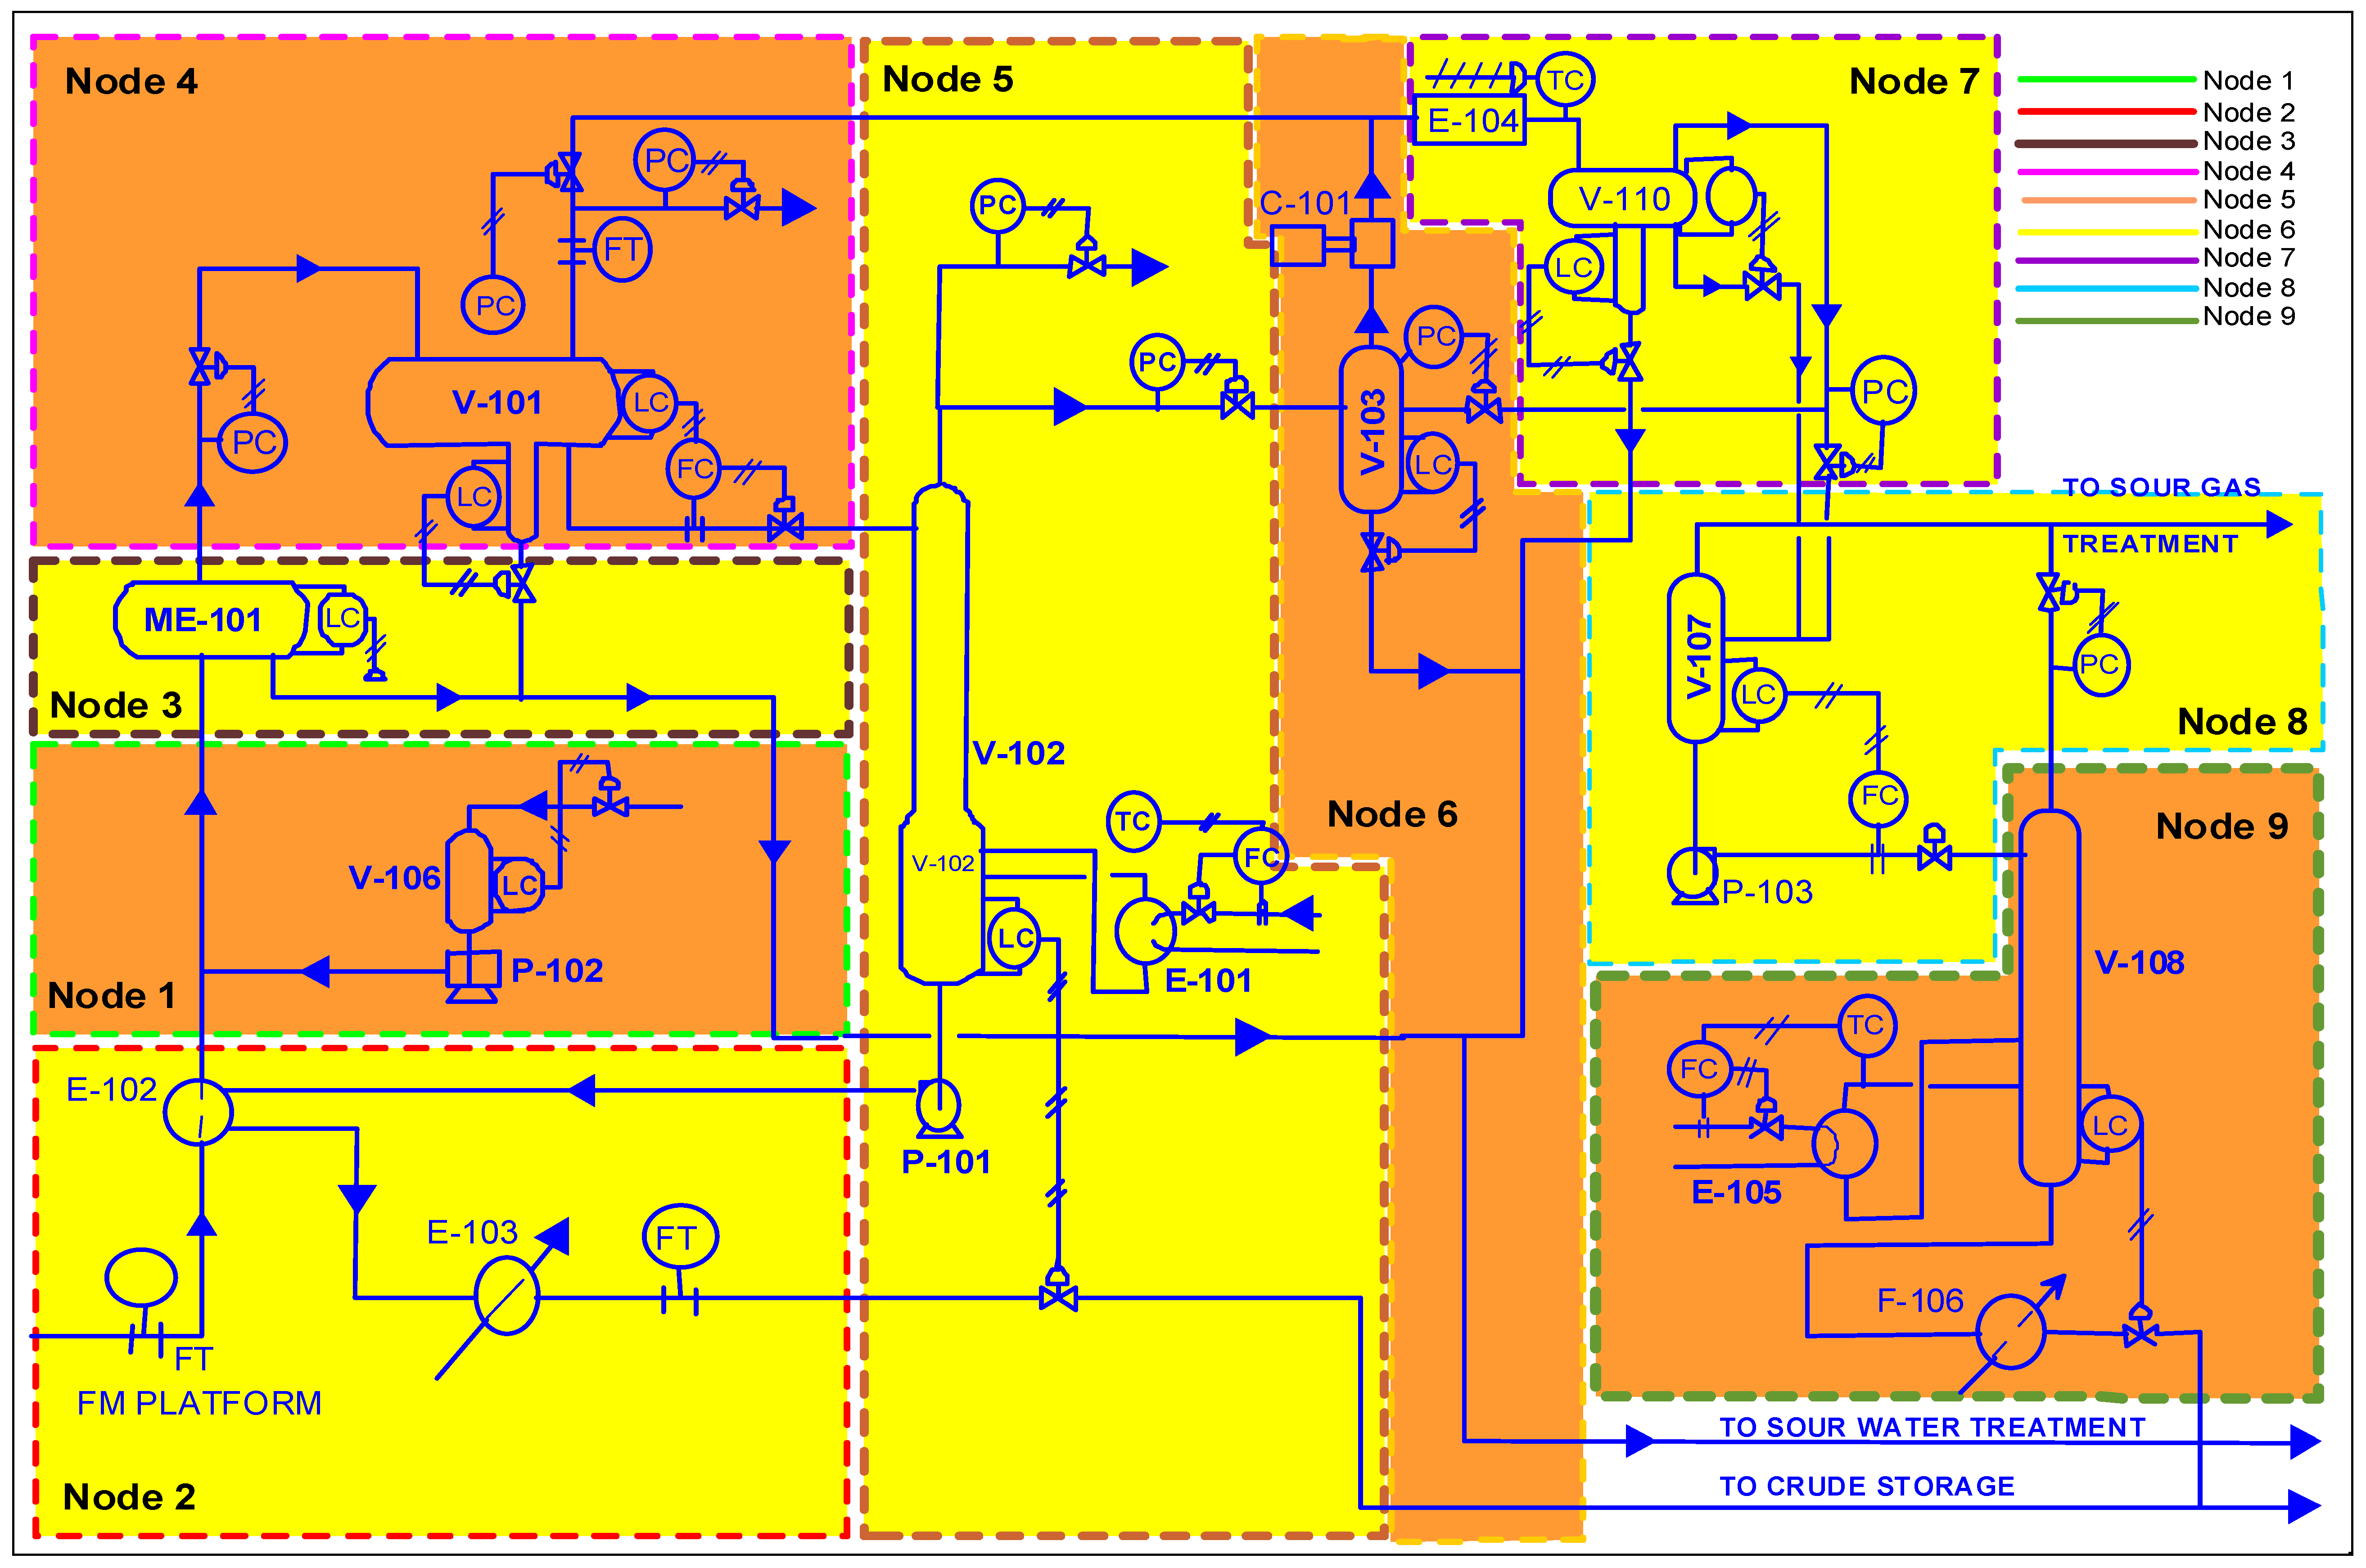
4.1.1. HAZOP-DMRA Hybridization on a SCOPI

This hybridization was carried out in a SCOPI, situated in Kavala prefecture, East Macedonia, Greece, by a team consisting of two unit operators, i.e., the installation operations superintendent and the maintenance department superintendent. The installation operations superintendent is a qualified chemical engineer with considerable expertise in the chemical process industry, whereas the maintenance department superintendent is a mechanical engineer. The unit operators have a lengthy experience in operating the facility and have acquired valuable knowledge on previous incidents and possible hazards. The HAZOP sessions took place over a period of six months, involving twelve sessions in total.
Taking into account the operation of the equipment and the connections between the vessels, 9 nodes were eventually settled by the HAZOP team, as follows:
  • Node#1: System of water injection
  • Node#2: Preheating and cooling exchangers
  • Node#3: Desalter Vessel ME-101
  • Node#4: Low-Pressure Separator
  • Node#5: Column for the crude-stabilization
  • Node#6: Gas-compressor
  • Node#7: System for gas-compressor cooling and liquid recovery
  • Node#8: Condensate-stripper column for feeding vessel and pump P-103
  • Node#9: Condensate-stripper and cooling device
The general process parameters (“Elements”) that were used to specify the deviations in the HAZOP process are “Flow”, “Pressure”, “Temperature”, “Level”, “Composition”, “Containment” and “Phase”, while the guidewords (GW) for the deviations from the safe operation are “More”, “Less”, “No”, “Reverse” and “Other than”. It is worth noting that, substantially, the “Guidewords” are combined with the “Elements” to designate the deviations from the safe situation in the SCOPI. Once the nodes are described, and also the guidewords and the process parameters are defined, the hazards are determined.
At the next step, the HAZOP team determined the consequences of hazards in terms of safety, environmental and economic. The recommendations to decrease the level of risk were discussed by the HAZOP team and recorded in the HAZOP worksheet.
The PFD of the SCOPI’s units, which is displayed in Figure 2, incorporates the set of nine nodes entirely, whereas at each node, the PID of that node was provided. However, just as an example, in Figure 4, we extensively exhibit the compressor gas cooling and liquid recovery system (i.e., of Node#7).

4.1.2. HAZOP-DMRA Hybridization on an MRS/GTS Station

This hybridization was executed in an MRS/GTS station, situated in Athens/Greece, by a team that also consisted of two members with considerable expertise in the installation’s operations and in its maintenance (a chemical engineer and a mechanical engineer).
During the inspection of the MRS/GTS installation, the following were used as constructed documents and drawings:
  • Piping and Instrumentation Diagrams
  • Process Flow Diagram
  • Cause and Effect diagrams
  • Functional design specifications
  • Equipment specifications—construction plans
At the same time, both the changes that have taken place and significant problems that occurred during the operation period of the installation were taken into account. The division of the installation into sections (or units) was carried out based on the jointly planned operation. The fact that the MRS/GTS is not an objectively complex installation allowed the definition of small sections that allow for a more detailed examination. The selected sections are listed in Table 4.
The process parameters that were used to define the deviations in the HAZOP study are “Pressure”, “Temperature”, “Flow”, “Level”, “Composition”, “Operation” and “Other parameters”, while the guidewords for the deviations from the safe operation are “More”, “Less”, “No”, “Reverse”, “Missing”, “Exceed” and “Other than”. It is worth noting that the process parameters combined with the guidewords determine the following deviations from the safe situation in the MRS/GTS station: “Low pressure”, “High pressure”, “High temperature”, “Low temperature”, “No flow”, “Low flow”, “High flow”, “Reverse flow”, “High level”, “Low level”, “Low element concentration”, “High concentration”, “Start”, “Pause”, “Misfire”, “Maintenance/Repair”, “High differential pressure”, “External leakage” and “Internal leakage”.

4.2. Second Step: Implementation of a HAZOP-DMRA-SCM Amalgamation

Figure 5 depicts the flow diagram of the proffered HAZOP-DMRA-SCM cooperative risk-assessment framework by integrating HAZOP analysis with the DMRA technique and also incorporating the process of creating safety-color maps, as a segment of the risk-management methodology.
This methodological framework constitutes three distinct subphases, i.e., the risk analysis, quantified risk evaluation (QRE) and risk reduction/control. The first module, which incorporates hazard sources’ identification and risk consideration, contains the contribution of HAZOP analysis, while the second one comprises the amalgamation and joint execution of DMRA and SCMs, as a part of the QRE. The SCM process is used for visualizing the risk level of the project risk factors. To finish, the third component embodies the safety-related decision-making procedure. This joint RAA framework was produced by utilizing the guidelines of ISO/IEC (1999, 2009) [55,56] documentation.
Figure 4. Node#7 shows the gas-compressor cooling system and liquid recovery device.
Processes 09 01299 g004
Figure 5. The flow-chart of the suggested HAZOP-DMRA RAA framework, which in addition incorporates the process of creating SCMs, as a segment of the risk management procedure.
Processes 09 01299 g005

5. Results

5.1. Case Study #1: HAZOP-DMRA-SCM Application on the SCOPI

In Table 5, Table 6, Table 7, Table 8 and Table 9, we display the results of the HAZOP analysis for the elements “Level”, “Flow”, “Pressure”, “Temperature” and “Containment” respectively, along with the outcomes of the DMRA process and using OSHA’s recommended color coding. The HAZOP analysis of the other eight nodes (i.e., of Nodes #1–#6, #8 and #9 of the total PDF diagram of the facility) was performed in the same way and is analogous with the study of Node #7.
In light of the outcomes illustrated in Table 5, Table 6, Table 7, Table 8 and Table 9 and from the execution of the preceding HAZOP-DMRA concept, we continued to the ultimate action, the construction of a SCM on the specific SCOPI (a case study), in this step completing the implementation of the suggested synergetic RAA technique.
More specifically, using the results of the HAZOP study presented in Table 5, Table 6, Table 7, Table 8 and Table 9 (that signify the identification of the deviations and their possible causes in the SCOPI), and taking into consideration the risk matrix of Table 3, we added in these tables (in separated columns), on the one hand, the outcomes of the DMRA execution (that attribute the risk assessment subprocess in the SCOPI), and on the other hand, the corresponding safety colors (based on OSHA’s recommended color coding). Lastly, a safety color map has been derived for the specific SCOPI’s workplaces, taking into account, in each node, the deviation with the worst risk result, and also the proper safety color. For instance, in Node #7, we assessed that the process parameter “containment” revealed the most significant deviation, with the highest risk (i.e., with the worst risk result, R), that was calculated to have been equal to R = 2 (see Table 9, the red color). Thus, Figure 6 depicts the resulted safety-color mapping (by the application of the synergetic HAZOP-DMRA-SCM method on the SCOPI), that substantially discloses the safety level at the SCOPI’s workplace.
This SCM shows that Nodes #1 and #7 (painted with red color) are the highest-risk units of the installation, while Node #3 (painted with green color) and Nodes #2 and #6 (painted with yellow color) are the units with the lowest risk. In addition, Nodes #4, #5, #8 and #9 (painted with orange color) are the units that present a moderate risk. It is worth noting that we could generate numerous supplementary SCMs taking into account further risk-acceptance criteria. It is worth noting that the safety administrator is the accountable person to decide the extent and the kinds of SCMs chosen for attaining the finest RAA study concerning the specified industry.
For instance, in Figure 7, we depict an alternative SCM, taking into account for each node not the color of its highest-risk deviation, but the most frequent color (i.e., with the highest relative frequency) relating to the total number of possible causes of the node’s deviations (NDPC), which have been defined by HAZOP and depicted in the HAZOP results tables. Therefore, for the Node #7, we find by using Table 5, Table 6, Table 7, Table 8 and Table 9 that NDPC = 24 (see the third column of the tables), while the relative frequencies of the SCs using the risk matrix outcomes (illustrated in the semifinal column of each table) are f(green) = 3/24, f(yellow) = 16/24, f(orange) = 3/24 and f(red) = 2/24, which means that the most frequent SC is the yellow one, and consequently, Node #7 has been painted yellow. Thus, in Figure 7, we have painted the rest of the nodes in the same way, where Nodes #1, #4, #6 and #9 (painted with orange color) are the units that present a moderate risk.

5.2. Case Study #2: HAZOP-DMRA-SCM Application on the MRS/GTS

Table 10 displays the results of the HAZOP analysis for the above-mentioned elements, along with the risk ranking by the DMRA process and using OSHA’s recommended color coding, as far as the MRS/GTS station is concerned. In light of the results of this table, in Figure 8, we construct a SCM on the MRS/GTS station, finishing the implementation of the new synergetic RAA technique by using this process.
This SCM shows that the node “Pressure regulators (PCV 910 and PCV 920)” (painted with red color) is the highest-risk section of the MRS/GTS station, while the nodes “Fluid collector (Ζ-2991)”, “Central inlet valves (HV 901) and outlet (HV 906)”, “Line inlet valves (HV 902 and HV 904)”, “NG filters (O-2991 A and O-2991 S)” and “Heat exchangers (Μ-2991 A and Μ-2991 S)” (painted with green or yellow color) are the sections with the lowest risk. In addition, the node “NG Odorization system” (painted with orange color) is the section that presents a moderate risk.
Table 5. HAZOP study results for the deviations specified in the SCOPI’s Node #7 concerning the element “Level”, in association with (i) risk-matrix outcomes and the SC coding, and (ii) the depiction of appropriate guidewords, possible causes, consequences, safeguards and recommendations.
Node7
ElementLevel
GWDeviationPossible CauseConsequencesSafeguardsRisk MatrixRecommendations
SLR
MoreHigher Water level1. LT-121 Failure-Water flow to V-107
-Condensate stripper column malfunction
-Increased steam consumption
-Water to storage
1.1 Level Gauge43ACInstall a LSH alarm in V-110 boot
2. Line to Sour Water Treatment blocked2.1 High-Level Alarm LT-12144NSR
Higher NGL level3. LT-120 Failure-NGL to V-103
-Hydrocarbons loss to sour water treatment
3.1 Level Gauge43ACNone
4. Line to V-107 blocked4.1 High-Level Alarm LT-22044NSR
LessLower Water level5. LT-121 Failure-NGL to sour water treatement
-Loss of hydrocarbons
5.1 Level Gauge43ACInstall a LSL alarm in V-110 boot
Lower NGL level6. LT-120 Failure-NGL to V-103
-Hydrocarbons loss to sour water treatment
6.1 Level Gauge43ACNone
Table 6. HAZOP study results for the deviations specified in the SCOPI’s Node #7 concerning the element “Flow”, in association with (i) risk-matrix outcomes and the SC coding, and (ii) the depiction of appropriate guidewords, possible causes, consequences, safeguards and recommendations.
Node7
ElementFlow
GWDeviationPossible CauseConsequencesSafeguardsRisk MatrixRecommendations
SLR
MoreMore gas flow7. More gas flow from V-101 and C-101-Insufficient Cooling
-Water to V-107
-Increased steam consumption in V-108
-Water to crude storage
-Increased pressure
7.1 High-temperature alarm T-104
7.2 PSV-134/135 will open to flare
44NSRNone
8. PT-113 Failure43AC
More air flow through E-1049. TC-104 Failure-Lower gas temperature
-Hydrate formation
-Pressure upstream increase
None33ACInstall a TSL alarm on E-104 exit
LessLess gas flow10. Less gas flow from V-101None321
11. PT-113 Failure11. PSL-114 C-101 shutdown33ACNone
Less air flow through E-10412. TC-104 Failure-Higher gas temperature
-No condensate
-Water to V-107
12.1 High-temperature alarm T-10433ACNone
ReverseReverse water flow13. Check valve failure-Increased water level
-Water flow to V-107
-Condensate stripper column malfunction
-Increased steam consumption
-Water to storage
13.1 High-Level Alarm LT-12133ACNone
NoNo gas flow14. PT-118 Failure- Increased pressure14.1 PSV-134/135 will open to flare231None
15. Gas line to V-107 blocked24ACNone
Table 7. HAZOP study results for the deviations specified in the SCOPI’s Node #7 concerning the element “Pressure”, in association with (i) risk-matrix outcomes and the SC coding, and (ii) the depiction of appropriate guidewords, possible causes, consequences, safeguards and recommendations.
Node7
ElementPressure
GWDeviationPossible CauseConsequencesSafeguardsRisk MatrixRecommendations
SLR
MoreMore pressure16. PT-118 Failure-Vessel fracture
-H2S release
-Explosion hazard
16.1 PSV-134/135 will open to flare231Install a PSH alarm in V-110
17. Pipeline to V-107 blocked24AC
LessLess pressure18. Loss of containment-H2S release
-Explosion hazard
16.2 H2S alarm
16.3 Explosive alarm
24ACInstall a PSL alarm in V-110
Table 8. HAZOP study results for the deviations specified in the SCOPI’s Node #7 concerning the element “Temperature”, in association with (i) risk-matrix outcomes and the SC coding, and (ii) the depiction of appropriate guidewords, possible causes, consequences, safeguards and recommendations.
Node7
ElementTemperature
GWDeviationPossible CauseConsequencesSafeguardsRisk MatrixRecommendations
SLR
MoreHigher gas temperature19. TC-104 Failure-Water to V-107
-Increased steam consumption in V-108
-Water to crude storage
None43ACInstall a TSH alarm at E-104 output
20. High ambient temperature-Water to V-107
-Increased steam consumption
in V-108
-Water to crude storage
17.1 High-temperature alarm TC-10443ACNone
LessLower gas temperature21. TC-104 Failure-Hydrate formation18.1 PSV-134/135 will open to flare33ACNone
Table 9. HAZOP study results for the deviations specified in the SCOPI’s Node #7 concerning the element “Containment”, in association with (i) risk-matrix outcomes and the SC coding, and (ii) the depiction of appropriate guidewords, possible causes, consequences, safeguards and recommendations.
Node7
ElementContainment
GWDeviationPossible CauseConsequencesSafeguardsRisk MatrixRecommendations
SLR
NoNo Containment22. Fractured Vessel-Sour water spill
-H2S release
-Fire hazard
-Explosion hazard
19.1 H2S Alarm
19.2 Explosives Alarm
222Install a PSL alarm at V-110
23. Fractured pipeline222
24. Valve opened to atmosphere24ACAllow only qualified personnel to operate valves
Figure 6. Safety-color mapping by the application of the synergetic HAZOP-DMRA-SCM method at the workplaces of a SCOPI.
Processes 09 01299 g006
Figure 7. Safety-color mapping by the application of the cooperative HAZOP-DMRA-SCM method at the workplaces of a SCOPI, taking into consideration for each node the most frequent colors.
Processes 09 01299 g007
Table 10. HAZOP results along with the risk ranking by the DMRA for the MRS/GTS.
RankingSection (Node)DescriptionSLR
1Pressure regulators (PCV 910 and PCV 920)
1.
Installation of flow control system in the pressure regulator
2.
Suitable limit for automatic line isolation only for safety reasons
3.
NG pressure reduction
312
2Total MRS/GTSInstallation of CCTV system with 24 h monitoring—Strengthening of measures to prevent intrusion321
3Fluid collector (Ζ-2991)Failure to inspect container during operation—Investigation of fluid retention alternative34AC
4Central inlet valves (HV 901) and outlet (HV 906)
1.
Install an additional non-return valve in the lubricant inlet device
2.
Installation of an additional shell isolation valve
34AC
5Line inlet valves (HV 902 and HV 904)
3.
Install an additional non-return valve in the lubricant inlet device
4.
Installation of an additional shell isolation valve
44NSR
6NG filters (O-2991 A and O-2991 S)Installation of heating tape (heat tracing) around the drain pipe35NSR
7Heat exchangers (Μ-2991 A and Μ-2991 S)Regular preventive inspection of NG yards44NSR
Figure 8. The SCM map generated by the cooperative HAZOP-DMRA-SCM technique at the workplaces of an MRS/GTS.
Processes 09 01299 g008

6. Discussion

Undeniably, the diversity of RAA methods in OSH is such that there is plenty of efficient approaches for the most cases, and countless studies build up synergetic techniques mingling with distinct RAA processes. The reason that the scientific literature develops an increasing tendency to merge different RAA methods stems from the fact that each discrete RAA process has its own strict constraints and defects in its approach to different incidents, and consequently it cannot attain the optimum RAA outcomes at the OSH workplaces.
The matter of the above paragraph makes up the research context of this work, and accordingly, its substantial contribution is mentioned as follows: The implementation of a collaborative RAA framework by the synergy of HAZOP, DMRA and SCM processes, with the intention of identifying critical points and prioritizing risks, and also visualizing the OSH situation, at the workplaces (i) of a SCOPI, and (ii) of a MRS/GTS station, that they are situated in Greece. Firstly, the conventional HAZOP analysis (which is one of the most widely used techniques in process industries) is executed in order to identify the potential fault causes of abnormal conditions (deviations) in the plants. With the outcomes of the HAZOP and DMRA processes, SCMs are procreated for the specific SCOPI, which could be a valuable means for safety managers to assess: (i) the OSH situation (or risk level) of the company and (ii) the urgency of investing confined resources in actions to prevent several risks.
The selection of these particular facilities (i.e., SCOPI, MRS/GTS) is appropriate for the application of the HAZOP-DMRA-SCM synergy, and greatly valuable for its demonstration, because of the plentiful hazards these facilities comprise. What is more, a SCOPI and also a GTS are greatly important systems for any local economy, because of the wide-ranging economic profits they offer, and also for the job opportunities they provide. Nonetheless, similar to all chemical process industries (CPI), there is constantly present an existing potential for disaster. On the other hand, the experience during the past sixty years confirms that with the correct risk-management, a catastrophe could be eliminated.
Furthermore, the expression “safety-colors” (SC) is applied to define the standard treatment of colors for safety objectives at a workplace. It is worth mentioning that the use of SCs can enhance the visibility of OSH signs (and also the visibleness of OSH state) in the worksites of any company, so that SCs are extensively used in facilities and equipment and that their handling is normally mandated by industrial regulations. In fact, standardized rules for SCs in the workplaces enforce the so-called “visual communication”, which can help the personnel to be effortlessly familiar with (and understand) the meaning being attributed. Thus, the SCM color maps stand for valuable and intuitional meanings for the workers to recognize (by realizing the risk level at each workplace) the safe working environment. On the other hand, SCs are not broadly utilized in the field of OSH, even though it is evident that their utilization can enhance the visibility of the OSH status in the worksite of a company. Consequently, their worth becomes fundamental for the businesses, especially for the process industries.
The results of the HAZOP-DMRA-SCM execution in the examined SCOPI unveiled that this facility seems to be reliable and safe, taking into account that (i) the Node #3 (painted with green color in Figure 6) and Nodes #2 and #6 (painted with yellow color) are subunits with low risk, and (ii) Nodes #4, #5, #8 and #9 (painted with orange color) are subunits that present a moderate risk. However, Nodes #1 and #7 (painted with red color in Figure 6) are sections with the highest risk. In other words, the usage of the HAZOP-DMRA-SCM technique disclosed that the examined SCOPI proved to be constituted by subunits which engage critical risks (according to the results of Table 9).
Hence, this finding constitutes a noteworthy difference in comparison with previous works by Marhavilas et al. (2020a, b) [31,32], wherein there existed a confirmation of the SCOPI’s uppermost safety level, absolutely for all subunits (i.e., PFD nodes) as far as the considerable risks are concerned, which had arisen during its operation for many years. More specifically, according to these works, the unique hazards identified entirely by the conventional HAZOP study were grouped into three categories, first the “hazards to human life and the environment” originating from the installation, second the “operability hazards”, i.e., the hazards reacting on the product quality and economic operation of the installation, and third, the “hazards with both economic and health (or environmental) impact”, i.e., the hazards that affect the economic performance of the installation and simultaneously pose a danger to human life or the environment. Therefore, whereas the conventional HAZOP showed that the safety level was highest for all subsystems, the joint HAZOP-DMRA-SCM approach revealed important risks in some subunits of the plant, i.e., in the ones which were painted with red or orange SCs.
Similarly, the results of the HAZOP-DMRA-SCM application in the examined MRS/GTS station showed that the node concerning the “SKID Actuation Gas” and “NG Analysis” subunits (painted with red color in Figure 8) is the one with the highest risk, which means the specific MRS/GTS facility has been proven to incorporate a subunit which engages critical risks (according to the results of Table 10).
Consequently, safety-color mapping through the HAZOP-DMRA-SCM synergy is certainly precious for safety operators to (i) recognize nodes with lofty levels of risk, and (ii) to appraise the requirement of investing a limited budget in measures preventing precise types of hazards. The safety administrator, who is the accountable person to decide the extent and the kinds of SCMs chosen for attaining the finest RAA study concerning the specified facilities, could generate numerous supplementary SCMs taking into account various sensitivity scenarios and/or a range of risk acceptance criteria (RAC). It is worth noting that several constructive sensitivity scenarios with significant consequences could be as follows:
  • How would SCMs change if the actions recommended by the HAZOP team would be implemented?
  • How would SCMs change if the HAZOP team made inappropriate node selection?
For instance, the worst nodes in the SCOPI’s workplaces, as far as the safety level is concerned, are the Nodes #1 and #7 (identified in Figure 6). Therefore, if the node selection by the HAZOP team was faulty (or improper), then an unacceptable (or critical) risk (according to risk escalation of Table 3 and the safety-color mapping of Figure 6) would cover a larger (or smaller) area of the plant, and therefore would lead to irregular conclusions for the safety assessment, and especially for investing a limited budget in measures preventing precise types of hazards. Similar ascertainments can be made for the MPS/GTS station based on the SCMs of Figure 8.
An additional example, that is associated with the SCMs and the best chosen RACs, is displayed graphically in Figure 7, wherein an alternative SCM is illustrated taking into account not the colors of the highest-risk deviations (in the SCOPI nodes), but the most frequent SCs, i.e., with the highest relative frequency relating to the total number of possible causes of the node’s deviations, which have been defined by HAZOP. Thus, Nodes #1, #4, #6 and #9 (painted with orange color) are the units presenting a moderate risk.
Comparing Figure 6 and Figure 7, we note that their SCMs have been switched from the worst one to the best one (i.e., with an upgraded risk level). Such a difference can result in a crucial impact on the risk assessment outcomes, and certainly, on the measures and the investment budget used by the safety managers to prevent special kinds of hazards and to protect the employees. Thus, if the safety manager selects inappropriate (or unsuitable) sensitivity scenarios and/or RACs, then there will be ineligible conclusions for the risk assessment, affecting the investment budget in measures ameliorating OSH. Moreover, a safety manager has the possibility to create more detailed and analytical (and consequently more colorful) SCMs, after concentrating on the individual elements of each PFD node. So, a focus on the nodes with the highest risk deviation (painted with red or orange color) would unveil significant OSH issues.
An additional interesting approach that a safety manager could use to generate other significant SCMs is the ranking (as far as the OSH risk level is concerned) of the possible causes of the nodes’ deviations (illustrated with different colors in Table 5, Table 6, Table 7, Table 8 and Table 9, regarding the SCOPI), by the usage of various risk-ranking techniques, such as the multi-criteria decision-making (MCDM), for instance the typical (T_AHP) and fuzzy (F_AHP) analytical hierarchy processes (AHP), presented in the articles of Marhavilas et al. (2019, 2020a, 2020b) [16,31,32]. More specifically, for each node, the safety manager can use the color of the dominant deviation forming in the SCM’s, i.e., with the highest ranking. Hence, we have applied this issue in the HAZOP’s results of Table 10, which demonstrates, among other information, the risk-ranked nodes of the MRS/GTS station by the application of the DMRA tool. In addition, Figure 8 substantially illustrates the corresponding SCM, which has been generated according to this idea, i.e., by the incorporation of a risk-ranking action in the process of deriving a SCM, through the HAZOP outcomes.
The transfer of information to people using visual communications is considerably significant in hard working environments. Therefore, though plain black text on a white background is good for some cases, others can take advantage of the color to add different levels of contrast and improve visibility. As far as the SC training is concerned, all new employees (even seasoned employees) ought to be thoroughly trained (within the first days of their employment) about what the safety colors mean and what the SCMs are in all the situations that apply to the workplaces of the facility. Besides, all employees should be informed whenever there is an alteration in the SCMs concerning the workplaces of the company, and this must be carried out through a formal training procedure (or in a meeting with a director). It is the employer’s task to ensure all employees are up to date with the newest SCMs. This will not only keep facilities and employees safe, but will also help avoid the risk of non-compliance with OSHA regulations.
Furthermore, OSH visualizations by utilizing SCMs, resulting from simulation models, could be broadly used for estimating the likelihood of risks in the workplaces. The selection of an appropriate form of visualization as well as well-organized SCMs is crucial to avoid errors when interpreting the data. This paper contributes to the creation of valuable SCMs for visualizing the OSH level of a SCOPI and an MRS/GTS station.
Various future research directions (FRD) can be highlighted as follows:
FRD #1: As a future work, the proposed methodology could be improved by reproducing the risk results by SCMs, based on software algorithms, such as the MATLAB software environment. Firstly, risk data regarding the magnitude of risk (R) could be collected by the implementation of the PRAT method presented in the literature. After that, a MATLAB algorithm could: (i) read the resulted risk values, R (i.e., input data), stored in a database, (ii) calculate the average value for the risk numbers, R, and (iii) reproduce the R values according to a statistical technique which lessens the statistical error MSD (mean squared deviation). Finally, the MATLAB algorithm would generate the SCMs in order to facilitate the analysis of the risk results. In each SCM, a color-scale on the bottom could represent the range of possible risk values, R, concerning the company’s workplace. The additional usage of a coordinate system (by x- and y-axes) could represent the dimensions of the examined workplace in meters (m), mapping the data onto the facility’s layout. Based on the generated SCMs, it is feasible export a precise zoom-algorithm to straightforwardly recognize the main critical areas (i.e., with high risk levels), such as the one implemented by Morgado et al. (2017) [57].
FRD #2: It is necessary to note that in the HAZOP-DMRA-SCM application, the DMRA-modus is valuable to rank (first ranking) the identified risks (hierarchy of risks) in the SCOPI and MRS/GTS plants, while the additional usage of a fault tree analysis (FTA) could be versatile for identifying potential failures that raise the level of risk, and for a further risk ranking (second ranking). Particularly, FTA is a well-known DET method and an important methodical tool worldwide, which has been used effectively by reliable experts in failure analysis and for the reliability and safety of complex technical systems, and also of OSH systems. This approach can associate hardware failures with human failures, and it is constructed by relating the sequences of events, which, individually, could lead to the top event. Therefore, a renewal of the initially suggested (in Figure 5) collaborative framework by HAZOP/DMRA/SCM/FTA is presented in Figure 9, unveiling the usefulness of the FTA tool. The indicative application of the FTA method in the examined MRS/GTS station reveals new protection measures that aim at the prevention of incidents and include issues of specifications and quality control of materials, maintenance planning and/or monitoring of specific equipment, handling procedures, etc.
FRD #3: A further remarkable method that a safety officer could apply in order to generate other noteworthy SCM, is the incorporation of a risk-ranking action in the process of deriving a SCM, and in particular, the risk-ranking of the nodes’ deviations by using various MCDM techniques, such as the AHP, the typical AHP, the Fuzzy-AHP, the TOPSIS, the Fuzzy-TOPSIS, etc.

7. Conclusions

-
This work dealt with combining multiple well-established safety assessment techniques to create a unique robust methodology to pinpoint the most hazardous areas at the OSH workplaces and to identify its possible causes and consequences.
-
The synergetic HAZOP-DMRA-SCM technique applied on the specific SCOPI and MRS/GTS facilities showed that in general, these proved to be reliable and safe, under the condition that the right equipment inspections and maintenance are imposed.
-
The OSH visualization of the SCOPI and MRS/GTS workplaces (by using safety-color mapping) could certainly help the safety officer to: (i) diminish or abolish the more critical risk factors, which are concentrated on specific parts (or PFD nodes) of the installation (painted with red or orange color), and (ii) more efficiently protect the employees, by taking the most essential safety measures. This will probably contribute to achieving an improved allotment of the limited financial resources and shrink mortgage costs and support, allowing financial managers to have more available budget for implementing other risk-reduction projects.
-
As a general conclusion, a separate RAA technique cannot accomplish the optimum risk assessment result at the workplaces. On the other hand, collaborative methodologies, such as the proposed HAZOP-DMRA-SCM (but also the future implemented HAZOP-DMRA-SCM-FTA) framework, can provide a trustworthy basis to improve OSH and process safety of the specific industrial plants.
-
The novelty of this article is fulfilled through the suggested newfangled RAA methodological approach by the amalgamation of the four different above-mentioned techniques in order to upgrade OSH and to validate the sustainable operation of industrial and technical engineering projects.

Author Contributions

Conceptualization, P.K.M.; data curation, P.K.M. and M.F.; formal analysis, P.K.M.; investigation, P.K.M.; methodology, P.K.M.; writing—original draft, P.K.M.; writing—review and editing, P.K.M., G.K.K. and D.E.K. All authors have read and agreed to the published version of the manuscript.

Funding

This research received no external funding.

Institutional Review Board Statement

The study was conducted according to the guidelines of the Declaration of Helsinki, and approved by the Institutional Review Board (or Ethics Committee) of NAME OF INSTITUTE (protocol code XXX and date of approval).

Informed Consent Statement

Not applicable

Acknowledgments

The authors acknowledge V. Petropoulos for his donation in kind (i.e., some material used).

Conflicts of Interest

We declare no conflict of interest.

Acronyms and Abbreviations

AHPAnalytical Hierarchy Process
ANSIAmerican National Standards Institute
ASMEAmerican Society of Mechanical Engineers
BIMBuilding Information Modeling
BIFPETBelief in Fuzzy Probability Estimations of Time
CCPSCenter for Chemical Process Safety
CCSCreative Safety Supply
CCTVClosed Circuit Tele-Vision
CIAChemical Industries Association
CPIChemical Process Industry
DETDeterministic
DMRADecision-Matrix Risk Assessment
EPSCEuropean Process Safety Centre
ETAEvent-Tree Analysis
FEAHPFuzzy Extended Analytical Hierarchy Process
FMEAFailure Mode and Effect Analysis
FMECAFailure Mode, Effects and Criticality Analysis
FMEDAFailure Mode, Effects and Diagnostic Analysis
FRDFuture Research Directions
FTAFault-Tree Analysis
FVFlow Valves
F_AHPFuzzy Analytical Hierarchy Process
GWGuideword
GTSGas Transportation System
HAZOPHazard and Operability
ICIImperial Chemical Industries
IECInternational Electrotechnical Commission
LOPALayer of Protection Analysis
LVLevel Valves
MCDMMulti-Criteria Decision-Making
MRSMeasurement and Regulatory Station
MSDMean Squared Deviation
NGNatural Gas
NGLNatural Gas Liquids
NSRNo Special Risk
OHSSOccupational Health and Safety System
OSHOccupational Safety and Health
OSHAOccupational Safety/Health Administration
PFDProcess Flow Diagrams
PHAPreliminary Hazard Analysis
PHSAPreliminary Human Safety Assessment
PICPressure Indicator Controller
PIDPiping and Instrumentation Diagram
PRATProportional Risk Assessment Technique
PSVPressure Safety Valve
PTPressure Transmitter
PVPressure Valve
QFDQuality Function Deployment
QRAQuantitative Risk Assessment
QREQuantified Risk Evaluation
RARisk Assessment
RAARisk Analysis and Assessment
RACRisk Acceptance Criteria
RVRelief Valves
SCSafety Colors
SCEASafety and Critical Effect Analysis
SCMSafety-Color Map (or Mapping)
SCOSour Crude Oil
SCOPISour Crude-Oil Process Industry
SILSafety Integrity Level
SMSSafety Management System
STOStochastic
STPASystem Theoretical Process Analysis
TSPTime-Series Processes
T_AHPTypical Analytical Hierarchy Process
TOPSISTechnique for Order Performance by Similarity to Ideal Solution
XPA-HAZOPExpanded HAZOP

References

  1. Soares, C.; Teixeira, A. Risk assessment in maritime transportation. Reliab. Eng. Syst. Saf. 2001, 74, 299–309. [Google Scholar] [CrossRef]
  2. Zheng, X.; Liu, M. An overview of accident forecasting methodologies. J. Loss Prev. Process Ind. 2009, 22, 484–491. [Google Scholar] [CrossRef]
  3. Shen, H.-F.; Jia, L.-M. Regional road network traffic safety risk analysis and control strategies. Transp. Syst. Eng. Inf. Technol. 2011, 11, 187–192. Available online: https://www.scopus.com/inward/record.uri?eid=2-s2.0-80555139284&partnerID=40&md5=7f8f3ce5187350cc20167519c99d841e (accessed on 26 July 2021).
  4. Marhavilas, P.; Koulouriotis, D.; Gemeni, V. Risk analysis and assessment methodologies in the work sites: On a review, classification and comparative study of the scientific literature of the period 2000–2009. J. Loss Prev. Process Ind. 2011, 24, 477–523. [Google Scholar] [CrossRef]
  5. Cui, L.; Shu, Y.; Wang, Z.; Zhao, J.; Qiu, T.; Sun, W.; Wei, Z. HASILT: An intelligent software platform for HAZOP, LOPA, SRS and SIL verification. Reliab. Eng. Syst. Saf. 2012, 108, 56–64. [Google Scholar] [CrossRef]
  6. Marcoulaki, E.C.; Papazoglou, I.A.; Konstandinidou, M. Prediction of occupational accident statistics and work time loss distributions using Bayesian analysis. J. Loss Prev. Process Ind. 2012, 25, 467–477. [Google Scholar] [CrossRef]
  7. Kim, S.K.; Kim, Y.S. An evaluation approach using a HARA and FMEDA for the hardware SIL. J. Loss Prev. Process Ind. 2013, 26, 1212–1220. [Google Scholar] [CrossRef]
  8. Vianello, C.; Maschio, G. Risk analysis of LNG terminal: Case study. Chem. Eng. Trans. 2014, 36, 277–282. [Google Scholar] [CrossRef]
  9. Mentes, A.; Ozen, E. A hybrid risk analysis method for a yacht fuel system safety. Saf. Sci. 2015, 79, 94–104. [Google Scholar] [CrossRef]
  10. Mechhoud, E.-A.; Rouainia, M.; Rodriguez, M. A new tool for risk analysis and assessment in petrochemical plants. Alex. Eng. J. 2016, 55, 2919–2931. [Google Scholar] [CrossRef] [Green Version]
  11. Sun, F.; Xu, W.; Wang, G.; Sun, B. A technique to control major hazards of the coal gasification process developed from critical events and safety barriers. Process Saf. Prog. 2017, 36, 382–391. [Google Scholar] [CrossRef]
  12. Goerlandt, F.; Khakzad, N.; Reniers, G. Validity and validation of safety-related quantitative risk analysis: A review. Saf. Sci. 2017, 99, 127–139. [Google Scholar] [CrossRef]
  13. Nemet, A.; Klemeš, J.J.; Kravanja, Z. Heat Exchanger Network synthesis considering risk assessment for entire network lifetime. Chem. Eng. Trans. 2017, 57, 307–312. [Google Scholar] [CrossRef]
  14. Karasan, A.; Ilbahar, E.; Cebi, S.; Kahraman, C. A new risk assessment approach: Safety and Critical Effect Analysis (SCEA) and its extension with Pythagorean fuzzy sets. Saf. Sci. 2018, 108, 173–187. [Google Scholar] [CrossRef]
  15. Dallat, C.; Salmon, P.; Goode, N. Risky systems versus risky people: To what extent do risk assessment methods consider the systems approach to accident causation? A review of the literature. Saf. Sci. 2019, 119, 266–279. [Google Scholar] [CrossRef]
  16. Marhavilas, P.K.; Filippidis, M.; Koulinas, G.K.; Koulouriotis, D.E. The integration of HAZOP study with risk-matrix and the analytical-hierarchy process for identifying critical control-points and prioritizing risks in industry—A case study. J. Loss Prev. Process Ind. 2019, 62. [Google Scholar] [CrossRef]
  17. Gul, M. A fuzzy-based occupational health and safety risk assessment framework and a case study in an international port authority. J. Mar. Eng. Technol. 2019, 19, 161–175. [Google Scholar] [CrossRef]
  18. Gul, M. Development and application of a novel hybrid occupational risk assessment model. Int. J. Reliab. Saf. 2020, 14, 116. [Google Scholar] [CrossRef]
  19. Mouras, F.; Badri, A. Survey of the Risk Management Methods, Techniques and Software Used Most Frequently in Occupational Health and Safety. Int. J. Saf. Secur. Eng. 2020, 10, 149–160. [Google Scholar] [CrossRef]
  20. Cinar, U.; Cebi, S. A Hybrid Risk Assessment Method for Mining Sector Based on QFD, Fuzzy Logic and AHP. Adv. Intell. Syst. Comput. 2019, 39, 1198–1207. [Google Scholar] [CrossRef]
  21. Hrymak, V.; De Vries, J.M.A. The development and trial of systematic visual search: A visual inspection method designed to improve current workplace risk assessment practice. Policy Pr. Health Saf. 2020, 18, 9–24. [Google Scholar] [CrossRef]
  22. Celik, E.; Gul, M. Hazard identification, risk assessment and control for dam construction safety using an integrated BWM and MARCOS approach under interval type-2 fuzzy sets environment. Autom. Constr. 2021, 127, 103699. [Google Scholar] [CrossRef]
  23. Kuleshov, V.V.; Skuba, P.Y.; Ignatovich, I.A. Assessment of the Severity of the Last Accident Based on the Fine-Kinney Method. IOP Conf. Ser. Earth Environ. Sci. 2021, 720. [Google Scholar] [CrossRef]
  24. Vtorushina, A.; Anishchenko, Y.; Liukiiu, E. Cause Analysis of the Facility Failure Leading to the Explosion. Stud. Syst. Decis. Control 2021, 351, 155–167. [Google Scholar] [CrossRef]
  25. Ahmed, A.; Alkahtani, M.; El-Tamimi, A.M.; Kaid, H.; Abidi, M.H. Developing a Model for Safety Risk Assessment under Uncertainty for the Manufacturing Industry: A Case Study of Pole Factory Hazards in Riyadh, Saudi Arabia. Math. Probl. Eng. 2021, 2021, 1–13. [Google Scholar] [CrossRef]
  26. Mutlu, N.G.; Altuntas, S. Risk analysis for occupational safety and health in the textile industry: Integration of FMEA, FTA, and BIFPET methods. Int. J. Ind. Ergon. 2019, 72, 222–240. [Google Scholar] [CrossRef]
  27. Babaei, M.; Roozbahani, A.; Shahdany, S.M.H. Risk Assessment of Agricultural Water Conveyance and Delivery Systems by Fuzzy Fault Tree Analysis Method. Water Resour. Manag. 2018, 32, 4079–4101. [Google Scholar] [CrossRef]
  28. Yasli, F.; Bolat, B. A risk analysis model for mining accidents using a fuzzy approach based on fault tree analysis. J. Enterp. Inf. Manag. 2018, 31, 577–594. [Google Scholar] [CrossRef] [Green Version]
  29. Gul, M.; Ak, M.F. A comparative outline for quantifying risk ratings in occupational health and safety risk assessment. J. Clean. Prod. 2018, 196, 653–664. [Google Scholar] [CrossRef]
  30. Fuentes-Bargues, J.L.; González-Cruz, M.C.; González-Gaya, C.; Baixauli-Pérez, M.P. Risk Analysis of a Fuel Storage Terminal Using HAZOP and FTA. Int. J. Environ. Res. Public Health 2017, 14, 705. [Google Scholar] [CrossRef]
  31. Marhavilas, P.K.; Filippidis, M.; Koulinas, G.K.; Koulouriotis, D.E. An expanded HAZOP-study with fuzzy-AHP (XPA-HAZOP technique): Application in a sour crude-oil processing plant. Saf. Sci. 2020, 124, 104590. [Google Scholar] [CrossRef]
  32. Marhavilas, P.K.; Tegas, M.G.; Koulinas, G.K.; Koulouriotis, D.E. A Joint Stochastic/Deterministic Process with Multi-Objective Decision Making Risk-Assessment Framework for Sustainable Constructions Engineering Projects—A Case Study. Sustainability 2020, 12, 4280. [Google Scholar] [CrossRef]
  33. CIA. A Guide to Hazard and Operability Studies; Imperial Chemical Industries and Chemical Industries Associations Ltd.: London, UK, 1977. [Google Scholar]
  34. Andow, P. Improvement of operator reliability using expert systems. Reliab. Eng. 1986, 14, 309–319. [Google Scholar] [CrossRef]
  35. Kletz, T. HAZOP & HAZAN Identifying and Assesing Process Industy Hazards; CRC Press: Boca Raton, FL, USA, 1999. [Google Scholar]
  36. CCPS (Center for Chemical Process Safety). Guidelines for Process Safety Documentation; American Institute of Chemical Engineers (AICE): New York, NY, USA, 1995. [Google Scholar]
  37. CCPS (Center for Chemical Process Safety). Layer of Protection Analysis- Simplified Process Risk Assessment; American Institute of Chemical Engineers: New York, NY, USA, 2001; ISBN 978-0-8169-0811-0. [Google Scholar]
  38. CCPS (Center for Chemical Process Safety). Guidelines for Hazard Evaluation Procedures; American Institute of Chemical Engineers: New York, NY, USA, 2008. [Google Scholar]
  39. Swann, C.; Preston, M. Twenty-five years of HAZOPs. J. Loss Prev. Process Ind. 1995, 8, 349–353. [Google Scholar] [CrossRef]
  40. Alaei, R.; Mansoori, S.A.A.; Moghaddam, A.H.; Mansoori, N. Safety assessment approach of hazard and operability (HAZOP) for sulfur recovery unit Claus reaction furnace package; blower; heat exchanger equipment in South Pars gas processing plant. J. Nat. Gas Sci. Eng. 2014, 20, 271–284. [Google Scholar] [CrossRef]
  41. Mentzer, R.A.; Zhang, J.; Xu, W.; Mannan, S.M. What Does “Safe” Look and Feel Like? J. Loss Prev. Process Ind. 2014, 32, 265–275. [Google Scholar] [CrossRef]
  42. Herrera, M.A.D.L.; Luna, A.S.; Costa, A.C.A.D.; Lemes, E.M.B. Risk Analysis: A Generalized Hazop Methodology State-of-the-Art, Applications, and Perspective in the Process Industry. 2018. Available online: https://www.arca.fiocruz.br/bitstream/icict/27023/2/Risk_Analysis_A_generalized_Hazop_methodology_stat.pdf (accessed on 10 September 2020).
  43. Cheraghi, M.; Baladeh, A.E.; Khakzad, N. A fuzzy multi-attribute HAZOP technique (FMA-HAZOP): Application to gas wellhead facilities. Saf. Sci. 2019, 114, 12–22. [Google Scholar] [CrossRef]
  44. Guo, L.; Kang, J. An extended HAZOP analysis approach with dynamic fault tree. J. Loss Prev. Process Ind. 2015, 38, 224–232. [Google Scholar] [CrossRef]
  45. Reniers, G.L.L.; Dullaert, W.; Ale, B.J.M.; Soudan, K. The use of current risk analysis tools evaluated towards pre-venting external domino accidents. J. Loss Prev. Process Ind. 2005, 18, 119–126. [Google Scholar] [CrossRef]
  46. Domínguez, C.R.; Martínez, I.V.; Peña, P.M.P.; Ochoa, A.R. Analysis and evaluation of risks in underground mining using the decision matrix risk-assessment (DMRA) technique, in Guanajuato, Mexico. J. Sustain. Min. 2019, 18, 52–59. [Google Scholar] [CrossRef]
  47. Crowl, D.A.; Louvar, J.F. Chemical Process Safety: Fundamentals with Applications: Fundamentals with Applications, 3rd ed.; Prentice Hall: Boston, NJ, USA, 2011; ISBN 9780132901048. [Google Scholar]
  48. Herbert, I.L. Learning the Lessons-Retrospective HAZOPs. In Proceedings of the SPE Offshore Europe Oil and Gas Conference and Exhibition, Aberdeen, UK, 6–8 September 2011. [Google Scholar]
  49. Gujar, A. Myths of Hazop and Hazan. J. Loss Prev. Process Ind. 1996, 9, 357–361. [Google Scholar] [CrossRef]
  50. Crawley, F.; Tyler, B. HAZOP: Guide to Best Practice; Elsevier: Rugby, UK, 2000. [Google Scholar]
  51. CSS, Creative Safety Supply. Safety Colors. 2016. Available online: https://www.creativesafetysupply.com/articles/safety-colors/ (accessed on 27 August 2020).
  52. IEC 61511. Functional Safety: Safety Instrumented Systems for the Process Sector; International Electrotechnical Commission: Geneva, Switzerland, 2003. [Google Scholar]
  53. Filippidis, M. Hazard and Operability Study of a Sour Crude Oil Processing Plant. Master’s Thesis, Department of Production and Management Engineering, Democritus University of Thrace (DUTH), Xanthi, Greece, 2017. [Google Scholar]
  54. Petropoulos, V. Hazard and Operability Study (HAZOP) for a Unit of Measurement and Pressure Reduction of a Natural Gas Transmission System. Bachelor’s Thesis, Department of Engineering Project Management, Faculty of Science & Technology, Hellenic Open University, Patra, Greece, 2021. Available online: https://apothesis.eap.gr/handle/repo/50754 (accessed on 21 June 2021). (In Greek).
  55. ISO/IEC. Guide 51 (1999) Safety Aspects—Guidelines for Their Inclusion in Standards, ISO/IEC, 2nd ed.; ISO Copyright Office: Geneva, Switzerland, 1999. [Google Scholar]
  56. ISO/IEC. Guide 73 (2009). Risk Management-Vocabulary; ISO Copyright Office: Geneva, Switzerland, 2009. [Google Scholar]
  57. Morgado, M.; Talaia, M.; Teixeira, L. A new simplified model for evaluating thermal environment and thermal sensation: An approach to avoid occupational disorders. Int. J. Ind. Ergon. 2017, 60, 3–13. [Google Scholar] [CrossRef]
Figure 1. Depiction of the HAZOP flow-chart, used in the HAZOP study of a SCOPI and of an MRS/GTS station.
Processes 09 01299 g001
Figure 9. A renewal of the initially suggested collaborative framework by HAZOP/DMRA/SCM/FTA.
Processes 09 01299 g009
Table 1. Fundamental risk-ranking criteria by the IEC (2003) documentation.
Risk Matrix (R)
Consequence Severity Levels (S)
SMSSSE
Cause Frequency Levels (L)LLR6R5R3
LMR5R4R2
LHR3R2R1
Annotations:
Minor (SM): Impact initially limited to local area of event with potential for broader consequence, if corrective action not taken
Serious (SS): Impact event could cause serious injury or fatality on site or off site
Extensive (SE): Impact event that is five or more times severe than a serious event
Low (LL): A failure or series of failure with a very low probability of occurrence within the expected lifetime of the plant
Medium (LM): A failure or series of failure with a low probability of occurrence within the expected lifetime of the plant
High (LH): A failure can reasonably be expected to occur within the expected lifetime of the plant
Table 2. Parameters for a risk-matrix.
RankingLikelihoodSeverity
1Once per monthCatastrophic
2Once per yearSevere
3Once per 10 yearsMajor
4Once per 25 yearsSmall
5Once per 100 yearsNo impact, only Minor
Table 3. Illustration of a risk-matrix based on OSHA’s recommended color coding.
Processes 09 01299 i001
Table 4. HAZOP study elements and guidewords for the MRS/GTS.
A/ASection (Node)Planned Operation
1Central inlet valves (HV 901) and outlet (HV 906)Isolation of installation from the upstream network
2NG line from central inlet/outlet valve to inlet/outlet manifoldProvision and receipt of NG metering/regulatory lines
3Fluid collector (Ζ-2991)Retention of liquid elements transported by the NG
4Line inlet valves (HV 902 and HV 904)Isolate line input
5NG filters (O-2991 A and O-2991 S)Solid retention > 5 μm
6Heat exchangers (Μ-2991 A and Μ-2991 S)NG warm-up to avoid low NG temperature at the outlet
7Slam Shut Valves (PSV 908A, PSV 908B, PSV 918A, PSV 918B)Interruption of the NG flow in case of high or low outlet pressure of the pressure regulator
8Pressure regulators (PCV 910 and PCV 920)NG pressure reduction
9Turbine meters (FQI 901 and FQI 902)NG flow measurement
10Line output valves (HV 903 and HV 905)Line output isolation
11Pneumatic valve drive gas (actuation gas)Provision of means of operation of pneumatic mechanisms
12Hot water system—Fuel gasNG supply to the burners of the boilers
13Hot water system—Boiler water networkSupply of heat exchangers for the preheating of the NG
14Odorization systemIntroduction of odor medium in the NG before leaving the MRS/GTS
15NG analysis systemDetermination of NG composition
16Set of facilitiesNG distribution network supply—(pressure regulation, supply quantity measurement)
Publisher’s Note: MDPI stays neutral with regard to jurisdictional claims in published maps and institutional affiliations.

