Article

Impact of Particle Size on the Rheological Properties and Amylolysis Kinetics of Ungelatinized Cassava Flour Suspensions

1
School of Biotechnology and Food Technology, Hanoi University of Science and Technology, Hanoi 100000, Vietnam
2
Toulouse Biotechnology Institute, Bio & Chemical Engineering, Université de Toulouse, INSA, INRAE UMR792, CNRS UMR5504, 31077 Toulouse, France
3
Fédération de Recherche FERMAT (FR 3089), Université de Toulouse, CNRS, INPT, UPS, 31432 Toulouse, France
4
Institut de Mécanique des Fluides de Toulouse (IMFT), Université de Toulouse, CNRS, 31400 Toulouse, France
*
Author to whom correspondence should be addressed.
Processes 2021, 9(6), 989; https://doi.org/10.3390/pr9060989
Submission received: 9 May 2021 / Revised: 28 May 2021 / Accepted: 1 June 2021 / Published: 3 June 2021

Abstract

:
The effect of particle size on enzymatic hydrolysis of cassava flour at subgelatinization temperature was investigated. A multiscale physical metrology was developed to study the evolution of different physical-biochemical parameters: rheology, granulometry, and biochemistry. In this study, four fractions of cassava flour based on the particle sizes under 75 µm (CR075), 75–125 µm (CR125), 125–250 µm (CR250), and 250–500 µm (CR500) were screened for enzymatic hydrolysis effect. The results showed that all cassava flour suspensions exhibited a shear-thinning behavior, and the viscosity increased drastically with the increase of particle size. During hydrolysis, the viscosity reduced slightly and the non-Newtonian behavior became negligible beyond 4 h of the process. The particles size for CR075 and CR125 increased steadily in diameter mean. The samples of CR250 and CR500 showed more fluctuation by first decreasing, followed by increasing in particle sizes during the process. The highest hydrolysis yield was found for samples with particle size under 125 µm (89.5–90.7%), suggesting that mechanical treatment of cassava can enhance the bioconversion rate.

1. Introduction

The conventional starch-based sugar production technology requires a high energy consumption during liquefaction and saccharifications. This energy consumption can be reduced by decreasing the starch hydrolysis below gelatinization temperature [1]. This low-temperature technology is activated by several amylolysis enzymes that attack native starch (granular form) and by-pass the liquefaction and cooking steps as in the conventional process [2]. The enzymatic action occurs in several stages including solid surface diffusion, enzyme adsorption and hydrolysis. The mechanism of this biocatalytic depolymerization of raw starch has been well investigated for diluted conditions with starchy grains such as corn, triticale, wheat, etc. [3,4,5,6,7,8,9]. To scale-up the low-temperature hydrolysis process in a more economical and feasible way, two strategies have been developed: (i) to operate at very high gravity hydrolysis/fermentation (VHG) and (ii) to apply a dynamic control of process parameters [10].
VHG involves the preparation and/or fermentation of mash containing highly dissolved matter (>300·g·L−1) to yield a highly concentrated product [10]. This technology has been intensively applied in ethanol production from cereal grains but rarely on roots and tubers [11,12]. The high VHG viscosity affects heat, mass and momentum transfers which influences the hydrolysis yield of these heterogeneous biocatalytic reactions [13]. Many studies investigating suspension viscosity during cold hydrolysis and fermentation using ex-situ methods have shown that the main parameters affecting the hydrolysis process are the rheological behavior of the hydrolysis suspension and the flour particle size [12,14]. Those criteria are crucial for the selection of the suitable equipment, and for applying the strategic decision making [15].
In Vietnam, the tubers, cassava for example, is an interesting and suitable raw material for biorefinery industry due to: (i) available sources of plantation in various soil types and climate conditions; (ii) low production cost; (iii) all weather feedstock supplies (fresh and/or dry); (iv) high starch containing and (v) recycle wastes from ethanol process of cassava as high-value added products. In 2019, according to the General Statistic Office of Vietnam, the cassava production was about 10.1 million tons and Vietnam is now the second largest exporter of cassava products (chips and starch), after Thailand. The cassava compositions depend on different factors, such as variety, soils, climates, geographical zone and harvesting season. Considering the cultivars in South-East Asia, cassava roots are an essential source of starch (77–86% dry matter) but particularly low in protein (0.3–2.5% dry matter) [12,13,16,17].
This study investigates the impact of cassava flour granulometry on the suspension viscosity and hydrolysis yield at low-temperature by a multiscale approach combining in-situ physical and ex-situ biochemical analyses. This multiscale approach has been previously applied to investigate the deconstruction of lignocellulosic-based biomass for biorefinery purposes [18,19,20] and feed additives in animal nutrition [21]. The first step was to characterize the initial viscosity and rheological behavior of suspensions as a function of concentration and granulometry. The yields and in-situ viscosity were then considered during hydrolysis process. The particle size distribution was studied, especially under enzymatic reaction in relation to glucose conversion yield and suspension viscosity.

2. Materials and Methods

2.1. Experimental Devices

A specific experimental set-up was previously developed, consisting of a bioreactor (glass tank with a water jacket; diameter: 130 mm, height: 244 mm, volume: 2.0 L) connected with in-situ sensors for temperature, pH, rotation speed, and torque. An agitator was installed with a double impeller to minimize the difficulty in substrate mixing and to ensure suspension homogeneity [19].

2.2. Substrate and Enzyme

Fresh cassava (Manihot esculenta Crantz) was purchased directly from farmers in Son Duong district, Tuyen Quang province, Vietnam. The tuber was washed, chipped, and then dried in a hot air oven at 50 °C during approximately 24 h until its moisture was less than 12%. Their compositions (in % dry matter, moisture content: 11.2 ± 0.1% w/w) were: starch 78.9 ± 3.2; protein 2.0 ± 0.1; fat 0.32 ± 0.0; crude fiber 5.4 ± 0.2 and ash 1.5 ± 0.0. The cassava chips were grounded by hammer milling and the flours were then sifted in vertical multiple sieving with screen sizes of 75, 125, 250, and 500 µm (No. 200, 120, 60, and 30 mesh, respectively) to obtain four fractions. The obtained flour fractions were designated as CR075, CR125, CR250, and CR500 for flour with the particle sizes of under 75 µm, 75–125 µm, 125–250 µm, and 250–500 µm, respectively. These samples were then packed in zip-lock bags and stored in a dry place until use.
An enzyme cocktail (Stargen 002, ref. 3015155108, kindly provided by DuPont, Wilmington, DE, USA, 560 GAU/mL, one Glucoamylase Unit, GAU was the amount of enzyme that could liberate one gram of reducing sugars calculated as glucose per hour from soluble starch substrate) containing Aspergillus kawachi α-amylase expressed in Trichoderma reesei and a glucoamylase from Trichoderma reesei was used at a dosage of 0.8 GAU/g dm according to the manufacturer recommendations.

2.3. Total Starch, Reducing Sugar and Hydrolysis Yield

Total starch was deduced from reducing sugar content expressed in glucose after acid hydrolysis (HCl 2%) for 2 h. The reducing sugar was determined by the Dinitrosalicylic acid (DNS) method [22] with minor modifications as follows: 0.5 mL of hydrolysate after centrifugation was mixed with 1.5 mL DNS reagent and boiled for exactly 5 min. After cooling to room temperature, the absorbance of the mixture/reaction was recorded at 540 nm. The obtained reducing sugar was expressed in glucose equivalent. Hydrolysis yield was the ratio between the amount of released glucose and the potential amount of glucose. The means and standard deviations were determined for hydrolysis yield from at least three replicates. The significant difference of mean values was assessed with a one-way analysis of variance (ANOVA) followed by Duncan’s test using SPSS software at a significance level of p < 0.05.

2.4. Solvent Retention Capacity of Cassava Flour (SRC)

The enzymatic hydrolysis was carried out in acetate buffer (pH= 4.2), the retention capacity of acetate buffer of cassava flour was determined using a previously described method [23] with a minor modification. Five grams of each sample was weighed into a centrifuge tube, 30 mL of acetate buffer (pH = 4.2) was added and then vigorously mixed. The samples were allowed to stand for 30 min and centrifuged at 3000 rpm for 15 min. The supernatant was discarded and the obtained precipitate (wet gel) was weighed. The SRC was then calculated using the following Equation (1) and expressed as the moisture content of cassava flour before sieving (11.2% w/w):
W R C   ( % ) = { [ ( w e t   g e l   w e i g h t c a s s a v a   f l o u r   w e i g h t ) 1 ] · ( 100 11.2 100 m o i s t u r e   o f   c a s s a v a   f r a c t i o n ) · 100 }

2.5. Ex-Situ Rheometry

Viscosity measurements are usually measured on steady shear flows, which require a long time to obtain, especially for a low shear rate that is essential for measuring yield stress. However, these long-duration measurements are not compatible with the settling velocity observed for the studied suspensions. There are alternative methods to estimate the yield stress and one of them is based on oscillatory measurements [24]. In these methods, the viscoplastic behavior along with the determination of the yield stress was examined by carrying out a strain sweep at a fixed frequency of oscillation [24,25,26]. The storage modulus curve was typical for viscoplastic fluid, i.e., the constants: G′ and G″ in which, G′ is greater than G″ as long as the shear stress amplitude is lower than the yield stress, and a rapid decrease of G′ beyond this value. The storage modulus G′ and the loss modulus G″ were measured using a Mars III rheometer (Thermo Scientific, Karlsruhe, Germany). Dynamic measurements were recorded at 20 °C with serrated plates (60 mm, roughness 400 µm, gap size: 1.5 mm) on samples during hydrolysis. An oscillatory shear flow was firstly set up with an increase of shear stress amplitude from 0.1 to 20 Pa at a fixed frequency (1 Hz) to determine the region of linear behavior. These measurements give access to an estimation of the yield stress to evaluate the value of the shear stress corresponding to a 20% reduction of G′ from the linear region [19].

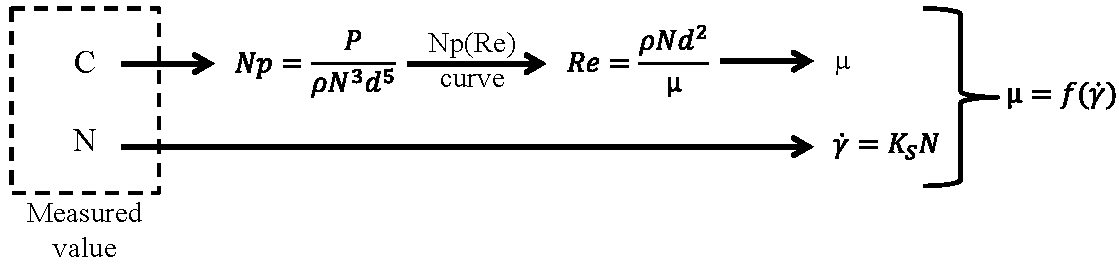
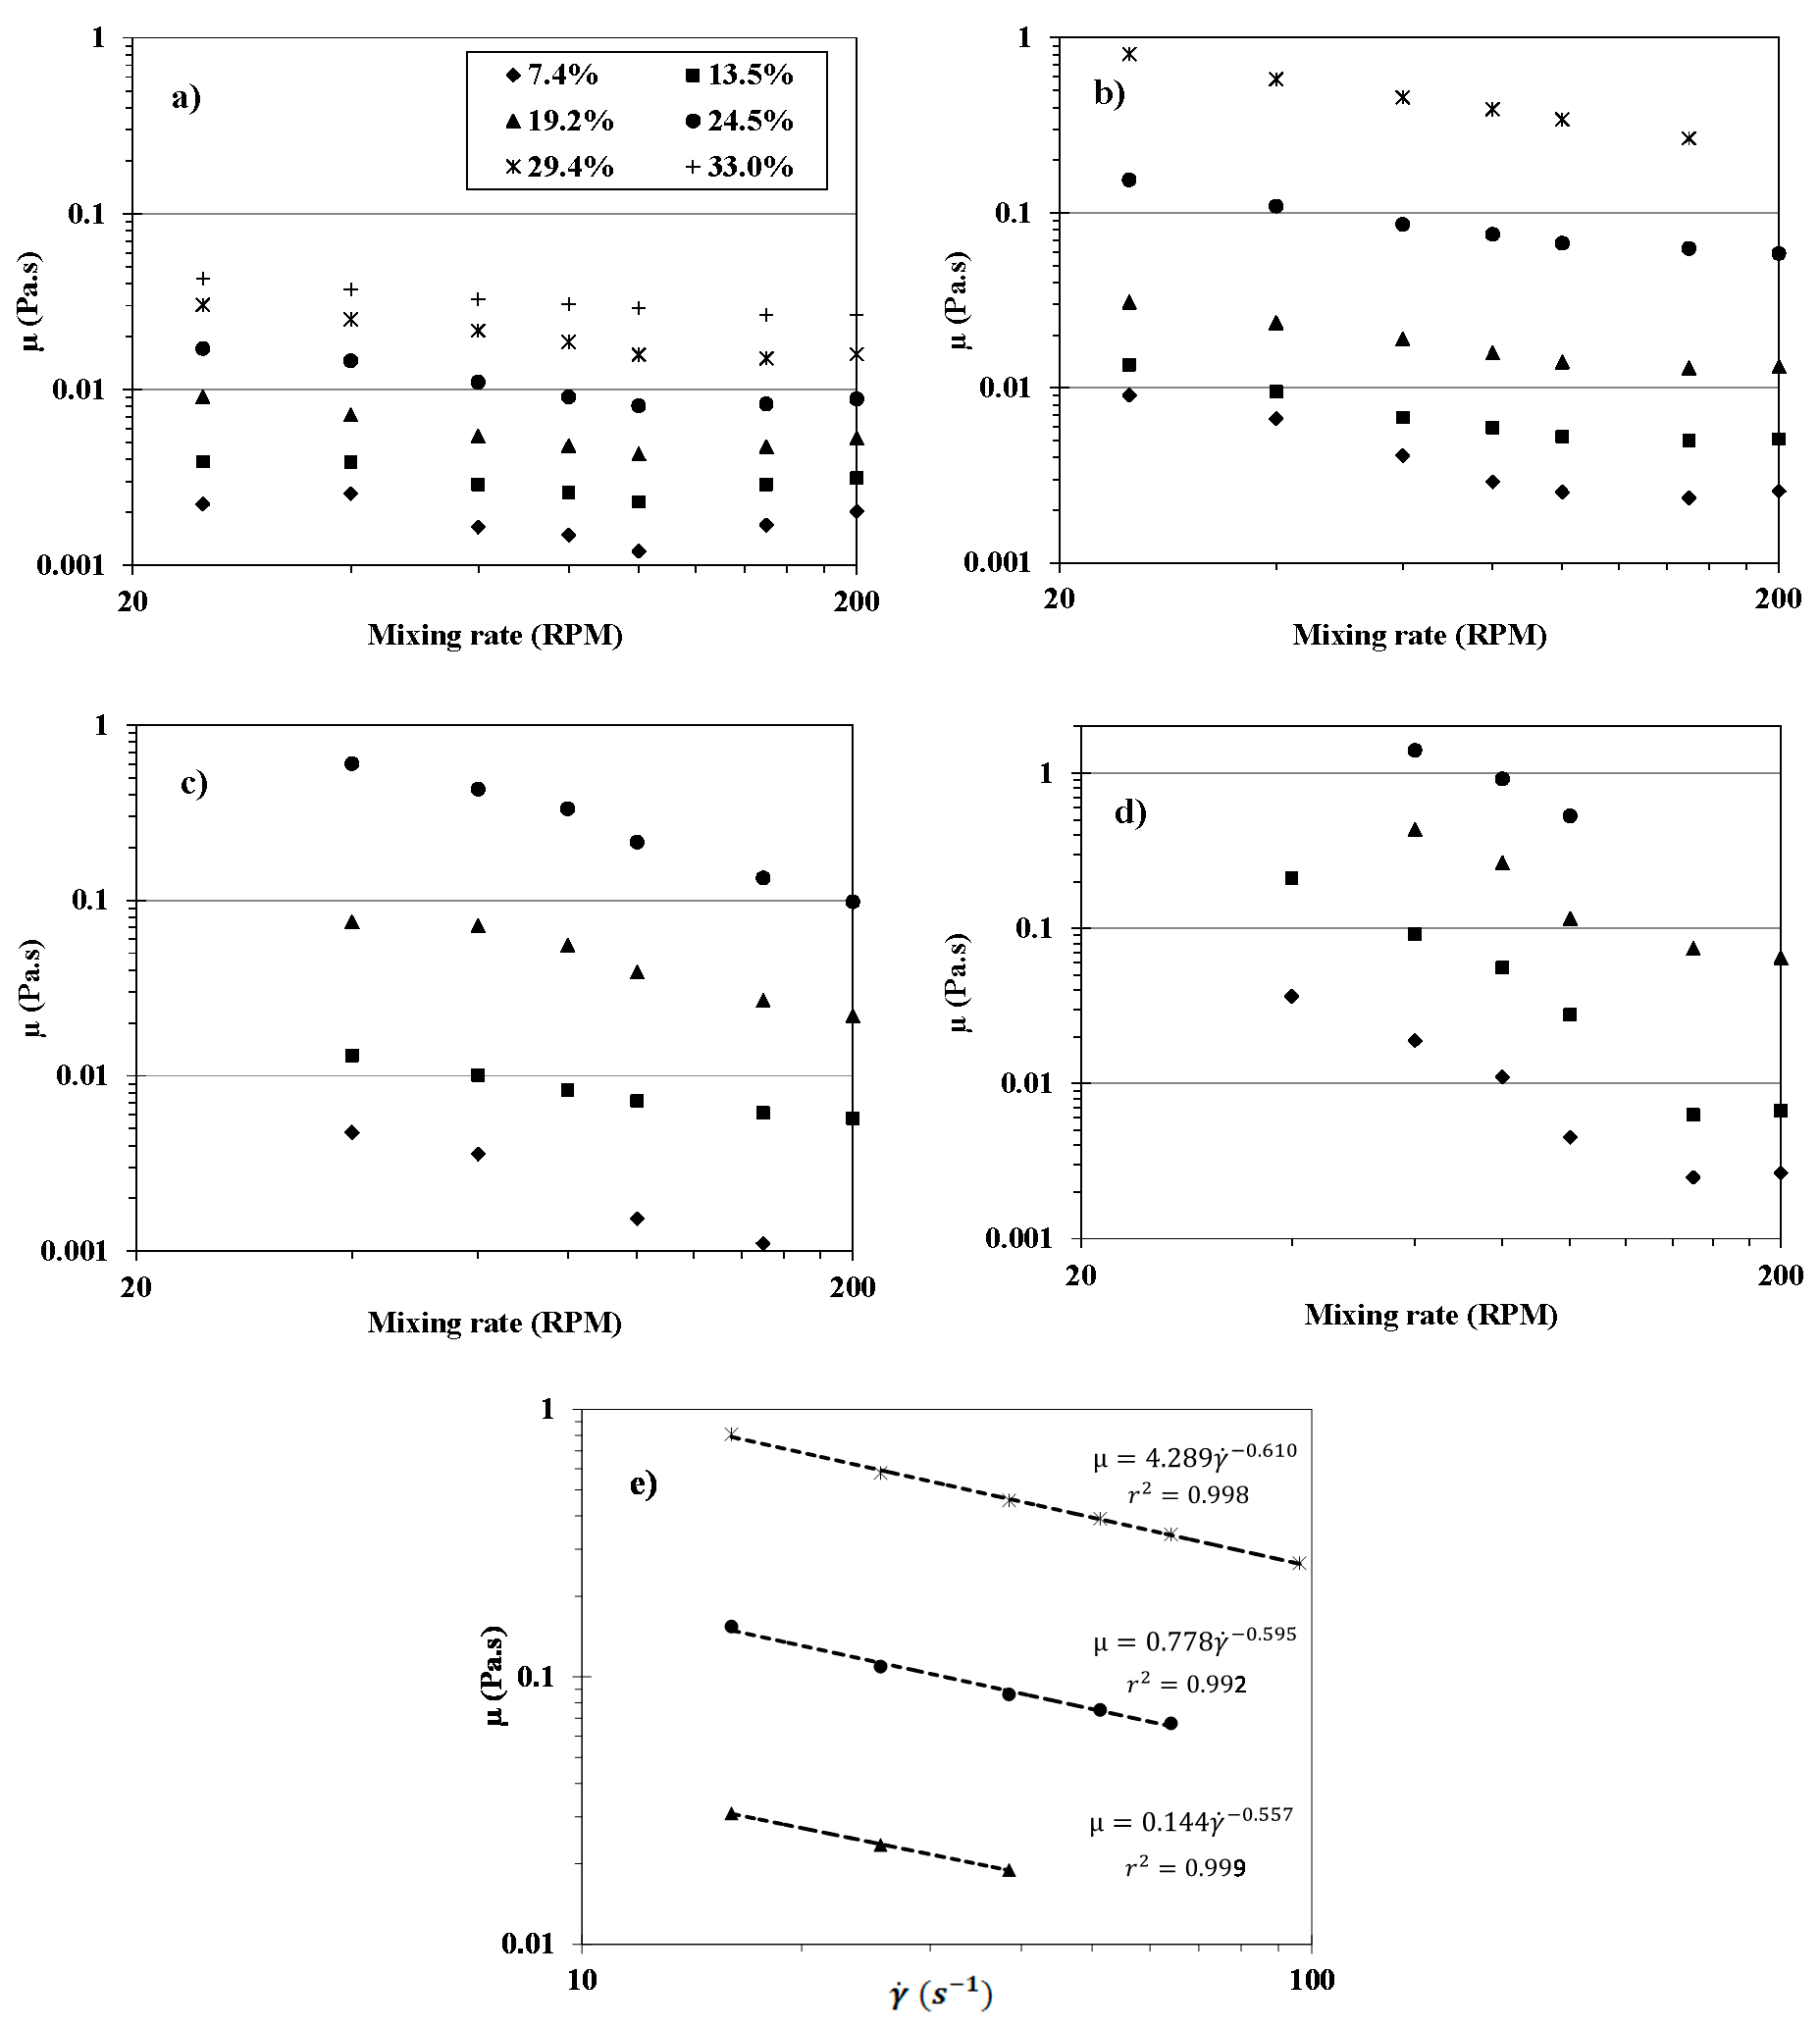
2.6. In-Situ Rheometry

In this study, the in-situ viscosimetry was conducted throughout hydrolysis to follow the suspension viscosity in real-time. This method was based on the measurement of power consumption P (or power number N p = P d 5 · ρ · N 3 ; P = 2 π · N · C ) versus the Reynolds number ( R e = ρ · N · d 2 μ ) during mixing of suspension. The viscosity was calculated from the power consumption curve of the mixing system established for Newtonian fluids which is then extended to non-Newtonian fluids using the classical Metzner–Otto concept [27]. A semi-empirical model including laminar and transition regions was then fitted to this reference curve giving a one-to-one relationship between Np and Re [19]:
N p = ( ( K p R e ) q + N p 0 q ) 1 q
The Reynolds number, Re, is calculated from Equation (2) using the measured power consumption P. Viscosity is then deduced from Re (Figure 1). The Metzner and Otto concept [27], which was validated for the mixing system (see [19,20] for detailed presentation), was used to evaluate an equivalent shear rate. It is written as: γ ˙ = K S × N , where Ks is the Metzner–Otto parameter. Thus, a given rotation frequency N is enabled to determine a point ( γ ˙ , µ ) of the rheogram, which can be obtained by varying N (Figure 1).
For the mixing system in this study, Np0 = 0.179 and q = 0.75, the Kp constant was equal to 114.7, while the Metzner–Otto constant K s was 38.5. From these constants and equations, the in-situ viscosimetry of the suspension was determined before the addition of enzymes and during the biocatalytic reaction.

2.7. Viscosity Measurement of Initial Suspensions

The rheological behavior of suspensions before hydrolysis and for different concentrations was first explored. The first step consisted of suspending the substrate in 1000 mL of acetate buffer (pH = 4.2). Each cycle of suspension is composed of (i) a homogenization phase (100 rpm for 300 s) with substrate addition and (ii) torque measurement within the capacity of the viscometer (Nmax= 800 rpm, Cmax≈ 30 mN·m) during a two-period mixing phase: (1) increasing mixing rate with 120-sec intervals at 25, 40, 60, 80, 100, 150, 200 and 250 rpm, and (2) decreasing mixing rate in reverse. A portion of the rheogram of the suspension was then obtained using the procedure described in Section 2.6. Concentration was increased by successive additions of cassava flour and rheological behavior explored for each concentration (50 g per addition, the total mass of suspension in the bioreactor was maintained at 1300 ± 50 g by discharging a suspension volume before new substrate was added).

2.8. Enzymatic Hydrolysis

Enzyme hydrolysis of cassava flour was carried out at 50 °C in acetate buffer (pH = 4.2) at a concentration of 20% dm. To avoid microbial contamination, chloramphenicol was added (0.1% v/v). Enzymatic cocktail, Stargen 002 (0.8 GAU/g dm) was added when the suspension reached homogeneity (visual monitoring and stabilized torque, reached within 5 min). Hydrolysis was carried out in a 1300 mL reactor over 72 h (physical parameters were followed until 20 h) with mixing rate at 100 rpm (corresponding to a shear rate of 64 s−1).
In situ viscosimetry was determined during the first 20 h by repeating 30-min cycles including: (i) mixing at 100 rpm for 25 min, (ii) shifting up to 125 rpm for 2 min, (iii) shifting down to 75 rpm for 2 min and (iv) final constant increasing to 100 rpm for over 1 min. Data acquisition was averaged every minute during the constant mixing phase at 100 rpm and every 10 s for other conditions. Samples of approximately 15 mL were taken at the beginning and during the hydrolysis (3, 6, 20, 24, 48, and 72 h). The enzyme in samples were intermediately inactivated by increasing pH with the addition of 0.1 mL NaOH 10 N. Samples were analyzed in terms of rheological, granulometric and glucose production.

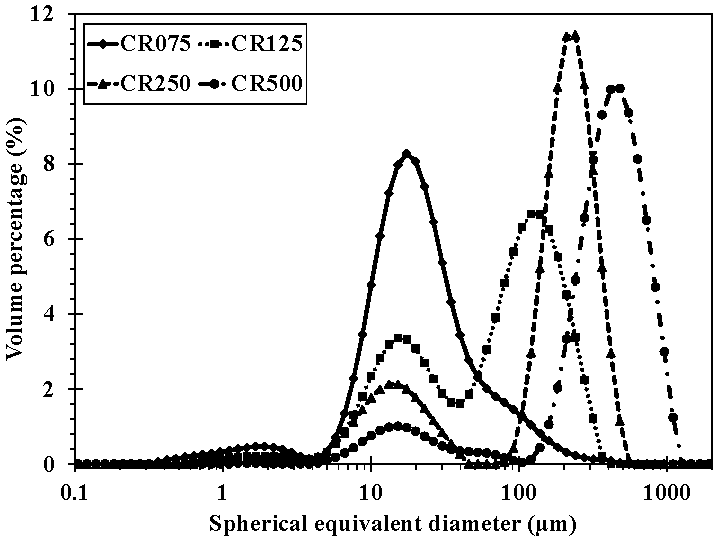
2.9. Particle Size Distribution

Particle size distribution (PSD) was measured ex situ using laser light diffraction analysis (Mastersizer 2000 Hydro, Malvern Instruments Ltd., Worcestershire, UK. SN: 34205-69, ranging in size from 0.02 to 2000 µm). A flour suspension was added drop by drop to the circulation loop (150 mL). The analysis was conducted at room temperature (approximately 20 °C) with obscuration rates ranging between 10% and 40% (red λ = 632.8 nm and blue λ = 470.0 nm lights). The results of spherical equivalent diameter (diameter of the sphere with the same volume as the particle, dSE) were exhibited as an average of the triplicate.

3. Results and Discussions

3.1. Cassava Flour Characteristics

The characteristics of cassava flours used in this study are shown in Table 1. Four samples of cassava flours at different particle sizes contained the same starch percentage range (from 77.3 to 82.0% dm). The starch contents are similar to other studies using the South-East Asian cassava [12,13,17]. The solvent retention capacity of cassava flour increased regularly when particle size increased. The fraction CR500 retained water 2.5 times higher than the CR075. The finer particles (such as CR075) were less porous and would be unable to imbibe as much water as the coarser particles which occupied more space during aggregation. The initial particle size distribution generally showed a bimodal distribution for all cassava flour samples (Figure 2), as reported by previous studies for other cereals and legumes in an aqueous medium [28,29]. Considering the initial distribution, for all four samples, the fine population ranged from 5 to 40 µm (with a peak at 15–20 µm), which corresponds to cassava starch granules mechanically separated during milling and mixing. The fine population (<40 µm) decreased sharply with the increase of particle size of cassava flour. The fine population acted a major fraction for CR075 (82.8%), decreased for CR125 (35.4%) and became a minor fraction for CR250 (22.0%) and CR500 (9.8%). The peak of coarse population depending on the cassava fractions, was reached at 120, 210 and 450 µm for CR125, CR250 and CR500, respectively. These observations suggest that for the coarser fraction of cassava flour, the starch need to be liberated from their network before being hydrolyzed by amylases. The mean volume diameters, D[4,3] of CR075, CR125, CR250, and CR500 samples were 33.2, 100.4, 201.1, and 456.2 µm, respectively. As expected, these values are correlated with the realized sieving.

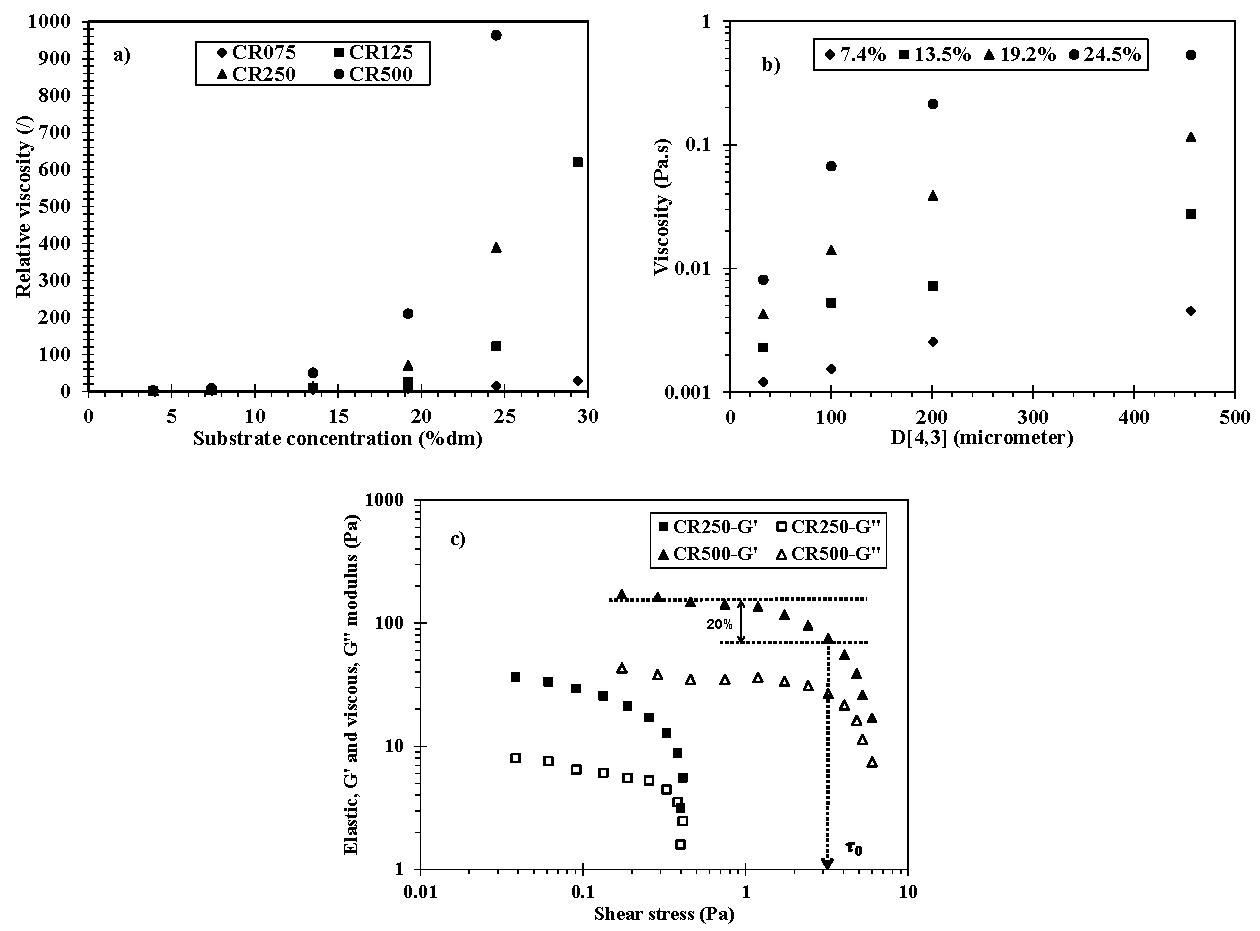
3.2. Rheology of Initial Flour Suspensions

For initial cassava flour suspension, the overarching aim was to describe the rheological behavior as a function of shear rate, concentration and granulometry, and to compare in-situ and ex-situ viscosity. The rheological behavior of flour suspensions is complex and influenced by multiple parameters such as particle concentration, shape, density and surface properties [20]. In the current study, the in-situ viscosity was quantified as a function of particle size and concentration. The suspension viscosity as a function of the mixing rate at 50 °C was illustrated in Figure 3a–d.
For all suspensions, the viscosity decreased when the mixing rate increased, reporting a shear-thinning behavior. This behavior (Equations (3) and (4)) was previously described for cereal flours (quinoa, Bengal gram (chickpeas), oat, etc.) [30,31,32].
The viscosity of the flour suspension measured in situ in the laminar regime was used to establish the rheogram and to model the fluid behavior. This study used the power-law or Ostwald–de Waele model to describe the time-independent viscometric flow [33]:
τ = K · γ ˙ n
Then
μ = K · γ ˙ n 1
The power-law (n) and consistency (K) indexes for all cassava flour suspensions (at the laminar regime) are presented in Table 2. As expected, the non-Newtonian behavior became stronger as the substrate concentration increased (reduction of the power-law index). For example, with CR125, the power-law index varied between 0.44 and 0.39 and the consistency increased from 0.14 up to 4.29 Pa·sn when concentration increased from 19.2% to 29.4% dm (all the points for CR125 suspension under 19.2% dm were out of laminar regime) (Figure 3e). The consistency coefficient represents the resistance to flow regarding the number and interaction or aggregation of the solid matter in suspension. The obtained values of n and K were in the same order of magnitude compared to other studies. The power-law index of a 15% dm wheat flour suspension ranged from 0.38 to 0.41 [34]. A consistency of 2.71 Pa·sn was reported by Prakash et al. [35] using a more concentrated wheat flour suspension (30% dm).
To analyze the impact of substrate concentration on viscosity, comparison is proposed between the relative viscosities at a given mixing rate N = 100 rpm, i.e., at the given shear rate γ ˙ ≈ 64 s−1relative = µsuspensionwater). The results are presented in Figure 4a and they clearly show a nonlinear growth. This nonlinear dependence was expected and can be explained by an increase in particle interactions and a decrease in free water as well as hydrogen bonds among starch chains. As the solid concentration increases, the average distance among particles in the suspension decreases, enhancing the contact between particles, especially if there is an entanglement of amorphous zones of particles [36]. Two regions were observed which corresponded to two concentrations: (i) a diluted/semidiluted concentration had a low relative viscosity with a linear evolution versus substrate concentration and (ii) a concentrated regime exhibited higher relative viscosity, a shear-thinning behavior and a substantial increase of viscosity as a function of substrate concentration (Figure 4a). A critical substrate concentration may be inferred from the transition between two regimes. Beyond these critical concentrations, the suspension viscosity becomes the significant stress as a transferring phenomenon and can negatively impact the enzymatic hydrolysis.
The impact of particle size of cassava flour on suspension viscosity is presented in Figure 3a–d and Figure 4a,b. These results demonstrated that the suspension viscosity increased with an increase in particle sizes. For an identic mixing rate (100 rpm) and dry matter content (19.2% dm) of cassava flour, viscosities were 4.3, 14.1, 38.9, and 115.6 mPa·s for CR075, CR125, CR250, and CR500, respectively (Figure 4a,b). The impact of particle size was more pronounced at higher substrate concentration; for example, the difference between viscosities of the coarsest and finest suspensions was approximatively 4- and 66-fold at a concentration of 7.4% and 24.5% dm, respectively. These observations have strengthened similar findings from other studies. Bhattacharya et al. [32] reported a four-fold increase in viscosity of Bengal gram flour suspension (30% dm, 100 s−1) from 22 to 83 mPa·s when particle diameter increased from 97 to 214 µm. Ahmed et al. [37] demonstrated that the complex viscosity η* decreased gradually as particle size reduced from 841 to 74 µm for suspension of 10% pumpkin flour. They concluded that the sediment volume fraction of particle dispersions (representing the particle occupancy after centrifugation and attributed flour water holding capacity) decreased with the decrease of particle size, which directly influenced the rheological behavior of the suspensions.
Ex-situ measurements were performed in oscillation mode through shear stress and frequency sweeps. The frequency sweep experiment revealed that the elastic modulus G′ and the viscous modulus G″ are independent of the frequency. Shear stress sweeps were also used to estimate the yield stress [25,26]. The results of viscous and elastic moduli for CR250 and CR500 (19.2% dm; 20 °C) showed a viscoplastic shear-thinning behavior (Figure 4c). The rheological behavior for small deformations was predominantly solid-like, as indicated by the dominance of G′ over G″. This observation is in agreement with other authors [30,34,38]. The G′ value was almost four times higher than G″ (at 1 Hz, 19.2% dm) regardless of the cassava flour type. A ratio G′/G″ of 4–6/1 was also reported for wheat, rice, and pumpkin flour suspensions [34,37]. Both elastic and viscous moduli (G′ and G″) increased with the increase of particle sizes. For instance, at 19.2% dm and in linear domain, the ratios of G′/G″ were 5.4/1.5, 13.3/3.5, 29.2/7.2, and 152.6/37.5 for CR075, CR125, CR250, and CR500, respectively. More volume occupied by coarser particles could explain the increase of elastic and viscous moduli [37].
Yield stress could be regarded as the stress required to initiate flow. For CR075 and CR125, no yield stress could be detected for substrate concentration less than 30% dm. A non-zero value of yield stress appeared from 20% dm for CR250 and CR500, but with low values: 0.3 and 3.2 Pa, respectively. The fluid showed behavior of a pourable liquid at yield stress below 1 Pa so the yield stress of CR250 suspension was negligible. Therefore, only CR500 suspensions (≥20% dm) exhibited viscoplastic behavior with significant yield stress. Similar results were obtained by Bhattacharya et al. [32] for suspension of Bengal gram flour. Minimal required concentrations were 42, 36, and 30% dm for the mean particle size of 97, 138, and 214 µm, respectively, to obtain a significant yield stress. Yield stress would be higher in the case of a thermal pretreated substrate (extruder or modified starch, for example) [39].
The results of rheology of cassava suspensions indicated the influences of the flour size and concentration on the rheological behavior. In brief, the increasing of particle size can limit the working condition especially for the VHG process.

3.3. Bioconversion Rate

As a result of enzymatic hydrolysis by Stargen 002, the starch was broken down to mostly glucose. Hydrolysis yield was calculated based on the results of reducing sugars. As expected, the yield increased with hydrolysis time for all experiments and the highest hydrolysis yield was obtained for the finest particle size. Two samples with different particle sizes were tested: the fine particles (CR075 and CR125) and the coarse particles (CR250 and CR500). There was no significant difference in hydrolysis yield within each group, but the higher yield (10–12%) was observed with the fine group compared to the coarse group after 72 h (Table 3). This observation suggested a requirement for mechanical pretreatment of cassava: the particle size should be smaller than 125 µm.
Most of the previous studies on the impact of particle size of starch granules on enzymatic hydrolysis yield concluded that the hydrolysis yield decreased with the increase of particle size. Naguleswaran et al. [40] observed higher initial rates for the small granules and longer time for large granules during the hydrolysis of barley and corn starch. The authors concluded that the molecular structure and granule porosity influence amylolysis. Mahasukhonthachat et al. [41] studied the enzymatic digestion of sorghum starch and observed that the fine particles (119 µm) were hydrolyzed at a two-fold faster rate than the coarse particles (564 µm) after 4 h. Considering the short-grain rice flour, De la Hera et al. [42] reported that when the particle size was larger than 150 µm, the enzymatic hydrolysis yield reduced substantially by approximately 10%.
Enzymatic hydrolysis of native starch is a heterogeneous biocatalytic reaction: (i) adsorption of enzymes randomly onto the surface of the granules, (ii) hydrolysis of the starting points, (iii) radial progression hydrolysis from the surface to the center of the granules, and (vi) trapping of enzymes inside the granules, so that they can only hydrolyze the substrate within their limited range of diffusion, leading to centrifugal hydrolysis [43]. Diffusion of enzymes onto the starch surface and then inside the granules, are rate-limiting steps in enzymatic hydrolysis [44]. Smaller granules, by their larger specific surface area, facilitate the adsorption of enzymes [45] and therefore are hydrolyzed more rapidly than larger granules. Our study corroborated this conclusion. The specific surface area of cassava flour reduced as particle sizes decreased, i.e., 547, 309, 167 to 58 m2·kg−1 for CR075, CR125, CR250, and CR500, respectively. The highest yield was approximately 90% after 72 h of hydrolysis and presented satisfactory results for the low-temperature enzymatic hydrolysis of starch.

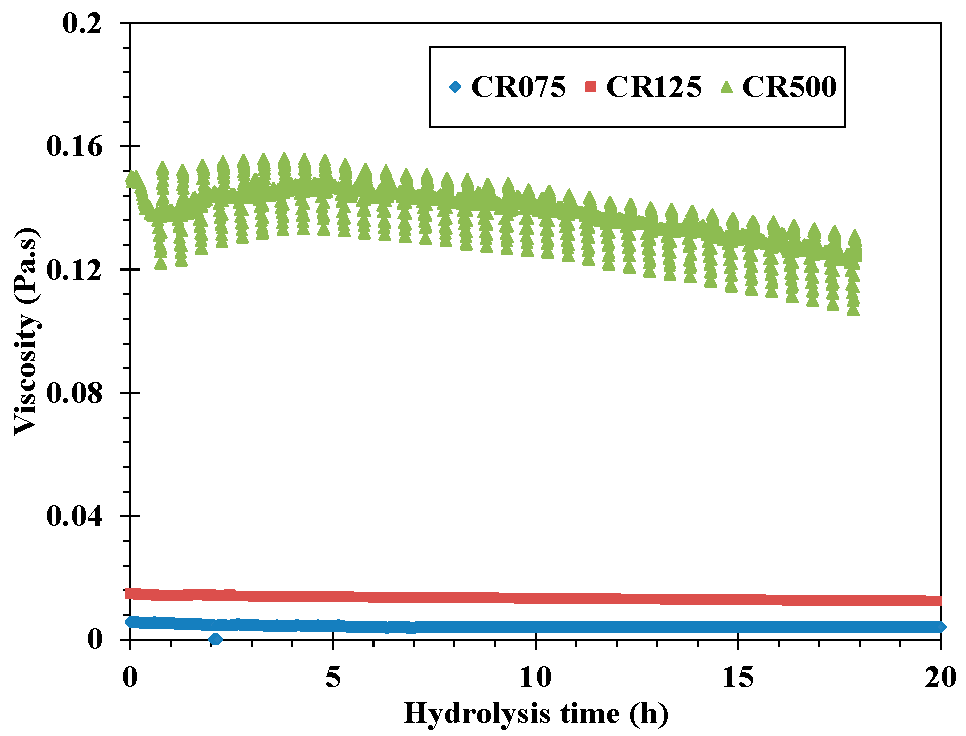
3.4. Rheological Behavior during Hydrolysis

Most of the rheological studies on starchy suspensions focused on their pasting properties in food applications. Studies on rheological behavior during granular starch hydrolysis, unfortunately, have not been reported. This study was the first to investigate the rheological behavior of tuber flour suspensions during enzymatic hydrolysis.
The in-situ viscosimetry showed that initial substrate suspensions were non-Newtonian shear-thinning fluids. During hydrolysis, as expected, slurries viscosities (at 100 rpm, i.e., for a given shear rate) decreased; however, this reduction was negligible (Figure 5). Viscosity values at 0 h/20 h were 5.6/4.0, 14.9/12.5 and 153.0/124.1 mPa·s for CR075, CR125 and CR500, respectively. For most slurries, a reduction of 16–28% of initial viscosity was observed after 20 h of hydrolysis. This reduction was perhaps caused by the decreasing of solid concentration (solubilization) in combination with the evolution (increase/decrease) of particle size.
In literature, only the reduction of mash viscosity during the pretreatment step of tuber flour suspension was reported [11,12,14]. Most of the studies used the ex-situ method and observed the reduction varying from 2 to 20 fold of mash viscosity, depending on substrate types (potato, sweet potato and cassava) and enzyme activities (xylanase, β-glucanase, cellulases, hemicellulases, pectinases) after 60–120 min of the enzymatic attack.
Regarding in more detail, three tendencies of viscosity evolutions were found (clearly observed for CR500). The viscosity reduced rapidly during the first hour as a result of the particle dissociation effect. After that, the viscosity increased until the 6th hour of hydrolysis and then decreased sharply until the end because of the depolymerization by the enzymes. This evolution of viscosity could be correlated directly with particle size evolution during hydrolysis (see Section 3.5).
The evolution of the non-Newtonian behavior of cassava flour suspension during hydrolysis was observed by in-situ rheometry. A sweep of mixing rate cycle (125, 100, and 75 rpm, which corresponds to shear rates equal to 80, 64, and 48 s−1, respectively) was reported every 30 min. Taking only the points at laminar and transitory regimes (Re ≤ 600) into consideration, the power-law index was deduced from Equation (4). It is noticeable that the flow behavior index increased as a function of hydrolysis time (Table 4). The initial index was 0.37 and it rapidly increased to 0.56 during the first hour of hydrolysis before reaching 0.71 after 4.25 h and then remained almost constant. The same tendency was also observed for the consistency index. The significant loss of shear-thinning behavior during the first hour of hydrolysis can be explained by reducing particle–particle interactions in suspension due to enzymatic attack.
Although the suspension viscosity did not reduce remarkably during the 20-h hydrolysis, the previous discussion highlighted the strong impact of enzyme activities on how the rheological behavior varied during hydrolysis, and that the evolution could be followed by an in-situ method.

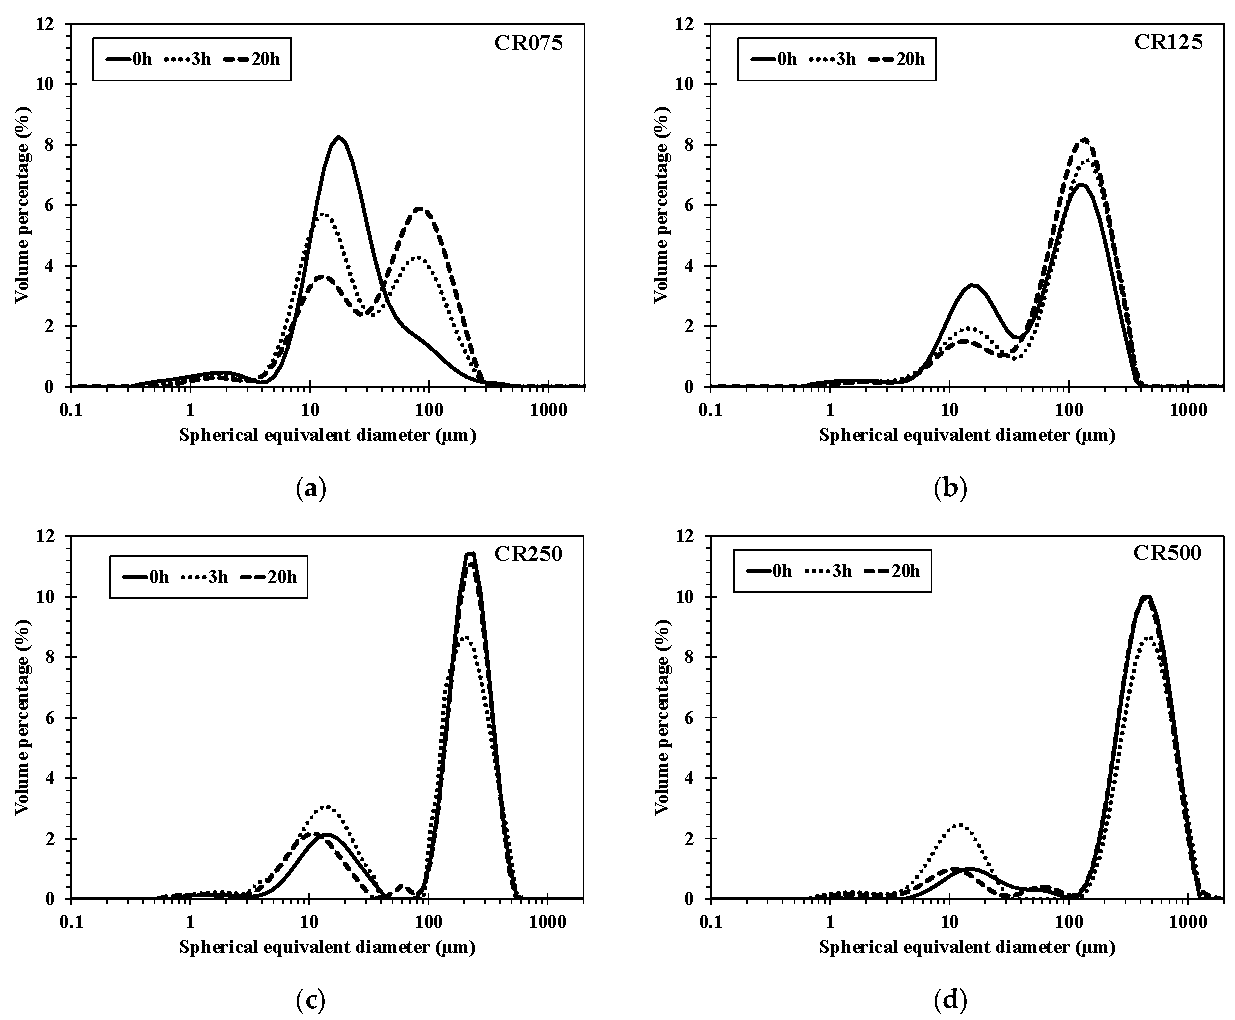
3.5. Particle Size Evolution during Hydrolysis

Numerous studies have investigated the impact of particle size (both starch granule and flour size) on hydrolysis yield [40,41,42,46,47]. However, the evolution of granule size during the enzymatic attack was not considered. During hydrolysis, two tendencies of particle size evolution were observed. The finest flours, CR075 and CR125 exhibited the same evolution: the fine population (<40 µm) decreased while the coarse population increased (Figure 6). The CR250 and CR500 presented a more complex evolution of particle size: during the first hour of hydrolysis, the fine population (<40 µm) increased along with a decrease of coarse population, then the evolution of particle size became similar with those of CR075 and CR125. After 20 h of hydrolysis, the particle size distribution of CR250 and CR500 remained quasi-static with the initial distribution before hydrolysis.
Regarding the mean volume diameter, D[4,3] of CR075 and CR125 particles regularly increased during the hydrolysis progress. After 20 h, the D[4,3] of CR075 was doubled (from 33.2 to 67.7 µm) and an increase of 25% was also observed for D[4,3] of CR125 (from 100.4 to 125.0 µm). On the contrary to these cassava flours, the D[4,3] of CR500 dropped drastically from 456.2 to 354.1 µm after only one hour of hydrolysis; however, beyond this time, the D[4,3] increased before reaching nearly the initial value after 20 h of amylolysis (448.0 µm at 20 h). The increase of fine population during the first hour of the amylolysis of CR250 and CR500 can be explained by the synergistic effects of the enzymatic attack and mechanical mixing, which liberate the starch granule from flour particles and divide coarse particles into smaller ones. Along with the hydrolysis progress, the particle size increased because of swelling and porosity of particles which raise particle volume occupation. Enzymes degraded the granule surface and formed holes which increased the porosity of particles [9,48], and the swelling of particles also increased. Shariffa et al. [7] demonstrated an increase of about 25–50% of starch swelling after 24 h hydrolysis of tapioca and sweet potato starches.
The evolution of particle size was interestingly correlated with the evolution of suspension viscosity. For example, with CR500, the viscosity decreased sharply during the first hour corresponding to the reduction of D[4,3]. After this time, the increased particle size also caused an increase in viscosity. On the contrary to the solid matter solubilization which reduced the suspension viscosity, the particle size increased during hydrolysis and could limit the mixing and bioconversion of flour.

4. Conclusions

This study investigated the rheo-granulo-biochemical changes during enzymatic hydrolysis of ungelatinized cassava flour suspension. The enzymatic hydrolysis can be conducted with low energy consumption at a controllable suspension viscosity below the gelatinization temperature of cassava starch. The non-Newtonian behavior (shear-thinning fluid) was observed for all suspensions and became quasi-Newtonian after few hours under enzymatic attack. A non-negligible impact of particle size on suspension viscosity and hydrolysis rate was demonstrated. The coarse particles caused a high viscosity and lower bioconversion rate. The suspension viscosity was modeled as a function of substrate concentration and volume mean diameter of the particle. The obtained hydrolysis rates after 72 h of hydrolysis were relatively high (≈90%, flour smaller than 125 µm) in the limited condition of energy consumption.

Author Contributions

Investigation: T.C.N., L.F., D.A.-A. and T.H.D.N.; Writing—Original Draft Preparation, T.C.N.; Writing—Review and Editing, L.F., D.A.-A., S.C.-K., H.N.L., T.T.V., T.H.D.N. and V.H.N. All authors have read and agreed to the published version of the manuscript.

Funding

This research and the APC are funded by Vietnam National Foundation for Science and Technology Development (NAFOSTED) under grant number 106-NN.02-2016.56.

Institutional Review Board Statement

Not applicable.

Informed Consent Statement

Not applicable.

Data Availability Statement

Not applicable.

Conflicts of Interest

The authors declare that they have no conflict of interest.

Nomenclature

CTorque (mixing system)(N.m)
dmDry matter content(%)
G′Elastic modulus(Pa)
G″Viscous modulus(Pa)
KConsistency index(Pa·sn)
KpPower constant(/)
KsMetzner–Otto constant(/)
msQuantity of substrate(g humid matter)
nPower-law index(/)
NRotation speed(round per second)
NpPower number(/)
PPower consumption(W)
ReReynolds number(/)
γ ˙ Shear rate(s−1)
ρDensity(kg·m−3)
µViscosity(Pa·s)
τShear stress(Pa)
τ0Yield stress(Pa)

References

  1. Robertson, G.H.; Wong, D.W.S.; Lee, C.C.; Wagschal, K.; Smith, M.R.; Orts, W.J. Native or Raw Starch Digestion: A Key Step in Energy Efficient Biorefining of Grain. J. Agric. Food Chem. 2006, 54, 353–365. [Google Scholar] [CrossRef] [PubMed]
  2. Galvez, A. Analyzing cold enzyme starch hydrolysis technology in new ethanol plant design. Ethanol Prod. Mag. 2005, 11, 58–60. [Google Scholar]
  3. Blazek, J.; Gilbert, E.P. Effect of Enzymatic Hydrolysis on Native Starch Granule Structure. Biomacromolecules 2010, 11, 3275–3289. [Google Scholar] [CrossRef] [PubMed]
  4. Chen, G.; Zhang, B. Hydrolysis of granular corn starch with controlled pore size. J. Cereal Sci. 2012, 56, 316–320. [Google Scholar] [CrossRef]
  5. Li, J.; Vasanthan, T.; Bressler, D.C. Improved cold starch hydrolysis with urea addition and heat treatment at subgelatinization temperature. Carbohydr. Polym. 2012, 87, 1649–1656. [Google Scholar] [CrossRef]
  6. Li, Z.; Cai, L.; Gu, Z.; Shi, Y.-C. Effects of Granule Swelling on Starch Saccharification by Granular Starch Hydrolyzing Enzyme. J. Agric. Food Chem. 2014, 62, 8114–8119. [Google Scholar] [CrossRef]
  7. Shariffa, Y.N.; Karim, A.A.; Fazilah, A.; Zaidul, I.S.M. Enzymatic hydrolysis of granular native and mildly heat-treated tapioca and sweet potato starches at sub-gelatinization temperature. Food Hydrocoll. 2009, 23, 434–440. [Google Scholar] [CrossRef]
  8. Textor, S.D.; Hill, G.A.; Macdonald, D.G.; Denis, E.S. Cold enzyme hydrolysis of wheat starch granules. Can. J. Chem. Eng. 1998, 76, 87–93. [Google Scholar] [CrossRef]
  9. Uthumporn, U.; Zaidul, I.S.M.; Karim, A.A. Hydrolysis of granular starch at sub-gelatinization temperature using a mixture of amylolytic enzymes. Food Bioprod. Process. 2010, 88, 47–54. [Google Scholar] [CrossRef]
  10. Cinelli, B.A.; Castilho, L.R.; Freire, D.M.G.; Castro, A.M. A brief review on the emerging technology of ethanol production by cold hydrolysis of raw starch. Fuel 2015, 150, 721–729. [Google Scholar] [CrossRef]
  11. Srichuwong, S.; Fujiwara, M.; Wang, X.H.; Seyama, T.; Shiroma, R.; Arakane, M.; Mukojima, N.; Tokuyasu, K. Simultaneous saccharification and fermentation (SSF) of very high gravity (VHG) potato mash for the production of ethanol. Biomass Bioenerg. 2009, 33, 890–898. [Google Scholar] [CrossRef]
  12. Poonsrisawat, A.; Wanlapatit, S.; Paemanee, A.; Eurwilaichitr, L.; Piyachomkwan, K.; Champreda, V. Viscosity reduction of cassava for very high gravity ethanol fermentation using cell wall degrading enzymes from Aspergillus aculeatus. Process Biochem. 2014, 49, 1950–1957. [Google Scholar] [CrossRef]
  13. Poonsrisawat, A.; Wanlapatit, S.; Wansuksri, R.; Piyachomkwan, K.; Paemanee, A.; Gamonpilas, C.; Eurwilaichitr, L.; Champreda, V. Synergistic effects of cell wall degrading enzymes on rheology of cassava root mash. Process Biochem. 2016, 51, 2104–2111. [Google Scholar] [CrossRef]
  14. Zhang, L.A.; Chen, Q.A.; Jin, Y.L.; Xue, H.L.; Guan, J.F.; Wang, Z.Y.; Zhao, H. Energy-saving direct ethanol production from viscosity reduction mash of sweet potato at very high gravity (VHG). Fuel Process. Technol. 2010, 91, 1845–1850. [Google Scholar] [CrossRef]
  15. Wiman, M.; Palmqvist, B.; Tornberg, E.; Liden, G. Rheological characterization of dilute acid pretreated softwood. Biotechnol. Bioeng. 2011, 108, 1031–1041. [Google Scholar] [CrossRef]
  16. Charoenkul, N.; Uttapap, D.; Pathipanawat, W.; Takeda, Y. Physicochemical characteristics of starches and flours from cassava varieties having different cooked root textures. LWT Food Sci. Technol. 2011, 44, 1774–1781. [Google Scholar] [CrossRef]
  17. Nguyen, C.N.; Le, T.M.; Chu-Ky, S. Pilot scale simultaneous saccharification and fermentation at very high gravity of cassava flour for ethanol production. Ind. Crop. Prod. 2014, 56, 160–165. [Google Scholar] [CrossRef]
  18. Le, T.; Anne-Archard, D.; Coma, V.; Cameleyre, X.; Lombard, E.; To, K.A.; Pham, T.A.; Nguyen, T.C.; Fillaudeau, L. Using in-situ viscosimetry and morphogranulometry to explore hydrolysis mechanisms of filter paper and pretreated sugarcane bagasse under semi-dilute suspensions. Biochem. Eng. J. 2017, 127, 9–20. [Google Scholar] [CrossRef] [Green Version]
  19. Nguyen, T.C.; Anne-Archard, D.; Cameleyre, X.; Lombard, E.; To, K.A.; Fillaudeau, L. Bio-catalytic hydrolysis of paper pulp using in- and ex-situ multi-physical approaches: Focus on semidilute conditions to progress towards concentrated suspensions. Biomass Bioenergy 2019, 122, 28–36. [Google Scholar] [CrossRef] [Green Version]
  20. Nguyen, T.C.; Anne-Archard, D.; Coma, V.; Cameleyre, X.; Lombard, E.; Binet, C.; Nouhen, A.; To, K.A.; Fillaudeau, L. In situ rheometry of concentrated cellulose fibre suspensions and relationships with enzymatic hydrolysis. Bioresour. Technol. 2013, 133, 563–572. [Google Scholar] [CrossRef] [Green Version]
  21. Deshors, M.; Guais, O.; Neugnot-Roux, V.; Cameleyre, X.; Fillaudeau, L.; Francois, J.M. Combined in situ Physical and ex-situ Biochemical Approaches to Investigate in vitro Deconstruction of Destarched Wheat Bran by Enzymes Cocktail Used in Animal Nutrition. Front. Bioeng. Biotechnol. 2019, 7, 158. [Google Scholar] [CrossRef] [Green Version]
  22. Miller, G.L. Use of Dinitrosalicylic Acid Reagent for Determination of Reducing Sugar. Anal. Chem. 1959, 31, 426–428. [Google Scholar] [CrossRef]
  23. Eduardo, M.; Svanberg, U.; Oliveira, J.; Ahrne, L. Effect of Cassava Flour Characteristics on Properties of Cassava-Wheat-Maize Composite Bread Types. Int. J. Food Sci. 2013, 2013, 305407. [Google Scholar] [CrossRef] [Green Version]
  24. Nguyen, Q.D.; Boger, D.V. Measuring the flow properties of yield stress fluids. Annu. Rev. Fluid Mech. 1992, 24, 47–88. [Google Scholar] [CrossRef]
  25. Dinkgreve, M.; Paredes, J.; Denn, M.M.; Bonn, D. On different ways of measuring “the” yield stress. J. Non-Newton. Fluid Mech. 2016, 238, 233–241. [Google Scholar] [CrossRef]
  26. Sun, A.; Gunasekaran, S. Yield Stress in Foods: Measurements and Applications. Int. J. Food Prop. 2009, 12, 70–101. [Google Scholar] [CrossRef]
  27. Metzner, A.B.; Otto, R.E. Agitation of non-Newtonian fluids. Aiche J. 1957, 3, 3–10. [Google Scholar] [CrossRef]
  28. Becker, A.; Hill, S.E.; Mitchell, J.R. Milling—A Further Parameter Affecting the Rapid Visco Analyser (RVA) Profile. Cereal Chem. 2001, 78, 166–172. [Google Scholar] [CrossRef]
  29. White, G.A.; Doucet, F.J.; Hill, S.E.; Wiseman, J. Physicochemical properties and nutritional quality of raw cereals for newly weaned piglets. Anim. Int. J. Anim. Biosci. 2008, 2, 867–878. [Google Scholar] [CrossRef]
  30. Ahmed, J.; Thomas, L.; Arfat, Y.A. Functional, rheological, microstructural and antioxidant properties of quinoa flour in dispersions as influenced by particle size. Food Res. Int. 2018, 116, 302–311. [Google Scholar] [CrossRef]
  31. Berski, W.; Krystyjan, M.; Zięć, G.; Litwinek, D.; Gambuś, H. The influence of starch hydrolyzate on physicochemical properties of pastes and gels prepared from oat flour and starch. J. Cereal Sci. 2016, 70, 16–22. [Google Scholar] [CrossRef]
  32. Bhattacharya, S.; Bhat, K.K.; Raghuveer, K.G. Rheology of Bengal gram (Cicer arietinum) flour suspensions. J. Food Eng. 1992, 17, 83–96. [Google Scholar] [CrossRef]
  33. Quemada, D. Modélisation Rhéologique Structurelle. Dispersions Concentrées et Fluides Complexes; Tec & Doc Lavoisier: Paris, France, 2006. [Google Scholar]
  34. Román, L.; Reguilón, M.P.; Gómez, M. Physicochemical characteristics of sauce model systems: Influence of particle size and extruded flour source. J. Food Eng. 2018, 219, 93–100. [Google Scholar] [CrossRef]
  35. Prakash, M.; Haridasa Rao, P.; Susheelamma, N.S.; Prabhakar, J.V. Rheological characteristics of native and steamed wheat flour suspensions. J. Cereal Sci. 1998, 28, 281–289. [Google Scholar] [CrossRef]
  36. Dasari, R.; Dunaway, K.; Berson, R. A scraped surface bioreactor for enzymatic saccharification of pretreated corn stover slurries. Energy Fuel 2009, 23, 492–497. [Google Scholar] [CrossRef]
  37. Ahmed, J.; Al-Foudari, M.; Al-Salman, F.; Almusallam, A.S. Effect of particle size and temperature on rheological, thermal, and structural properties of pumpkin flour dispersion. J. Food Eng. 2014, 124, 43–53. [Google Scholar] [CrossRef]
  38. Ahmed, J.; Al-Jassar, S.; Thomas, L. A comparison in rheological, thermal, and structural properties between Indian Basmati and Egyptian Giza rice flour dispersions as influenced by particle size. Food Hydrocoll. 2015, 48, 72–83. [Google Scholar] [CrossRef]
  39. Chung, C.; Degner, B.; McClements, D.J. Physicochemical characteristics of mixed colloidal dispersions: Models for foods containing fat and starch. Food Hydrocoll. 2013, 30, 281–291. [Google Scholar] [CrossRef]
  40. Naguleswaran, S.; Li, J.; Vasanthan, T.; Bressler, D.; Hoover, R. Amylolysis of large and small granules of native triticale, wheat and corn starches using a mixture of α-amylase and glucoamylase. Carbohydr. Polym. 2012, 88, 864–874. [Google Scholar] [CrossRef]
  41. Mahasukhonthachat, K.; Sopade, P.A.; Gidley, M.J. Kinetics of starch digestion in sorghum as affected by particle size. J. Food Eng. 2010, 96, 18–28. [Google Scholar] [CrossRef]
  42. De la Hera, E.; Gomez, M.; Rosell, C.M. Particle size distribution of rice flour affecting the starch enzymatic hydrolysis and hydration properties. Carbohydr. Polym. 2013, 98, 421–427. [Google Scholar] [CrossRef] [PubMed] [Green Version]
  43. Oates, C.G. Towards an understanding of starch granule structure and hydrolysis. Trends Food Sci. Technol. 1997, 8, 375–382. [Google Scholar] [CrossRef]
  44. Dhital, S.; Shrestha, A.K.; Gidley, M.J. Relationship between granule size and in vitro digestibility of maize and potato starches. Carbohydr. Polym. 2010, 82, 480–488. [Google Scholar] [CrossRef]
  45. Colonna, P.; Leloup, V.; Buleon, A. Limiting factors of starch hydrolysis. Eur. J. Clin. Nutr. 1992, 46 (Suppl. 2), S17–S32. [Google Scholar] [PubMed]
  46. Al-Rabadi, G.J.S.; Gilbert, R.G.; Gidley, M.J. Effect of particle size on kinetics of starch digestion in milled barley and sorghum grains by porcine alpha-amylase. J. Cereal Sci. 2009, 50, 198–204. [Google Scholar] [CrossRef]
  47. Warren, F.J.; Royall, P.G.; Gaisford, S.; Butterworth, P.J.; Ellis, P.R. Binding interactions of α-amylase with starch granules: The influence of supramolecular structure and surface area. Carbohydr. Polym. 2011, 86, 1038–1047. [Google Scholar] [CrossRef]
  48. Nguyen, T.C.; Chu-Ky, S.; Luong, H.N.; Nguyen, H.V. Effect of Pretreatment Methods on Enzymatic Kinetics of Ungelatinized Cassava Flour Hydrolysis. Catalysts 2020, 10, 760. [Google Scholar] [CrossRef]
Figure 1. In-situ rheometry calculation principle.
Processes 09 00989 g001
Figure 2. Particle size distribution of initial cassava flours (CR075, CR125, CR250 and CR500 are cassava flour with the particle sizes of under 75 µm, 75–125 µm, 125–250 µm and 250–500 µm, respectively).
Processes 09 00989 g002
Figure 3. Suspension viscosity versus mixing rate and concentrations at 50 °C: (a) CR075, (b) CR125, (c) CR250, (d) CR500 and (e) viscosity as a function of shear rate—example for CR125 (only for the laminar regime) (CR075, CR125, CR250, and CR500 are cassava flour with the particle sizes of under 75 µm, 75–125 µm, 125–250 µm, and 250–500 µm, respectively).
Processes 09 00989 g003
Figure 4. (a) Impact of substrate concentration on relative viscosity at the mixing rate of 100 rpm; (b) impact of particle size (D[4,3]: volume mean diameter, µm) on suspension viscosity at the mixing rate of 100 rpm; (c) viscous, G″ (open symbols), and elastic, G′ (filled symbols) modulus as a function of shear stress (19.2% dm; 1 Hz) (CR075, CR125, CR250, and CR500 are cassava flour with the particle sizes of under 75 µm, 75–125 µm, 125–250 µm, and 250–500 µm, respectively).
Processes 09 00989 g004
Figure 5. In-situ viscosimetry as a function of hydrolysis time (CR075, CR125, and CR500 are cassava flour with the particle sizes of under 75 µm, 75–125 µm, and 250–500 µm, respectively).
Processes 09 00989 g005
Figure 6. Evolution of particle size distribution during hydrolysis of (a) CR075, (b) CR125, (c) CR250 and (d) CR500 suspensions (CR075, CR125, CR250 and CR500 are cassava flour with the particle sizes of under 75 µm, 75–125 µm, 125–250 µm and 250–500 µm, respectively).
Processes 09 00989 g006
Table 1. Cassava flour characteristics.
ParametersCR075CR125CR250CR500
Starch content (% dm)82.0 ± 1.0 a81.4 ± 0.7 a78.4 ± 1.3 b77.3 ± 0.8 b
SRC (%)103.3 ± 0.5 a166.7 ± 1.8 b237.6 ± 1.2 c259.6 ± 0.9 d
D[4,3] (µm)33.2 ± 0.4 a100.4 ± 1.2 b201.1 ± 2.1 c456.2 ± 8.9 d
(CR075, CR125, CR250 and CR500 are cassava flour with the particle sizes of under 75 µm, 75–125 µm, 125–250 µm and 250–500 µm, respectively. Values with a different letter (a, b, c, d) are significantly different (p < 0.05) according to Duncan’s test).
Table 2. Evolution of rheological behavior (n, K) of Cassava flour suspension as a function of granulometry and concentration.
Concentration (% dm)CoefficientCR075CR125CR250CR500
19.2n (/)0.700.440.480.37
K (Pa·sn)0.040.140.834.05
r2 (/)0.990.990.960.94
24.5n (/)0.660.410.360.23
K (Pa·sn)0.090.782.087.40
r2 (/)0.990.990.990.99
29.4n (/)0.610.39n.rn.r
K (Pa·sn)0.114.3
r2 (/)0.990.99
(n.r: not realized. CR075, CR125, CR250 and CR500 are cassava flour with the particle sizes of under 75 µm, 75–125 µm, 125–250 µm and 250–500 µm, respectively).
Table 3. Hydrolysis yield (%) of different cassava flours.
Hydrolysis Time (h)CR075CR125CR250CR500
630.2 ± 0.4 a28.5 ± 0.2 b28.2 ± 0.7 b26.0 ± 1.1 c
1246.3 ± 0.3 a38.5 ± 0.5 b38.4 ± 1.4 b37.5 ± 1.2 b
2461.6 ± 1.0 a58.4 ± 0.7 b54.8 ± 0.5 c52.9 ± 0.3 d
4877.2 ± 0.9 a76.6 ± 1.2 a69.2 ± 0.7 b66.9 ± 0.6 c
7290.7 ± 0.6 a89.5 ± 0.3 a79.3 ± 0.7 b78.0 ± 0.4 b
(CR075, CR125, CR250 and CR500 are cassava flour with the particle sizes of under 75 µm, 75–125 µm, 125–250 µm and 250–500 µm, respectively. Values with a different letter (a, b, c, d) are significantly different (p < 0.05) according to Duncan’s test).
Table 4. Evolution of power-law index during hydrolysis of CR500 suspension (20% dm, Stargen 002, 0.8 GAU/g dm, pH 4.2, 50 °C, 100 rpm).
Hydrolysis Time (h)00.752.254.2510.2517.75
n (/)0.370.560.660.710.720.72
K (Pa·sn)4.050.850.590.470.440.45
r2 (/)0.940.990.970.960.920.98
Publisher’s Note: MDPI stays neutral with regard to jurisdictional claims in published maps and institutional affiliations.

