Article

Physicochemical Properties of Enzymatically Modified Starches

Department of Food Science and Nutrition, King Saud University, Riyadh 11456, Saudi Arabia
*
Author to whom correspondence should be addressed.
Processes 2021, 9(12), 2251; https://doi.org/10.3390/pr9122251
Submission received: 20 October 2021 / Revised: 22 November 2021 / Accepted: 23 November 2021 / Published: 14 December 2021

Abstract

:
The physicochemical properties of native, annealed and enzyme-treated chickpea (CP), corn (CS), Turkish bean (TB) and sweet potato (SPS) were investigated. Germinated sorghum extract (GSET) was used as the source of enzymes. Starches were annealed in excess water by holding the slurry at 60 °C for 60 min with or without GSET. The flow curves/rheological data were fitted to the power law, Casson and Herschel–Bulkley models. Starches exhibited shear thinning behavior and a variation in the flow behavior index (n) (0.34–0.82) as a function of the starch type. The consistency index (k) of CP and CS decreased with annealing and GSET treatment but increased for TB and SPS. Annealed and GSET-treated SPS exhibited the highest yield stress compared to the other starches, except for CP. The temperature dependency of all starches was well described by the Arrhenius model (r2 = 0.88–0.99). The activation energy (Ea) values were in the range of 660–5359 (J/mol). The TB exhibited the most Ea and SPS the least. With the exception of SPS, annealing appeared to increase the Ea of all tested starches, but the range of Ea was broader for SPS and CS. Annealed and GSET starches exhibited an increase in the gelatinization temperatures (onset and peak) and a decrease in gelatinization enthalpy (ΔH). The syneresis and water holding capacity decreased after annealing or GSET treatment.

1. Introduction

Starches from different sources differ in their granule structure and physicochemical as well as functional properties. It is mainly found in seeds, tubers and legumes and acts as a major source of energy for plants. In the food industry, starch plays a significant role in maintaining the texture of the product during processing, transportation and storage. The main components of the starch are amylose and amylopectin, which are found in different rations according to the starch source. Starches with desirable properties, such as pasting properties, syneresis, paste clarity and maximum viscosity, are continually explored, which can be altered by physical, chemical or enzymatic means [1,2,3,4].
Starch granules are different sizes and shapes according to their source. A granule is made of amylose on the outer layer and amylopectin in the interior. The outer part of the granule is amorphous, and the interior is crystalline. The interior crystals can be detected by X-ray diffraction. Each starch has a different X-ray pattern according to its source. The annealing of starch is the physical treatment of native starch in the presence of heat below the gelatinization temperature in excessive or limited moisture content [4]. Many researchers have indicated the effects of heat moisture treatment (HMT) on the morphology and physicochemical properties of starches from different origins (legume, root, tuber and cereal starches), which include significant changes in X-ray diffraction (XRD) pattern, crystallinity, chain interactions, granules swelling, viscosity, pasting properties, retrogradation, enzyme and acid hydrolysis [4]. Amorphous glassy molecules of starch granules, located mostly in the outer layer, become mobile and reorganize to form an improved crystalline structure during annealing, which can occur by improved alignment of amylopectin double helices within the crystalline lamellae and by enhanced glassy structure of the amorphous lamellae. This has a direct effect on the degradation rate of the starch [5,6,7].
The susceptibility of native starch granules towards α-amylase has been revealed to be influenced by several factors, such as: starch granule size, surface smoothness, difference in X-ray diffraction pattern and proportion of polymorphic (A, B or C) forms, packing and distribution of B-type crystallites, surface porosity, amylose/amylopectin ratio, amylopectin unit chain length distribution and branch density, distribution pattern of α-(1–6) branching points, degree of crystallinity, amylose and amylopectin organization within the granule and magnitude of interactions between starch chains within the amorphous region of the granule [8,9,10]. The amorphous domains of the granules by and large have been considered to be easily digested by α-amylase, because they are loosely packed compared to the crystalline domains, which are predominantly dense [11,12,13,14].
Rheological testing is typically based on stress (force per area) and strain (deformation per length). The relationship between stress and strain is analyzed for loss modulus, complex shear modulus and dynamic viscosity. Few models are used to explain the flow of fluids involved in food industries, such as power law, power law with yield stress (Herschel–Bulkley) and Casson models [15,16,17,18,19]. The yield stress is typically defined as the minimum shear stress that must be applied to the material to initiate flow. Materials that exhibit yield stress are usually multiphase systems such as paints, pastes, greases and a selection of food products such as salad dressings, sauces and spreads [16]. Hence, the main objective of this work was to determine and compare the physicochemical properties of annealed and enzymatically modified chickpea, Turkish bean, corn and sweet potato starches. The study includes steady shear, water holding capacity and syneresis after annealing with or without enzymes. This work is a continuation of a previously published paper, wherein the dynamic rheology and other physical properties of the starches were studied [20]. The outcome of this work will open a new area of developing an inexpensive and easy to develop crude source of enzymes that can be used in developing starch or starchy products. This method is based on preparing the weight of the extract of germinating sorghum or any other seeds.

2. Materials and Methods

2.1. Materials

The raw material was purchased from a local supermarket in Riyadh (Saudi Arabia). Salem variety sweet potato grown in the Altayef area of western Saudi Arabia in the winter was used for isolating sweet potato starch. The chickpea and Turkish bean were purchased from the local market (Riyadh, Saudi Arabia). Native common corn starch was donated by ARASCO company (Riyadh, Saudi Arabia).

2.2. Chickpea and Turkish Bean Starches Isolation

Starch was isolated according to [21]. Turkish beans and chickpea whole meal were prepared by grounding dry beans in a blender at low speed for 3 min. The meal was suspended in distilled water (50/50; w/w) and blended at low speed in heavy duty blender for 5 min (B. Braun Melsungen, AG, Hessen, Germany). The slurry was passed through a 200-mesh sieve and then it was centrifuged at 2  × 103× g for 15 min. The brown layer on the top of the precipitate was removed and the white material pellet was re-suspended in distilled water three times and centrifuged. The starch was air-dried (native), ground in a coffee grinder and stored in sealed bottles at 4 °C.

2.3. Sweet Potato Starch Isolation

The sweet potato starch was isolated according to the method described by [22]. The tuber was washed, peeled, diced and blended in distilled water (50:50 v/v) for 3 min using kitchen aid blender (B. Braun Melsungen, AG, Hessen, Germany). Slurry was filtered through a muslin cloth and sieved through 200-mesh sieve. The filtrate was allowed to settle for 1.0 h at room temperature, and the precipitate was re-suspended in distilled water then centrifuged at 2000× g for 15 min. The top dark layer was removed, and the white material (starch) was washed twice and air-dried, ground (native) and stored at 4 °C for further use. Detailed procedure for amylose content was described in a previous publication [19].

2.4. Sorghum Germination (GSET)

Germination sorghum was prepared according to [23]. Moist sorghum seeds (25% MC) were germinated at 24 °C for 4 days, dried, ground and stored at 4 °C. The extract was prepared by adding 40.0 mL distilled water to 10.0 g of the germinated sorghum flour, mixed for 15 min, filtered (Whitman 40) and centrifuged for 10.0 min at 2000× g. This is called germinated sorghum extract (GSET). This extract was used for annealing (1.0 mL).

2.5. Annealing of Native and GSET-Treated Starches

Starch/water ratio of 1:9 (w/v) was prepared for annealing. The extract (1.0 mL) was added to one set of native starch samples, and the other set was annealed without GSET. Both sets were placed in a shaking water bath at 60 °C for 60 min with constant agitation at 100 rpm (shaking water bath, Julabo, Germany). The digested slurry was centrifuged, and the supernatant was discarded, whereas the precipitate was washed with fresh water 3 times to remove excess extract, centrifuged (Beckman JXN, Brea, CA, USA) and air-dried. The dried materials were sieved through a 250 µm sieve and stored at −20 °C for further use.

2.6. Steady Shear

The paste used for the rheological tests was prepared in the Rapid Visco Analyzer (RVA, Newport Scientific, Sydney, Australia) prior to loading on the rheometer. Native or treated starch (2.8 g dry basis) was weighed, and the total weight was completed to 28 g by adding distilled water and then hand mixed. Slurry was heated and held at 50 °C for 30 s. The temperature was raised to 95 °C (4.40 min) and held for 4 min, then cooled to 50 °C at 22.5 °C/min and held for 2 min. The speed of the paddle was 960 rpm for 10 s, then decreased to 160 rpm for the end of the experiment. The paste was transferred to the HR-Hybrid Rheometer (TA Instruments, New Castile, PA) to determine the steady shear properties. The data were collected for steady shear behavior (shear rate vs. shear stress) at 30, 40 and 50 °C, at 5% strain and ramped from 1.0 to 200 s−1 in 2 min. The measured parameters were independent of shear strains and within the linear range. Measurements were repeated at least twice with fresh samples. The relative errors were about ±10%. The data were recorded and fitted to the power law equation, the Herschel–Bulkley and Casson model so as to define the distinction in rheological properties of samples under steady shear, as shown by Equations (1)–(3), respectively.
τ = Kγn
σ = σ0 + Κ·γn
where τ is the shear stress, γ is the shear rate, n is the flow behavior index, σ is the shear stress (Pa), γ is the shear rate (s−1), Κ is the consistency index (Pa·sn), n is flow behavior index (dimensionless) and σ0 is yield stress.
τ = τ 0.5 + k0.5 γ0.5
where τ0.5 (Pa) is yield stress and k0.5 (Pa·s) is the Casson model constant, τ is shear stress and γ0.5 is shear rate. k0.5 and τ0.5 are the intercept and slope of τ and γ0.5, respectively.
In addition, an Arrhenius-type model (Equation (4)) was applied to investigate the effect of temperature (30, 40 and 50 °C) on apparent viscosity at shear rate of 100 s−1 of starch gel:
ηa,100 = A exp (Ea/RT)
where A is the proportionality constant (apparent viscosity at infinite temperature, Pa·s), Ea is the activation energy (J/mol), R is the universal gas constant (kJ/mol−1 K−1) and T is absolute temperature (Kelvens). The value of Ea at each treatment was calculated from the regression analysis of ln ηa,100 versus 1/T.

2.7. Water Holding Capacity (g/g)

The water holding capacity (WHC) was measured according to the method described by Olayinka et al. (2008) [3]. Native, annealed and annealed in GSET were used for this test. Starch sample (1.0 g) (WO) was suspended in 5 mL of water and vortexed for 10 s. After 30 min at room temperature (25 ± 2 °C), sample was centrifuged at 2000× g for 10 min, and the precipitate was weighed (W1). The WHC was calculated as g of water absorbed per g of starch, according to the following relationship:
WHC (g/g) = W1 − W0/W0
where W0 is the initial weight (g) of a starch; W1 is the final weight (g).

2.8. Thermal Properties

DSC analysis was conducted to determine the thermal properties of the tested starches at 10 °C/min using TA instrument DSC (TA instrument, New Castel, PA, USA). Sample (10–12 mg) was placed in aluminum pans and 18–20 µL distilled water was added, whereas the reference pan contained similar weight of distilled water. After sealing, the sample was equilibrated for 2 h and scanned between 25 and 110 °C. Onset and peak temperature and ΔH were determined using the software provided by TA instruments.

2.9. Syneresis Measurement

Gels prepared using RVA were placed in graduated plastic centrifuge tubes and stored at −20 °C. After 4 days of storage, gels were heated in water bath at 50 °C for 30 min and centrifuged at 3000× g for 15 min. The water separated from gels was recorded and the gels were re-stored in freezer for another 4 days, where the data were recorded using same procedure, and the percent syneresis was calculated.

2.10. Statistical Analysis

Measurements were performed in triplicate and the data were analyzed using ANOVA. A factorial design was applied to test for the effects of the germinated sorghum extract (GSET) on the tested starches. Duncan’s multiple range test was applied to compare means at p ≤ 0.05 using the PASW® Statistics 18 software (SPSS Inc., Hong Kong, China).

3. Results and Discussion

3.1. Steady Shear Properties

Each starch was tested for their steady shear properties. Rheological profiles of the tested starches pointed to a pseudoplastic character of the gels (Figure 1). The flow behavior index (n) of the power law (Equation (1)) is a dimensionless parameter that reflects the closeness of the material to Newtonian flow. When n = 1, it corresponds to a Newtonian fluid, and a lower n value reveals a higher degree of pseudoplasticity of the paste. In addition, the deviation of the flow index (n) from 1.0 indicates the extent of shear thinning behavior. The flow behavior index (n) ranged from 0.39–0.82 (n < 1), signifying that all starch pastes leaned towards a non-Newtonian fluid with pseudoplastic behavior (Table 1). Pseudoplastic behavior denotes a decrease in viscosity at a higher shear rate (shear thinning), where lower n values indicate higher pseudoplasticity. The n value varied significantly among the starches based on their origin (CP, CS, TB and SPS) and the type of treatment (native, annealed and GSET-treated). However, for the same starch type, the n value changed at higher temperatures, whereas for others it stayed within a close range. The n for CS did not change much at higher temperatures but increased for CP as a function of temperature.
The SPS exhibited a decrease in n at all temperatures, while TB showed a decrease in n at 30 °C and an increase at 40 °C and 50 °C. Regardless of the treatment form, TB exhibited the highest n value compared to the other starches, whereas CP had the least together with the GSET-treated CS samples. Therefore, annealed TB was the least pseudoplastic (high n), and the most pseudoplastic was the native CP starch. Under shear stress of starch gel, the intertwined amylose chains formed straight chains, causing a reduction in chain entanglement, which caused a decrease in the apparent viscosity. This behavior can also be explained by breaking the entangled starch components (amylose and amylopectin) during shearing, as pointed out by Park, et al. [24], which indicates that the rate of entanglement disruption was higher than entanglement formation. This phenomenon was related to the shear thinning or pseudoplastic behavior [16,21]. The rank of the n values of native starches were:
(TB > SPS > CS > CP) annealed (TB > SPS > CS > CP) and GSET-treated (TB > SPS > CS > CP).
One of the main differences between the composition of the tested starches was the percentage of amylose content (CP (24.0 ± 0.09), CS (21.4 ± 0.08), TB (20.9 ± 0.06) and SPS (22.6 ± 0.06). Based on this ranking, it appears that the lower amylose content of TB could be the reason for the high n and low apparent viscosity (Table 1). The high n value of TB could also be related to the amylose chain length, which determines the degree of sensitivity of the starch to shearing (Table 1). It is well established that amylose content has a direct effect on the starch gelatinization temperature and mechanism, because it determines granule porosity and the strength of the formed gel. The strength of the gel can be observed by the degree of setback, where high setback indicates a stronger gel [4]. Normally, the flow index behavior increases with the temperature increase, because a higher temperature directly relates to lower viscosity of starch gels [25]. Interestingly, such behavior was not observed for CP and TB only. However, CS and SPS exhibited a decrease in n regardless of treatment type. This phenomenon was reported for cassava flour–honey blend [26]. The effect of annealing and GSET on the TB flow was obvious, because native starch exhibited a reduction in n, while annealing and GSET caused n to increase, rendering TB gel more pseudoplastic, but CS and SPS presented less pseudoplasticity. Literature reports established an increase in starch gelatinization parameters after annealing such as gelatinization temperature and peak viscosity [2].
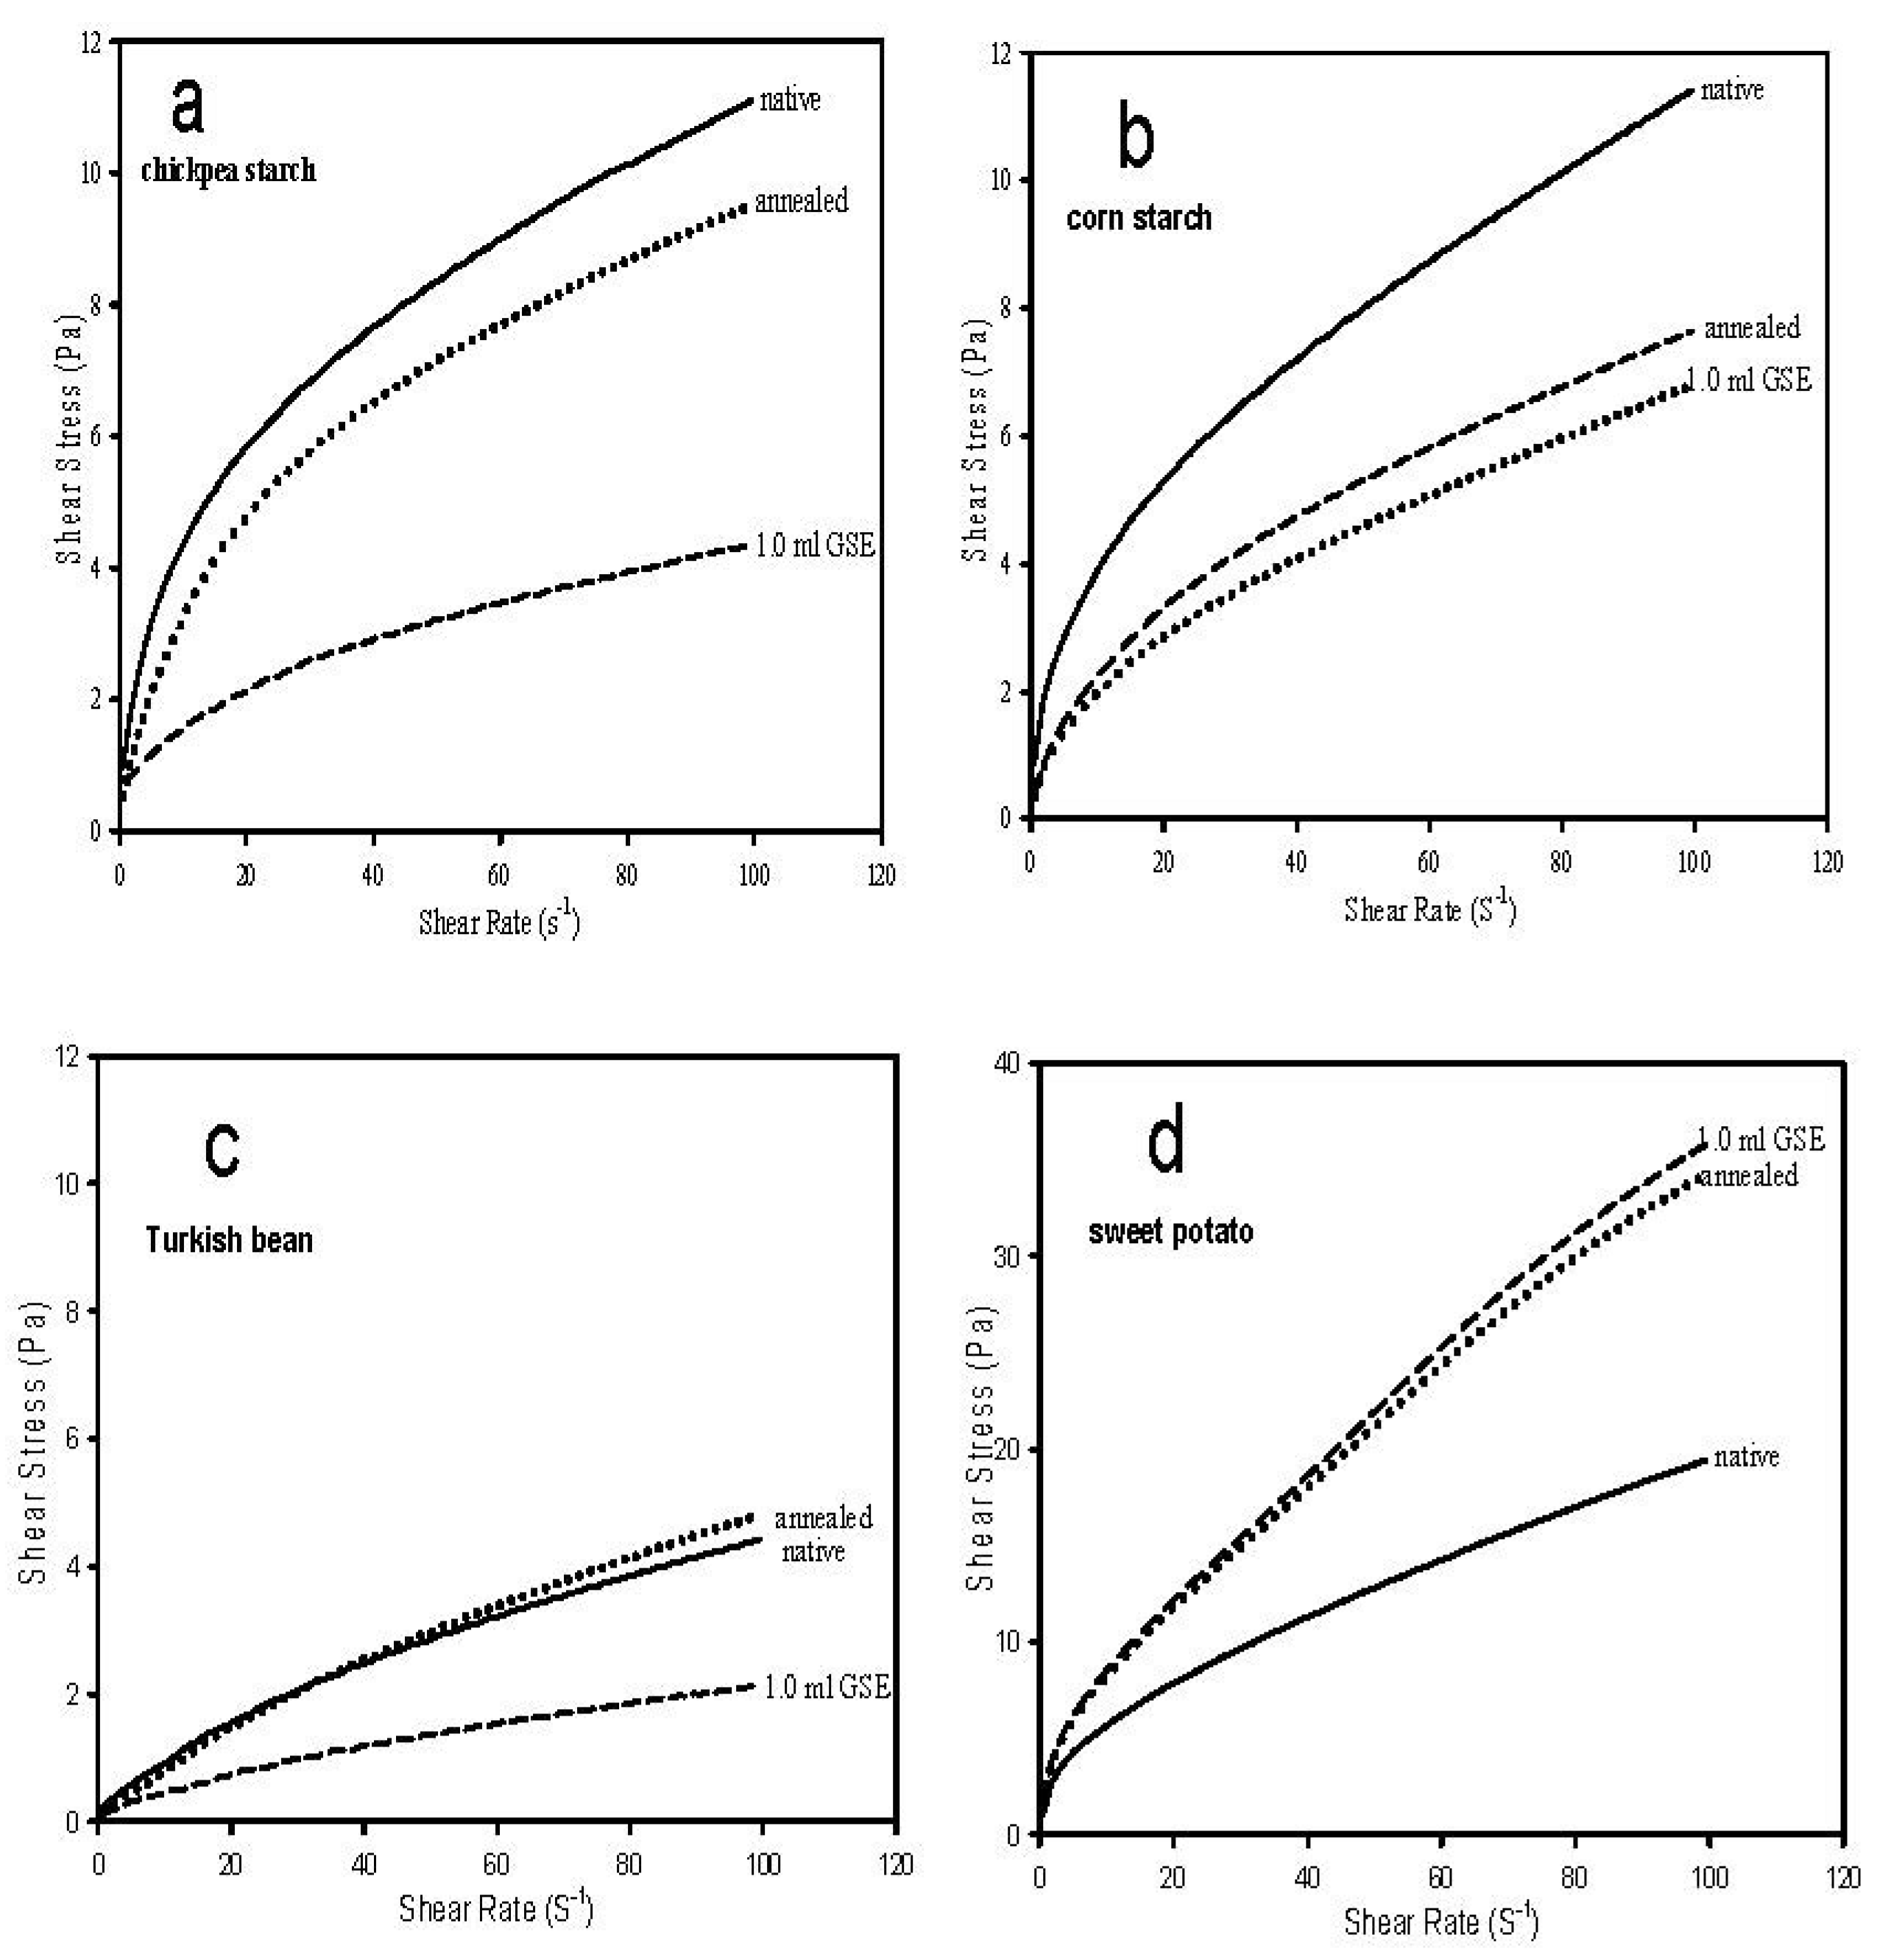
Native chickpea and corn starches exhibited the most shear stress (SS) (Figure 1). The SS of native CS was reduced significantly by annealing and GSET at a similar magnitude, but GSET treatment provided much more shear stability to the native CP starch, as indicated by the significant drop in SS. Therefore, annealing was less effective in providing shear stability to CP granules. The overall SS of TB was much lower than the other tested starches, but annealing had minimal effect, whereas GSET significantly reduced the SS. This could be attributed to the low amylose content of TB compared to the other starches except for CS.
Sweet potato starch exhibited the highest SS of all tested starches (consider the larger scale of SPS profile in Figure 1), but the SS was significantly higher due to annealing and GSET treatment compared to the native starch. GSET treatment appeared to reduce the SS (deformation) of the tested starch gels except for SPS. Conversely, CP exhibited more drop in SS due to GSET, indicating an obvious susceptibility to GSET, which caused a change in the molecular size of the annealed CP due to the action of α–amylase (GSET), which permitted more entanglement, causing a reduction in SS. The annealing and GSET effects on SPS resulted in a significant increase in SS compared to the native starch. This indicates a reduction in molecular entanglement. The variation between the SS of the tested starches due to annealing and GSET could be attributed to the granule structure (size, porosity and amylose content), which determines the degree of the effect of annealing and the α–amylase attack. The SS of starches at 10.0 SR (s−1) was varied and ranked as SPS > CP > CS > TB, as shown in profiles of Figure 1, which indicates a similar effect on the stress at low and high shear rate.
In general, the ηa decreases at higher temperatures [20]. The ηa (100 s−1) of all starches decreased across higher temperatures (Table 1). When ηa (100 s−1) is compared across treatment at each temperature, the apparent viscosity (ηa) of CP starch gel increased after annealing, regardless of testing temperature compared to the native starch, and decreased by GSET, except at 50 °C. Therefore, the dependence on an increase in ηa of CP on annealing could be used to set processing parameters for formulated foods containing chickpea starch. For the native CS, ηa decreased after annealing and GSET treatment, regardless of temperature. The TB ηa exhibited a reduction after annealing when tested at 30 °C, but it remained the same at 40 and 50 °C. The SPS showed increase in ηa after annealing and GSET treatment at all testing temperatures (Table 1). Overall, annealing had the most effect on the apparent viscosity of the native starches compared to GSET.
The data were fitted to the flow curves of the Herschel–Bulkley model and the consistency index (K), flow behavior (n) index and the yield stress (T0) were derived. The coefficients of determination (r2) ranged from 0.98 to 0.99 (Table 2). The range of the consistency index (Pa·sn) was 0.10–2.48, 0.05–2.24 and 0.03–1.60 for the 30, 40 and 50 °C, respectively. Whereas the flow index ranged between 0.34–0.75, 0.34–0.74 and 0.40–0.84 for the 30, 40 and 50 °C, respectively (Table 2). Once again, TB exhibited the most pseudoplasticity among the tested starches, which is in agreement with the power law model as shown in Table 1. The K value decreased with annealing and further decreased with GSET treatment within each temperature (Table 2). The effect of annealing and GSET on starches at higher temperature was different, because GSET treatment increased the K of the CP and CS and decreased it for TB and SPS, but the annealing decreased the K of all native starches (Table 2b). This indicates a difference in granule structure among the tested starches. Moreover, TB and SPS appeared to be more susceptible to α–amylase. Yield stress (τ0) is the minimum applied shear to initiate flow. Yield stress is also the minimum stress required to initiate flow and point to the presence of entanglement or other interactive molecules in the material that must be broken before flow can take place at a substantial rate [27]. All tested starch pastes were pseudoplastic fluids (n < 1) but contrasted in their Herschel–Bulkley yield stress values. At 30 °C, GSET-treated SPS exhibited the highest yield stress followed by annealed SPS and TB (Table 2).
This indicates how the α-amylase action produced molecules, by degrading the starch, capable of interacting via entanglement, which requires additional stress to start the flow. At 40 and 50 °C, the stress was higher after GSET treatment and annealing. Therefore, all native gels did not exhibit a significant stress change compared to the treated starches. The most change on required stress was noticed for sweet potato starch, whereas TB required the least stress regardless of GSET treatment or annealing temperature. The yield stress of the tested starches is in line with their pseudoplasticity, as indicated by the flow index (Table 2).
Experimental data were fitted well to the Casson model and showed high determination coefficients (r2) ranged between 0.98 and 0.99. In Table 3, the Casson yield stress (ṯ0) of all tested starches decreased with the temperature increase. The highest yield stress was recorded for GSET-treated SPS and the lowest was for TB. The reason for the high yield stress and the high apparent viscosity (shown in Table 1) is the high swelling power of the SPS. This was in agreement with the data reported by Molavi and Razavi (2018) [
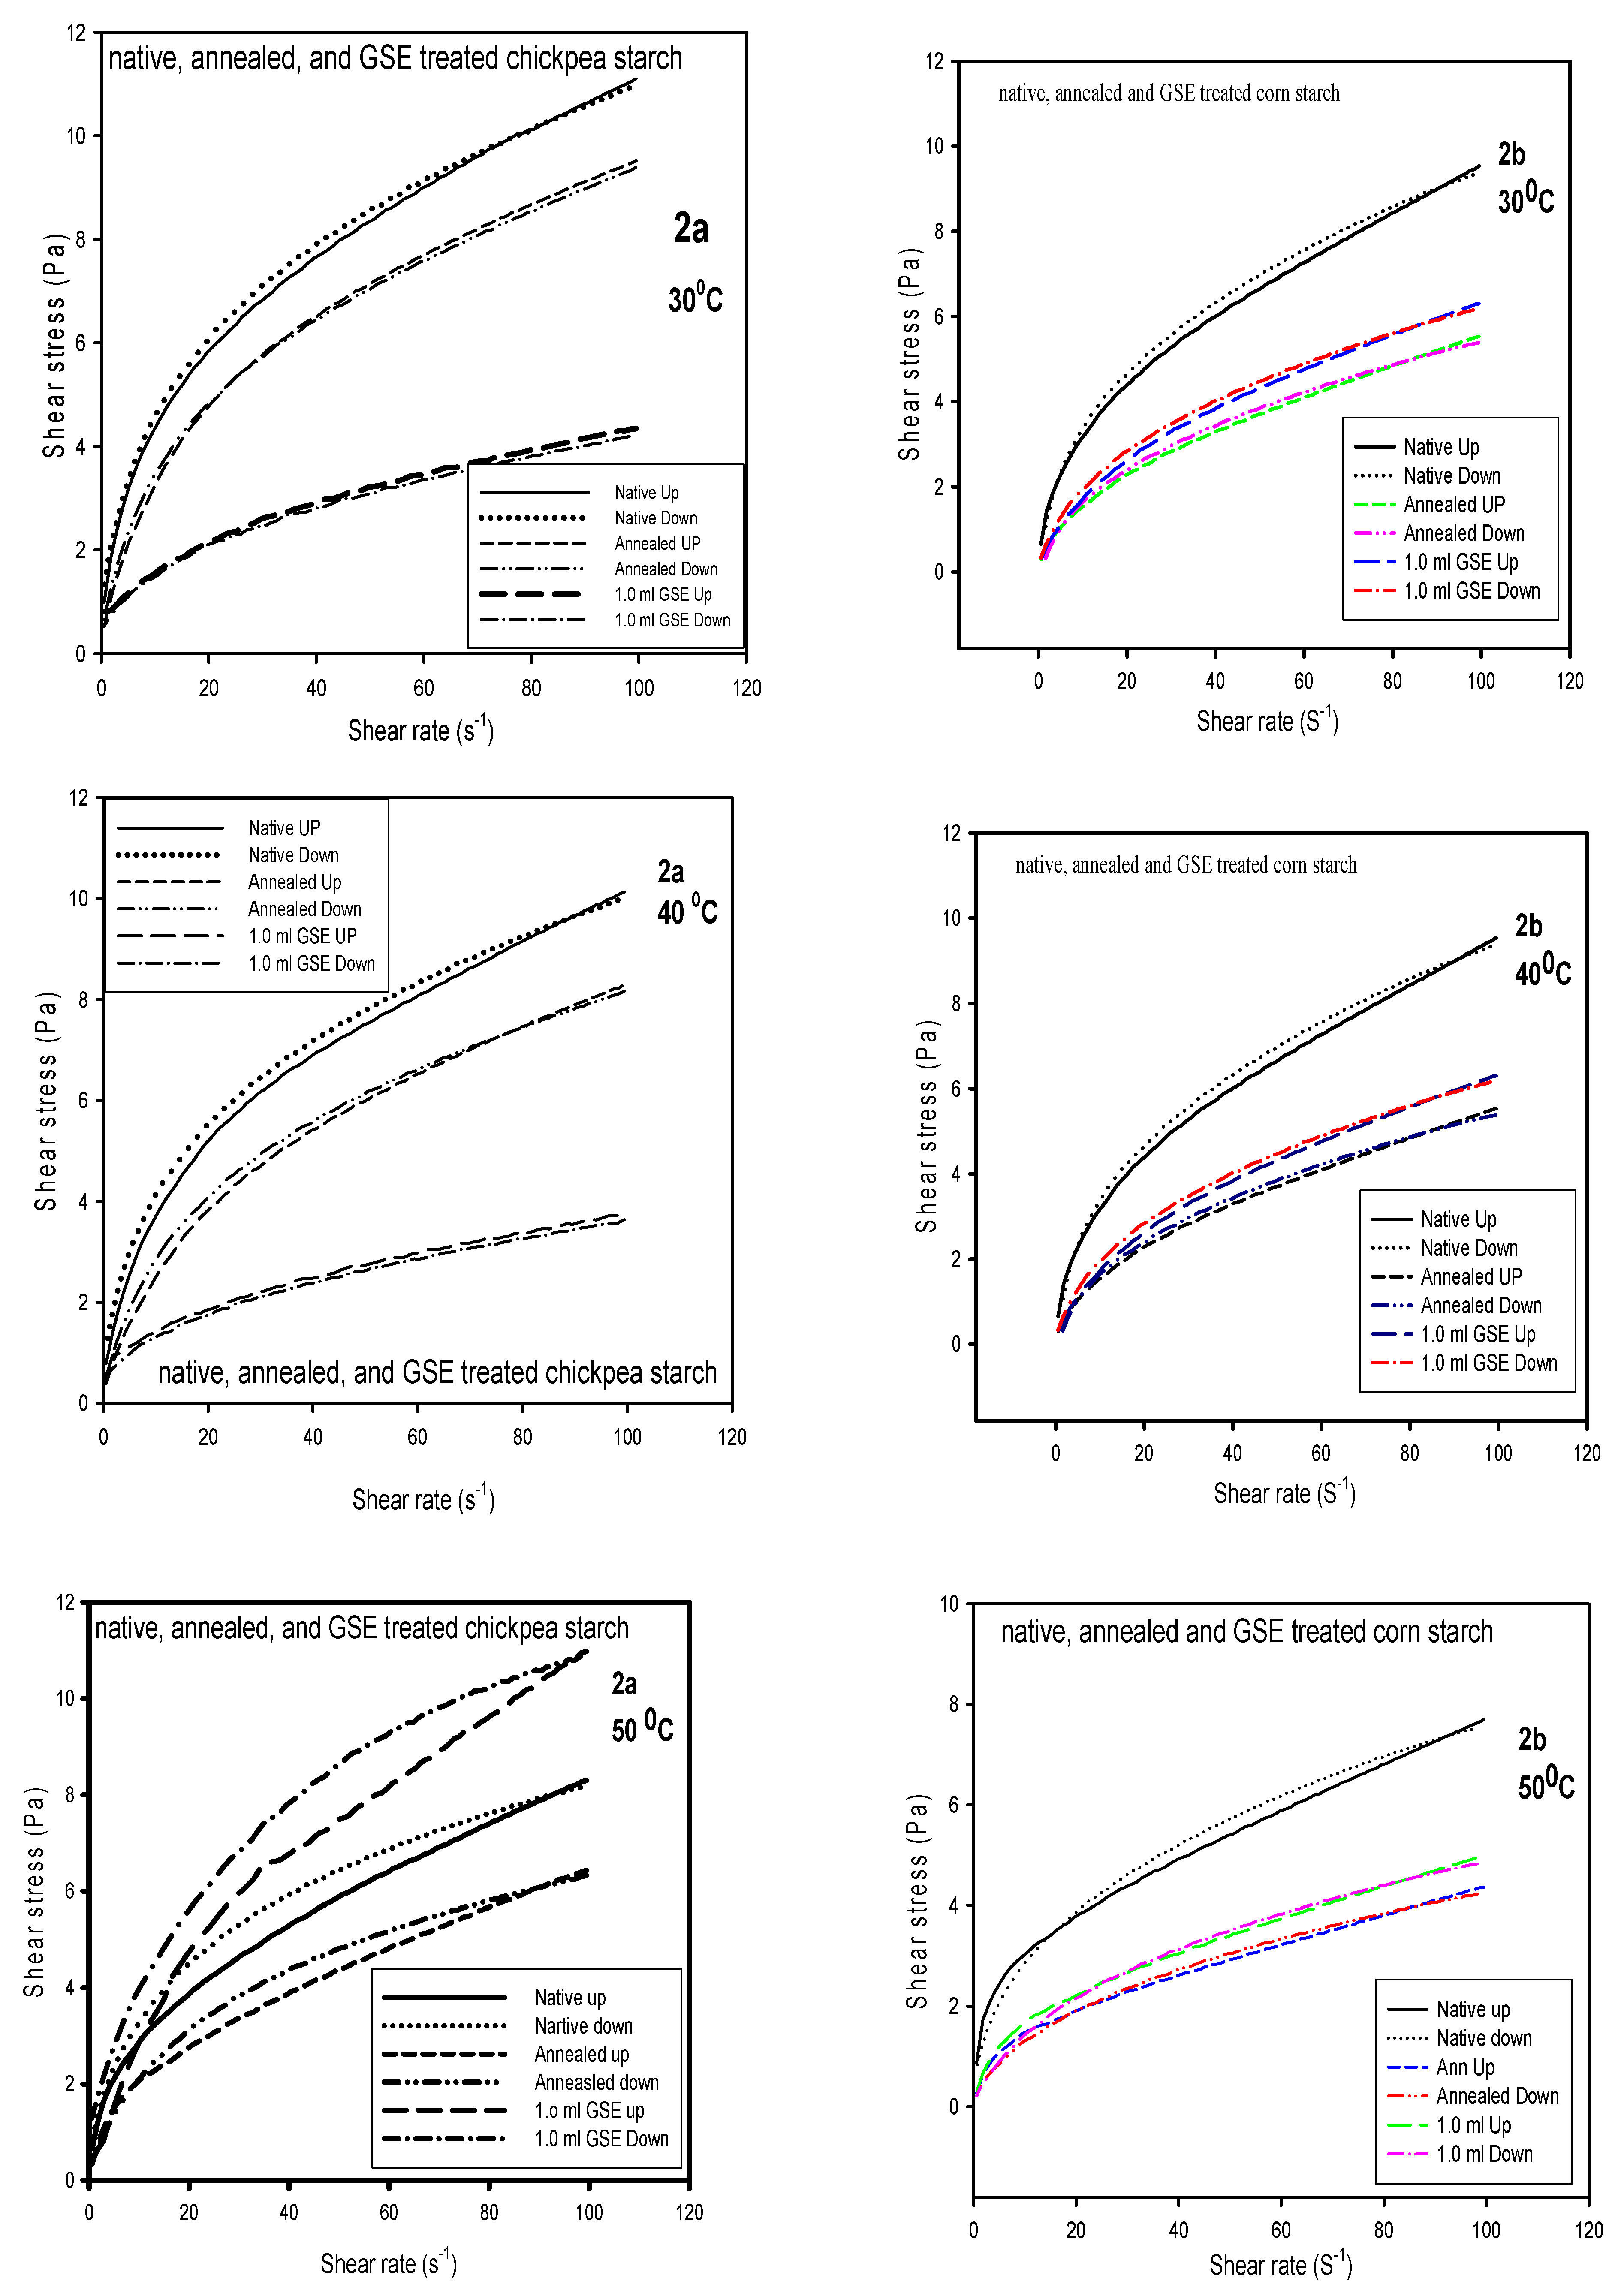
28]. As it happened with the Herschel–Bulkley model, the Casson model data revealed that GSET treatment of the starches caused a significant effect on the native starches compared to annealing. The least yield stress exhibited by TB indicated easy flow behavior. The profiles in Figure 2 showed the Herschel–Bulkley at 30, 40 and 50 °C for all starches. Shearing up and down were presented in order to determine the hysteresis as a function of temperature. In Figure 2a, limited hysteresis was observed for the native CP starch at 30 and 40 °C, but at 50 °C hysteresis was clear for native, annealed and GSET-treated CP starch. Higher stress was required for the down cycle than the up cycle, which indicates that during the up cycle more entanglements were formed, especially for the GSET-treated, and therefore required greater stress (Figure 2a). At 30 and 40 °C, the profiles of CP ranked as native (N) > annealed (Ann) > GSET, but at 50 °C it was GSET > N > Ann, indicating the significant effect of GSET on the gel texture. Conversely, the rank of CS was N > GSET > Ann regardless of temperature or treatment, which is indicative of gel stability (
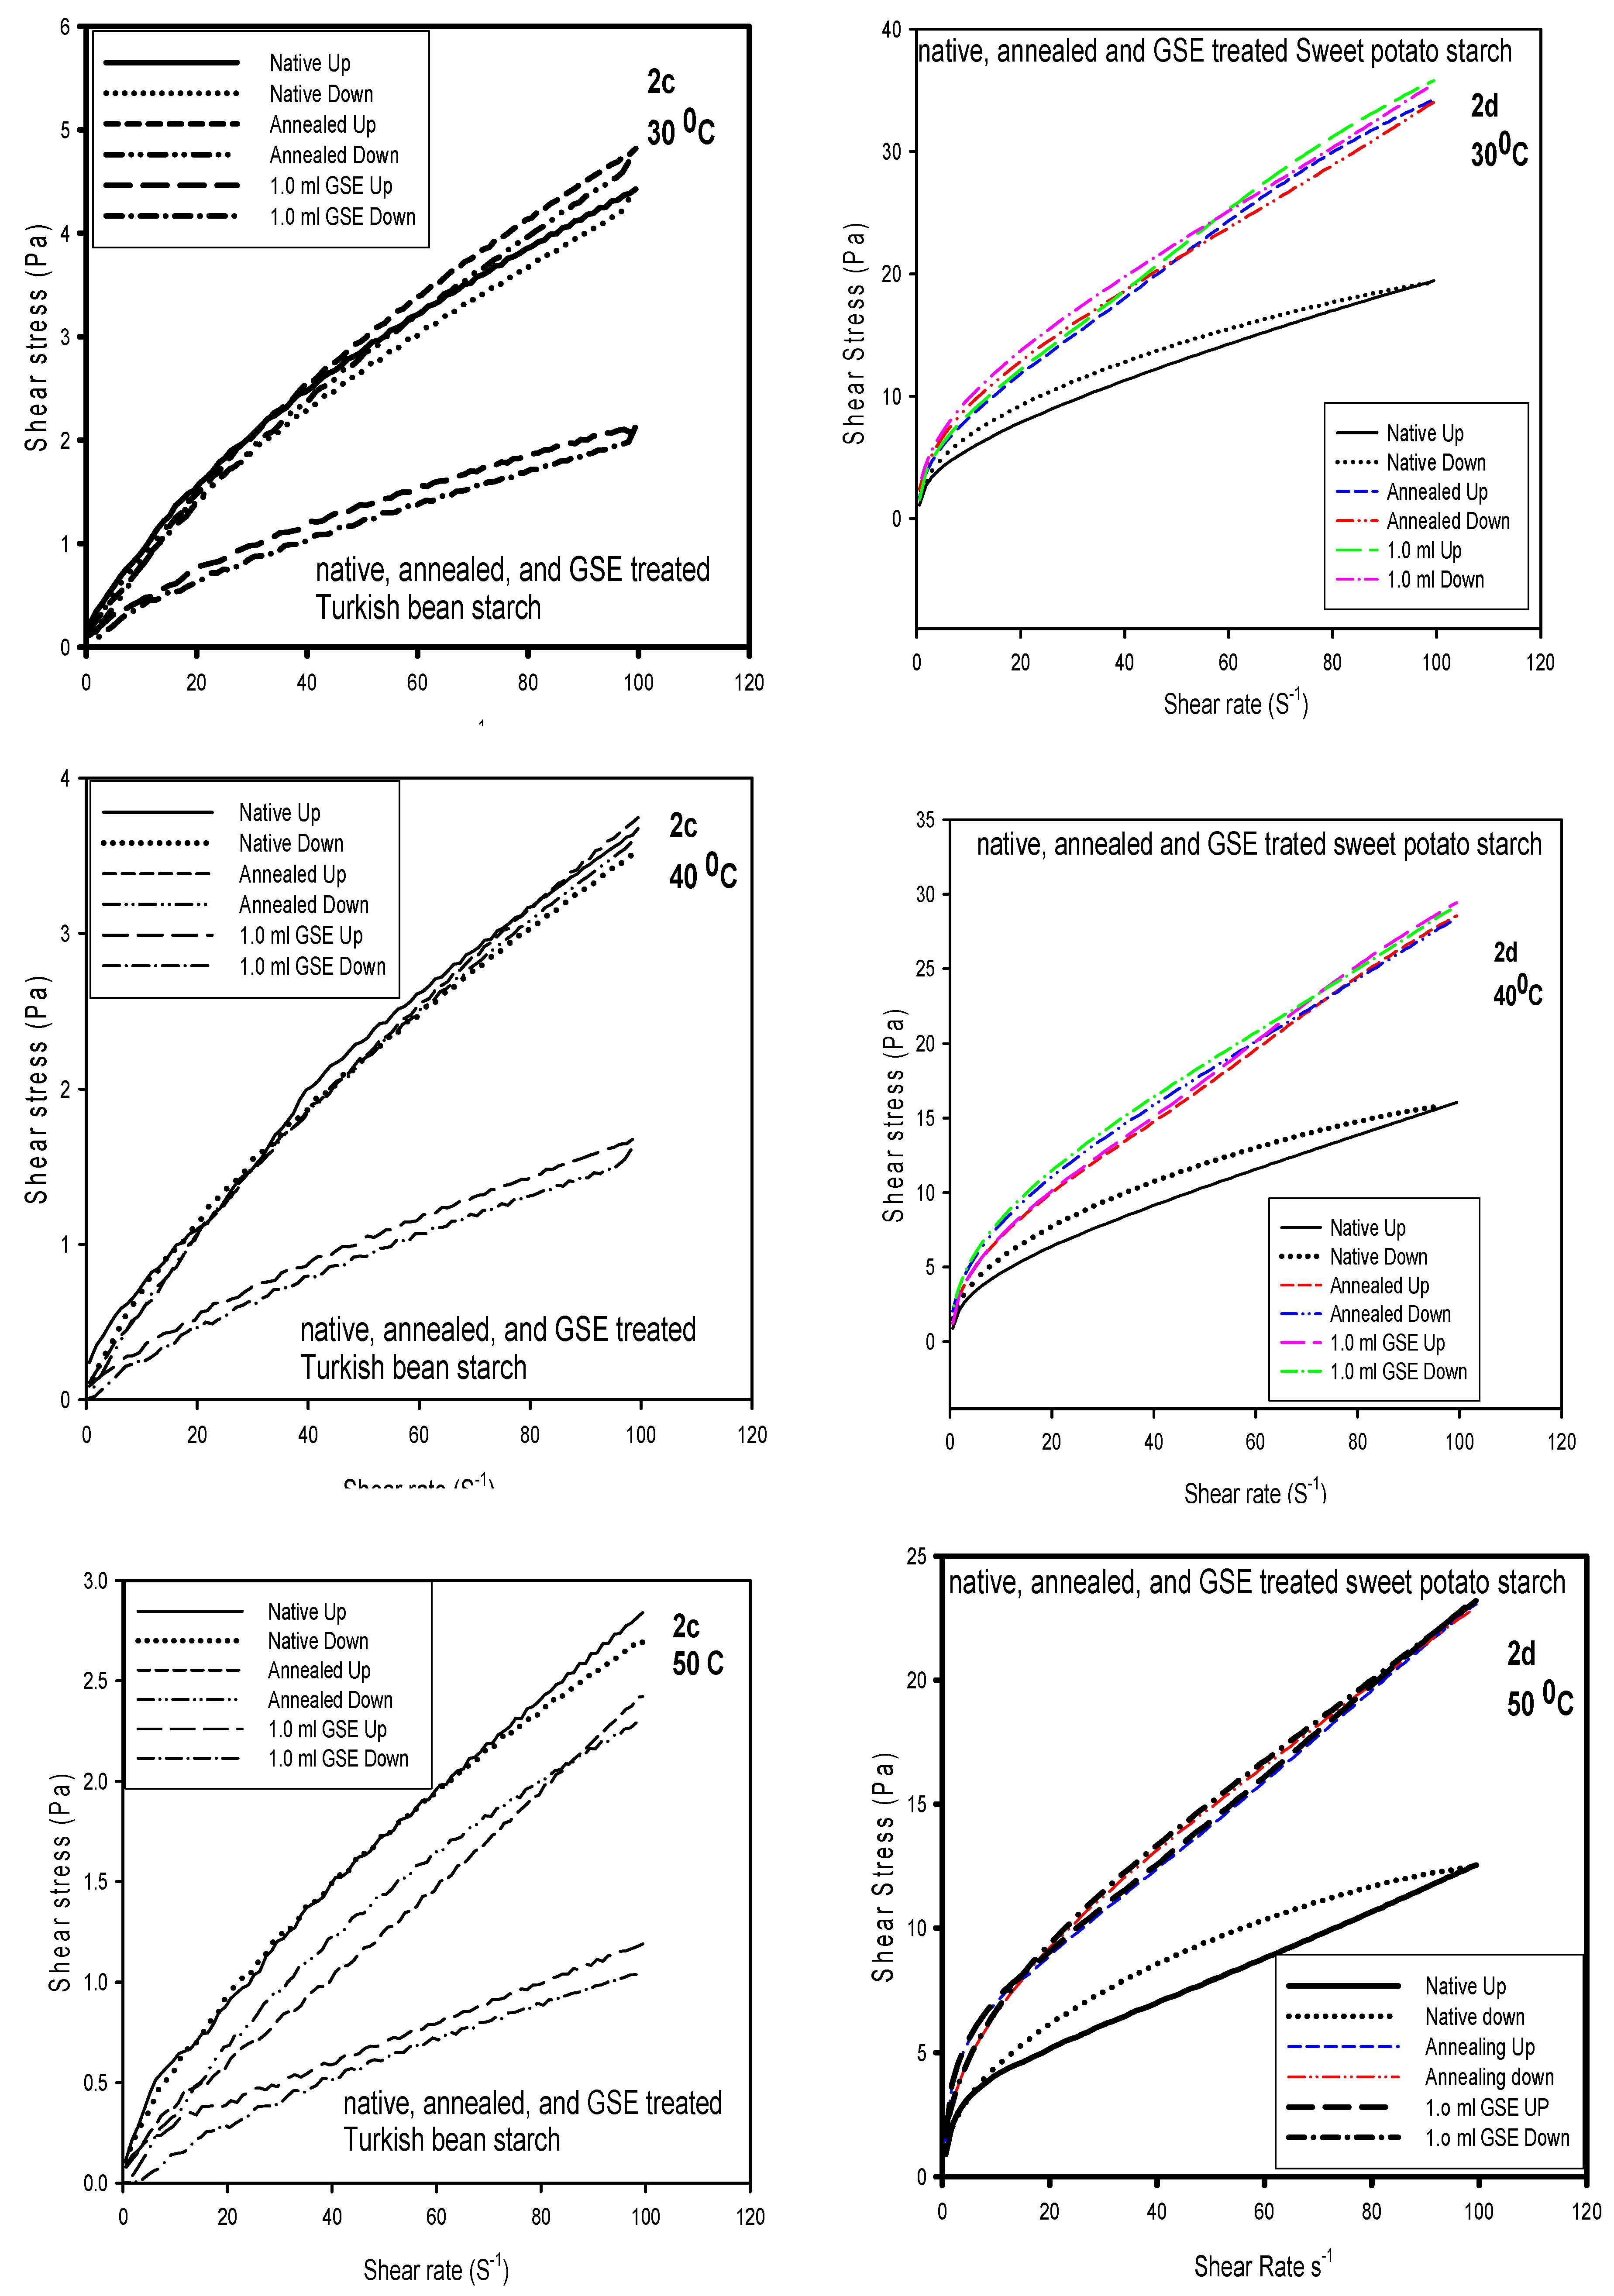
Figure 2b). Therefore, no change in hysteresis was observed. Annealed and native TB gels exhibited similar stress. This was much higher than GSET-treated gel, which indicated a rather high sensitivity to α-amylase, but at 50 °C a clear increase in hysteresis was detected (Figure 2c). The SPS profile showed how GSET and annealing increased the stress of the native starch at all three temperatures, with an obvious increase in hysteresis at higher temperatures. The profile showed no noticeable difference in yield stress magnitude and hysteresis between annealed and GSET (Figure 2d).
It is widely accepted that the effect of temperature on the rheological properties of food systems needs to be established, because during food processing or storage a wide range of temperatures is applied. The effect of temperatures from 30 to 50 °C on the apparent viscosity (at 100 P.Sn) at a definite shear rate of the native or treated starches can be determined by the Arrhenius relationship (Equation (4)), in which the apparent viscosity decreases with temperature following an exponential function. The Arrhenius temperature relationship has been confirmed experimentally in a number of previous studies of native corn starch and modified corn starch [29]. The activation energy (Ea) of the tested starches is presented in Table 4. The calculated Ea and A values were in the range of (660–5369 J/mol) and (0.33 × 10⁻²–78.65 × 10⁻² Pa·s), respectively, with high determination coefficients (r2 = 0.85–0.99) (Table 4). The relatively low r2 of SPS and CP starches, compared to the other starches, could be due to the high stability of SPS during annealing and GSET action, which reduces its responsiveness to temperature change, and that causes increases in the gap between the effect of the temperatures used to calculate the Ea. Conversely, the low r2 of CP could be attributed to its susceptibility to the GSET, which was shown in the Ea values (Table 4) as well as the DSC data presented below. Reports in the literature showed how chemical or physical treatment of starch may cause a direct effect on their activation energy. Park et al. (2004) [30] reported a decrease in activation energy due to OSAN treatment of corn starch, which points to the effect of the chemical modification of starch on Ea. The data showed that annealed starches exhibited higher Ea compared to the native or the GSET-treated, except for SPS where annealed starch had the least Ea. In addition, GSET-treated starches ranked second after annealed with respect to Ea. The higher Ea values of annealed starches are a manifestation of their rheological properties and are more temperature dependent. Therefore, the viscosity of annealed starches was the most temperature depended, whereas native starches were the least. The low Ea indicates a small effect of temperature on the GSET-treated starch, whereas annealed starches exhibited the greatest temperature effect. The Ea of the tested starches can be ranked as TB > CP > CS > SPS, which indicates that, overall, the viscosity of TB was the most temperature-dependent among the tested starches.

3.2. Water Holding Capacity (WHC)

The capacity of starch to bind and hold water is a desirable characteristic in the food industry, mainly when starch is used as stabilizers and emulsifiers, because it prevents syneresis. The data in Table 5 showed that the WHC of the native, annealed and GSET CP exhibited the highest WHC among the starches with a narrow range between the treatments (1.22–1.27), unlike TB (0.94–1.20). In contrast to GSET, annealing increased the WHC of the native CS, while GSET had the lowest WHC. Annealing without GSET reduced the WHC of SPS, but in GSET it was significantly reduced. The reduction in WHC indicates less a porous surface. Therefore, annealing and GSET slightly affected the porosity of CP starch much less than the other starches, because no significant difference was observed after treatment. Unlike the other starches, native SPS seemed to have more granule porosity than annealed and GSET due to the higher WHC. The differences between starch WHC can be attributed to the intensity of the hydrogen bonds on the granule surface and the accessibility of water binding sites. Therefore, the WHC of starches is dependent on granule structure, botanical origin and type of treatment. Previous research indicated that WHC, swelling power and peak viscosity are connected, but not amylose content. Therefore, since annealing increased the WHC of the starches except for SPS, it increased the number of hydroxyl groups by reducing hydrogen bonds between starch chains, thus presenting a greater capacity of water retention [31]. In addition, gums are reported to reduce amylose retrogradation, which causes amylose network disruption and thus water loss and low WHC [32].

3.3. Thermal Properties

As shown in Table 6, the thermal properties of native and enzyme treatment as measured by DSC showed that annealing increased the onset (To) and peak temperatures (Tp) of native starch by an average of 6.0 °C and decreased the enthalpy (ΔH) by 5.0 °C, except for CS, where the decrease was much less. The effect of GSET-annealing on To, Tp and ΔH of all tested starches was more obvious than annealing without GSET. Compared to other starches, the effect on the thermal properties of CP starch was more pronounced because the drop in ΔH was much greater, which indicates more sensitivity to annealing with or without GSET. Other starches exhibited a closer range between the To, Tp and ΔH after annealing. The highest increase in To due to annealing and GSET treatment was observed for CP, which was about 20 and 26%, respectively. The remaining starches exhibited an increase around 6% due to annealing and an average of 9% due to GSET. The increase in Tp of the native starch was much less than To, which points to the hydrolysis of the amorphous structure by the enzyme, since the amorphous regions facilitate for the melting of the crystalline region structure [33]. In addition, the increase in Tp indicates a high structural organization of the granule due to annealing. The ΔH decreased due to annealing as well as GSET treatment, which supports the hydrolysis idea of the crystalline region and the helical structures in the granule by the enzyme. A decrease in ΔH was reported in the literature after annealing, which was attributed to weaker interaction between amylose and amylopectin during annealing [33]. Therefore, the present results suggest the simultaneous hydrolysis of both amorphous and crystalline structures of the starch granules. These data are agreement with previous reports [4,32].

4. Syneresis Measurement

Overall, the syneresis of the tested starches decreased after annealing and further decreased after GSET treatment (Table 7). The % syneresis of the native starches is ranked as follows, TB > CP > CS > SPS, whereas the effect of annealing and GSET on syneresis was different. The native TB exhibited the highest syneresis after 4 and 8 days, followed by annealing and GSET. Unlike other tested starches, the SPS gel showed a different pattern, because annealing had more syneresis than native. A similar pattern of difference between the tested starches was observed in the WHC data. Although native TB starch did not have the highest WHC, it has the most syneresis compared to the other starches. This data showed how SPS has the least WHC and the least syneresis. High amylose content has been associated with high syneresis and slower enzymatic hydrolysis of starch [34]. Although TB had low amylose content, it exhibited the highest syneresis for the native and GSET-treated samples. Once more, the granule structure and the starch origin appeared to explain the difference between the % syneresis between the tested starches. Therefore, for the most part, GSET appeared to reduce syneresis, which is desirable for use in frozen food formulations where water separation before consumption is a common problem.

5. Conclusions

The results of the investigation revealed a considerable disparity in the rheological properties of the starches studied. The steady shear properties were affected by annealing and GSET treatment. The power law, Casson and Herschel–Bulkley models showed high accuracy with high determination coefficients (r2 = 0.99). The effect of temperature on the apparent viscosity (ηa,100) was well explained by the Arrhenius equation. Compared to native and GSET-treated samples, annealed samples had the highest Ea, although native SPS had the highest Ea. The Ea of CS (1667 J/mol) and SPS (1253 J/mol) were, however, wider, indicating that the applied treatments induced more changes in these starches and less in CP (864 J/mol) and TB (564 J/mol). Finally, the main practical outcome of this investigation is that starch annealing increased the apparent viscosity of native CP, TB and SPS starches in general, but CS at 40 and 50 °C showed viscosity reduction. As a result, it is possible to change the viscosity of the starch system without modifying the native starch concentration. The starch origin made a difference in the physicochemical behavior of the starch, as evidenced by the thermal characteristics, WHC and percent syneresis data.

Author Contributions

Conceptualization, A.A.M. and M.S.A.; methodology, S.H.; software, S.H.; validation, M.S.A., A.A.M. and H.M.Y.; formal analysis, A.A.Q.; investigation, M.I.I.; resources, M.I.I.; data curation, H.A.; writing—original draft preparation, H.A.; writing—review and editing, A.A.M.; visualization, M.S.A.; supervision A.A.M.; project administration G.S.; funding acquisition, G.S. All authors have read and agreed to the published version of the manuscript.

Funding

This research was funded by the Deanship of Scientific Research at King Saud University for funding this work through research group no. RGP-114.

Institutional Review Board Statement

Not applicable.

Informed Consent Statement

Not applicable.

Acknowledgments

The authors extent their appreciation to the Deanship of Scientific Research at King Saud University for funding this work through research group no. RGP-114.

Conflicts of Interest

The authors declare no conflict of interest.

References

  1. Pukkahuta, C.; Suwannawat, B.; Shobsngob, S.; Varavinit, S. comparative study of pasting and thermal transition characteristics of osmotic pressure and heat–moisture treated corn starch. Carbohydr. Polym. 2008, 72, 527–536. [Google Scholar] [CrossRef]
  2. Kohyama, K.; Sasaki, T. differential scanning calorimetry and a model calculation of starches annealed at 20 and 50 c. Carbohydr. Polym. 2006, 63, 82–88. [Google Scholar] [CrossRef]
  3. Nakazawa, Y.; Wang, Y.-J. Effect of annealing on starch–palmitic acid interaction. Carbohydr. Polym. 2004, 57, 327–335. [Google Scholar] [CrossRef]
  4. Qi, X.; Tester, R.; Snape, C.; Ansell, R. the effect of annealing on structure and gelatinization of maize starches with amylose dosage series. Prog. Food Biopolym. Res. 2005, 1, 1–27. [Google Scholar]
  5. Shi, Y.-C. Two-and multi-step annealing of cereal starches in relation to gelatinization. J. Agric. Food Chem. 2008, 56, 1097–1104. [Google Scholar] [CrossRef]
  6. Jiranuntakul, W.; Puttanlek, C.; Rungsardthong, V.; Puncha-arnon, S.; Uttapap, D. microstructural and physicochemical properties of heat-moisture treated waxy and normal starches. J. Food Eng. 2011, 104, 246–258. [Google Scholar] [CrossRef]
  7. Tester, R.F.; Debon, S.J. annealing of starch—A review. Int. J. Biol. Macromol. 2000, 27, 1–12. [Google Scholar] [CrossRef]
  8. Kiseleva, V.I.; Krivandin, A.V.; Fornal, J.; Błaszczak, W.; Jeliński, T.; Yuryev, V.P. annealing of normal and mutant wheat starches. lm, sem, dsc, and saxs studies. Carbohydr. Res. 2005, 340, 75–83. [Google Scholar] [CrossRef]
  9. Leach, H.W. structure of the starch granule. Cereal Chem. 1961, 38, 34–46. [Google Scholar]
  10. Blazek, J.; Gilbert, E.P. effect of enzymatic hydrolysis on native starch granule structure. Biomacromolecules 2010, 11, 3275–3289. [Google Scholar] [CrossRef]
  11. Srichuwong, S.; Sunarti, T.C.; Mishima, T.; Isono, N.; Hisamatsu, M. starches from different botanical sources i: Contribution of amylopectin fine structure to thermal properties and enzyme digestibility. Carbohydr. Polym. 2005, 60, 529–538. [Google Scholar] [CrossRef]
  12. Zhou, Y.; Hoover, R.; Liu, Q. relationship between α-amylase degradation and the structure and physicochemical properties of legume starches. Carbohydr. Polym. 2004, 57, 299–317. [Google Scholar] [CrossRef]
  13. Jane, J.-L.; Wong, K.-S.; Mcpherson, A.E. branch-structure difference in starches of a-and b-type x-ray patterns revealed by their naegeli dextrins. Carbohydr. Res. 1997, 300, 219–227. [Google Scholar] [CrossRef]
  14. Lima, B.N.; Cabral, T.B.; Cneto, R.P.; Tavares, M.I.B.; Pierucci, A.P.T. estudo do amido de farinhas comerciais comestíveis. Polímeros 2012, 22, 486–490. [Google Scholar] [CrossRef] [Green Version]
  15. Singh, B.; Singh, J.P.; Shevkani, K.; Singh, N.; Kaur, A. bioactive constituents in pulses and their health benefits. J. Food Sci. Technol. 2017, 54, 858–870. [Google Scholar] [CrossRef] [Green Version]
  16. Valetudie, J.C.; Gallant, D.J.; Bouchet, B.; Colonna, P.; Champ, M. influcence of cooking procedures on structure and biochemical changes in sweet potato. Starch-Stärke 1999, 51, 389–397. [Google Scholar] [CrossRef]
  17. Sun, A.; Gunasekaran, S. yield stress in foods: Measurements and applications. Int. J. Food Prop. 2009, 12, 70–101. [Google Scholar] [CrossRef]
  18. Ahmed, J.; Ramaswamy, H.S.; Ayad, A.; Alli, I. thermal and dynamic rheology of insoluble starch from basmati rice. Food Hydrocoll. 2008, 22, 278–287. [Google Scholar] [CrossRef]
  19. Lawal, O.S.; Lapasin, R.; Bellich, B.; Olayiwola, T.O.; Cesàro, A.; Yoshimura, M.; Nishinari, K. rheology and functional properties of starches isolated from five improved rice varieties from west africa. Food Hydrocoll. 2011, 25, 1785–1792. [Google Scholar] [CrossRef]
  20. Alqah, H.; Alamri, M.; Mohamed, A.; Hussain, S.; Qasem, A.; Ibraheem, M.; Ababtain, I. the effect of germinated sorghum extract on the pasting properties and swelling power of different annealed starches. Polymers 2020, 12, 1602. [Google Scholar] [CrossRef] [PubMed]
  21. Alamri, M.S.; Mohamed, A.A.; Hussain, S. Effects of alkaline-soluble okra gum on rheological and thermal properties of systems with wheat or corn starch. Food Hydrocoll. 2013, 30, 541–551. [Google Scholar] [CrossRef]
  22. Sit, N.; Misra, S.; Deka, S.C. Physicochemical, functional, textural and colour characteristics of starches isolated from four taro cultivars of North-East India. Starch-Stärke 2013, 65, 1011–1021. [Google Scholar] [CrossRef]
  23. Afify, A.E.-M.M.R.; El-Beltagi, H.S.; El-Salam, S.M.A.; Omran, A.A. Protein Solubility, Digestibility and Fractionation after Germination of Sorghum Varieties. PLoS ONE 2012, 7, e31154. [Google Scholar] [CrossRef] [PubMed] [Green Version]
  24. Wang, W.; Chen, W.; Yang, H.; Cui, M. textural and rheological properties of potato starch as affected by amino acids. Int. J. Food Prop. 2017, 20, s3123–s3134. [Google Scholar] [CrossRef] [Green Version]
  25. Haminiuk, C.; Sierakowski, M.; Vidal, J.; Masson, M. influence of temperature on the rheological behavior of whole araçá pulp (psidium cattleianum sabine). Lwt-Food Sci. Technol. 2006, 39, 427–431. [Google Scholar] [CrossRef]
  26. Leite, T.D.; Nicoleti, J.F.; Penna, A.L.B.; Franco, C.M.L. Effect of addition of different hydrocolloids on pasting, thermal, and rheological properties of cassava starch. Ciênc. Tecnol. Aliment. Camp. 2012, 32, 579–587. [Google Scholar] [CrossRef] [Green Version]
  27. Achayuthakan, P.; Suphantharika, M.; Rao, M. yield stress components of waxy corn starch–xanthan mixtures: Effect of xanthan concentration and different starches. Carbohydr. Polym. 2006, 65, 469–478. [Google Scholar] [CrossRef]
  28. Molavi, H.; Razavi, S.M. steady shear rheological properties of native and hydrothermally modified persian acorn (quercus brantii lindle.) starches. Starch-Stärke 2018, 70, 1700156. [Google Scholar] [CrossRef]
  29. Yoo, B. steady and dynamic shear rheology of glutinous rice flour dispersions. Int. J. Food Sci. Technol. 2006, 41, 601–608. [Google Scholar] [CrossRef]
  30. Park, S.; Chung, M.G.; Yoo, B. effect of octenylsuccinylation on rheological properties of corn starch pastes. Starch-Stärke 2004, 56, 399–406. [Google Scholar] [CrossRef]
  31. Shrestha, A.K.; Blazek, J.; Flanagan, B.M.; Dhital, S.; Larroque, O.; Morell, M.K.; Gilbert, E.P.; Gidley, M.J. Molecular, mesoscopic and microscopic structure evolution during amylase digestion of maize starch granules. Carbohydr. Polym. 2012, 90, 23–33. [Google Scholar] [CrossRef] [PubMed]
  32. Varatharajan, V.; Hoover, R.; Li, J.; Vasanthan, T.; Nantanga, K.; Seetharaman, K.; Liu, Q.; Donner, E.; Jaiswal, S.; Chibbar, R. Impact of structural changes due to heat-moisture treatment at different temperatures on the susceptibility of normal and waxy potato starches towards hydrolysis by porcine pancreatic alpha amylase. Food Res. Int. 2011, 44, 2594–2606. [Google Scholar] [CrossRef]
  33. Oliveira, D.M.; Kwiatkowski, A.; Rosa, C.I.L.F.; Clemente, E.; de Moura Pontara, L.P.; Haminiuk, C.W.I. physicochemical and rheological evaluation of cassava flower honey produced by africanized apis mellifera. Food Sci. Technol. Res. 2015, 21, 23–29. [Google Scholar] [CrossRef] [Green Version]
  34. Kemashalini, K.; Prasantha, B.D.R.; Chandrasiri, K.A.K.L. Physico-chemical Properties of High and Low Amylose Rice Flour. Adv. Food Sci. Eng. 2018, 2, 115–124. [Google Scholar] [CrossRef]
Figure 1. Shear rate/shear stress of native, annealed and treated with germinated sorghum extract (GSET) chickpea (a), corn (b), Turkish bean (c) and sweet potato (d) starches.
Processes 09 02251 g001
Figure 2. The Herschel-Bulkley model at 30, 40, and 50 °C of chickpea, corn, Turkish bean and sweet potato starches. (a,b) The shear rate and shear stress of Herschel-Bulkley model at 30, 40, and 50 °C of chickpea and corn starches; (c,d) The shear rate and shear stress of Herschel-Bulkley model at 30, 40, and 50 °C of Turkish bean and sweet potato starches.
Processes 09 02251 g002aProcesses 09 02251 g002b
Table 1. Effect of temperature on power law model parameters (n, K) and apparent viscosity of chickpea, corn, Turkish bean, and sweet potato starches tested at 30 and 40 °C.
Apparent Viscosity ηa at, 100 [Pa·sn]kNR2
30 °C
Native
Chickpea0.11 ± 0.04 b11.80 ± 0.03 ab0.39 ± 0.02 d0.99
Corn0.11 ± 0.02 b1.39 ± 0.06 b0.45 ± 0.01 c0.99
Turkish bean0.04 ± 0.07 c0.20 ± 0.01 c0.70 ± 0.03 a0.99
Sweet potato0.20 ± 0.03 a1.90 ± 0.08 a0.51 ± 0.01 b0.99
Annealed
Chickpea0.91 ± 0.12 a1.25 ± 0.40 b0.44 ± 0.04 d0.99
Corn0.07 ± 0.05 c0.61 ± 0.03 c0.52 ± 0.01 c0.99
Turkish bean0.05 ± 0.07 d0.15 ± 0.01 d0.74 ± 0.06 a0.99
Sweet potato0.34 ± 0.06 b1.84 ± 0.90 a0.63 ± 0.04 b0.99
GSE treated
Chickpea0.04 ± 0.01 c0.96 ± 0.03 c0.25 ± 0.02 bc0.99
Corn0.07 ± 0.05 b0.73 ± 0.04 b0.52 ± 0.02 c0.99
Turkish bean0.02 ± 0.07 d0.08 ± 0.01 d0.68 ± 0.04 a0.99
Sweet potato0.34 ± 0.03 a1.97 ± 0.70 a0.62 ± 0.04 a b0.99
40 °C
Native
Chickpea0.10 ± 0.01 a1.55 ± 0.07 a0.40 ± 0.01 c0.99
Corn0.09 ± 0.02 b1.17 ± 0.02 a0.45 ± 0.06 c0.99
Turkish bean0.03 ± 0.02 c0.13 ± 0.01 b0.68 ± 0.02 a0.99
Sweet potato0.17 ± 0.06 a1.55 ± 0.06 a0.50 ± 0.02 b0.99
Annealed
Chickpea0.69 ± 0.04 a0.94 ± 0.02 b0.47 ± 0.02 d0.99
Corn0.05 ± 0.03 c0.49 ± 0.02 c0.51 ± 0.02 c0.99
Turkish bean0.03 ± 0.06 c0.10 ± 0.01 d0.77 ± 0.02 a0.99
Sweet potato0.29 ± 0.03 b1.62 ± 0..06 a0.62 ± 0.01 b0.99
GSE treated
Chickpea0.03 ± 0.01 c0.59 ± 0.02 b0.59 ± 0.01 c0.99
Corn0.06 ± 0.07 b0.56 ± 0.02 b c0.50 ± 0.03 cd0.99
Turkish bean0.02 ± 0.02 c0.05 ± 0.02 d0.73 ± 0.01 a0.99
Sweet potato0.29 ± 0.05 a1.66 ± 0.40 a0.62 ± 0.03 b0.99
50 °C
Native
Chickpea0.08 ± 0.04 c1.15 ± 0.06 a0.43 ± 0.01 b0.99
Corn0.07 ± 0.06 c1.06 ± 0.10 a0.42 ± 0.03 b0.99
Turkish bean0.02 ± 0.02 c0.11 ± 0.01 b0.66 ± 0.05 a0.99
Sweet potato0.13 ± 0.01 c1.30 ± 0.08 a0.49 ± 0.01 b0.99
Annealed
Chickpea0.53 ± 0.05 b0.67 ± 0.03 a0.49 ± 0.01 c0.99
Corn0.04 ± 0.08 c0.33 ± 0.01 b0.51 ± 0.02 a0.99
Turkish bean0.02 ± 0.03 b0.05 ± 0.02 b0.82 ± 0.04 a0.99
Sweet potato0.23 ± 0.01 c1.61 ± 0.80 a0.56 ± 0.01 b0.98
GSE treated
Chickpea0.11 ± 0.04 b0.56 ± 0.04 a0.56 ± 0.03 a0.87
Corn0.04 ± 0.02 c0.47 ± 0.04 c0.50 ± 0.02 c0.99
Turkish bean0.01 ± 0.03 b0.03 ± 0.01 b0.73 ± 0.01 a0.99
Sweet potato0.23 ± 0.03 c1.67 ± 0.80 a0.56 ± 0.01 b0.99
1 Values followed by different superscript letters within each raw are significantly different (p ≤ 0.05).
Table 2. Effect of annealing and germinated sorghum extract on Herschel–Bulkley model parameters (T0, K, n) of chickpea, corn, Turkish bean and sweet potato starches tested at 30 °C and 40 °C.
0KR2
30 °C
Native
Chickpea2.48 ± 0.70 a10.03 ± 0.01 c0.99
Corn1.94 ± 0.81 b0.04 ± 0.01 b0.99
Turkish bean0.13 ± 0.01 c0.01 ± 0.01 d0.99
Sweet potato2.66 ± 1.13 a0.08 ± 0.13 a0.99
Annealed
Chickpea1.74 ± 0.72 b0.03 ± 0.02 b0.99
Corn0.86 ± 0.02 c0.02 ± 0.01 c0.99
Turkish bean0.14 ± 0.03 d0.18 ± 0.03 a0.99
Sweet potato2.44 ± 0.90 a0.18 ± 0.02 a0.99
GSE treated
Chickpea0.70 ± 0.02 c0.01 ± 0.02 c0.98
Corn0.96 ± 0.01 b0.03 ± 0.02 b0.98
Turkish bean0.10 ± 0.01 d0.01 ± 0.01 c0.99
Sweet potato2.61 ± 1.51 a0.19 ± 0.01 a0.99
40 °C
Native
Chickpea2.14 ± 0.90 a0.031 ± 0.01 b0.99
Corn1.64 ± 0.4 b0.03 ± 0.01 b0.98
Turkish bean0.15 ± 0.01 c0.02 ± 0.01 c0.99
Sweet potato2.15 ± 1.0 a0.06 ± 0.10 a0.99
Annealed
Chickpea1.44 ± 0.50 b0.02 ± 0.01 b0.99
Corn0.68 ± 0.05 c0.02 ± 0.01 b0.99
Turkish bean0.08 ± 0.02 d0.02 ± 0.01 b0.99
Sweet potato2.33 ± 0.60 a0.15 ± 0.01 a0.99
GSE treated
Chickpea0.79 ± 0.03 b0.01 ± 0.01 c0.98
Corn0.77 ± 0.02 b0.02 ± 0.01 b0.98
Turkish bean0.05 ± 0.02 c0.01 ± 0.01 c0.99
Sweet potato2.36 ± 1.20 a0.15 ± 0.03 a0.99
50 °C
Native
Chickpea1.59 ± 0.20 a0.02 ± 0.01 b0.99
Corn1.51 ± 0.50 a0.02 ± 0.01 b0.98
Turkish bean0.14 ± 0.01 b0.02 ± 0.01 b0.99
Sweet potato1.83 ± 0.90 a0.04 ± 0.10 a0.98
Annealed
Chickpea0.94 ± 0.02 b0.02 ± 0.01 b0.99
Corn0.57 ± 0.02 c0.01 ± 0.01 c0.99
Turkish bean0.03 ± 0.01 d0.01 ± 0.01 c0.99
Sweet potato2.27 ± 0.80 a0.10 ± 0.01 a0.99
Treated
Chickpea1.15 ± 0.80 b4.68 ± 1.60 b0.98
Corn0.65 ± 0.01 c0.02 ± 0.01 d0.98
Turkish bean0.04 ± 0.01 d7.60 ± 2.30 a0.99
Sweet potato2.22 ± 1.60 a0.10 ± 0.01 c0.99
1 Values followed by different superscript letters within each raw are significantly different (p ≤ 0.05).
Table 3. Effect of annealing and germinated sorghum extract on Casson model parameters (T0, K) of chickpea, corn, Turkish bean and sweet potato starches tested at 30 °C and 40 °C, consistency index (K), flow behavior (n) index and the yield stress (T0).
0KR2
30 °C
Native
Chickpea2.48 ± 0.70 a10.03 ± 0.01 c0.99
Corn1.94 ± 0.81 b0.04 ± 0.01 b0.99
Turkish bean0.13 ± 0.01 c0.01 ± 0.01 d0.99
Sweet potato2.66 ± 1.13 a0.08 ± 0.13 a0.99
Annealed
Chickpea1.74 ± 0.72 b0.03 ± 0.02 b0.99
Corn0.86 ± 0.02 c0.02 ± 0.01 c0.99
Turkish bean0.14 ± 0.03 d0.18 ± 0.03 a0.99
Sweet potato2.44 ± 0.90 a0.18 ± 0.02 a0.99
GSE treated
Chickpea0.70 ± 0.02 c0.01 ± 0.02 c0.98
Corn0.96 ± 0.01 b0.03 ± 0.02 b0.98
Turkish bean0.10 ± 0.01 d0.01 ± 0.01 c0.99
Sweet potato2.61 ± 1.51 a0.19 ± 0.01 a0.99
40 °C
Native
Chickpea2.14 ± 0.90 a0.031 ± 0.01 b0.99
Corn1.64 ± 0.4 b0.03 ± 0.01 b0.98
Turkish bean0.15 ± 0.01 c0.02 ± 0.01 c0.99
Sweet potato2.15 ± 1.0 a0.06 ± 0.10 a0.99
Annealed
Chickpea1.44 ± 0.50 b0.02 ± 0.01 b0.99
Corn0.68 ± 0.05 c0.02 ± 0.01 b0.99
Turkish bean0.08 ± 0.02 d0.02 ± 0.01 b0.99
Sweet potato2.33 ± 0.60 a0.15 ± 0.01 a0.99
GSE treated
Chickpea0.79 ± 0.03 b0.01 ± 0.01 c0.98
Corn0.77 ± 0.02 b0.02 ± 0.01 b0.98
Turkish bean0.05 ± 0.02 c0.01 ± 0.01 c0.99
Sweet potato2.36 ± 1.20 a0.15 ± 0.03 a0.99
50 °C
Native
Chickpea1.59 ± 0.20 a0.02 ± 0.01 b0.99
Corn1.51 ± 0.50 a0.02 ± 0.01 b0.98
Turkish bean0.14 ± 0.01 b0.02 ± 0.01 b0.99
Sweet potato1.83 ± 0.90 a0.04 ± 0.10 a0.98
Annealed
Chickpea0.94 ± 0.02 b0.02 ± 0.01 b0.99
Corn0.57 ± 0.02 c0.01 ± 0.01 c0.99
Turkish bean0.03 ± 0.01 d0.01 ± 0.01 c0.99
Sweet potato2.27 ± 0.80 a0.10 ± 0.01 a0.99
GSE treated
Chickpea1.15 ± 0.80 b4.68 ± 1.60 b0.98
Corn0.65 ± 0.01 c0.02 ± 0.01 d0.98
Turkish bean0.04 ± 0.01 d7.60 ± 2.30 a0.99
Sweet potato2.22 ± 1.60 a0.10 ± 0.01 c0.99
1 Values followed by different superscript letters within each raw are significantly different (p ≤ 0.05).
Table 4. Activation energies (Ea) of native, annealed and GSET-treated starch pastes.
Ea (J/mol)A × 10−2 (Pa·s) r 2
Native
CP 12183.88.670.95
CS 21329.621.50.98
TB 35054.910.280.97
SPS 41857.813.090.99
Annealed
CP3047.80.330.99
CS2996.10.660.97
TB5359.111.080.98
SPS659.5169.890.88
1.0 mL GSET 5-treated
CP2659.22.290.85
CS2158.55.930.99
TB4795.810.160.96
SPS606.378.650.89
1 CP = chickpea; 2 CS = corn starch; 3 TB = Turkish bean; 4 SPS = sweet potato starch; 5 GSET = germinated sorghum extract.
Table 5. The effect of enzyme extract (GSE) on the water holding capacity of starches annealed at 60 °C for 60 min.
Water Holding Capacity
CP 2CS 3TB 4SPS 5
Native1.22 a6 ± 0.060.87 d ± 0.010.94 b ± 0.040.90 c ± 0.02
Annealed without GSE 11.27 a ± 0.081.04 b ± 0.081.02 b ± 0.060.81 c ± 0.06
Annealed in GSE1.23 a ± 0.100.79 c ± 0.11.20 a ± 0.0 00.49 d ± 0.08
1 Annealed without GSE; 2 CP = chickpea; 3 CS = corn starch; 4 TB = Turkish bean; 5 SPS = sweet potato starch. 6 Values followed by different letters within each row are significantly different (p ≤ 0.05).
Table 6. The effect of enzyme extract (GSE) on the thermal properties of annealed starches at 60 °C for 60 min.
To 6Tp 7ΔH 8 (J/g)
CP 1Native 954.763.113.5
Annealed65.669.38.1
GSET 568.973.65.9
CS 2Native66.370.912.1
Annealed69.373.411.1
GSET71.474.98.8
TB 3Native67.676.713.4
Annealed72.776.39.2
GSET73.977.610.4
SPS 4Native70.076.915.5
Annealed75.379.913.9
GSET75.279.911.9
1 CP = chickpea; 2 CS = corn starch; 3 TB = Turkish bean; 4 SPS = sweet potato starch. 5 GSET = enzyme treated; 6 To = onset temperature; 7 Tp = peak temperature; 8 ΔH = enthalpy. 9 Native.
Table 7. The effect of enzyme extract (GSE) on the % syneresis of annealed starches at 60 °C for 60 min after 4 and 8 days.
4 Days
CP 2CS 3TB 4SPS 5
Native15.5 b6 ± 0.72.89 c ± 0.0219.04 a ± 1.150.12 d ± 0.05
Annealed without GSE 10.69 c ± 0.12.21 b ± 1.65.94 a ± 1.62.66 b ± 1.2
Annealed in GSET0.34c ± 0.10.50 b ± 0.23.97 a ± 2.10.18 d ± 0.06
8 Days
Native4.44 b ± 0.097.41 a ± 1.697.58 a ± 3.222.79 c ± 0.68
Annealed without GSE3.11 c ± 1.32.34 d ± 1.69.19 a ± 2.15.62 b ± 2.1
Annealed in GSET1.10 d ± 1.11.62 b ± 1.15.64 a ± 2.51.16 c ± 0.7
1 Annealed without extract. 2 CP = chickpea; 3 CS = corn starch; 4 TB = Turkish bean; 5 SPS = sweet potato starch. 6 Values followed by different letters within each row are significantly different (p ≤ 0.05).
Publisher’s Note: MDPI stays neutral with regard to jurisdictional claims in published maps and institutional affiliations.

