Article

A LoRa-Based Multisensor IoT Platform for Agriculture Monitoring and Submersible Pump Control in a Water Bamboo Field

Department of Electrical Engineering, National Chi Nan University, Puli, Nantou 545, Taiwan
*
Author to whom correspondence should be addressed.
Processes 2021, 9(5), 813; https://doi.org/10.3390/pr9050813
Submission received: 30 March 2021 / Revised: 30 April 2021 / Accepted: 4 May 2021 / Published: 7 May 2021
(This article belongs to the Special Issue Smart Systems and Internet of Things (IoT))

Abstract

:
This paper presents a long-range (LoRa)-based Internet of Things (IoT) system that consists of a series of IoT units in the field, as well as several servers for agriculture monitoring and pump control in water bamboo fields. Four types of IoT units were developed in accordance with the application’s need based on LoRa technology. Front- and back-end servers were constructed for data delivery, storage, and visualization, forming a complete solution. Another key feature is making a traditional submersible pump programmable with one IoT unit attached to the magnetic contactor in the electricity distribution box. Moreover, this paper presents design details of the proposed system and field experiment results for function validation. This IoT system is the first step in our project of revealing the relationship between farming and environmental reaction. This makes proposing a new farming procedure possible in the future.

1. Introduction

Puli Township in Nantou County, Taiwan, is the nation’s main source of water bamboo. Since small-scale farming is common in the countryside, farmers have developed their own planting schedules and procedures according to their field conditions. Planting water bamboo is complex, and its production quality strongly depends on the growing environment. Up until now, farmers have applied strategies according to the growing conditions at various stages based on their experience. For example, in the basal enlargement stage, the water bamboo tissue expands due to a fungal infection, and the fungal growth is heavily dependent on the field’s water conditions. The most important task is consistently providing the land with sufficient clean water. Since the water quality of irrigation ditches varies and thus cannot meet the requirements for bamboo shoot growing, and farmers often use submersible pumps to extract the underground water. For the field we investigated, the underground water is fed on one side and water flows to the ditch through a gap at the opposite side. The water level can be controlled by the gap’s depth, and a submersible pump supplies water to multiple water outlet ports. Since the underground water extraction may continue for one month, water bamboo farming is resource-intensive in terms of water and electricity.
Internet of Things (IoT) technologies have been successfully applied to various agriculture and environmental monitoring applications [1,2,3,4,5,6,7,8,9,10,11,12]. Various hardware modules, software packages, protocols, and transmission methods are integrated according to the diverse application requirements. The back-end system can either monitor the real-time field status or remotely control the actuators, based on sensed data and the knowledge of experts. This capability makes precious irrigation and smart agriculture possible, which improves the production quality or quantity, and reduces the consumption of pesticides, fertilizers, manpower, water, and energy. Before proposing a manual or automated strategy for water bamboo agriculture, we must collect field data to identify the impact of farmers’ actions on the field. We must also investigate the correlation between field data and production quality. It may take a long time for this process to reveal a regular trend or pattern. Finally, discussions with agricultural experts to generate several guidelines or rules for building an expert system are necessary. With the assistance of IoT technologies and the expert system, it is possible to upgrade water bamboo farming. Although the literature proposes many IoT agriculture procedures, an IoT system is naturally highly customizable. However, a lot of integration work must be done to build the system up, especially when designing outdoor units. With proper hardware/software design [12,13], an IoT unit can be powered only by a battery when the wireless transmission dominates the energy consumption. For example, we have shown in [13] that the estimated life of an IEEE 802.15.4 based unit is around 3.7 years, with a 1000 mAh battery when the sampling period is 9.94 s. As our preliminary evaluation of water sensors indicated that they take several seconds before generating stable readings, time delay and data averaging are applied in the program. As a result, the processing time is much longer than the transmission time in this project. Integrating a solar panel is a reasonable solution, as adopted in the literature [3,5,8,14]. This paper proposes a real-time clock (RTC) based power management design to completely turn off the system during inactive periods. Another key feature of the proposed system is making a traditional submersible pump programmable. Although remote control has been covered in the literature [3,8,9,10,11], this paper discusses how it is implemented by integrating the system with a commercial base station. The entire system proposed in this paper consists of IoT units in the field and several front- and back-end servers. This paper’s main contribution is presenting the system architecture and design details for the four types of sensing units. The data delivery process is also discussed.
The rest of this paper is structured as follows: Section 2 details the overall system architecture and interactions between the physical components and servers, Section 3 presents the hardware and software design specifications, Section 4 discusses the field-deployment and experimental results, and finally, Section 5 concludes.

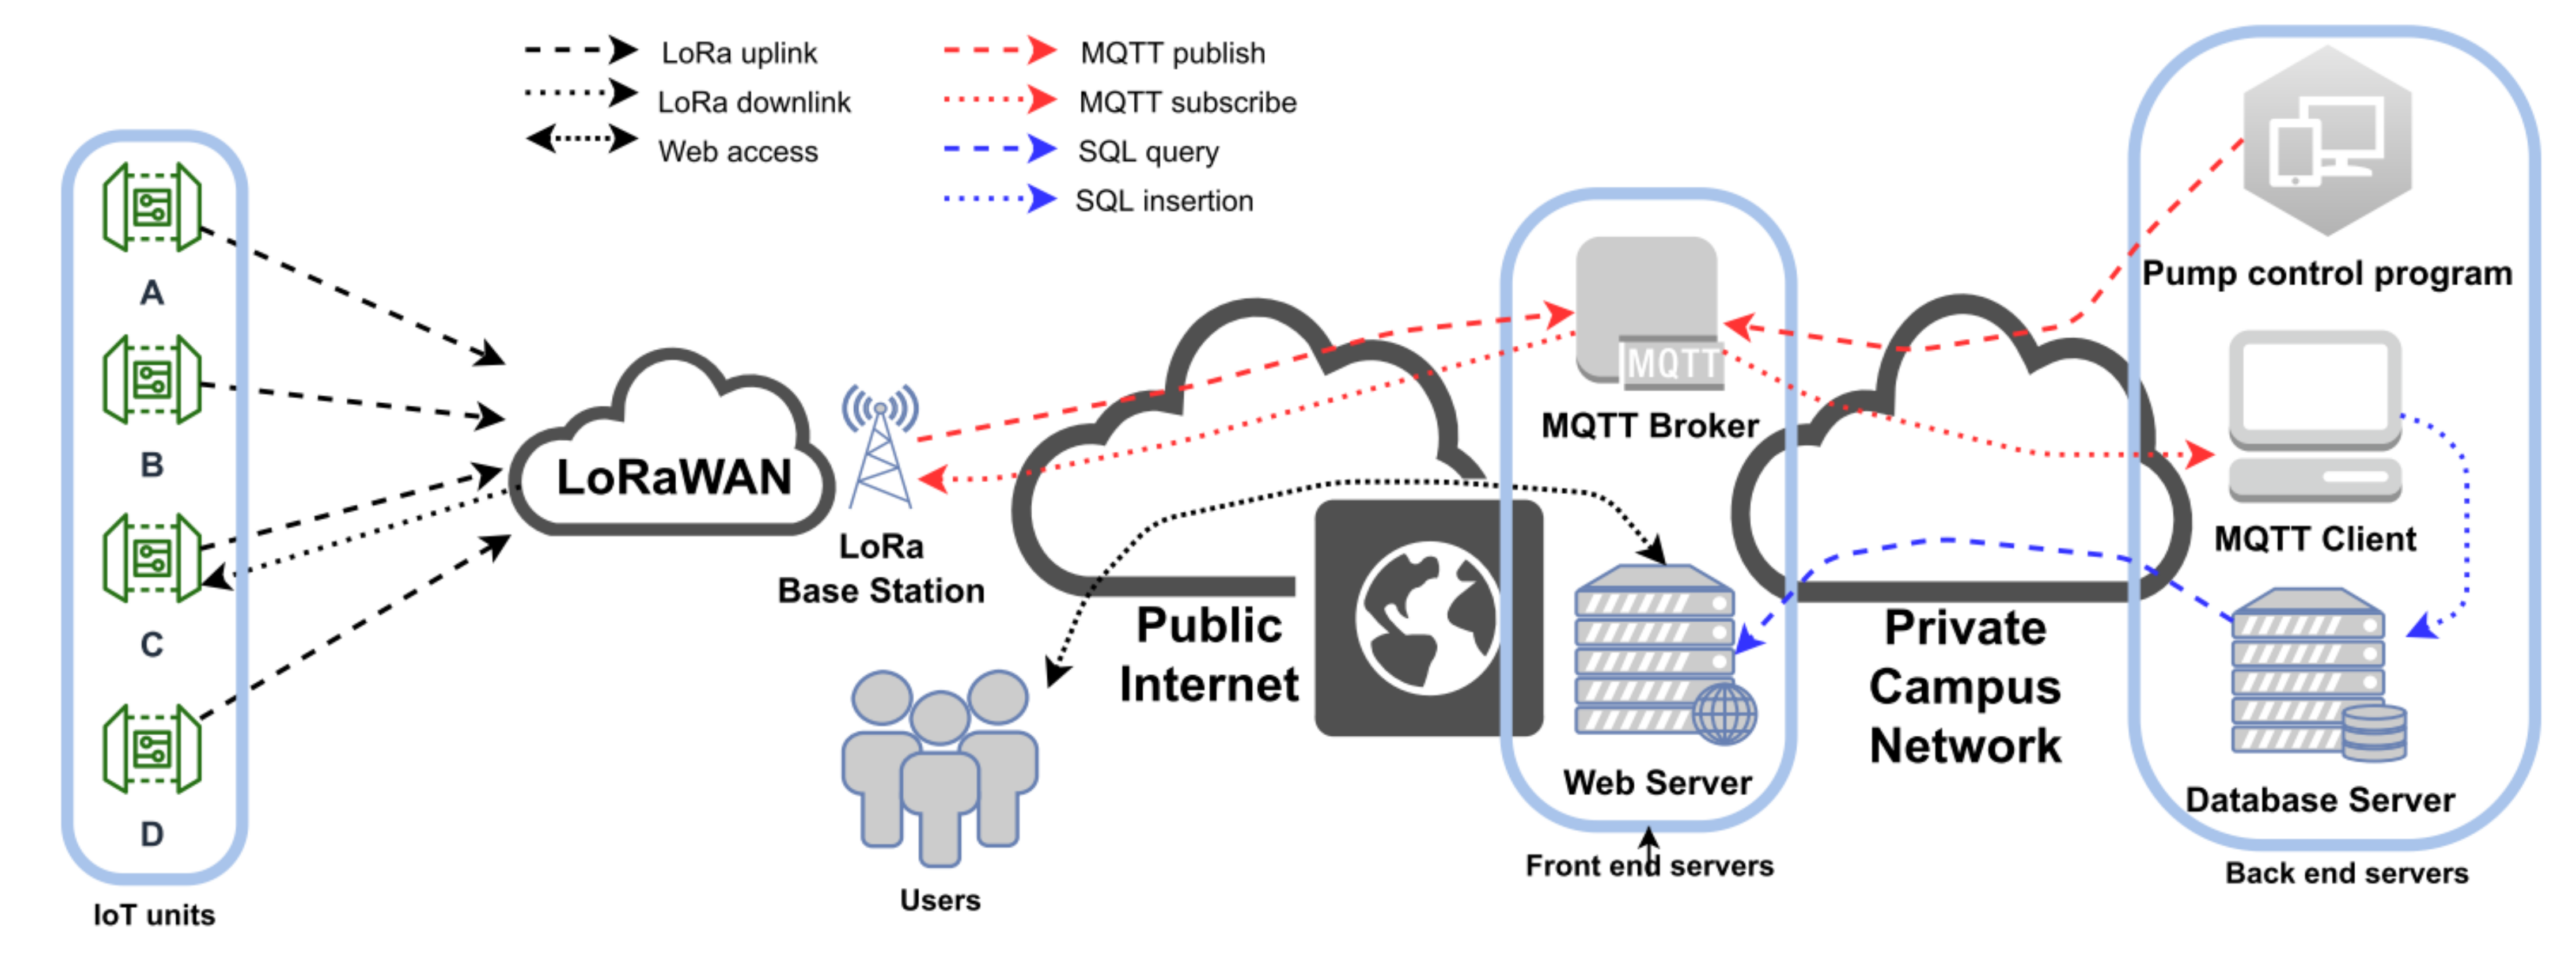
2. System Architecture

Internet connectivity is a key component for developing an IoT system. Power consumption is important for outdoor applications because energy is often limited. To have a wider coverage, this paper adopts the low-power (LP) wide area network (WAN) to establish the connection to the Internet. Possible candidates include long-range (LoRa) [6,7,8,9,14,15,16,17,18,19], narrowband (NB) IoT [19,20,21,22], and Sigfox [19,20,21,23] from different standard groups. Each has different positive and negative components. The major advantage of LoRa over NB IoT or Sigfox is its deployment cost: NB IoT and Sigfox require a monthly fee because they are commercial systems, but a LoRa-based LP WAN can operate in the unlicensed band. As a result, LoRa is selected as the wireless interface to the Internet for remote IoT units. We adopt a commercial base station because it provides more capacity with 8 concurrent channels and supports an outgoing interface based on the Message Queuing Telemetry Transport (MQTT) [24], a lightweight protocol commonly used in IoT applications. This makes the system integration easier.
Figure 1 illustrates the system architecture of the proposed LoRa-based multisensor IoT system, in which the colored arrows indicate different data flows. In addition to the IoT units deployed in the field, front- and back-end servers are also required. The data flow can be divided into two parts: The first is the data-storage path, a logical connection between an IoT unit and the back-end database, and the second is the data visualization path, a graphical user interface to display historical data that is accomplished by a web server retrieving historic data from the database. This paper mainly focuses on designing IoT units and a field test.
The base station deployed in a farmer’s home is a LoRa WAN gateway from Gemtek Technology Co., Ltd., Hsinchu, Taiwan, which connects with the Internet via an Ethernet interface. Each IoT unit is equipped with a LoRa module, the S76S from AcSiP Technology Corp., Hsinchu, Taiwan, for communication with the base station. The base station encapsulates uplink data from the LoRa interface with MQTT messages. The payload of an MQTT message is in the JavaScript Object Notation format [25]. Operating the MQTT protocol is simple and replies on a server called the broker, as Figure 1 shows. Each MQTT message carries a user-defined field called the topic. The publishers send their messages to their associated broker. An MQTT client can subscribe to one or more topics. After the broker receives a message, it will forward that message to clients who subscribe to the topic that matches the field that the message carries. In the proposed architecture, we set the open-source Eclipse Mosquitto to be the MQTT message broker in a virtual machine provided by the campus computer center, with a public Internet Protocol (IP) address to manage the incoming MQTT messages. An MQTT client program that arrives, it resides in our private campus network subscribes to corresponding topics. When a new MQTT message parses the payload and stores the extracted data in the database by using the structured query language (SQL) insertion command. An important benefit of this architecture is that both the client program and the database reside in the private campus network. Internet users can access the data via the web server only, which retrieves data from the database by utilizing the SQL query command. This procedure provides strong protection for the database from Internet attacks.
In our scenario, the base station automatically subscribes to a factory-configured unique topic and publishes messages with another. Accordingly, we built a pump-motor control program to interact with the base station. A LoRa WAN supports bidirectional transmission, which makes remote control possible. The program can command a particular IoT unit by publishing an MQTT message with the topic, to which the base station is subscribed. The broker will forward this communication to the base station, which then encapsulates the message with the LoRa protocol. Finally, the destined LoRa module receives the command and forwards the packet payload to the attached microprocessor control unit (MCU).
To fulfill various requirements, we designed four types of units for supported functions and adopted hardware modules, as summarized in Table 1. The type A unit for measuring water quality is equipped with several sensors, including potential of hydrogen (pH), oxidation reduction potential (ORP), electrical conductivity (EC), and water temperature. The type B unit gathers environmental data and is equipped with three water-temperature sensors and one integrated module called GY-39, which outputs data for air pressure, air temperature, humidity, and light intensity. The type C unit for measuring the currents in the electricity-distribution box and controlling the pump is equipped with an analog-to-digital converter (ADC) chip and a relay module. The type D unit measures the flow of the extracted underground water and is equipped with a hall effect sensor. It will be installed close to a water-outlet port. All the units are equipped with one LoRa module for data transmission with the LoRa base station and a RTC module to maintain its own system clock. The type A and B units are solar powered, while the other two are alternating current (AC)-powered.

3. Design Details and Practical Considerations
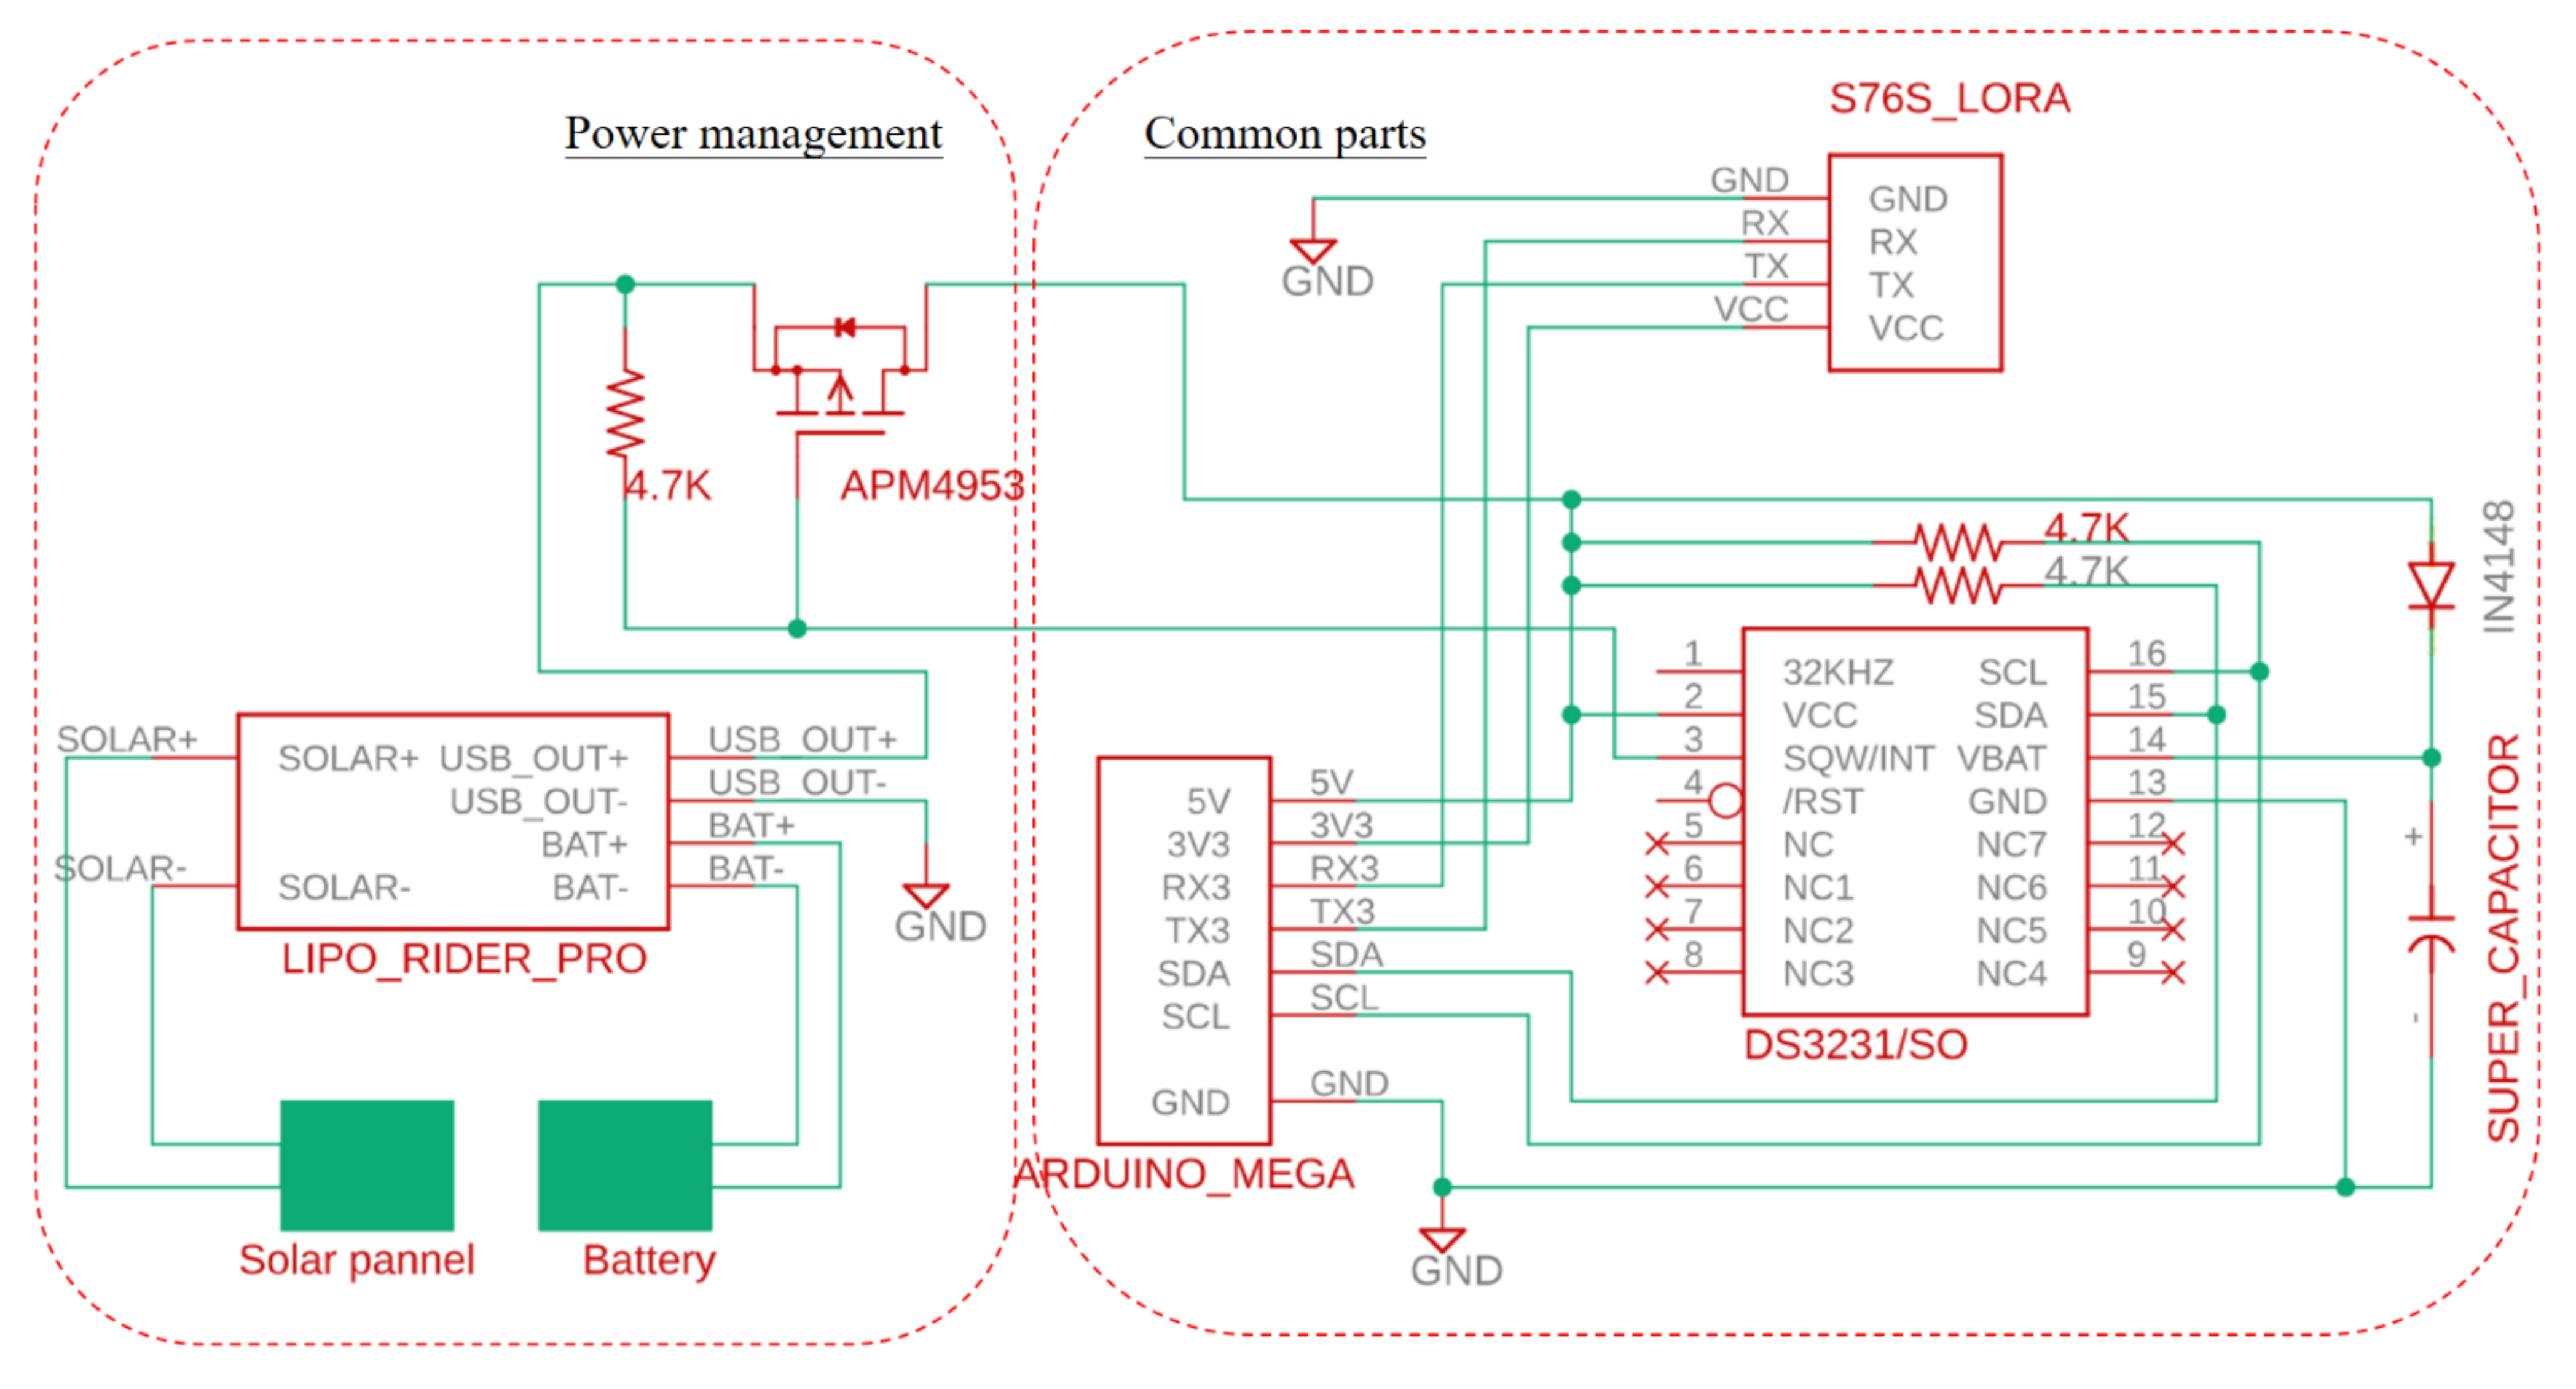
This section describes the design detail for each unit, the servers, and the software programs.

3.1. Common Parts

Fundamentally, an IoT unit consists of an MCU, a wireless transceiver module, and several peripherals. We selected the Arduino Mega 2560 as the main platform because it is mature and provides many standard interfaces suitable for interfacing with different types of modules. As we previously established, we selected the LoRa technology as the outgoing interface and adopted a module called S76S. To maintain the system clock, an RTC module is also attached. The connection of these parts is illustrated in the right portion of Figure 2.
According to regulations in our country, each S76S LoRa module is configured for channels ranging from 922 to 924 Mhz. The Arduino Mega 2560 uses the universal asynchronous receiver-transmitter (UART) interface to communicate with the LoRa module. The third UART interface is denoted by RX3 and TX3 and is reserved for the LoRA module. Since each LoRa unit has a unique media access control (MAC) address, the MQTT client software can identify the source unit that corresponds with an MQTT message.
A DS3231 RTC module is adopted and connected to the Arduino Mega via the inter-integrated circuit (I2C) interface. It is responsible for turning the system on, in addition to the clock source, as the next section describes. To avoid depleting the battery, we adopt a super capacitor rather than a button battery to supply the standby power for the RTC module, which can be restored when the system is turned on. This method allows us to not worry about replacing batteries, since this experiment shows that our technique can provide enough power for the RTC module to run without recharging for several hours. Since the system is operational every 10 min in this project, our design can ensure continuous functionality.

3.2. Special Treatments for the Power Supply
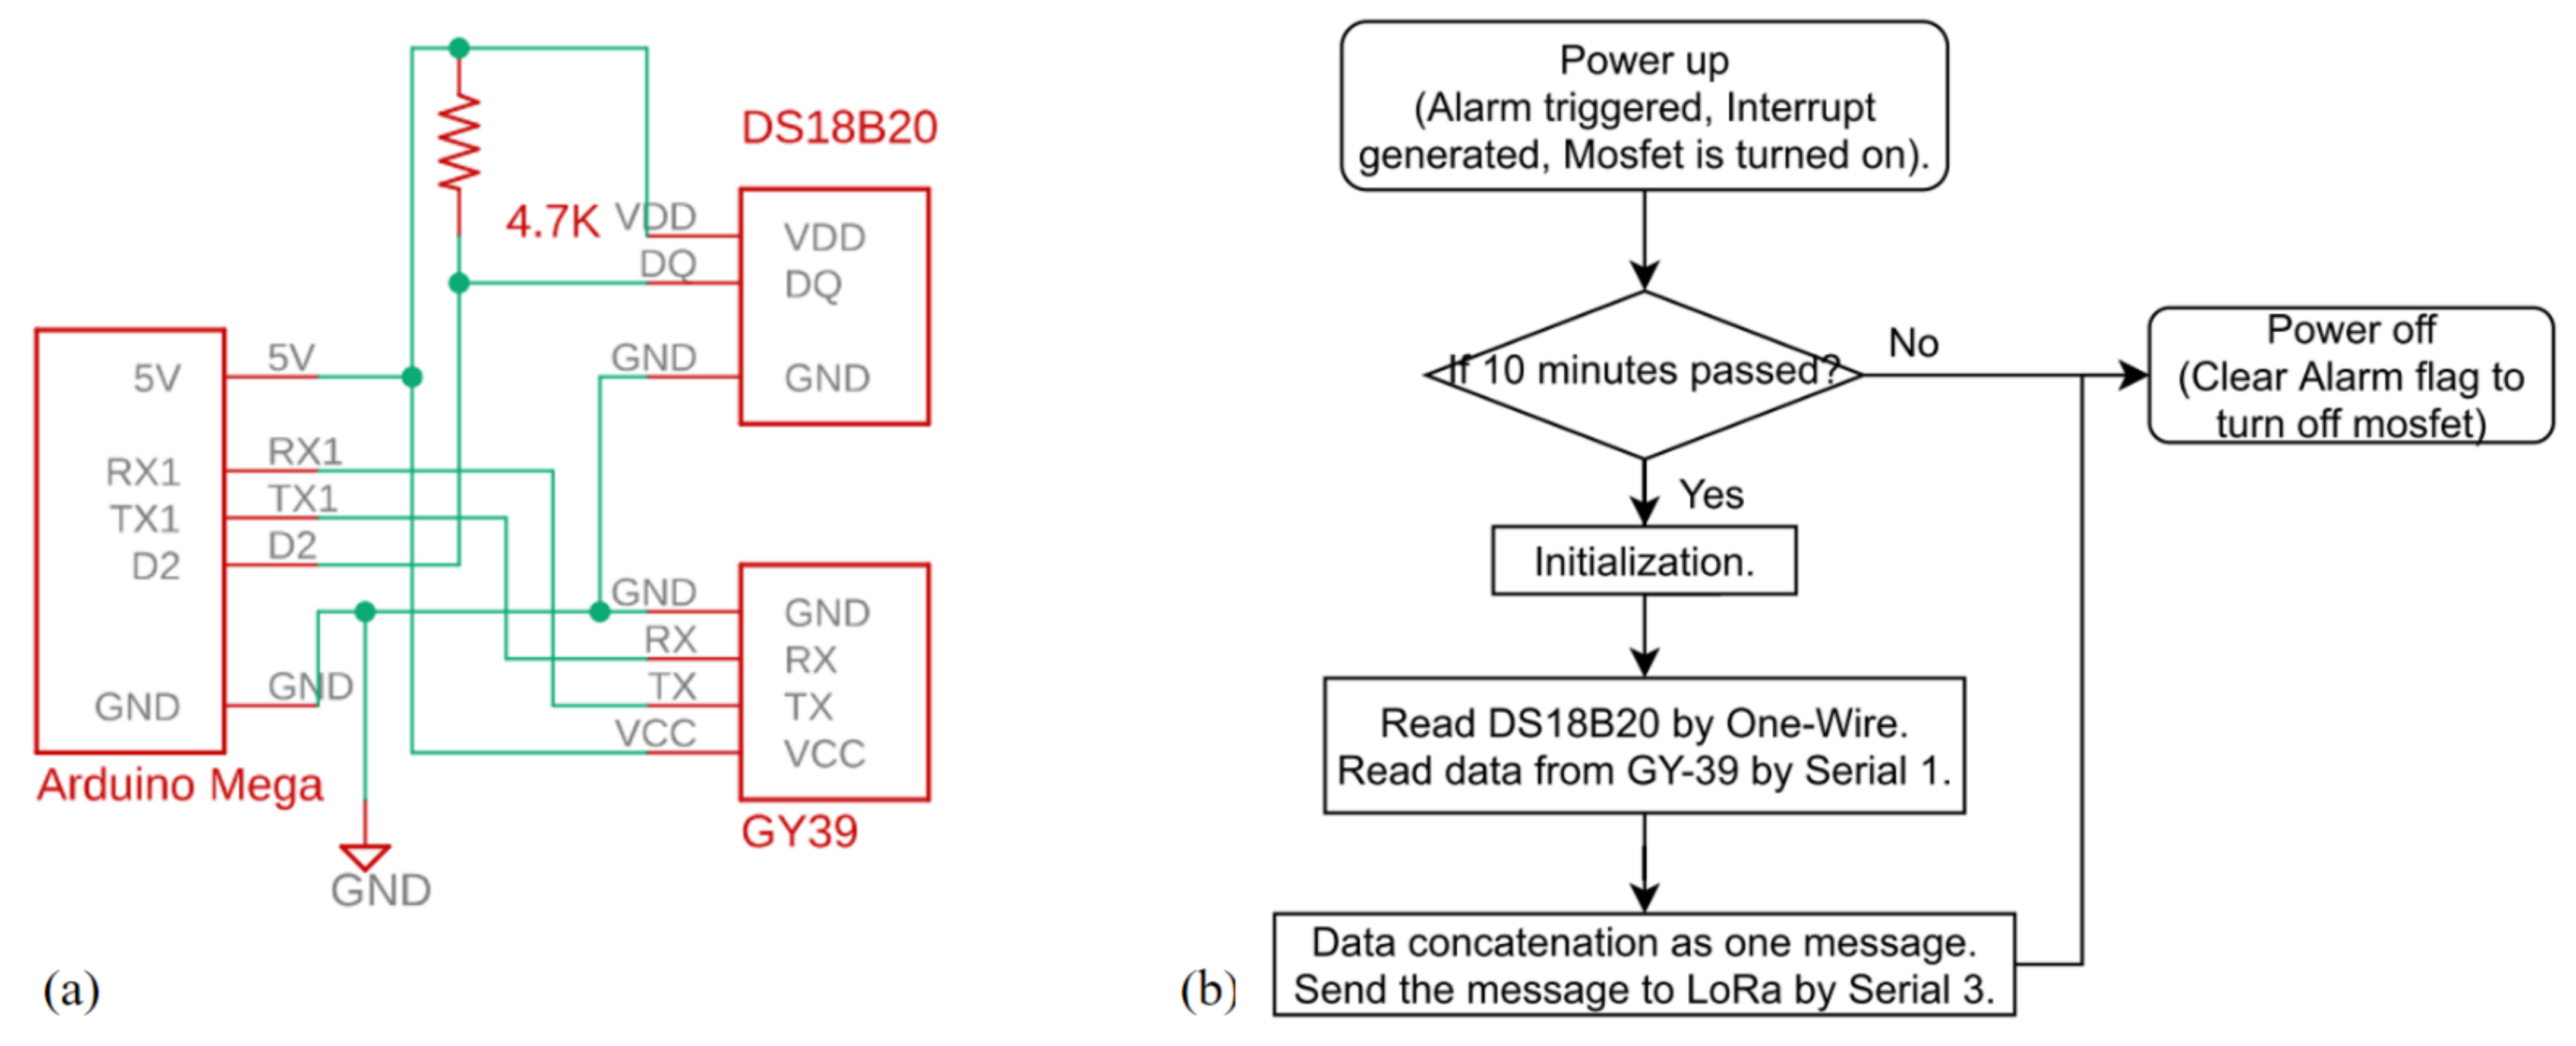
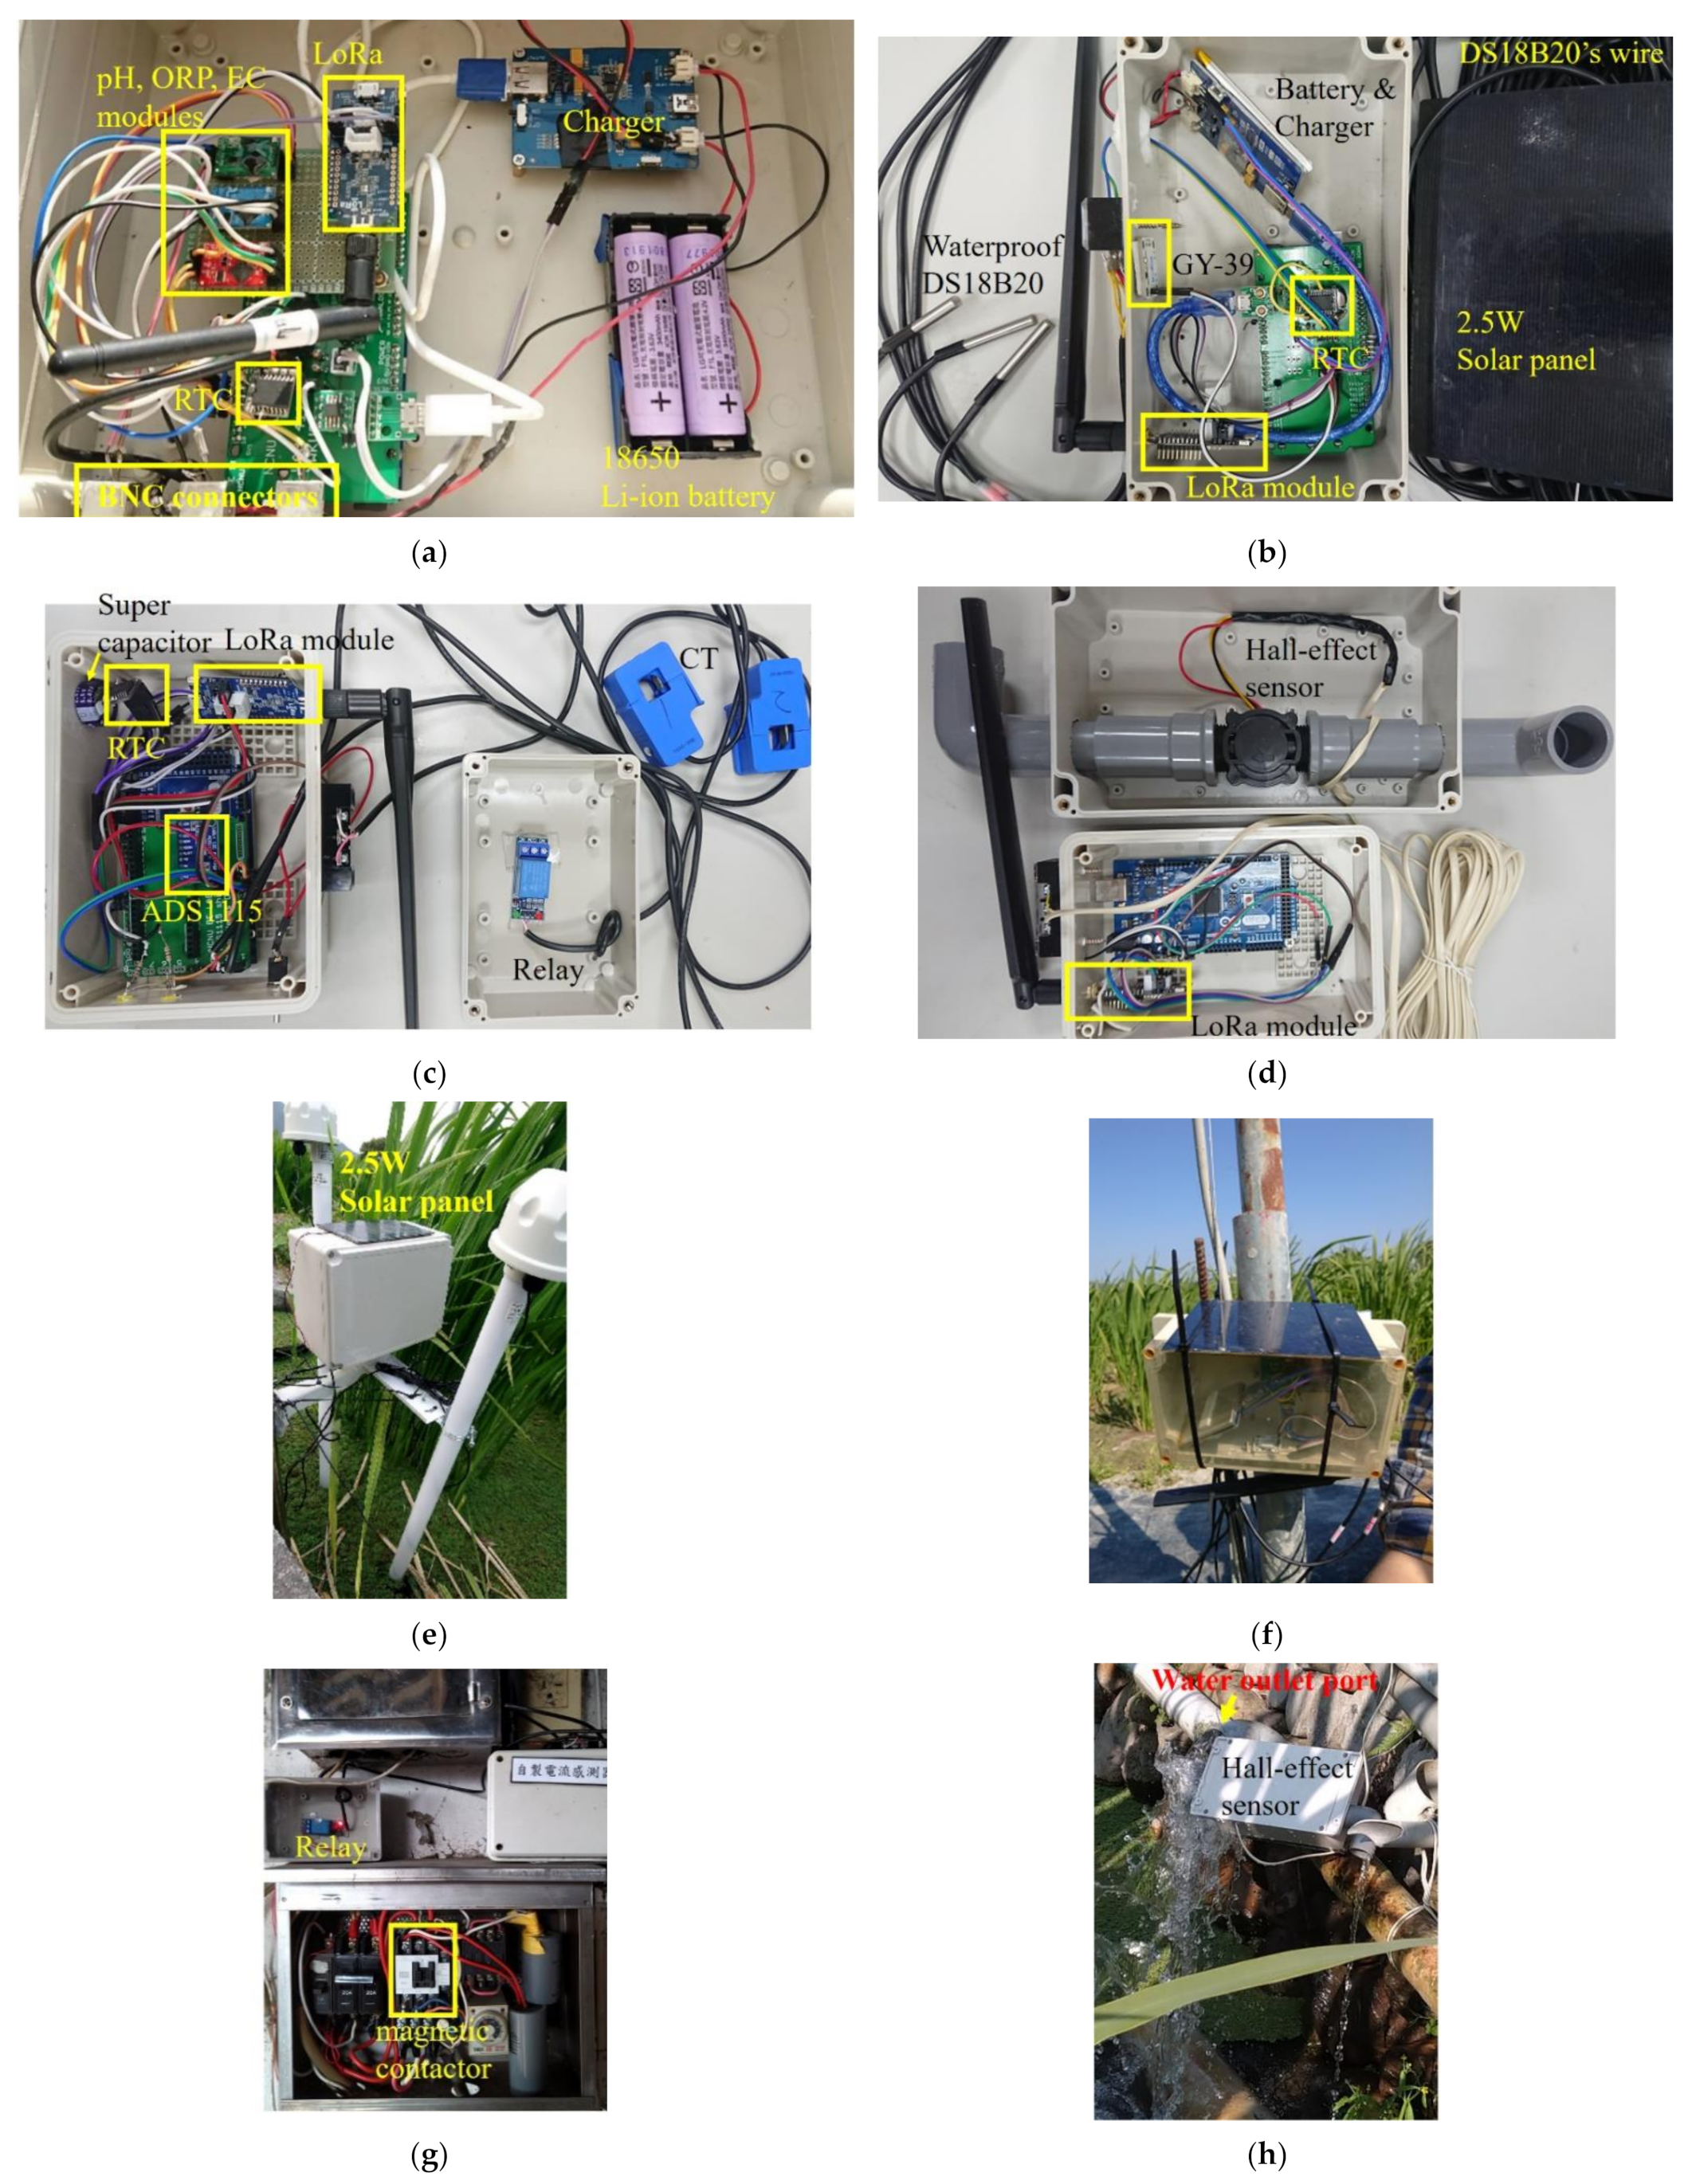
Type A and B units are solar powered, so that power management is indispensable for continuous operation on rainy or cloudy days. Although modern MCUs have the deep sleep mode to save power, we turn the unit off after it finishes all tasks, because it still consumes some power in the sleep mode. Another advantage of the proposed power-management design is that it is easy to apply to another MCU platform. It is not necessary to consider whether the adopted MCU’s sleep function works. RTC chip DS3231 has a dedicate pin, pin 3, that serves as the interrupt output triggered by alarm events. This pin can be used to control a P-channel metal-oxide-semiconductor field effect transistor (MOSFET) acting as a power switch, as the left part of Figure 2 illustrates. An integrated charger from Seeed Technology Co., Ltd., Shenzhen, PRC. is adopted to energize a lithium (Li)-ion battery from a 2.5 W solar panel and also provides a 5 V output by a universal serial bus (USB) interface. After the RTC module is properly configured to enable the alarm function, it de-asserts pin 3 when an alarm is activated, turning the MOSFET on to power up the system. After all tasks are performed, the Arduino Mega sends an “alarm clearing” command to the RTC module, which then asserts pin 3. Notice that pin 3 is an open-drain pin, which is why a 4.7-K pull-up resistor is required at pin 3. The MOSFET selection is critical: since the voltage across pins S and G of the MOSFET is only 5 V at most, only the logic level MOSFETs can be applied to this scenario.
With regard to the type C and D units, we just need an AC-to-USB adaptor as the power source. During the experiments, we found that the program sometimes crashes, and the power-line noise caused by the pump motor should be the root cause. To mitigate this issue, we activate the Arduino Mega’s watchdog timer, a common hardware supervisory feature of modern MCUs. The operation is quite straightforward. If the watchdog timer is active, it automatically resets the MCU after it expires. In the program, we needed to restart the timer periodically, to maintain normal operation. When the system crashes and the watchdog timer is no longer restarted, the MCU can be rebooted by the watchdog timer. After applying this change, the unit could run continuously for the entire experiment period.

3.3. Type A Unit

The main function of the type A unit is monitoring water quality. The EZO pH Circuit, the EZO ORP Circuit, and the EZO conductivity circuit modules from Atlas Scientific LLC, Long Island City, NY, USA, are adopted because they are compact and easy to integrate into an embedded system. In addition, they have a built-in temperature-compensation function. As a result, a waterproof DS18B20 temperature sensor from Maxim Integrated Products, Inc, San Jose, CA, USA. is used to measure the water’s temperature for compensation. The partial schematic for this unit is illustrated in Figure 3a. The first and second UART interfaces are denoted by TX1/2 and RX1/2 and are used to communicate with the EZO pH circuit and the EZO ORP Circuit, while the EZO conductivity circuit is attached to a software UART interface formed by pins D10 and D11. A probe calibration should be conducted before operation, according to the procedure detailed in the datasheet. The DS18B20 temperature sensor uses a unique one-wire interface, and pin D2 is then allocated to interact with it.
The program’s flowchart for the type A unit is shown in Figure 3b. The RTC module’s alarm is programmed to repeat every minute. After the unit is powered up, it checks if 10 min have passed by reading the current time. During operation, the water temperature will be retrieved first, and then data from three water modules is read, one by one. It is noteworthy that LoRa is a very low speed wireless network. A typical method for reducing the protocol overhead is to pack multiple values before the transmission, rather than transmitting them one by one, so we concatenate sensed values as one message that is then sent to the LoRa module by the third serial port. After receiving a new message, the LoRa module automatically transmits it to the associated LoRa gateway. Finally, the program sends a clearing alarm command to the RTC module, which turns the system off.

3.4. Type B Unit

The main function of the type B unit is to collect environmental data. The key module in this unit is GY-39, which is highly integrated and easily purchased from eBay. It consists of a MAX44009 from Maxim Integrated Products, Inc. and a BME280 from Bosch Sensortec GmbH, Reutlingen, Germany. The onboard MCU can periodically output values for light intensity, air temperature, humidity, and atmospheric pressure by utilizing the UART interface. The partial schematic for this unit is illustrated in Figure 4a. The first UART port of Arduino communicates with GY-39. We also attach several DS18B20s with pin D2 to measure the water temperature at different locations. The one-wire interface is excellent for this application because it supports multiple devices on the save wire and the wire’s length can extend to 20 m.
A flowchart describing the type B unit is shown in Figure 4b. The overall software structure is similar to the type A unit. Since GY-39 outputs data bytes continuously, the program must search the delimiter and extract values from different data fields. To read multiple DS18B20s, we need to identify the factory address for each device manually. According to the datasheet, the DS18B20 accuracy is ±0.5 °C. To achieve accurate results, the program adds offsets that are determined by experiments to output values to have a more consistent reading.

3.5. Type C Unit

The main functions of the type C unit are controlling the pump motor and monitoring its drawn current. The pump motor is controlled by a magnetic contactor that is triggered by a timer. For a programmable pump, we only need a relay to replace that timer to trigger the magnetic contactor. A partial schematic for this unit is illustrated in Figure 5a. Pin D6 of the Arduino Mega is designated to control the relay module. The pump motor’s activity can be determined by its drawn current, which can be measured by a current transformer (CT). The induced voltage feeds to an ADC chip. This project adopts ADS1115 from Texas Instruments Incorporated, Dallas, Texas, USA, to perform this task and the Arduino Mega uses the I2C port to communicate. Since the induce voltage is an AC signal, the ADS1115 should be configured for a differential signal. As Figure 5a shows, an ADS1115 can provide two differential input channels, one for the pump motor, and the other for light-emitting diode (LED) lights that are necessary in the winter.
The program flowchart for the type C unit is shown in Figure 5b. As we mentioned, the watchdog timer is enabled to reboot the system if it crashes. To maintain the relay status, we can store data in the built-in electrically erasable programmable read-only memory (EEPROM) of the Arduino Mega. When the system is running, the program reads the configuration data from the EEPROM first. In the infinite loop, the program toggles pin D6 according to the configuration data. Since the CT generates an AC voltage, the program must read ADS1115 by I2C multiple times. After collecting enough data samples, the root mean square (RMS) current value can be calculated. It is noteworthy that the default ADS1115 library takes a sample only for a channel. We modify it slightly to activate both differential channels simultaneously, which significantly improves the program’s efficiency. Our evaluation finds that an Arduino MCU can manage four ADS1115 chips simultaneously, to perform a current measurement for up to eight channels. After calculating and concatenating the RMS values, the constructed message is sent to the LoRa module. To retrieve the command from the back-end server, the program must check the LoRa module’s response. If a LoRa module receives a downlink message from its base station, it will piggyback the payload with the acknowledgment to the Arduino Mega by UART. In this case, the new command is copied to the configuration data and stored to the EEPROM. The back-end program can monitor the incoming RMS current values for actual responses in the field. An abnormal value can immediately push a message to the administrator.

3.6. Type D Unit

The main function of the type D unit is to measure the water flow. Since we do not want to disturb the target field’s existing irrigation system, this unit will be installed only at one water-outlet port. Although we cannot measure the actual amount of extracted water in this way, the condition in which the underground water is drained can still be identified when the measured water flow is far lower than the normal value. This unit is AC-powered because there is an AC socket nearby. The partial schematic for this unit is given in Figure 6a. Pin D5 is allocated to the G3/4-in water-flow module from Seeed Technology Co., Ltd., Shenzhen, PRC, which consists of a plastic valve body, a water rotor, and a hall effect sensor. When the rotor spins, the module generates a pulse with a frequency that is proportional to the spin speed. The program flowchart for the type D unit is shown in Figure 6b. The program always estimates the water flow rate based on the number of pulses on D5 for 10 s and the constructed message is sent to the LoRa module.

3.7. Servers and Back-End Programs

In addition to the IoT units deployed in the field, three servers are in the proposed system. The Eclipse Mosquitto acts as the MQTT broker, and the Nginx functions as the web server. The Linux software installation procedure can be used, although proper configurations are for bringing up the services. With regard to the back-end database, we currently use the MariaDB server running high-performance network-attached storage. There are many options for creating the web server’s content. We have tried the traditional PHP-based web page and the Django framework. To efficiently manipulate diverse data types, the database schema and the architecture of web content are being revised. Historical data are visualized as demonstrated in the next section, which is accomplished by Highcharts JavaScript library that is free for noncommercial use.
There are two back-end python programs, one of which acts as the MQTT client that subscribes to the factory default topic of the LoRa base station. In addition to the payload from an IoT unit, an MQTT message also contains several fields, such as channel frequency, spreading factor, received time, signal-to-noise ratio, and the MAC address. Each LoRa module has a unique MAC address, so the client program can identify the IoT unit that corresponds to that message. After de-concatenating the payload, the program inserts extracted data values to the corresponding table. The other python program alternatively verifies the remote pump-control function by publishing “ON” and “OFF” commands with a pre-set time period by using the unique topic that the remote LoRa base station subscribes to, which can be retrieved from the web management interface. After receiving a downlink MQTT message with a field that specifies the destined MAC address, the LoRa base station constructs a LoRa downlink packet and stores it in memory. According to the LoRa WAN specification, the downlink packet is transmitted within the receive window of a successful uplink transmission from the LoRa device to which the downlink packet is destined. As a result, there is a delay of approximately 1 or 2 s after the back-end software issues a command. The type C unit also needs time to complete other tasks, so it takes several seconds for the command to be executed. This application scenario is not harmful because we do not switch the pump motor on or off frequently.

4. Results and Discussion
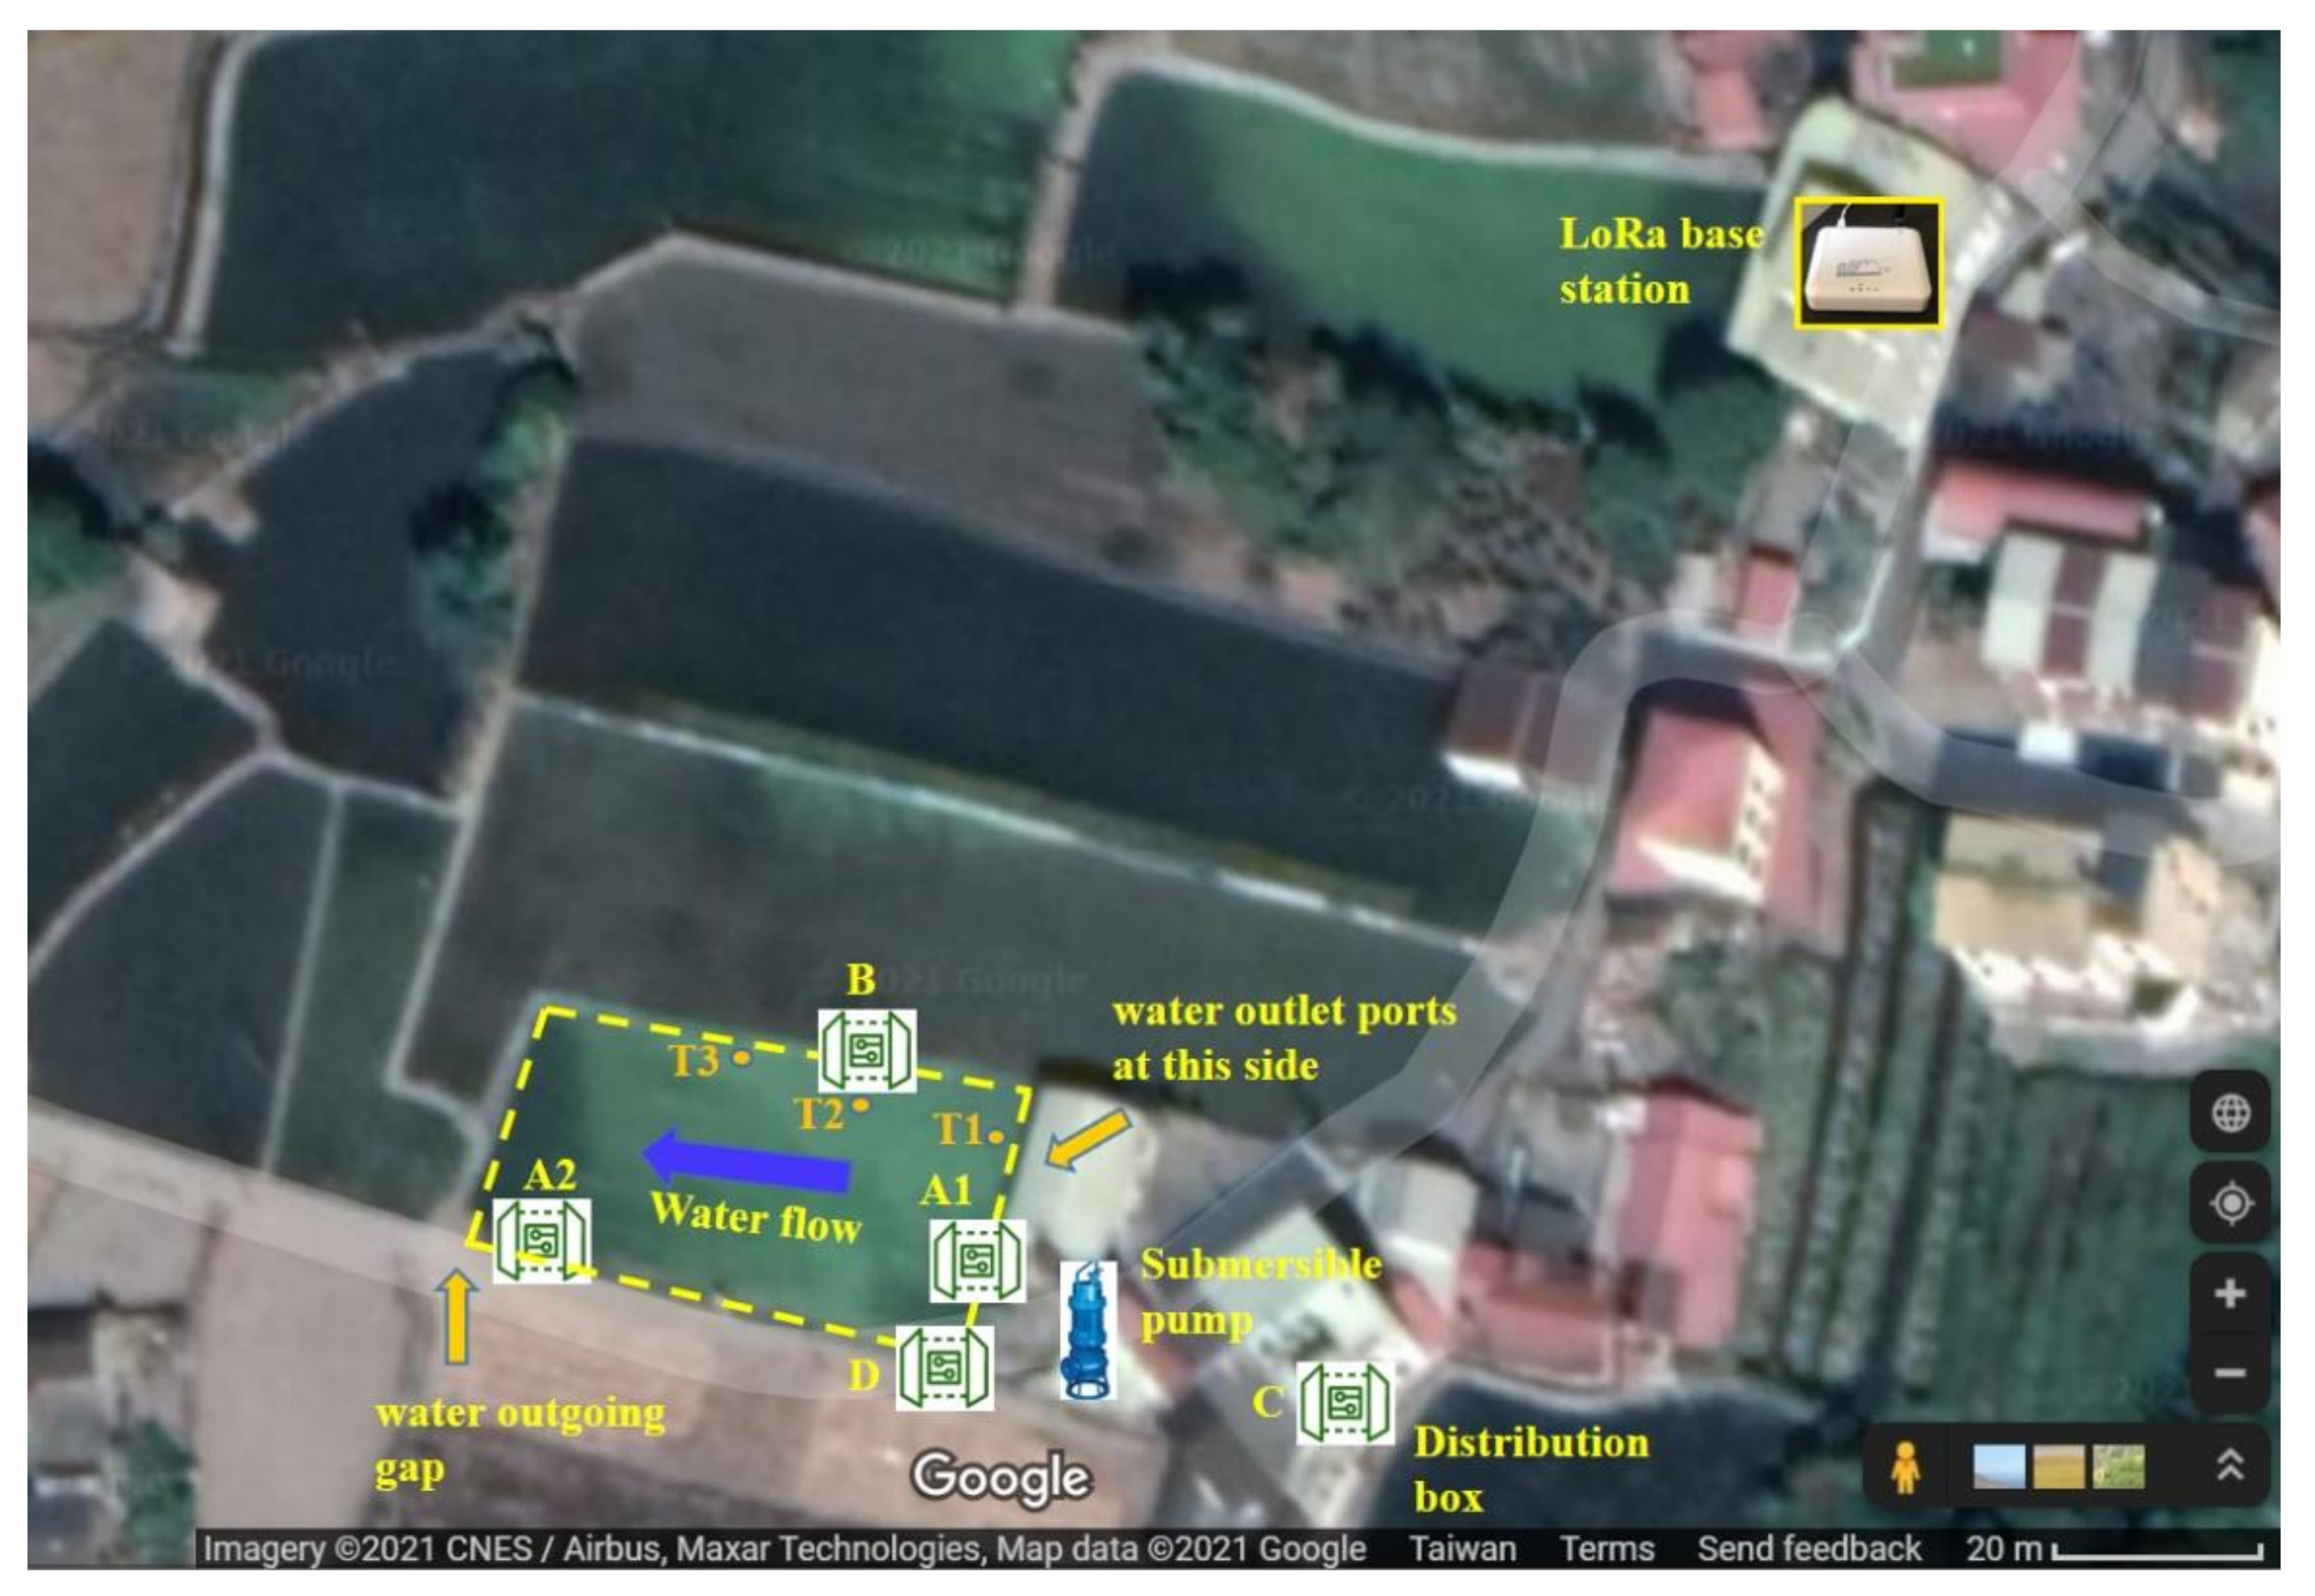
4.1. Installation

Figure 7 illustrates the deployment configuration by adding notations and comments to the Google Map screen shoot around the target field. The LoRa base station was installed in the farmer’s house with Internet access. Two type A units, A1 and A2, were installed at the edge of the field. A1 is close to one water-outlet port, while A2 is close to the water-outgoing gap. A type B unit was established with three water-temperature sensors, T1, T2, and T3. The unit was installed to the upper-middle side of the field to collect environmental data. T1 was placed in the water pipe to measure the temperature of the extracted underground water. When the pump is off, T1 measures the air temperature. T2 and T3 are put in the water to measure actual field temperatures. The electrical distribution box is located at a small warehouse close to the field, and a type C unit was installed at the top of the box. A submersible pump is located on the right side of the field. There are also several LED lights around the fields. The lights and the pump are controlled individually, by two magnetic contactors in the distribution box. The water pipe from the pump is split into four outlet ports on the right of the field, and a type D unit was installed at the right-bottom corner of the field. It is AC-powered because an AC outlet is close by.
Figure 8a shows a finished type A unit, including the water sensor, RTC, LoRa, and charger components. Since it consumes more energy than a type B unit, two parallel 18,650 Li-ion batteries are used. The total battery capacity is 6000 mAh. With a 2.5 W solar panel that outputs a 500 mA current at most, it takes 12 h to charge the battery from empty to full. Figure 8e shows how this unit is installed in the field. We can clearly see two white plastic protection pipes that are for the pH and ORP probes, because they are more sensitive. The EC probe and water-temperature sensor are put directly into water.
Figure 8b is a photo of a completed type B unit, showing the GY-39, RTC, LoRa, and charger components. Since this unit consumes less power, a square 2000-mAh Li-ion battery is adequate and it is attached to the charger board. Three waterproof DS18B20 sensors are wired together to a connector. Figure 8f shows how this unit is installed in the field by mounting it to a wire pole. Note that a transparent lid should be used, because GY-39 can measure the light intensity.
Figure 8c is a photo of a completed type C unit, showing the RTC, LoRa, and ADS1115 modules. For safety concerns, the relay module is placed in other housing with a transparent lid. Users can observe the relay status based on the LED on the module. The two blue CTs are at the right-top corner. Figure 8g shows how this unit is installed on the top of the electricity-distribution box. Two wires extend from the relay module to the magnetic contactor for the submersible pump, which is mounted in the middle of the box. The CTs are hooked with the wires to the pump and field LEDs.
Figure 8d is a photo of a completed type D unit, indicating the LoRa modules and the hole-effect sensor. In our first experiment, the sensor broke down quickly, because it is not waterproof. Therefore, we put it in housing for the second time. Figure 8h shows how the housing of the hall-effect module is installed in the field. The main body of the type D unit is mounted to a wire pole nearby.

4.2. Function Validation

This section presents several visualization plots from the current website to validate the design goals of the proposed IoT system.

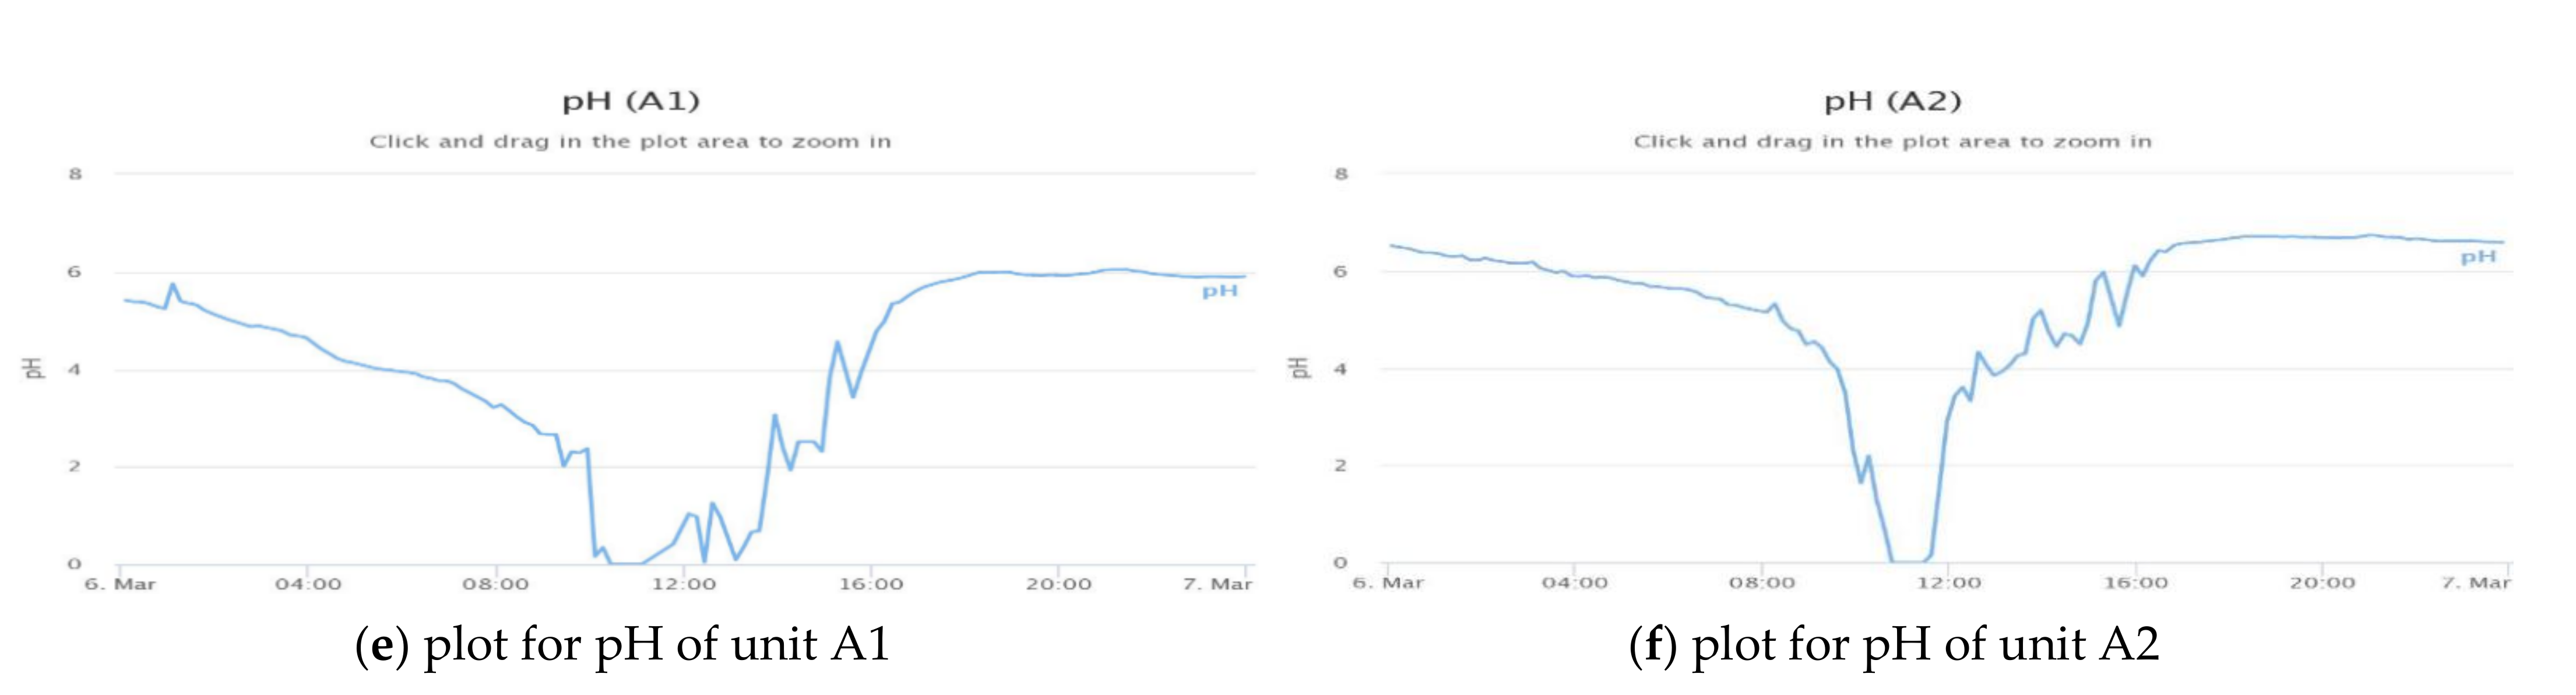
4.2.1. Water Quality Monitoring

This function is used to monitor the target field’s water quality. Figure 9 shows snapshots of historical data for EC, ORP, and pH on March 6, 2021. Since A1 is installed near the underground water inlet, it monitors the quality of the underground water. However, A2 is installed at the outgoing gap to observe changes that may be caused by a reaction in the field. In general, the EC value of A2 is slightly higher than that of A1, possibly due to the dissolution of conducting material in the field. The ORP value of A1 is positive, while that of A2 is often negative. This result indicates that dissolved oxygen is consumed in the field, which may be why underground water extraction is necessary to maintain the water quality. For the pH value, although the calibration was conducted before deployment, it decreases a great deal at noon every day. We have studied this performance with a handheld instrument from Suntex Instruments Co., Ltd., New Taipei City, Taiwan, but no such phenomenon exists. Further investigation is necessary.

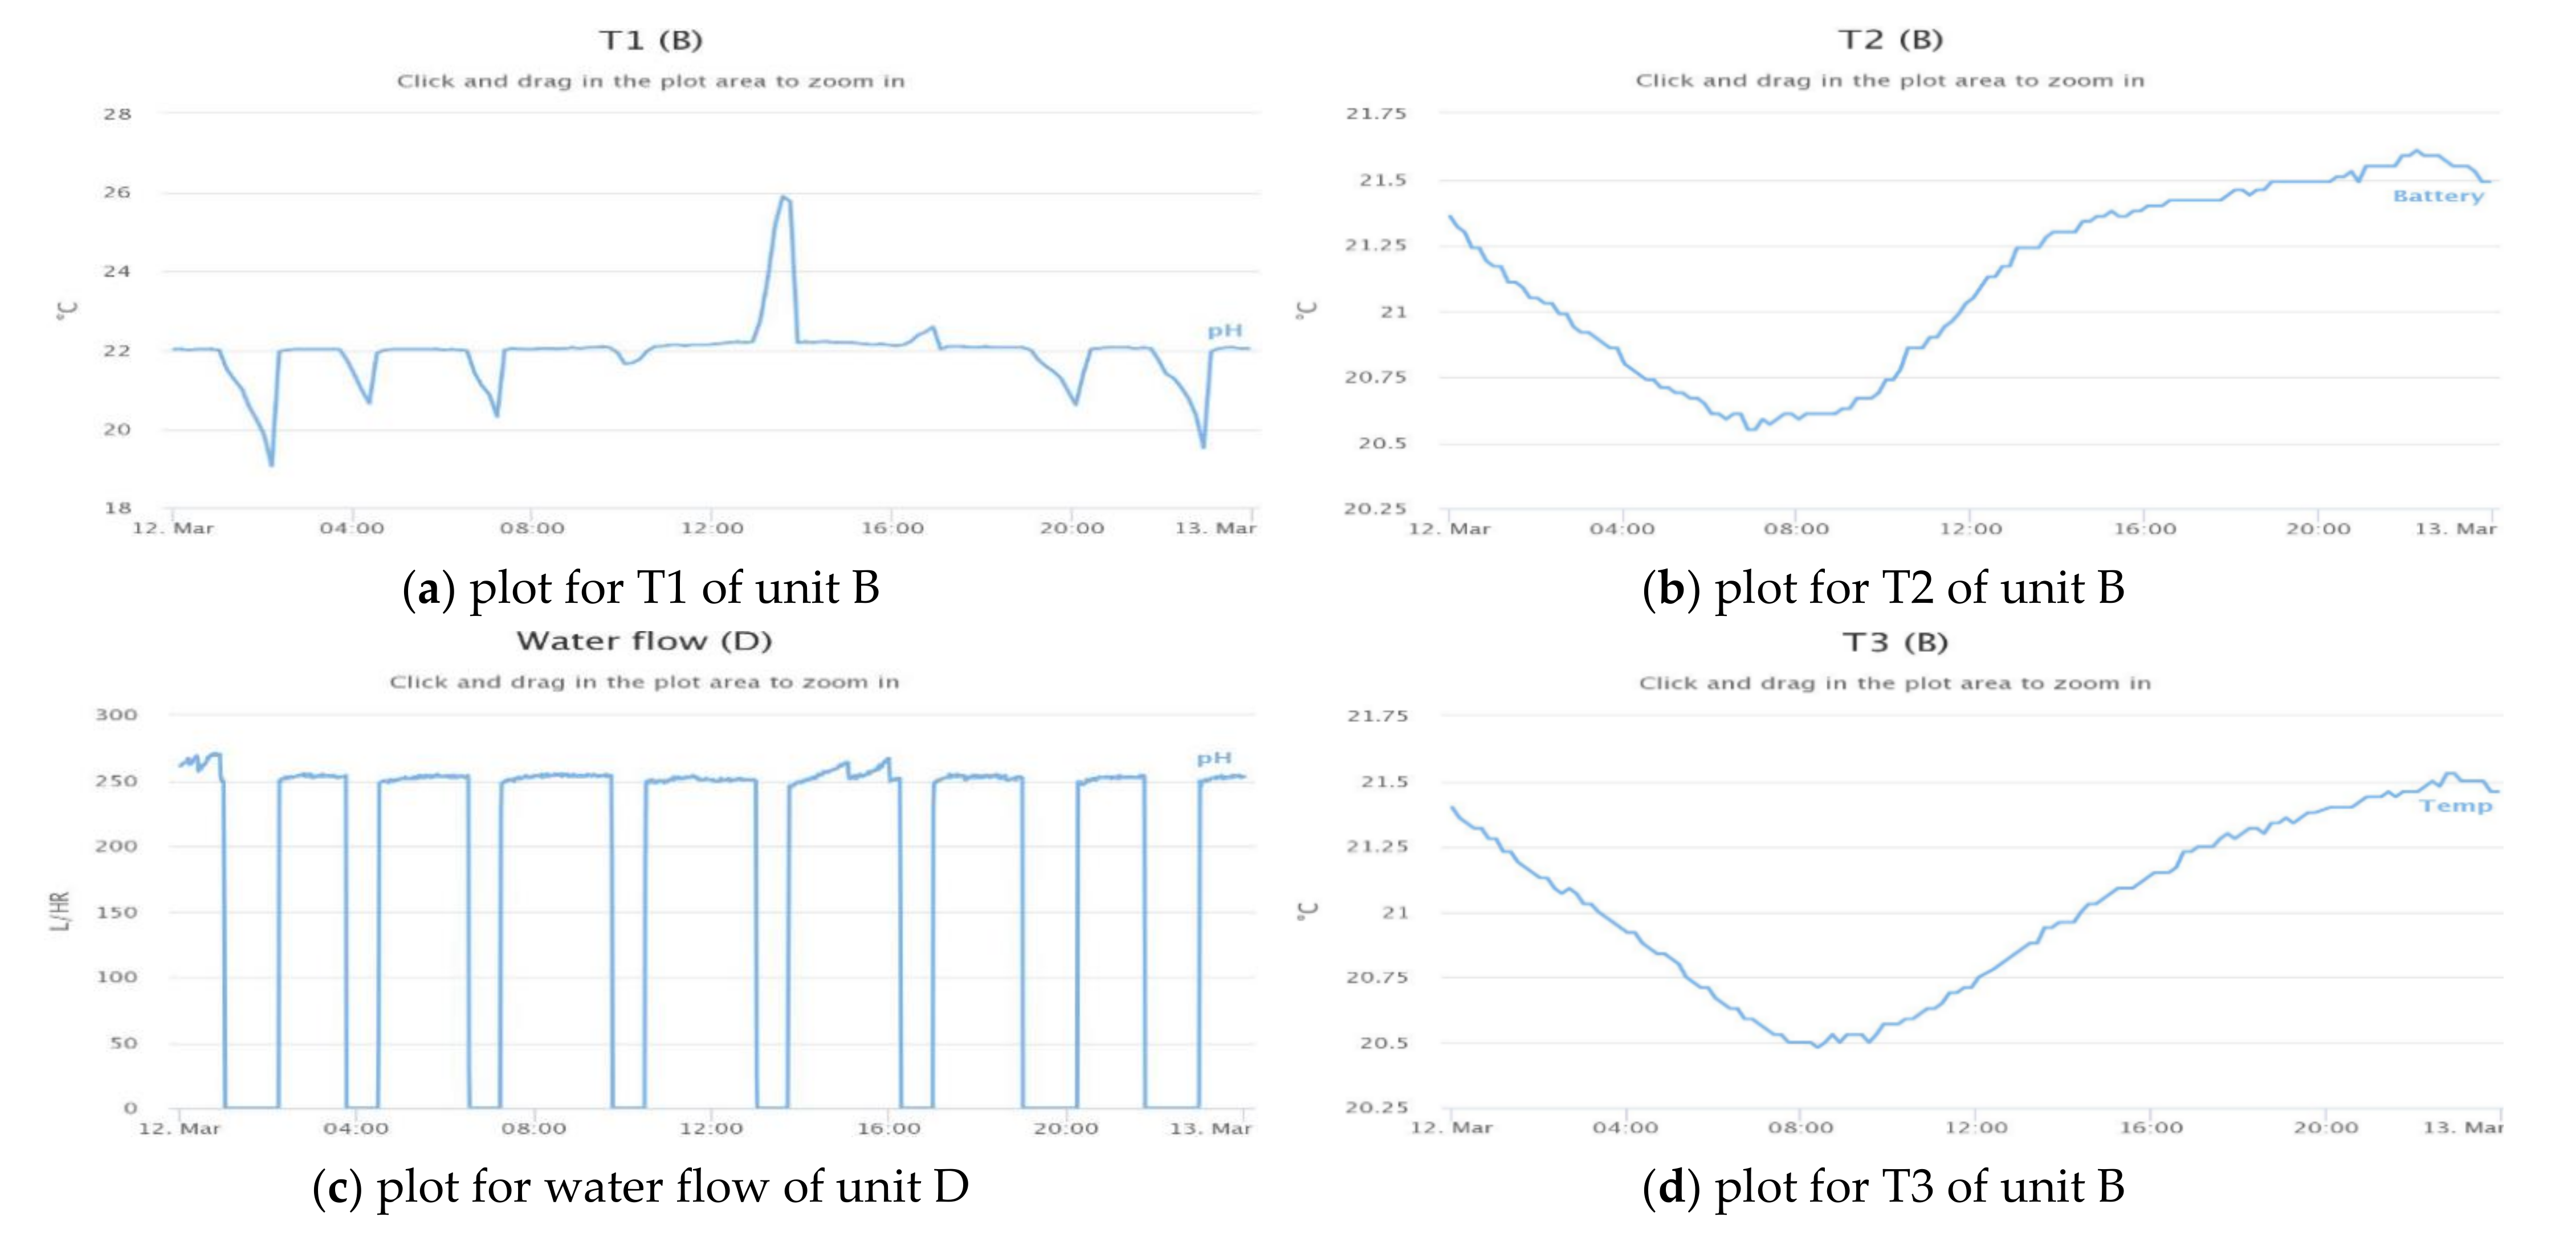
4.2.2. Environmental Data

Figure 10 shows a group of snapshots for environmental data. The appropriate temperature for fungus ranges from 20 °C to 30 °C. The type B unit consists of three water-temperature sensors at different spots. The T1 plot provides the temperature of extracted underground water, which is almost constant, at approximately 22 °C. The water flow data from the type D unit are also plotted. We can see that T1′s value changes only when the submersible pump is off. The bottom-left plot of Figure 10 shows the air temperature of the type B unit, which may drop to 15 °C at night. The top-right two plots are for T2 and T3, which measure the field-water temperature. We can see that T3′s value is slightly lower than that of T2, because T3 is relatively far from the water source. In summary, extracting underground water keeps the water warm enough. However, the submersible pump should be turned off regularly to avoid draining underground water. The bottom-right plot of Figure 10 illustrates the humidity value from GY-39.

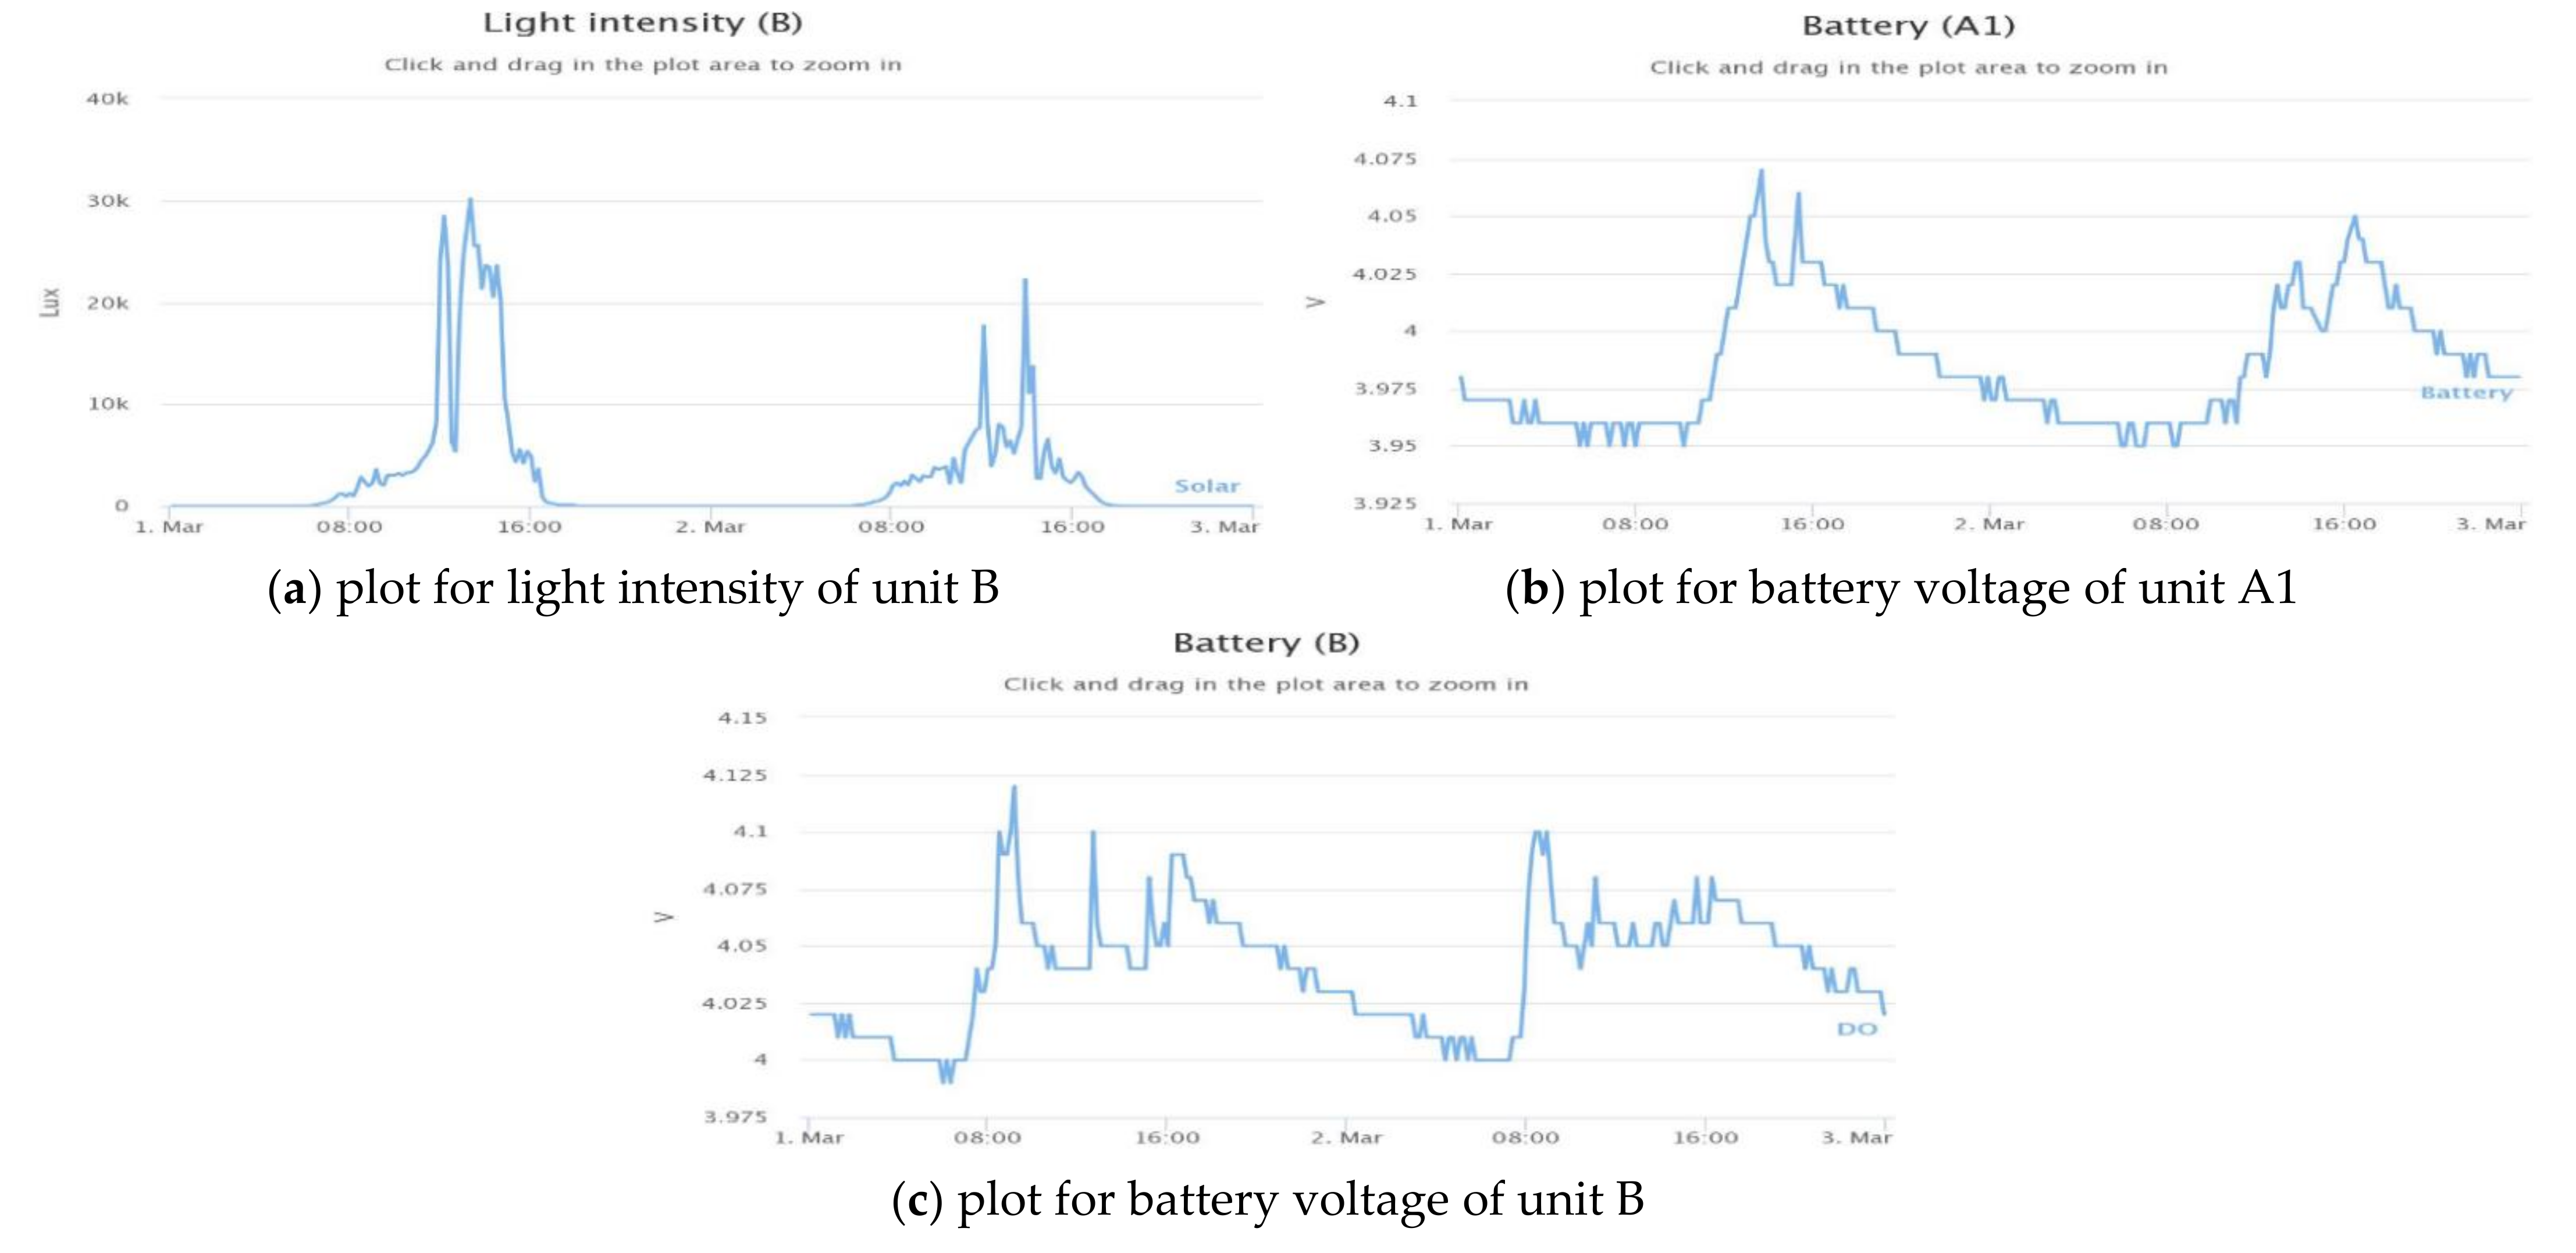
4.2.3. Power Management for Solar-Powered Units

The power management design is one of the key features for the outdoor units proposed in this paper. The top plot of Figure 11 shows the light intensity from GY-39 for 2 days, with the second day being cloudy because the light is less intense. The bottom two plots show the battery voltage for units A1 and B. We can see that the battery can charge completely, even on a cloudy day. The charger has a built-in protection function to avoid overcharging. When the battery voltage is over the threshold, the internal MOSFET turns off to eliminate the power from the solar panel. The type B unit fully charges quickly because its battery capacity is much smaller. According to our pretest results, the type B unit can run for more than 10 days without charging when it is equipped with two 18,650 batteries. It is possible to prolong the battery life by further optimizing the software that runs on the Arduino Mega.

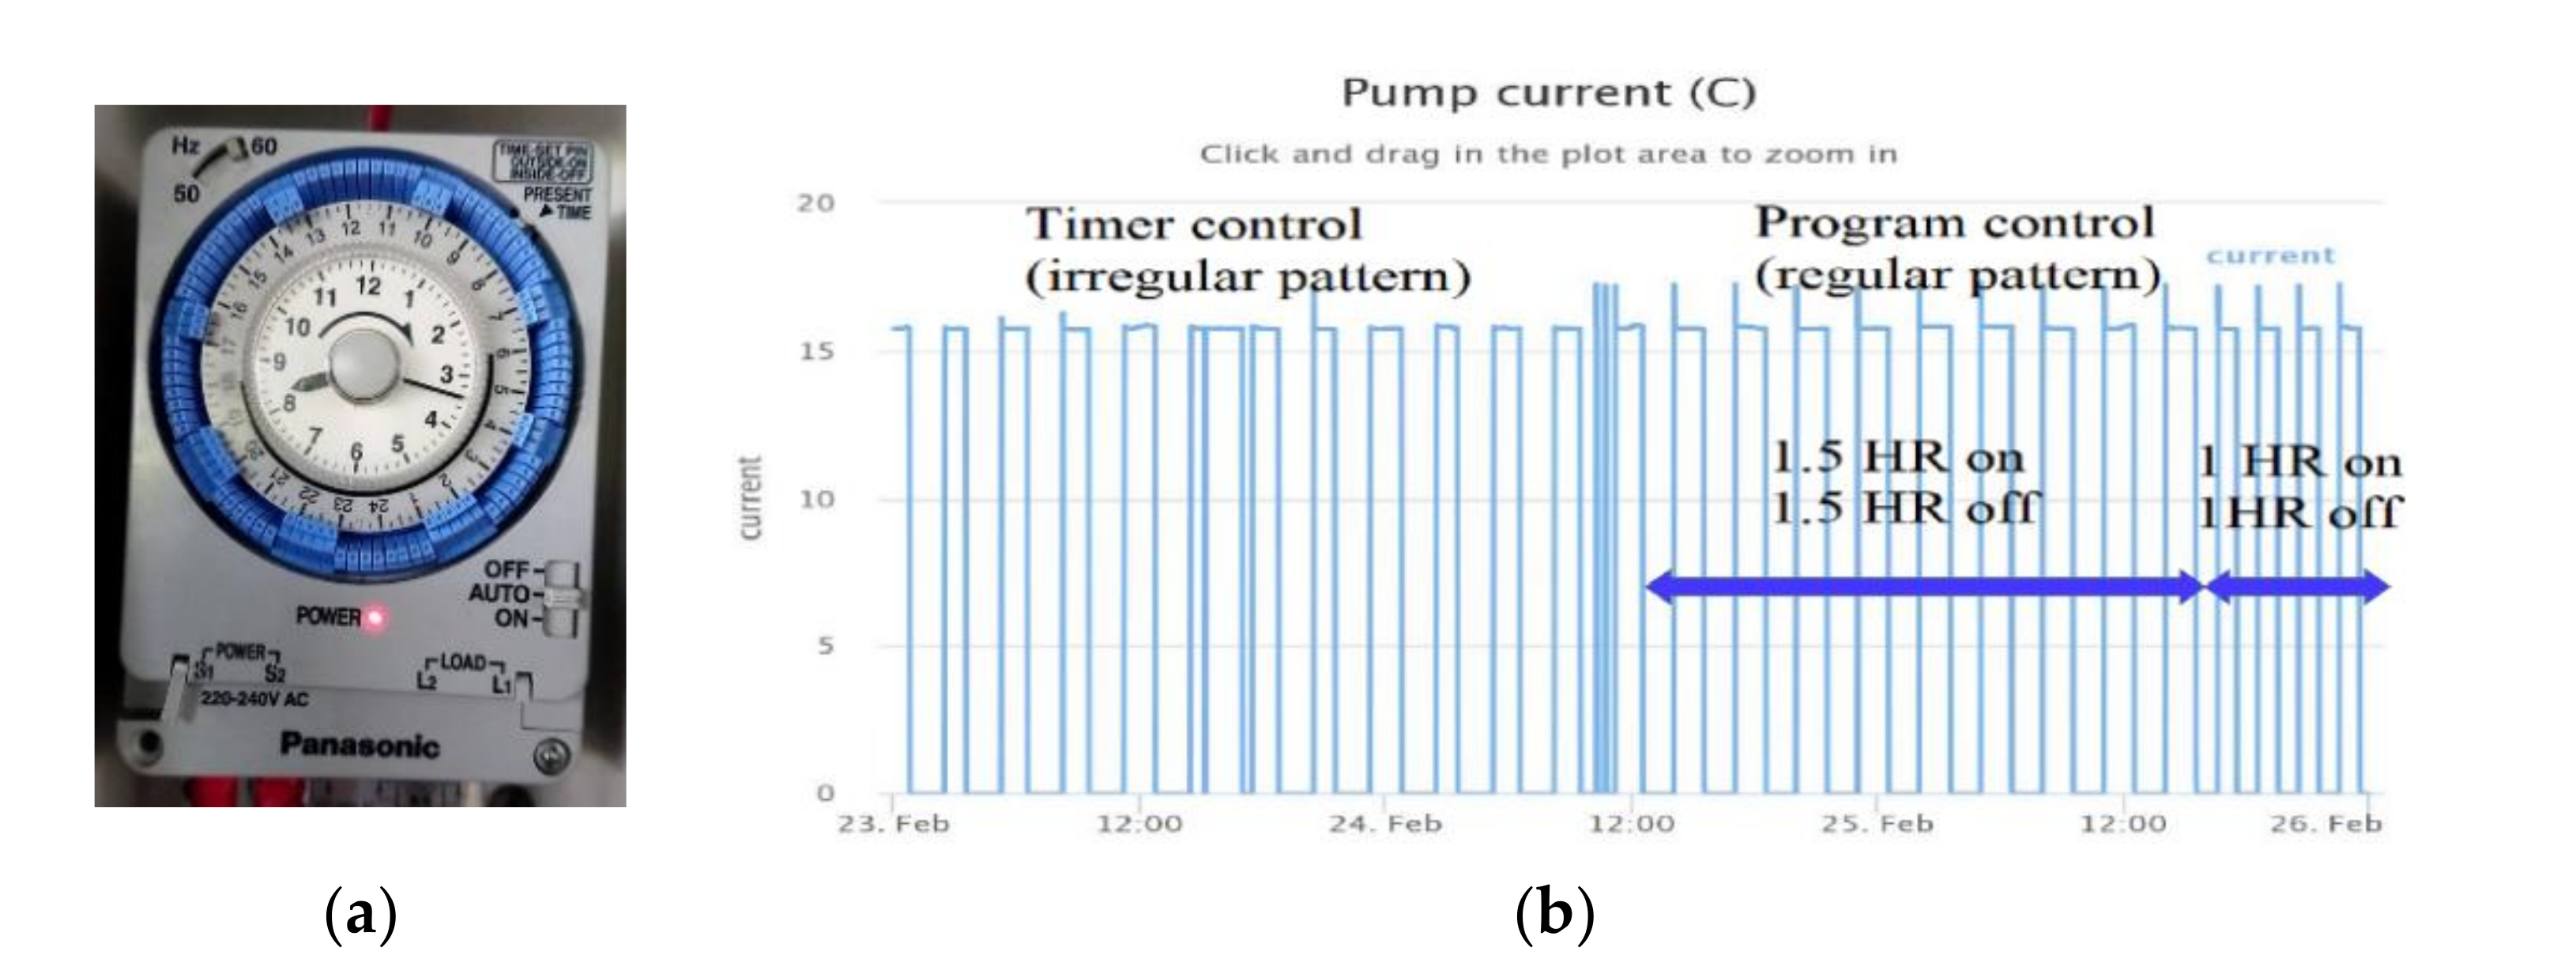
4.2.4. Remote Pump Control

The final task is verifying the remote control function that makes a normal submersible pump programmable. The left part of Figure 12 shows the timer that manually controls the pump by pressing or releasing the small blue switches, although the farmer usually does not press the switches evenly. The right part of Figure 12 is a snapshot of the current drawn by the pump, which shows that the active pattern is irregular, as expected. After the pump control program was applied on February 24, the duty cycle became fixed. Initially, the schedule was configured with 1.5 h on and off periods. For the demonstration, the period was changed to 1 h on February 25. The modification was conducted on the server side, and it is not necessary to do anything for the unit deployed in the field.

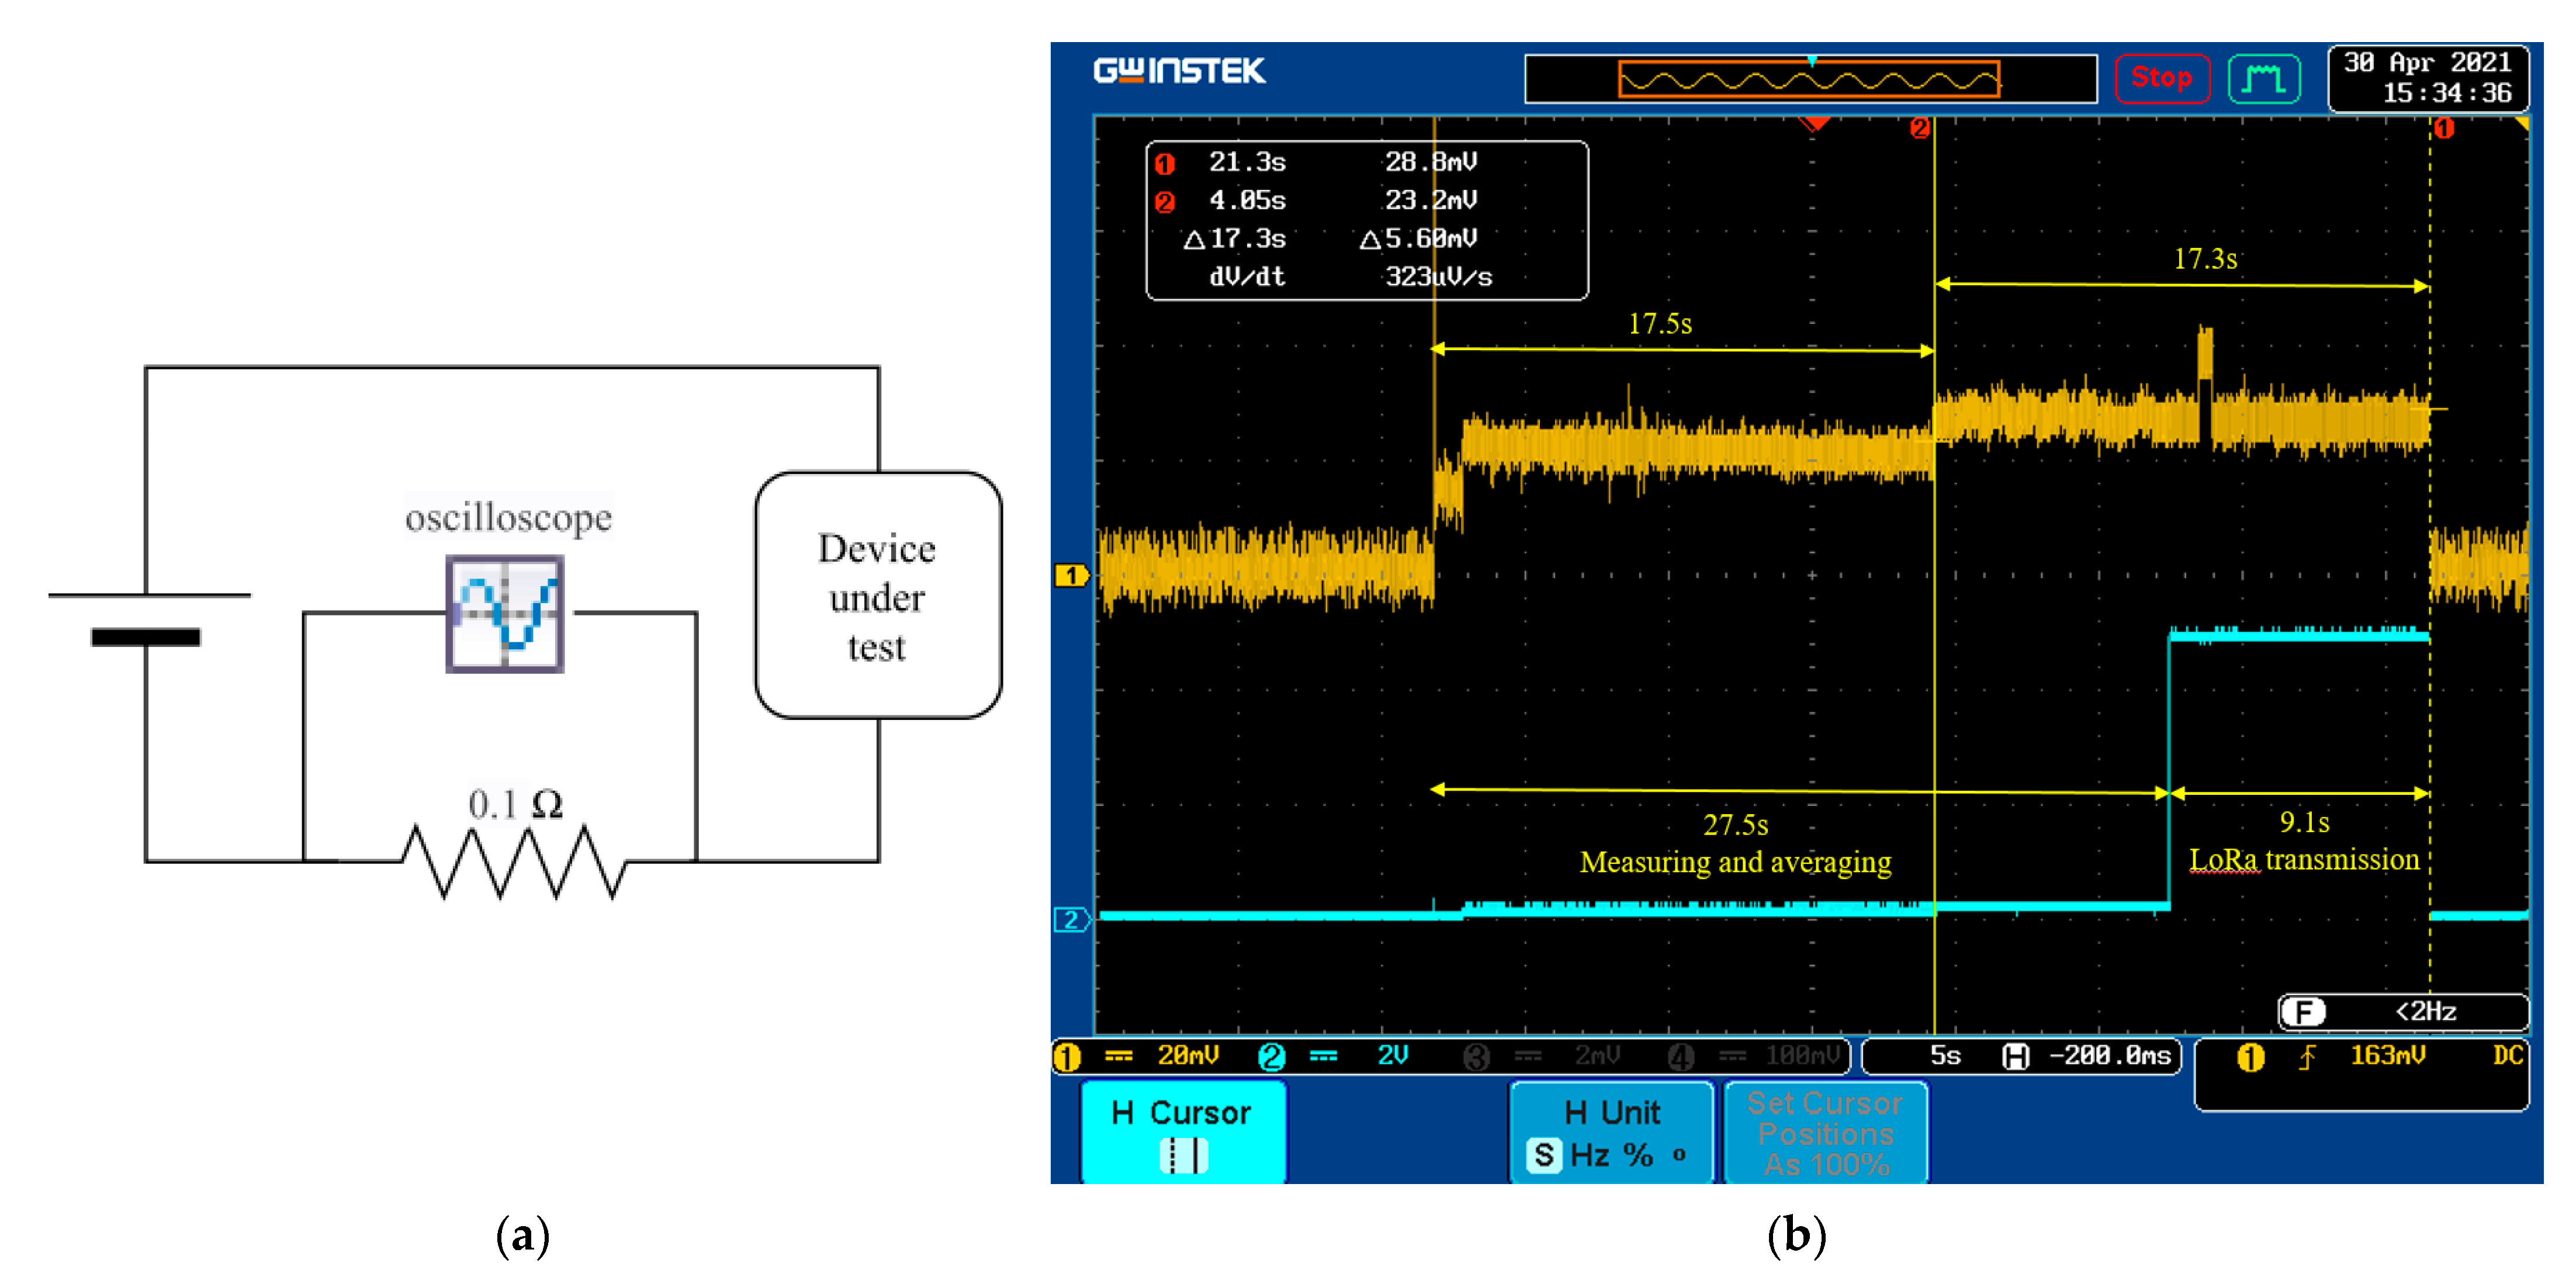
4.2.5. Power Consumption Evaluation

The last task is to evaluate the power consumption of a type A outdoor unit. The test setup is shown in Figure 13a. The probe of a digital oscilloscope is hooked across a 0.1 Ω resistor connected in series to the power cord. In this configuration, 1 mV on the screen is equivalent to 10 mA in the wire loop. Figure 13b is the snapshot of a complete cycle. We also use channel 2 to monitor a general purpose I/O pin, indicating LoRa transmission. For the worst case, the spreading factor is configured as 10, the largest value we can configure in the adopted platform, to transmit data in the most robust mode. We can see that this unit takes about 27.5 s for measuring and averaging. The length of a message sent to a LoRa module is 40 bytes. The LoRa module takes about 9.1 s to transmit the message. Notice that 9.1 s is the time spent until the MCU receives the acknowledgement from the LoRa module, and it should be larger than the actual packet transmission time. As the task is performed every 10 min, the average current, denoted by Iavg, can be estimated by
I a v g = 17.5 * 232   mA + 17.3 * 288   mA 600 = 15.07   mA
With the equipped 6000 mAh battery, the estimated battery life is about 398 h without charging. With a solar panel as the power source, the outdoor unit is able to work through the rainy season in our country.

5. Conclusions

This paper presents a complete IoT system, including the design of a remote IoT unit and server construction. Bidirectional data delivery between the field and the back-end server were also addressed. In addition, all units were successfully installed in the target field. The individual functions were validated by carefully examining the collected data visualized in the browser. The experiment’s results show that we have successfully implemented a multisensor and remote-controlled IoT system. A remote unit can be powered by a small 2.5 W solar panel. The command from a back-end program can be successfully delivered to a remote unit by conjunction of MQTT and LoRaWAN. As mentioned in Section 4.2.1, further investigation is necessary for the pH module because the value dips at noon. We currently carry out the evaluation of the pH modules from other vendors. After that, the program’s optimization can be performed to reduce energy consumption. Another potential method to reduce energy waste is to adopt a low power MCU [12] instead of Arduino Mega. In the future, data analysis will be the major task. Deployment to other fields will be conducted to quickly gather huge amounts of data for cross-referencing.
The proposed system architecture can be easily applied to other IoT applications because there is only one logical interface between the back-end system and IoT units in the field. Any IoT units or gateways can upload data to the system by the MQTT protocol with proper topics. A command can also be carried by MQTT as well to the field. Flexible database schema design and friendly user interface will also be two important tasks in the future to accommodate more sensors and applications.

Author Contributions

Conceptualization, methodology, supervision, and writing, Y.-W.K.; software implementation, all authors; unit assembly, W.-L.W., X.-F.H., Y.-T.S. and S.-Y.M.; field test, S.-Y.M. All authors have read and agreed to the published version of the manuscript.

Funding

This research was funded by Ministry of Science and Technology, Taiwan, grant number MOST 109-2221-E-260-012 and 109-2321-B-260-001.

Institutional Review Board Statement

Not applicable.

Informed Consent Statement

Not applicable.

Data Availability Statement

The data presented in this study are available on request from the corresponding author.

Acknowledgments

The authors would like to thank Deng-Ye Peng, the owner of the field, for his great support in this project.

Conflicts of Interest

The authors declare no conflict of interest.

References

  1. Makario, J.; Ngetich, K.; MAINA, C.W. Long Range Low Power Sensor Networks for Agricultural Monitoring-A Case Study in Kenya. In Proceedings of the 2019 IST-Africa Week Conference (IST-Africa), Nairobi, Kenya, 8–10 May 2019; pp. 1–8. [Google Scholar]
  2. Simitha, K.M.; Raj, S. IoT and WSN based water quality monitoring system. In Proceedings of the 3rd International Conference on Electronics, Communication and Aerospace Technology (ICECA), Coimbatore, India, 2–14 June 2019; pp. 205–210. [Google Scholar]
  3. Islam, A.; Akter, K.; Nipu, N.J.; Das, A.; Rahman, M.M.; Rahman, M. Iot based power efficient agro field monitoring and irrigation control system: An empirical implementation in precision agriculture. In Proceedings of the International Conference on Innovations in Science, Engineering and Technology (ICISET), Chittagong, Bangladesh, 27–28 October 2018; pp. 372–377. [Google Scholar]
  4. Wu, N.; Khan, M. LoRa-based Internet-of-Things: A Water Quality Monitoring System. In Proceedings of the IEEE SoutheastCon, Huntsville, AL, USA, 11–14 April 2019; pp. 1–4. [Google Scholar]
  5. Ngom, B.; Diallo, M.; Gueye, B.; Marilleau, N. LoRa-based Measurement Station for Water Quality Monitoring: Case of Botanical Garden Pool. In Proceedings of the IEEE Sensors Applications Symposium (SAS), Sophia Antipolis, France, 11–13 March 2019; pp. 1–4. [Google Scholar]
  6. Kökten, E.; Çalışkan, B.C.; Karamzadeh, S.; Soyak, E.G. Low-Powered Agriculture IoT Systems with LoRa. In Proceedings of the IEEE Microwave Theory and Techniques in Wireless Communications (MTTW), Riga, Latvia, 1–2 October 2020; pp. 178–183. [Google Scholar]
  7. Boonyopakom, P.; Thongna, T. Environment Monitoring System through LoRaWAN for Smart Agriculture. In Proceedings of the IEEE 5th International Conference on Information Technology (InCIT), Chonburi, Thailand, 21–22 October 2020; pp. 12–16. [Google Scholar]
  8. Mya, K.T.; Sein, M.M.; Nyunt, T.T.S.; Lewlompaisarl, U.; Owada, Y. A Design for IoT Based Smart Watering System Using LoRa. In Proceedings of the IEEE 9th Global Conference on Consumer Electronics (GCCE), Kobe, Japan, 13–16 October 2020; pp. 278–279. [Google Scholar]
  9. Siregar, B.; Tanjung, K.; Nurmayadi, F. Remotely Controlled Water Flow Monitoring System with Mechanical Control on the Faucet using LoRa Communication. In Proceedings of the IEEE International Conference on ICT for Smart Society (ICISS), Bandung, Indonesia, 19–20 November 2020; pp. 1–5. [Google Scholar]
  10. Burchi, G.; Chessa, S.; Gambineri, F.; Kocian, A.; Massa, D.; Milano, P.; Milazzo, P.; Rimediotti, L.; Ruggeri, A. Information technology controlled greenhouse: A system architecture. In Proceedings of the IoT Vertical and Topical Summit for Agriculture, Tuscany, Italy, 8–9 May 2018. [Google Scholar]
  11. Ayaz, M.; Ammad-Uddin, M.; Sharif, Z.; Mansour, A.; Aggoune, E.-H.M. Internet-of-things (IoT)-based smart agriculture: Toward making the fields talk. IEEE Access 2019, 7, 129551–129583. [Google Scholar] [CrossRef]
  12. Borrero, J.D.; Zabalo, A. An autonomous wireless device for real-time monitoring of water needs. Sensors 2020, 20, 2078. [Google Scholar] [CrossRef] [PubMed] [Green Version]
  13. Kuo, Y.W.; Li, C.L.; Jhang, J.H.; Lin, S. Design of a Wireless Sensor Network-Based IoT Platform for Wide Area and Heterogeneous Applications. IEEE Sens. J. 2018, 18, 5187–5197. [Google Scholar] [CrossRef]
  14. Sundaram, J.P.S.; Du, W.; Zhao, Z. A survey on lora networking: Research problems, current solutions, and open issues. IEEE Commun. Surv. Tutor. 2019, 22, 371–388. [Google Scholar] [CrossRef] [Green Version]
  15. Zhao, L.; Wu, W.; Li, S. Design and implementation of an iot-based indoor air quality detector with multiple communication interfaces. IEEE Internet Things J. 2019, 6, 9621–9632. [Google Scholar] [CrossRef]
  16. Zhou, Q.; Zheng, K.; Hou, L.; Xing, J.; Xu, R. Design and implementation of open LoRa for IoT. IEEE Access 2019, 7, 100649–100657. [Google Scholar] [CrossRef]
  17. Kulkarni, P.; Hakim, Q.O.A.; Lakas, A. Experimental evaluation of a campus-deployed iot network using lora. IEEE Sens. J. 2020, 20, 2803–2811. [Google Scholar] [CrossRef]
  18. Zhang, X.; Zhao, Y.; Zhou, L.; Zhao, J.; Dong, W.; Zhang, M.; Lv, X. Transmission tower tilt monitoring system using low-power wide-area network technology. IEEE Sens. J. 2020, 21, 1100–1107. [Google Scholar] [CrossRef]
  19. Aldahdouh, K.A.; Darabkh, K.A.; Al-Sit, W. A survey of 5G emerging wireless technologies featuring LoRaWAN, Sigfox, NB-IoT and LTE-M. In Proceedings of the IEEE International Conference on Wireless Communications Signal Processing and Networking (WiSPNET), Chennai, India, 21–23 March 2019; pp. 561–566. [Google Scholar]
  20. Olatinwo, S.O.; Joubert, T.-H. Enabling communication networks for water quality monitoring applications: A. survey. IEEE Access 2019, 7, 100332–100362. [Google Scholar] [CrossRef]
  21. Popli, S.; Jha, R.K.; Jain, S. A survey on energy efficient narrowband internet of things (NBIoT): Architecture, application and challenges. IEEE Access 2018, 7, 16739–16776. [Google Scholar] [CrossRef]
  22. Martinez, B.; Adelantado, F.; Bartoli, A.; Vilajosana, X. Exploring the performance boundaries of NB-IoT. IEEE Internet Things J. 2019, 6, 5702–5712. [Google Scholar] [CrossRef] [Green Version]
  23. Joris, L.; Dupont, F.; Laurent, P.; Bellier, P.; Stoukatch, S.; Redouté, J.-M. An autonomous sigfox wireless sensor node for environmental monitoring. IEEE Sens. Lett. 2019, 3, 1–4. [Google Scholar] [CrossRef]
  24. OASIS Standard. MQTT Version 5.0. Available online: https://docs.oasis-open.org/mqtt/mqtt/v5.0/mqtt-v5.0.html (accessed on 1 May 2020).
  25. Internet Engineering Task Force (IETF) Standard. The JavaScript Object Notation (JSON) Data Interchange Format. Available online: https://tools.ietf.org/html/rfc8259 (accessed on 1 May 2020).
Figure 1. The overall architecture of the proposed LoRa-based multisensor IoT system.
Processes 09 00813 g001
Figure 2. A partial schematic for the common parts (right) and power management (left).
Processes 09 00813 g002
Figure 3. (a) A partial schematic and (b) a program flowchart for the type A unit.
Processes 09 00813 g003
Figure 4. (a) A partial schematic and (b) the program flowchart for the type B unit.
Processes 09 00813 g004
Figure 5. (a) A partial schematic and (b) the program flowchart for the type C unit.
Processes 09 00813 g005
Figure 6. (a) A partial schematic and (b) the program flowchart for the type D unit.
Processes 09 00813 g006
Figure 7. Field deployment configuration.
Processes 09 00813 g007
Figure 8. (ad) Finished units and (eh) actual unit deployments.
Processes 09 00813 g008
Figure 9. Snapshots of historical data for EC, ORP, and pH.
Processes 09 00813 g009aProcesses 09 00813 g009b
Figure 10. Snapshots of historical environmental data.
Processes 09 00813 g010aProcesses 09 00813 g010b
Figure 11. Snapshots of light intensity and battery voltage.
Processes 09 00813 g011
Figure 12. A photo of timer (a) and a snapshot of current drawn by the pump (b).
Processes 09 00813 g012
Figure 13. The test configuration (a) and a snapshot of digital oscilloscope (b).
Processes 09 00813 g013
Table 1. Four types of IoT units.
Type A (Solar)Type B (Solar)Type C (AC)Type D (AC)Type D
FunctionspH
ORP
EC
Water temperature
Water temperature
Air temperature
Humidity
Atmospheric pressure
Light intensity
Current
Remote control
Water flowWater meter
Modules (interface)EZO pH circuit (UART)
EZO ORP circuit (UART)
EZO conductivity circuit (UART)
DB18B20 (one wire)
DB18B20 (one wire)
GY-39 (UART)
CT + ADS1115 (I2C)
Relay (Pin D6)
Hall-effect
sensor (Pin D5)
Publisher’s Note: MDPI stays neutral with regard to jurisdictional claims in published maps and institutional affiliations.

