1. Introduction
Electro-hydraulic control technology has two categories: valve control and pump control. The valve control system has a fast dynamic response and high control accuracy, and has been widely used in aerospace and industrial automation. The disadvantages include large throttling loss, low energy efficiency, and a system energy utilization rate of less than 40% [
1]. The pump control system (referred to as PCS) regulates the output flow of the positive displacement pump (this refers to a hydraulic pump with an axial piston design and a swash plate) by controlling the speed of the servo motor (referred to as SM). This avoids throttling loss in the valve control system for the technical reasons. Compared with the valve control system, the PCS has a higher power-to-weight ratio, a simple configuration design, and a strong ability to resist pollution [
2,
3].
Due to the gradual expansion of the application field of electro-hydraulic servo technology, its high-precision and high-efficiency technical capabilities have gradually become one of the core technical requirements of certain equipment [
4,
5]. In modern times, motor frequency control technology and servo drive technology capabilities have rapidly developed and grown [
6,
7], and electro-hydraulic servo pump control technology has made great progress. At present, it has been widely used in aerospace and gradually expanded to the fields of forging, wind power, offshore engineering, shipbuilding, and metallurgy [
8,
9]. However, pump control technology still has limitations, such as low dynamic performance and poor position control accuracy.
The main influencing factor is the nonlinear flow of the PCS. When the system is under high pressure, the flow of the positive displacement pump will be attenuated severely. With the coupling effect of factors, such as the dead zone of the positive displacement pump, oil compression, and internal leakage in the system, the output flow of the system presents a strong nonlinear phenomenon. When it comes to high-precision closed-loop control, there is large deviation between the expected flow and the actual output flow, which hinders the realization of the high-precision control of the system. Therefore, it is necessary to analyze the nonlinear characteristics of the system flow.
A PCS is a typical, strongly nonlinear system. There are many parameter uncertainties and uncertain nonlinearities in the system [
10,
11]. The study of the nonlinear characteristics of the system flow output is key to realizing high-precision control of the system. Many experts and scholars have conducted related research on this issue. Jiming Ma et al. performed research on the leakage and internal wear mechanisms of positive displacement pumps, and the results showed that the wear of the positive displacement pump movement pair affected the amount of oil leakage, and the wear of the movement pair was related to the oil temperature, oil cleanliness, and relative movement speed [
12]. Yao Bin et al. fitted the nonlinear mapping of the flow of the positive displacement pump according to the nonlinear disturbance of the pressure pulsation at the low speed of the positive displacement pump [
13]. Lu Fei et al. studied the influence of speed changes on the plunger’s position and the plunger’s leakage, and obtained the law of the displacement of the plunger end and the plunger’s position in the cylinder plunger hole with speed [
14]. Guoyang Cheng et al. designed a discrete-time robust composite nonlinear controller for the problem of the SM speed output characteristics being disturbed by actuators, which greatly improved the system’s response characteristics [
15].
Ren G et al. explored the influence of the system’s nonlinear interference of oil leakage on the system control performance, and designed a fixed gain position controller based on stability and tracking indicators, which improved the accuracy of system position control [
16]. MAE Sayed et al. studied the problem of poor position control accuracy caused by such factors as pump dead zone flow back-irrigation, static friction between the motor and the pump, and backlash. The effect of backlash and nonlinear friction on position control accuracy was obtained [
17].
Yang Lin et al. investigated the problem of the nonlinear friction of hydraulic cylinders being difficult to accurately model. Finally, they more accurately described the frictional force in a hydraulic cylinder [
18]. Buchun Song et al. designed an adaptive sliding membrane control scheme for many nonlinear problems in a closed PCS, and realized adaptive control of the uncertainty of many models of the system [
19]. Hai-Bo Yuan et al. considered nonlinear disturbances, such as oil compression and external load interference, established a nonlinear mathematical model of the system, and used gray box system identification for control system model parameter identification.
At present, many scholars have studied nonlinear phenomena in systems, from system hardware to software control algorithms. However, in view of the nonlinear problem of the output flow of the PCS, the partition characteristics of the system’s flow have not been studied in the form of flow partitions. Few scholars have conducted systematic research on the root causes of the nonlinear flow output of the PCS. This article starts from the nonlinear partition characteristics of the flow output and covers the influence of the nonlinear characteristics of the SM and the positive displacement pump on the output flow of the system. This paper systematically studies the nonlinear partition characteristics of the flow of the pump control system, and analyzes the factors that affect the nonlinear flow of the pump control system one by one. The expected research results will provide a theoretical basis for the optimization of the high-performance control strategy of the electro-hydraulic servo pump control system.
2. Brief Introduction of PCS
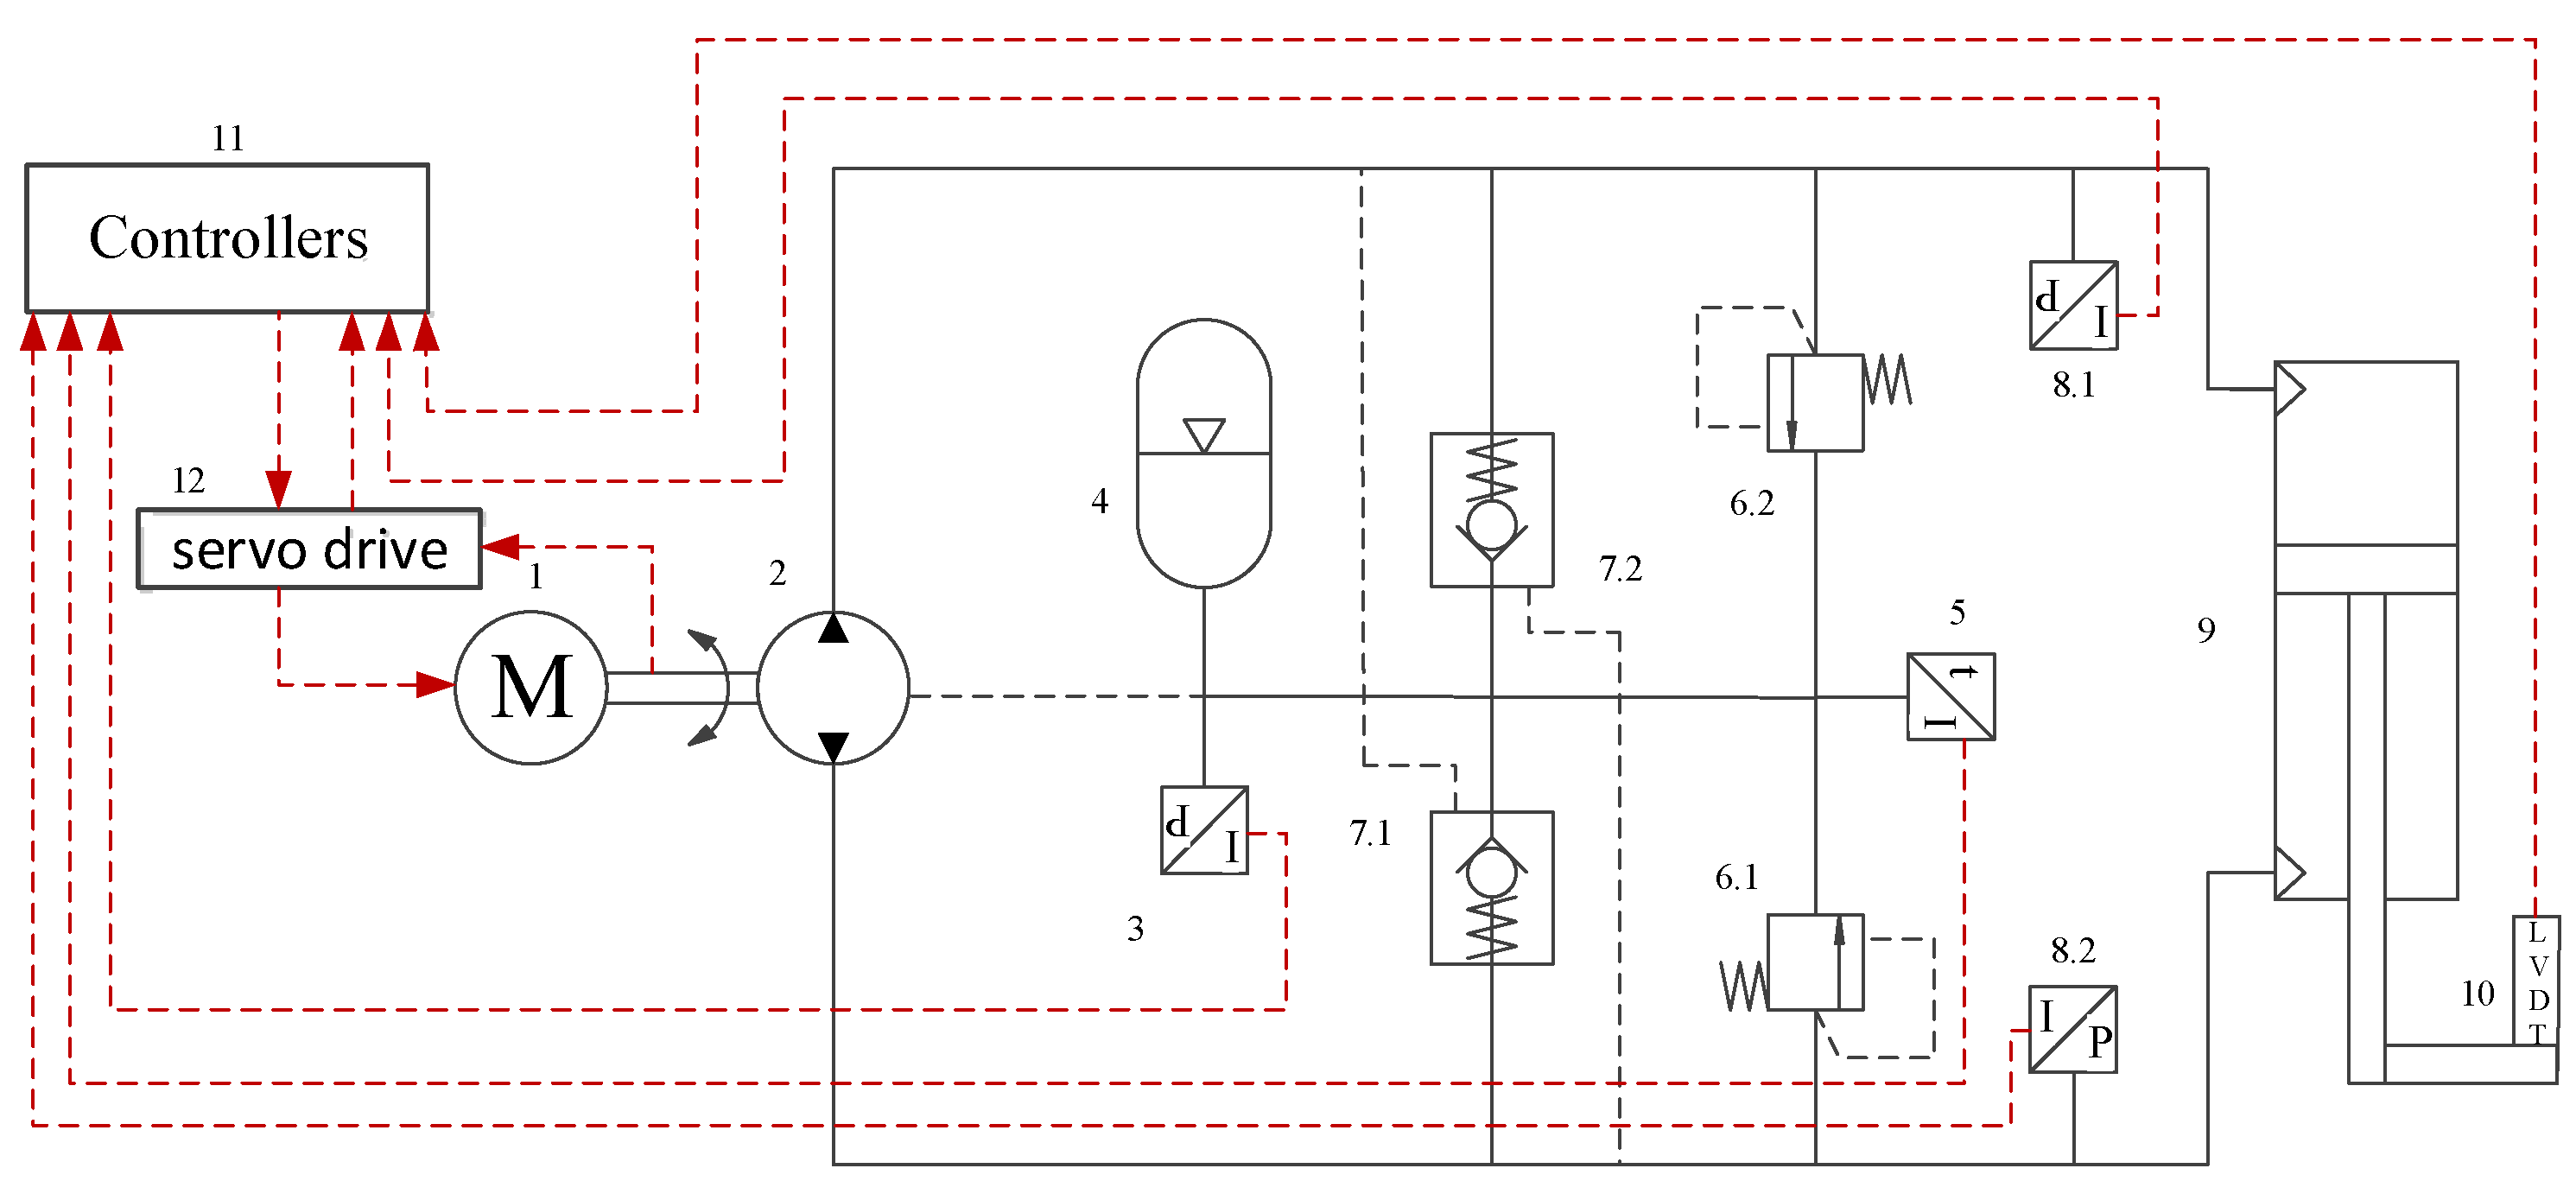
The structural principles of the PCS studied in this paper are shown in
Figure 1. The SM drives the positive displacement pump coaxially. The suction and discharge ports of the positive displacement pump are connected with the two load ports of the hydraulic cylinder. The controller outputs control commands to the servo drive controlling the SM. The speed of the motor changes the output flow of the positive displacement pump to adjust the displacement of the hydraulic cylinder.
The replenishment circuit uses an accumulator and a hydraulic control check valve to replenish the system, and a hydraulic control check valve is used to solve the problem of asymmetry in the flow of the asymmetric cylinder in the PCS. The safety circuit uses an overflow valve to prevent the pressure in the two chambers becoming too high in the hydraulic cylinder. The PCS specifically includes the SM, the positive displacement pump, the hydraulic valve, the accumulator, the hydraulic cylinder, the servo drive, and the controller.
The system detects the actual position of the hydraulic cylinder output via the sensor, and transmits the collected position signal to the controller. Through the integrated processing of the position information, the system outputs the speed control signal of the SM and then controls the output flow of the positive displacement pump to control the position change of the hydraulic cylinder. In this research, the positive displacement pump functions as the axial piston pump, and the SM used is the permanent magnet synchronous motor.
The key physical quantities used in this paper are shown in
Table 1. The parameters are divided into two categories: one is performance index parameters, and the other is design parameters. The component design parameters adhere to the manufacturer’s internal technical data. It is difficult for us to attain these parameters. The design parameters of this article are mainly formulated to study the system mechanism, and do not affect the final research results of the article. The detailed list is as follows:
3. Mathematical Model
To study the nonlinear characteristics of the output flow of the system, the nonlinear characteristics of the relevant subsystems must be studied first. Therefore, we first establish a mathematical model of the core components of the PCS, the servo motors, the positive displacement pump and the hydraulic cylinders, and research the flow output characteristics of the PCS.
3.1. SM Mathematical Model
As the execution terminal of the control algorithm, the SM is the core component of the system control. The stator voltage equation of the SM is
where
,
,
and
are the three-phase stator voltages;
,
,
and
are the stator three-phase currents;
is the stator winding phase resistance matrix, and
is the stator three-phase winding flux matrix.
where
,
, and
are the three-phase flux linkage components of the stator.
SM flux equation:
where
is the magnetic field generated by the stator winding current and the flux linkage matrix of the stator winding itself, and
is the flux matrix of the magnetic field generated by the permanent magnet of the rotor with the stator winding.
where
,
, and
are the self-inductances of the stator three-phase windings, and
,
,
,
,
, and
are the mutual inductances between the stator three-phase windings.
,
, and
are the flux linkage components from the magnetic field generated by the permanent magnets connected to the three-phase windings of the stator, and
is the permanent magnet flux linkage of the rotor.
SM electromagnetic torque equation:
where
is the number of pole pairs of the motor,
is the rotor flux linkage, and
is the stator current space vector.
SM motion equation:
where
is the motor load torque,
is the rotor moment of inertia,
is the damping coefficient of the motor system, and
is the angular velocity at the output end of the motor shaft.
3.2. Positive Displacement Pump Mathematical Model
The positive displacement pump is the power element of the PCS, which provides the hydraulic power input for the movement of the hydraulic cylinder. The flow output equation of the positive displacement pump is:
where
is the rated displacement of the positive displacement pump,
is the output flow of the positive displacement pump,
is the leakage coefficient of the positive displacement pump, and
is the load pressure.
Positive displacement pump torque equation:
where
is the pressure difference between the inlet and outlet of the positive displacement pump,
is the coefficient related to the positive displacement pump, and
is the mechanical efficiency of the positive displacement pump.
3.3. Hydraulic Cylinder Mathematical Model
The hydraulic cylinder is the executive element in the PCS, and the flow continuity equation of the hydraulic cylinder is
The force balance equation of the hydraulic cylinder and the load is
where
is the effective area of the hydraulic cylinder,
is the input flow of the hydraulic cylinder,
is the leakage coefficient of the hydraulic cylinder,
is the effective volume modulus of the oil,
is the total mass of the piston and the load converted to the piston,
is the viscous damping coefficient of the piston and the load,
is the stiffness of the load spring,
is the output displacement of the hydraulic cylinder,
is any external load force acting on the piston, and
is the total compression volume of the system.
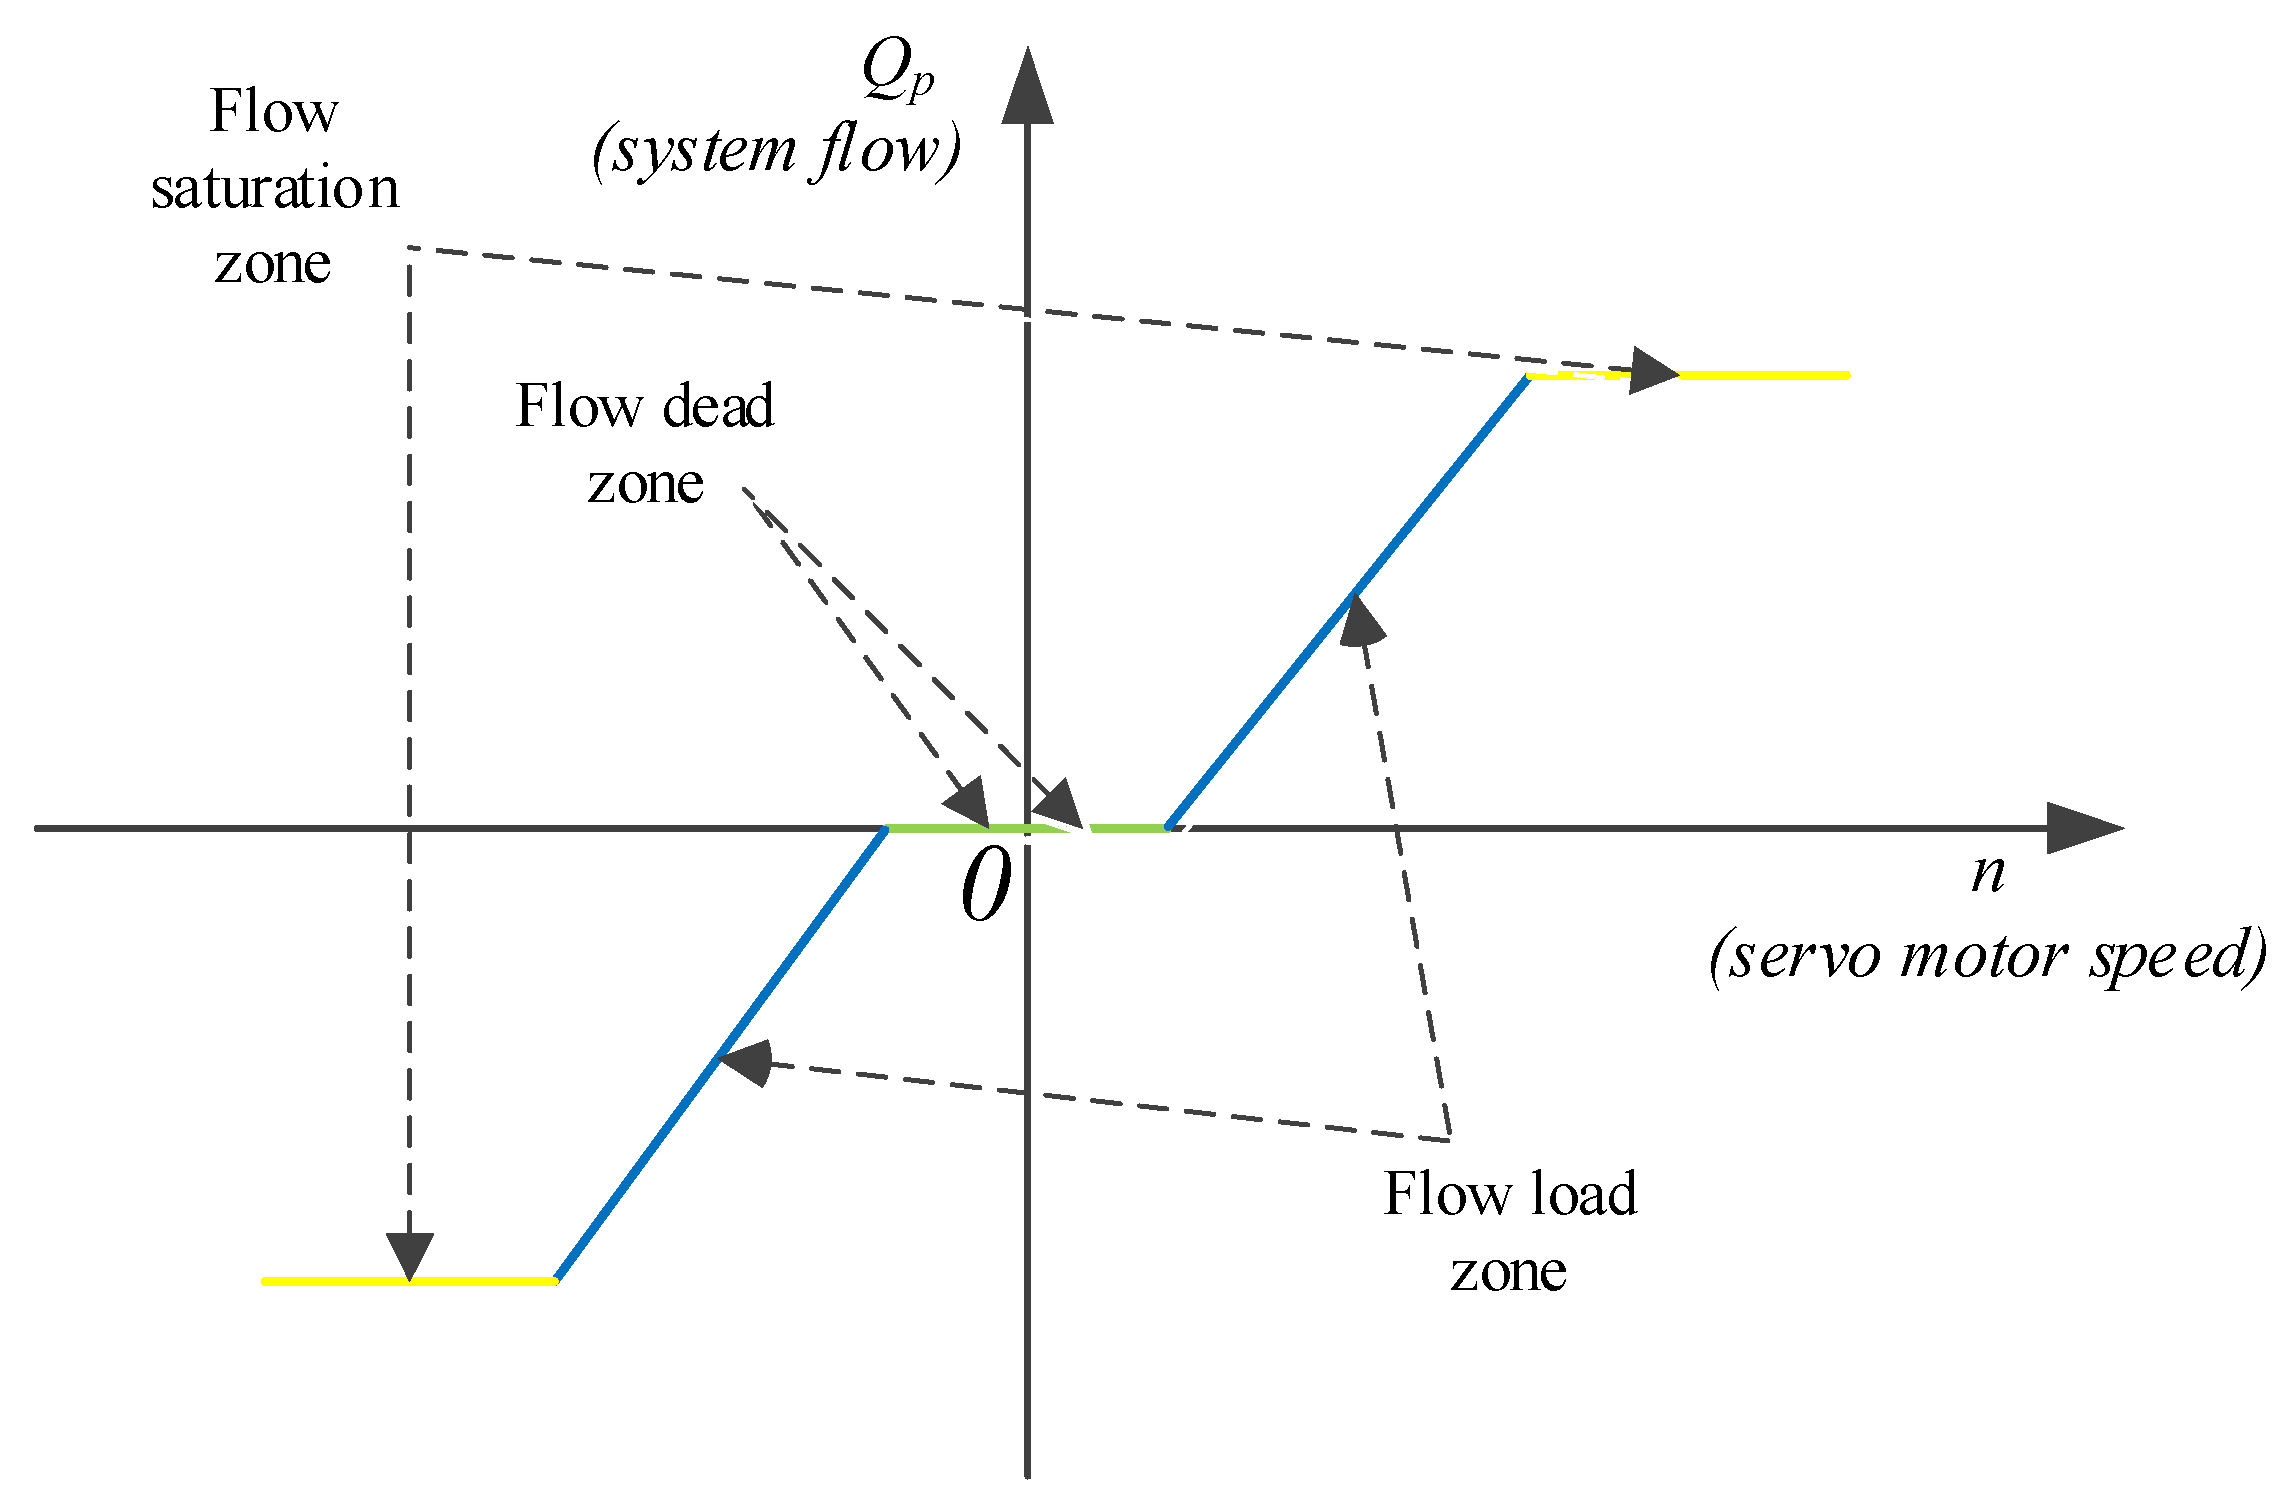
4. Discussion of the Nonlinear Partition Characteristics of Flow
A PCS is a typical strong nonlinear system, and it is difficult to accurately model the system flow through a mathematical model. Therefore, we studied the output characteristics of the pump flow under different working conditions in different areas, which are specifically divided into the flow dead zone, flow load zone, and flow saturation zone. The flow output characteristic diagram is shown in
Figure 2.
- ①
Flow dead zone: sends out the speed control command voltage, and the positive displacement pump has no flow output in the small speed range.
- ②
Flow load area: with the increase in the speed command, the output flow of the positive displacement pump increases.
- ③
Flow saturation zone: limited by the maximum speed of the positive displacement pump or SM, the flow reaches the saturation state.
The PCS typically works with the flow dead zone and the flow load zone. This article focuses on the two parts. The nonlinear flow of the PCS is related to the interaction of the positive displacement pump and the SM. These two parts will be focused on in our analysis.
4.1. Analysis of the Nonlinear Characteristics of an SM
The influence of the SM on the nonlinear characteristics of a PCS is mainly reflected in its nonlinear speed, and the nonlinear speed of the SM mainly originates from the fluctuation of the SM torque. The torque fluctuation of the SM is mainly reflected in two aspects: one is the friction torque of the SM, and the other is the torque reserve of the SM. The torque reserve of the SM is mainly analyzed in the experimental data.
We model the friction part of the SM as such:
SM motion equation:
where
The research focus of this article is a nonlinear analysis of the system output flow, studying the output flow of the system when the input speed of the motor is not zero. We ignore the change in the friction force when the SM passes the static state, and the motion equation of the SM is the as follows:
where
is the motor electromagnetic torque,
is the motor load torque,
is the equivalent converted moment of inertia of the rotor shaft,
is the dry friction force of the SM,
is the maximum static friction of the motor,
is the electromagnetic torque generated by the motor, and
is the dynamic friction that the motor needs to overcome when rotating.
4.2. Analysis of the Nonlinear Characteristics of a Fixed Pump
The flow produced by the positive displacement pump is composed of three parts: contraction flow, leakage flow, and actual effective output flow, as shown in the following formula:
where
is the effective flow output of the positive displacement pump,
is the leakage of the positive displacement pump, and
is the compression flow of the outlet cavity of the positive displacement pump.
4.2.1. Analysis of the Positive Displacement Pump Leakage Flow
The leakage flow of a positive displacement pump is divided into two categories: the internal leakage flow and external leakage flow. With the advancement of modern manufacturing technology and sealing, the external leakage of the positive displacement pump can be almost ignored; however, the internal leakage flow has a huge impact on the pump’s performance. Due to the structure of the pump, the internal leakage flow is divided into the differential pressure flow leakage,
, and the shear flow leakage,
.
where
is the outlet pressure of the positive displacement pump,
is the suction pressure of the pump,
is the dynamic viscosity of the oil at atmospheric pressure and 50 °C,
is the viscosity temperature coefficient of the oil,
is the temperature of the oil,
is the differential pressure flow leakage gap,
is the shear flow leakage gap of the positive displacement pump,
is the rotational speed of the positive displacement pump,
is the coefficient associated with the amount of shear flow leakage,
is the coefficient related to the leakage of differential pressure flow, and
is the coefficient related to the rotation of the pump core.
4.2.2. Compression Flow Analysis of Positive Displacement Pump Cavity
The process of the suction and discharge of the positive displacement pump is accompanied by the compression and release of the oil. The increase in system pressure is mainly caused by the compression of oil; thus, the system compression flow can be expressed as:
Therefore,
where
is the momentary inlet volume,
is the momentary outlet volume,
is the momentary leakage volume,
is the pressure in the plunger cavity of the plunger pump,
is the cross-sectional area of the plunger,
is the stroke of the plunger,
is the flow coefficient of the pump outlet,
is the effective area of the pump outlet,
is the pump outlet pressure,
is the oil density,
is the step function,
is the plunger diameter of the pump,
is the gap between the plunger and the orifice,
is the viscosity of the oil, and
is the contact length between the piston and the orifice.
Based on the above analysis, the flow continuity equation of the positive displacement pump is:
5. Experimental Study
5.1. Experimental Research Conditions
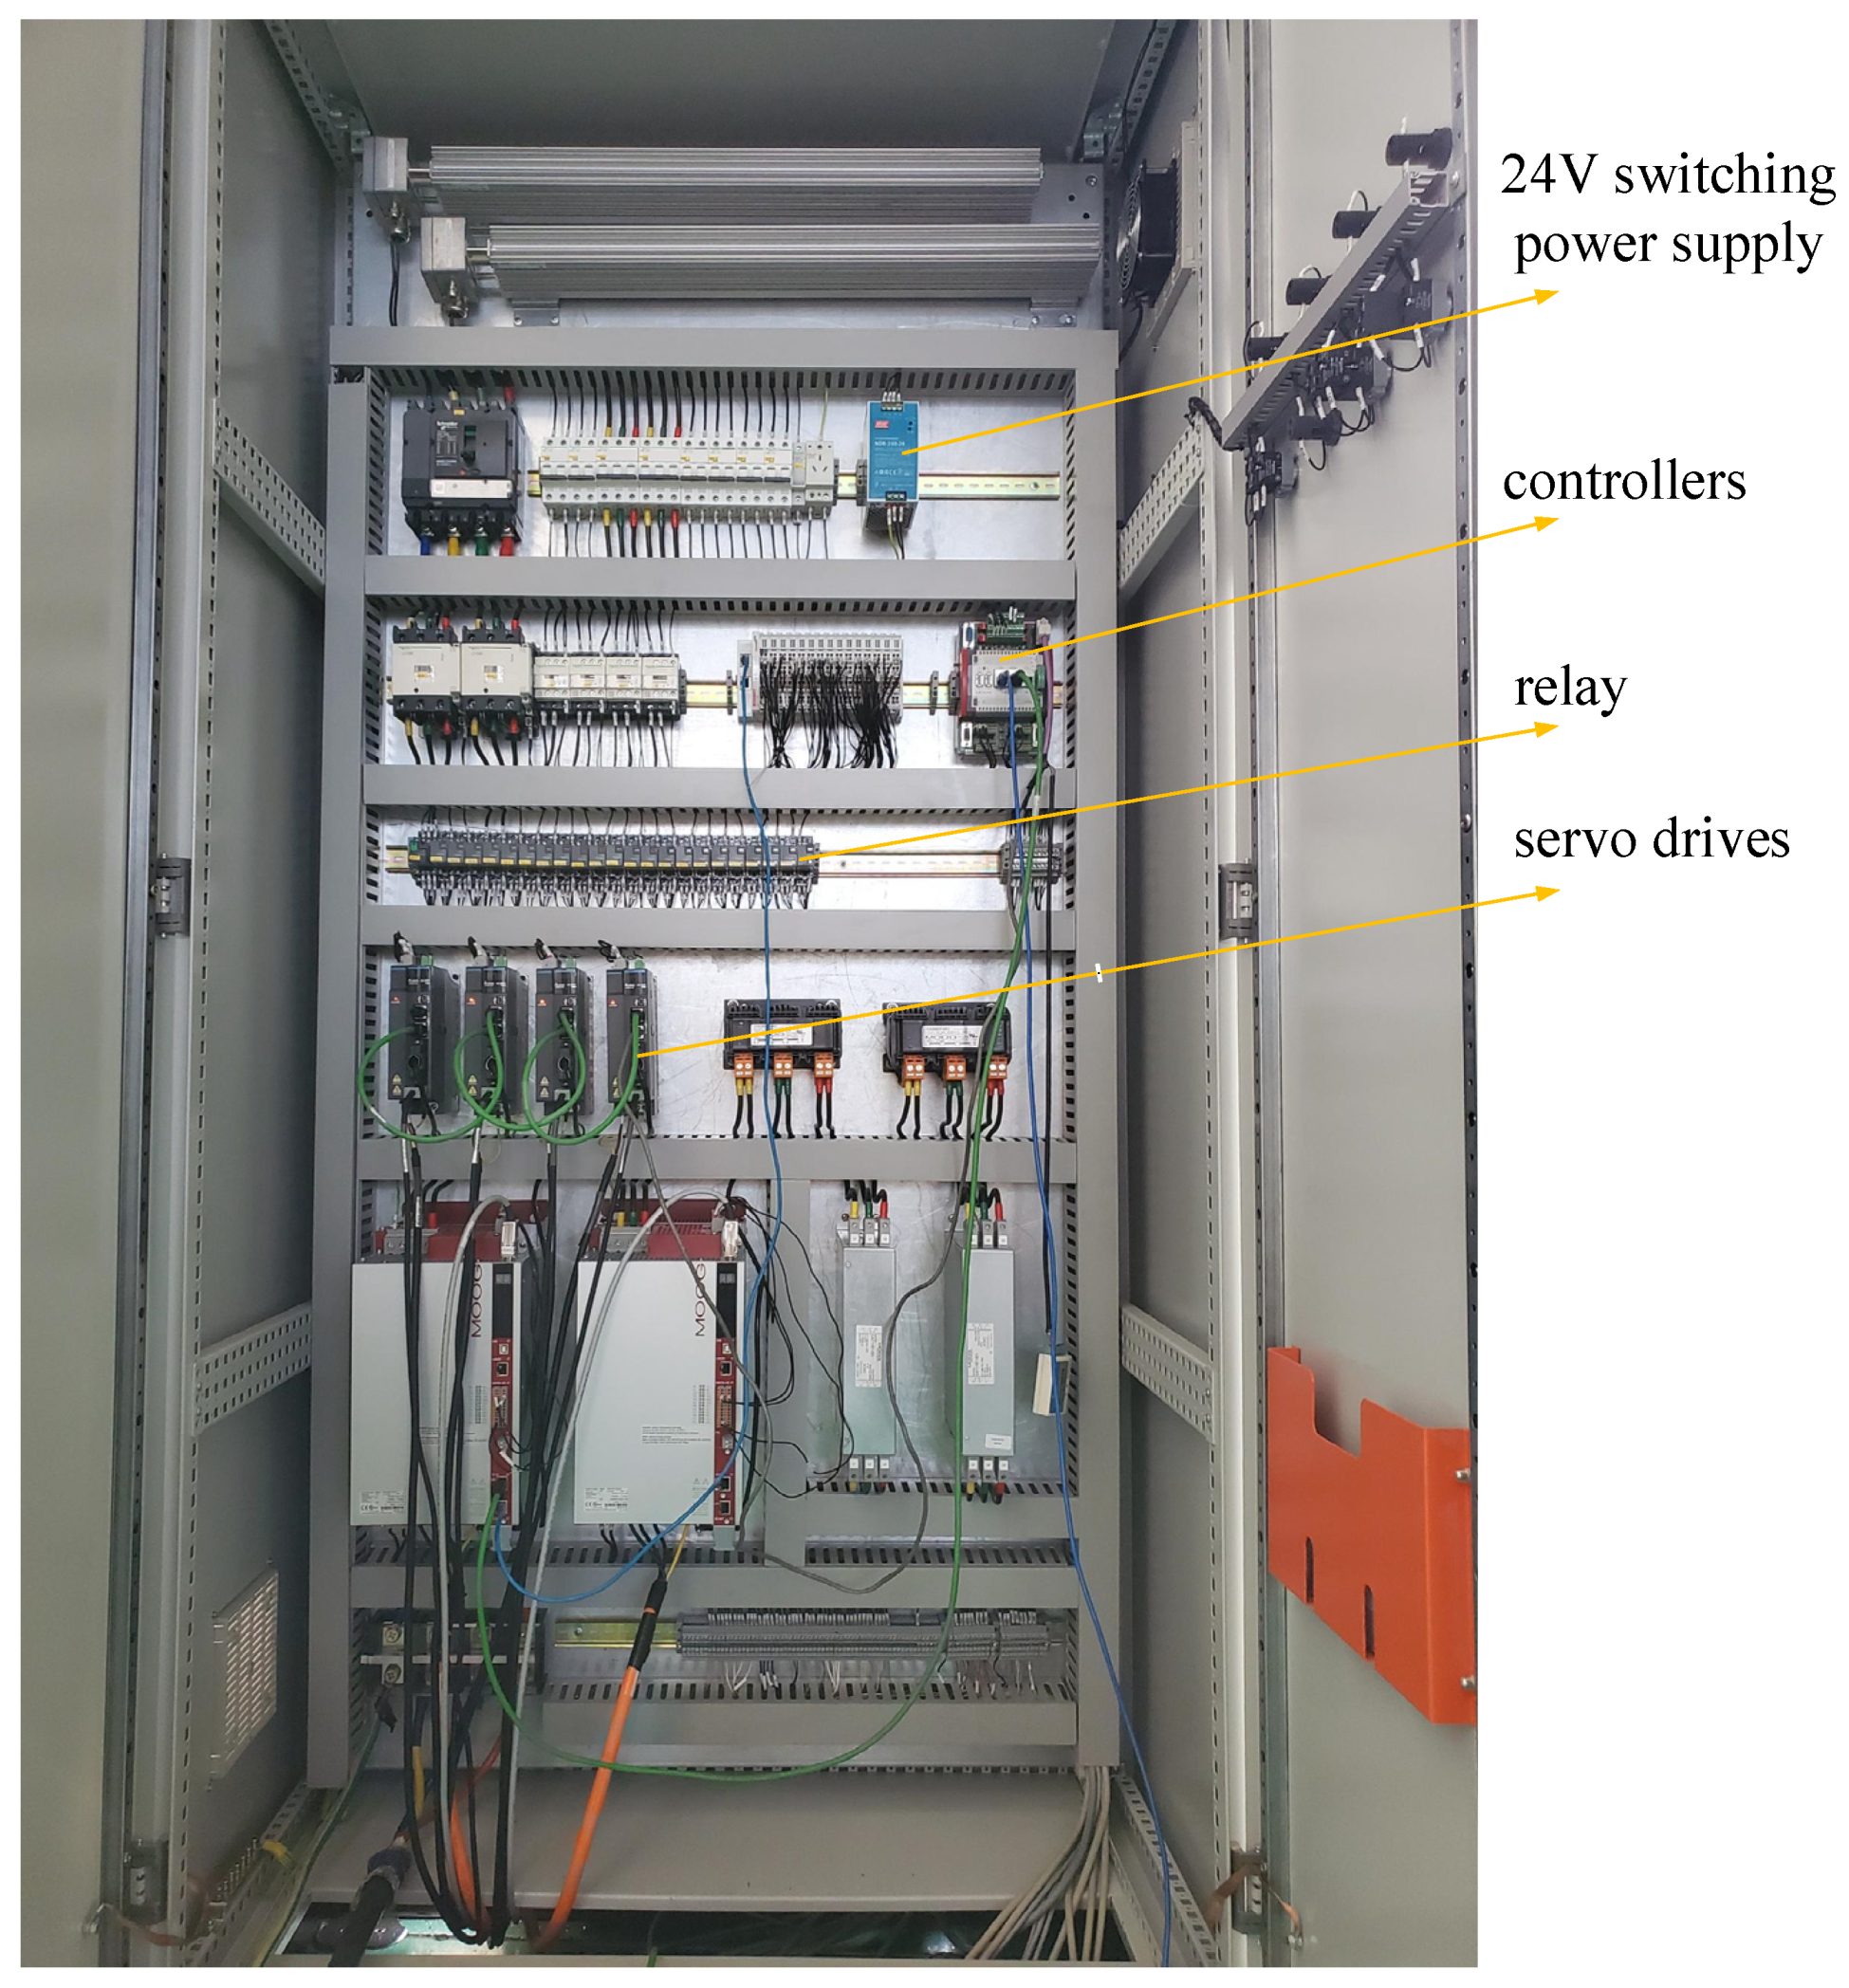
This paper relied on a pump-controlled hydraulic actuator experimental platform to conduct experimental research on the nonlinear characteristics of system flow. The electrical integrated cabinet included important electrical components, such as an axis controller, servo drive, and relay. The experimental platform is shown in
Figure 3 below.
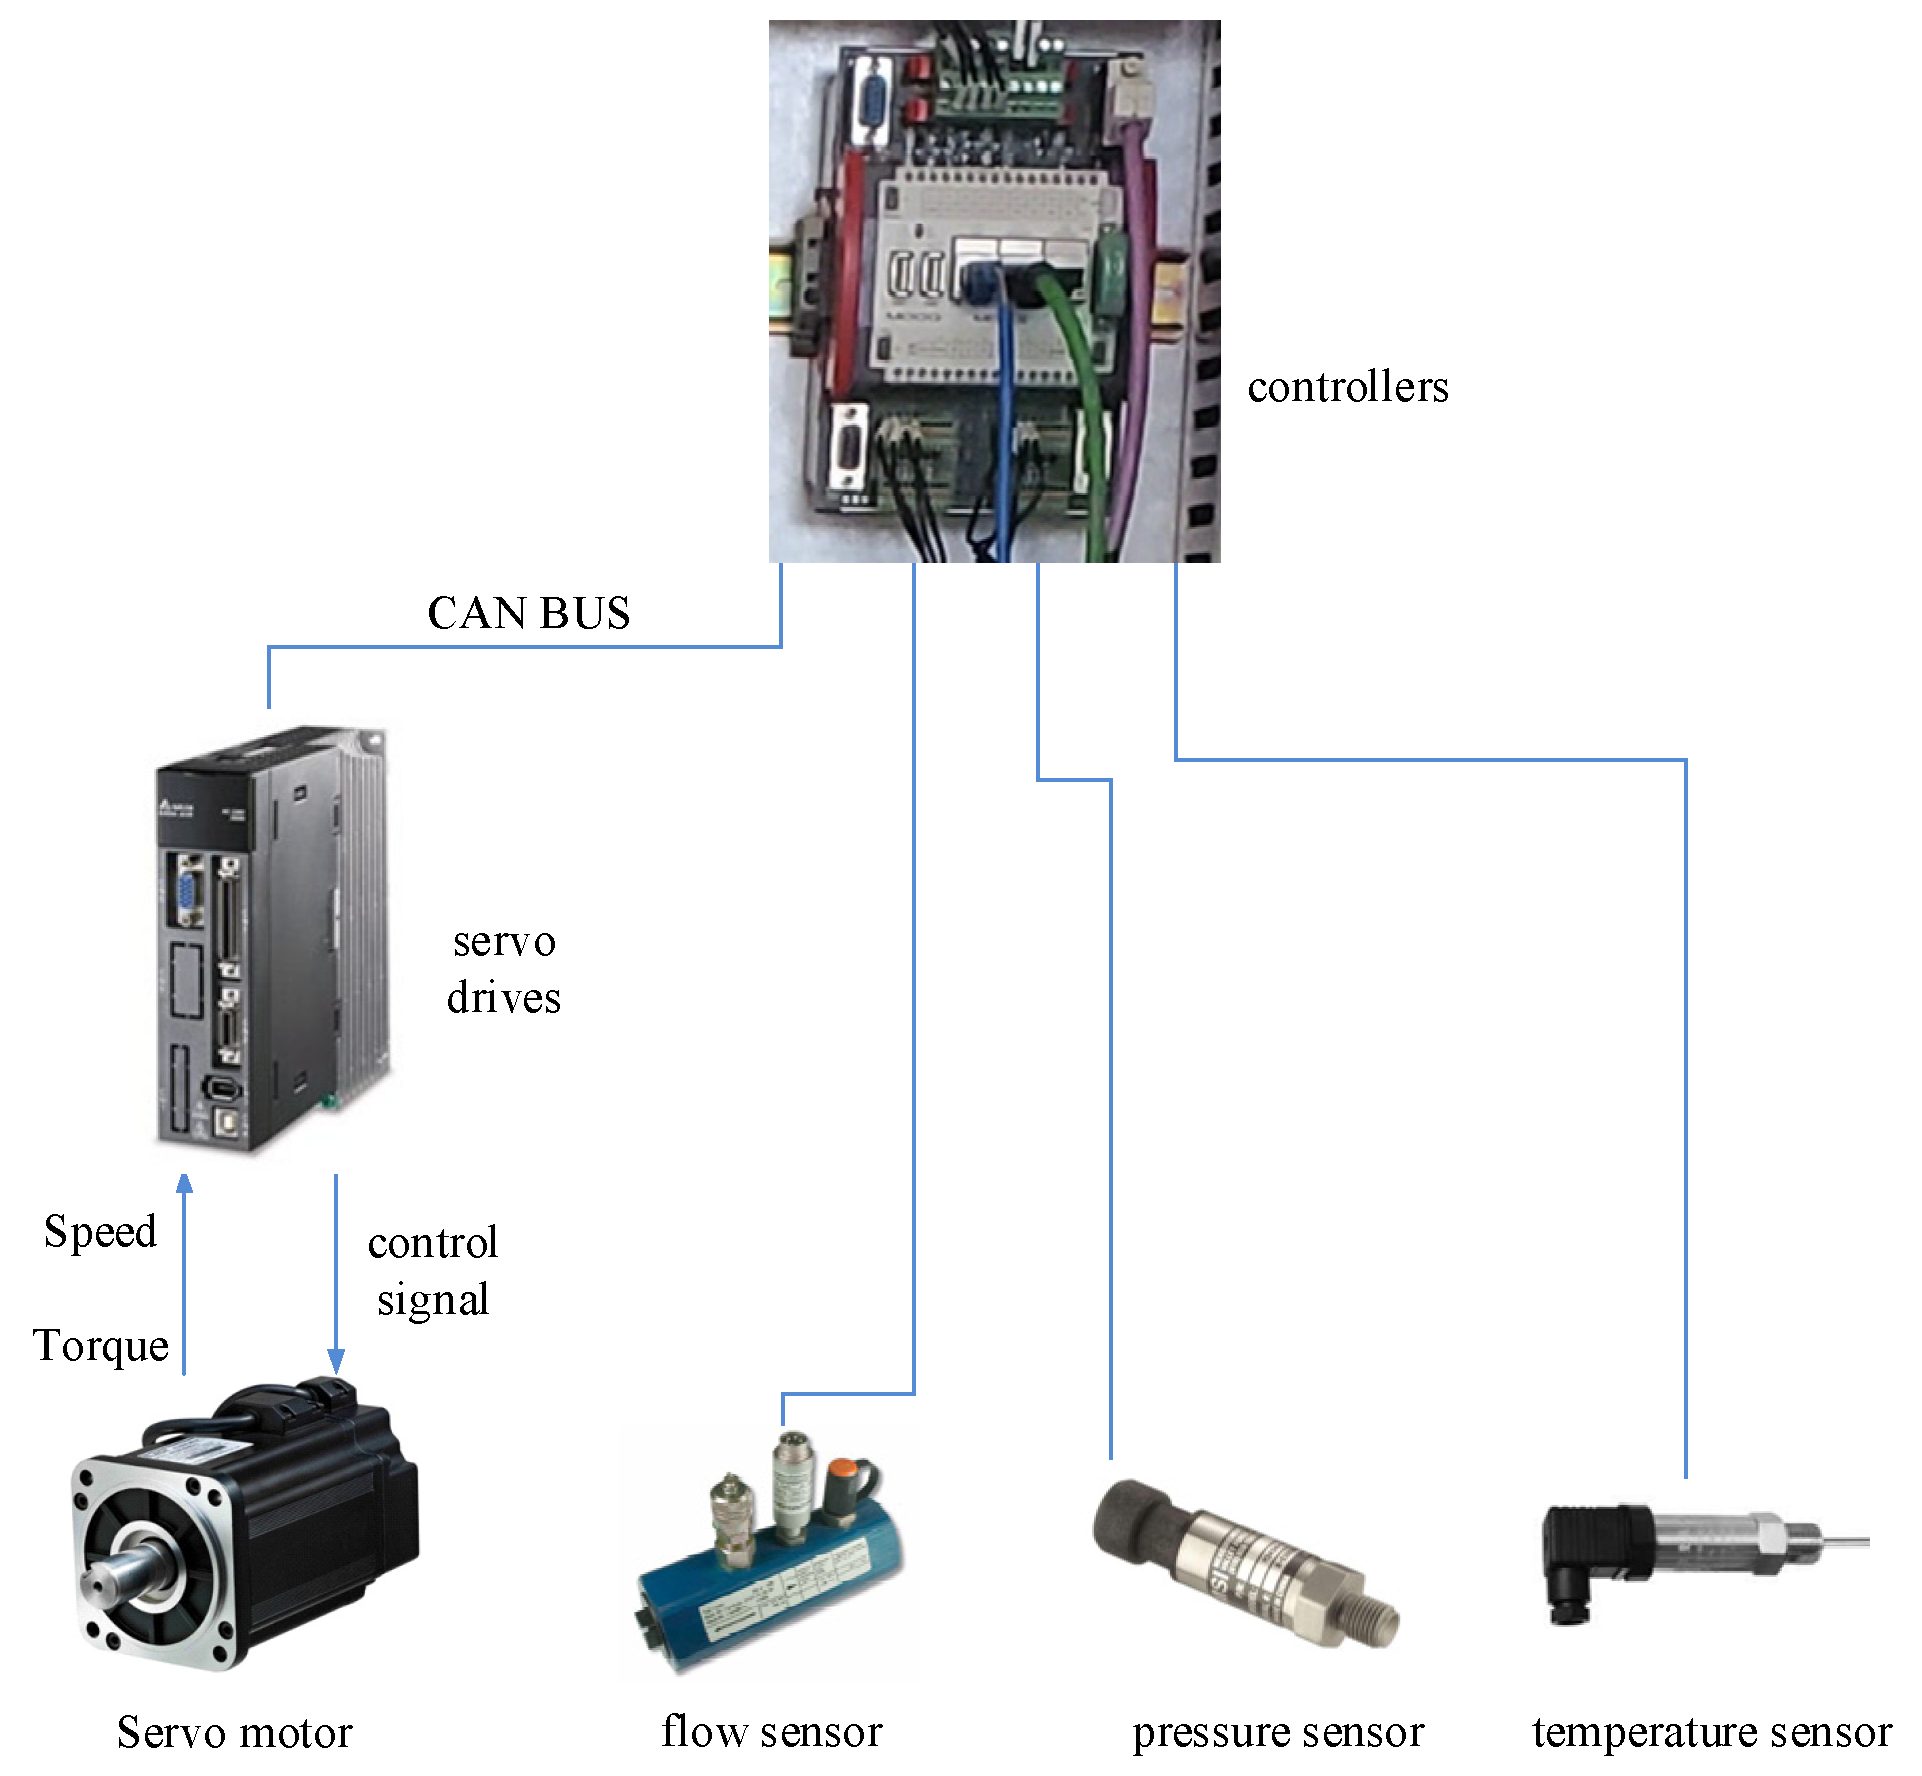
In this study, the pressure and flow of the hydraulic system are collected by pressure sensors and flow sensors, and the collected information is processed by the controller. Information such as the speed and torque of the servo motor is collected by the built-in encoder of the motor and then uploaded to the drive. After the drive is processed, it is uploaded to the controller for monitoring. The drive and the axis controller communicate through the CAN bus. A schematic diagram of the electrical structure is shown in
Figure 4 below.
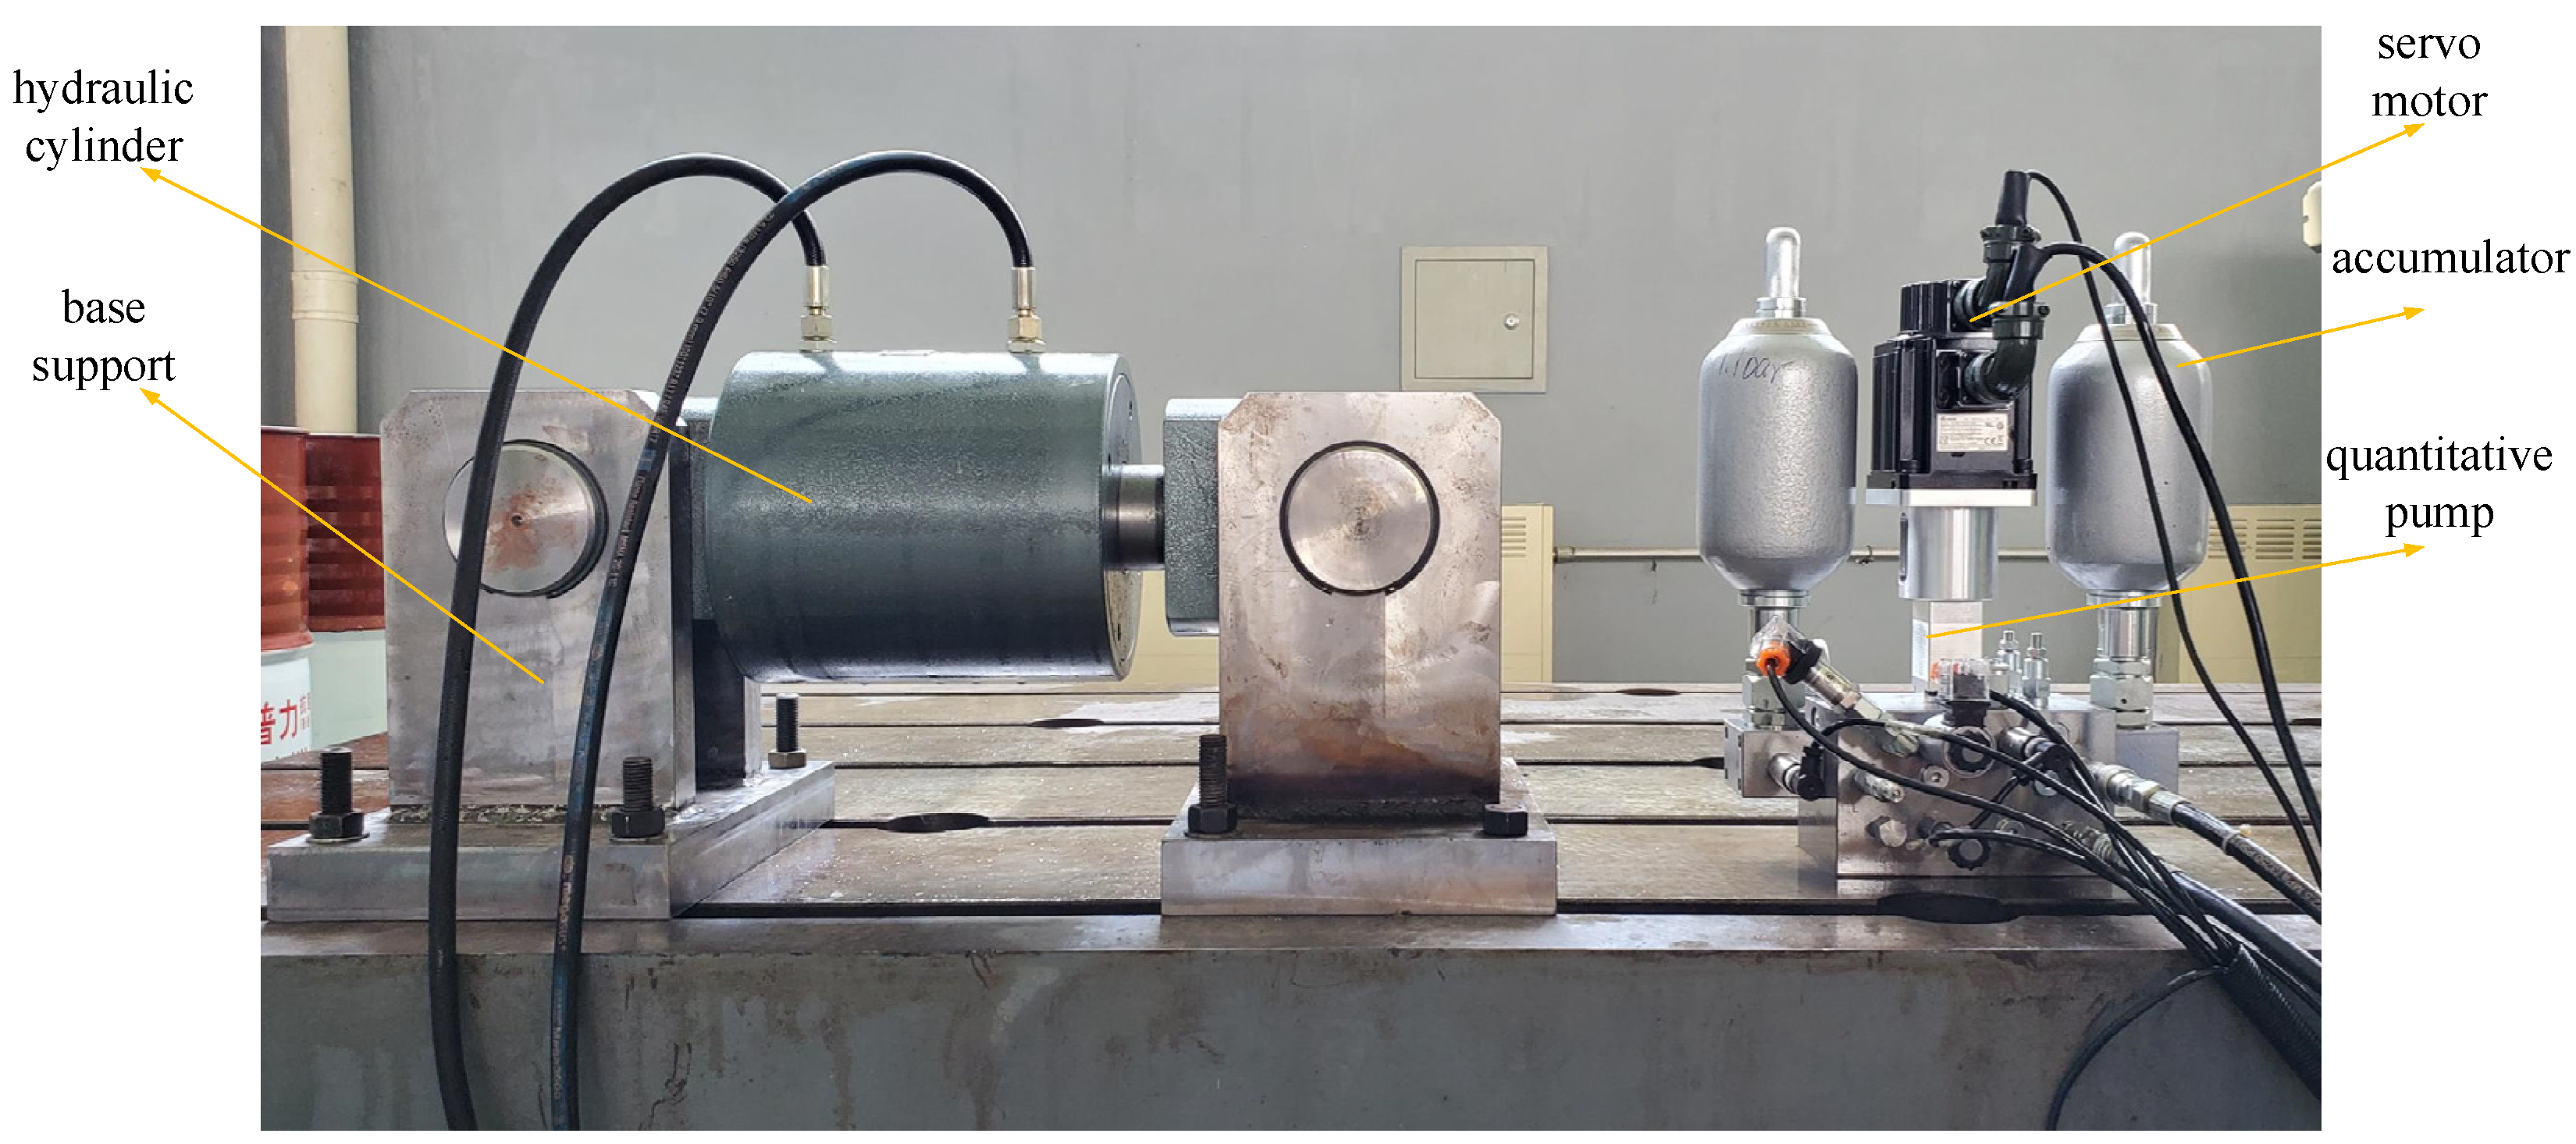
The hydraulic system integrates the SM, the positive displacement pump, the accumulator, and the hydraulic valve through the functional valve block. The loading of the oil cylinder is realized by the base support, and the hydraulic cylinder and the functional valve block are connected by hydraulic pipelines. The hydraulic test platform is shown in
Figure 5 below.
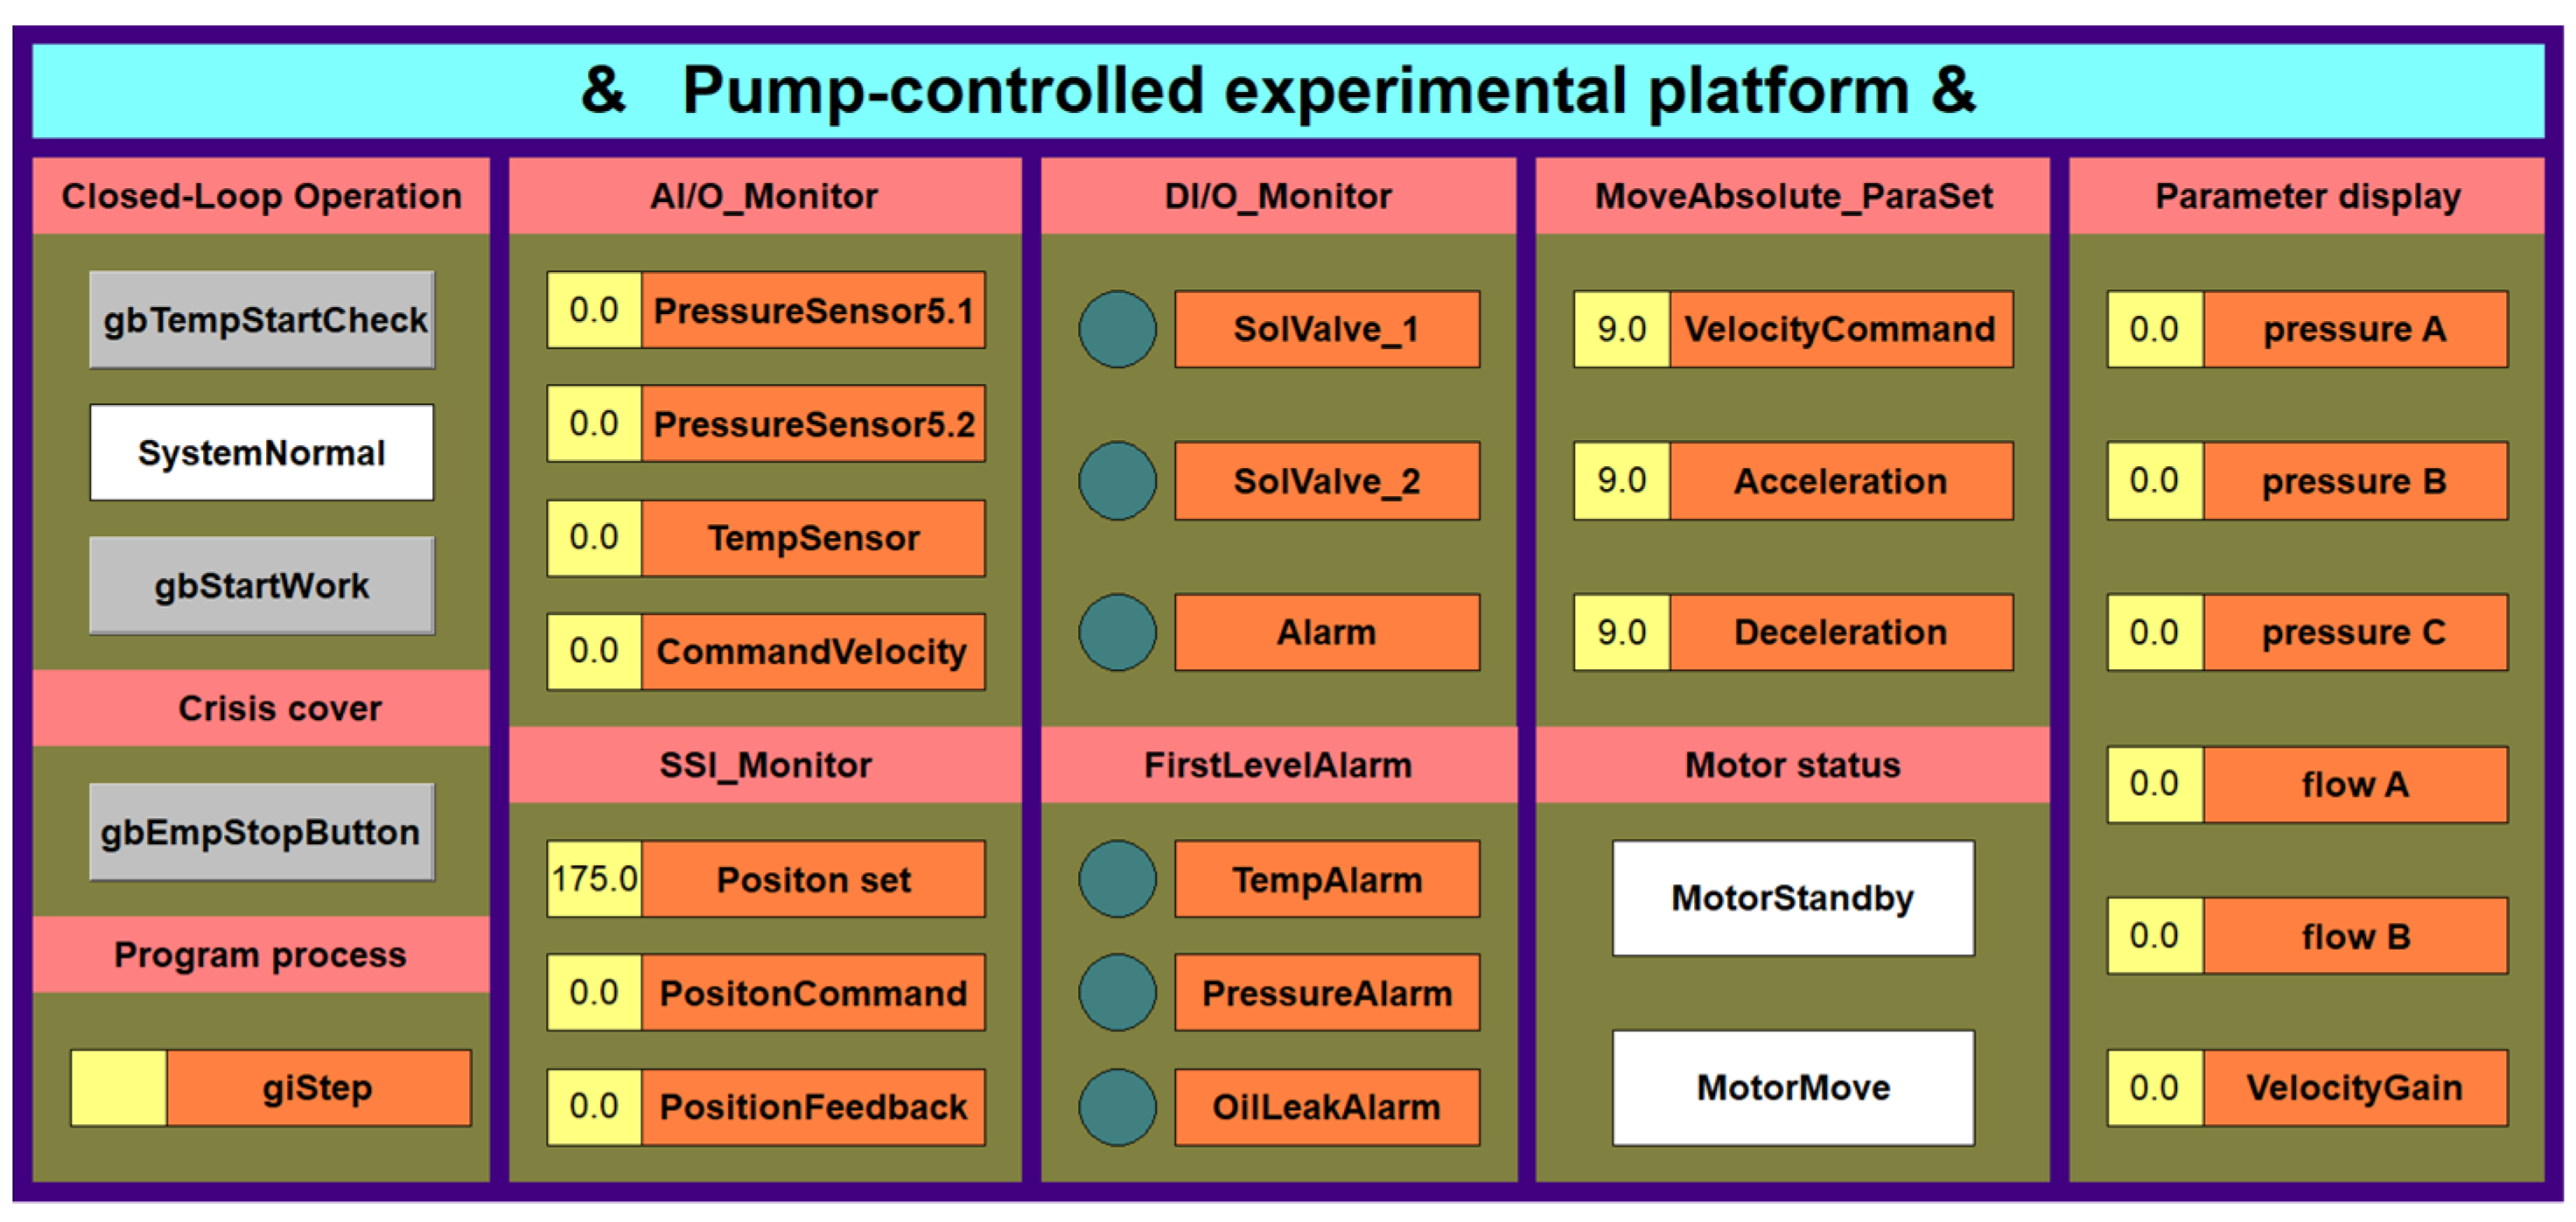
The axis controller software is used to compile the PCS experiment platform monitoring and acquisition data interface based on the controlled development system, as shown in
Figure 6.
The working parameters of the experimental platform are shown in
Table 2:
5.2. Experimental Data Analysis
5.2.1. Dead Zone Output Flow Data Analysis
The dead zone of the system output flow as a non-smooth nonlinear link mainly occurs in the servo motors, the positive displacement pump, and the hydraulic cylinders. First, research on the flow characteristics of the positive displacement pump in the no-load dead zone was carried out.
When the system is under no external load and the system pressure is the outside atmospheric pressure, the pressure difference between the suction of the two ends of the pump and the discharge port is almost 0. According to formula (20), we get:
The effective flow output from the pump port is:
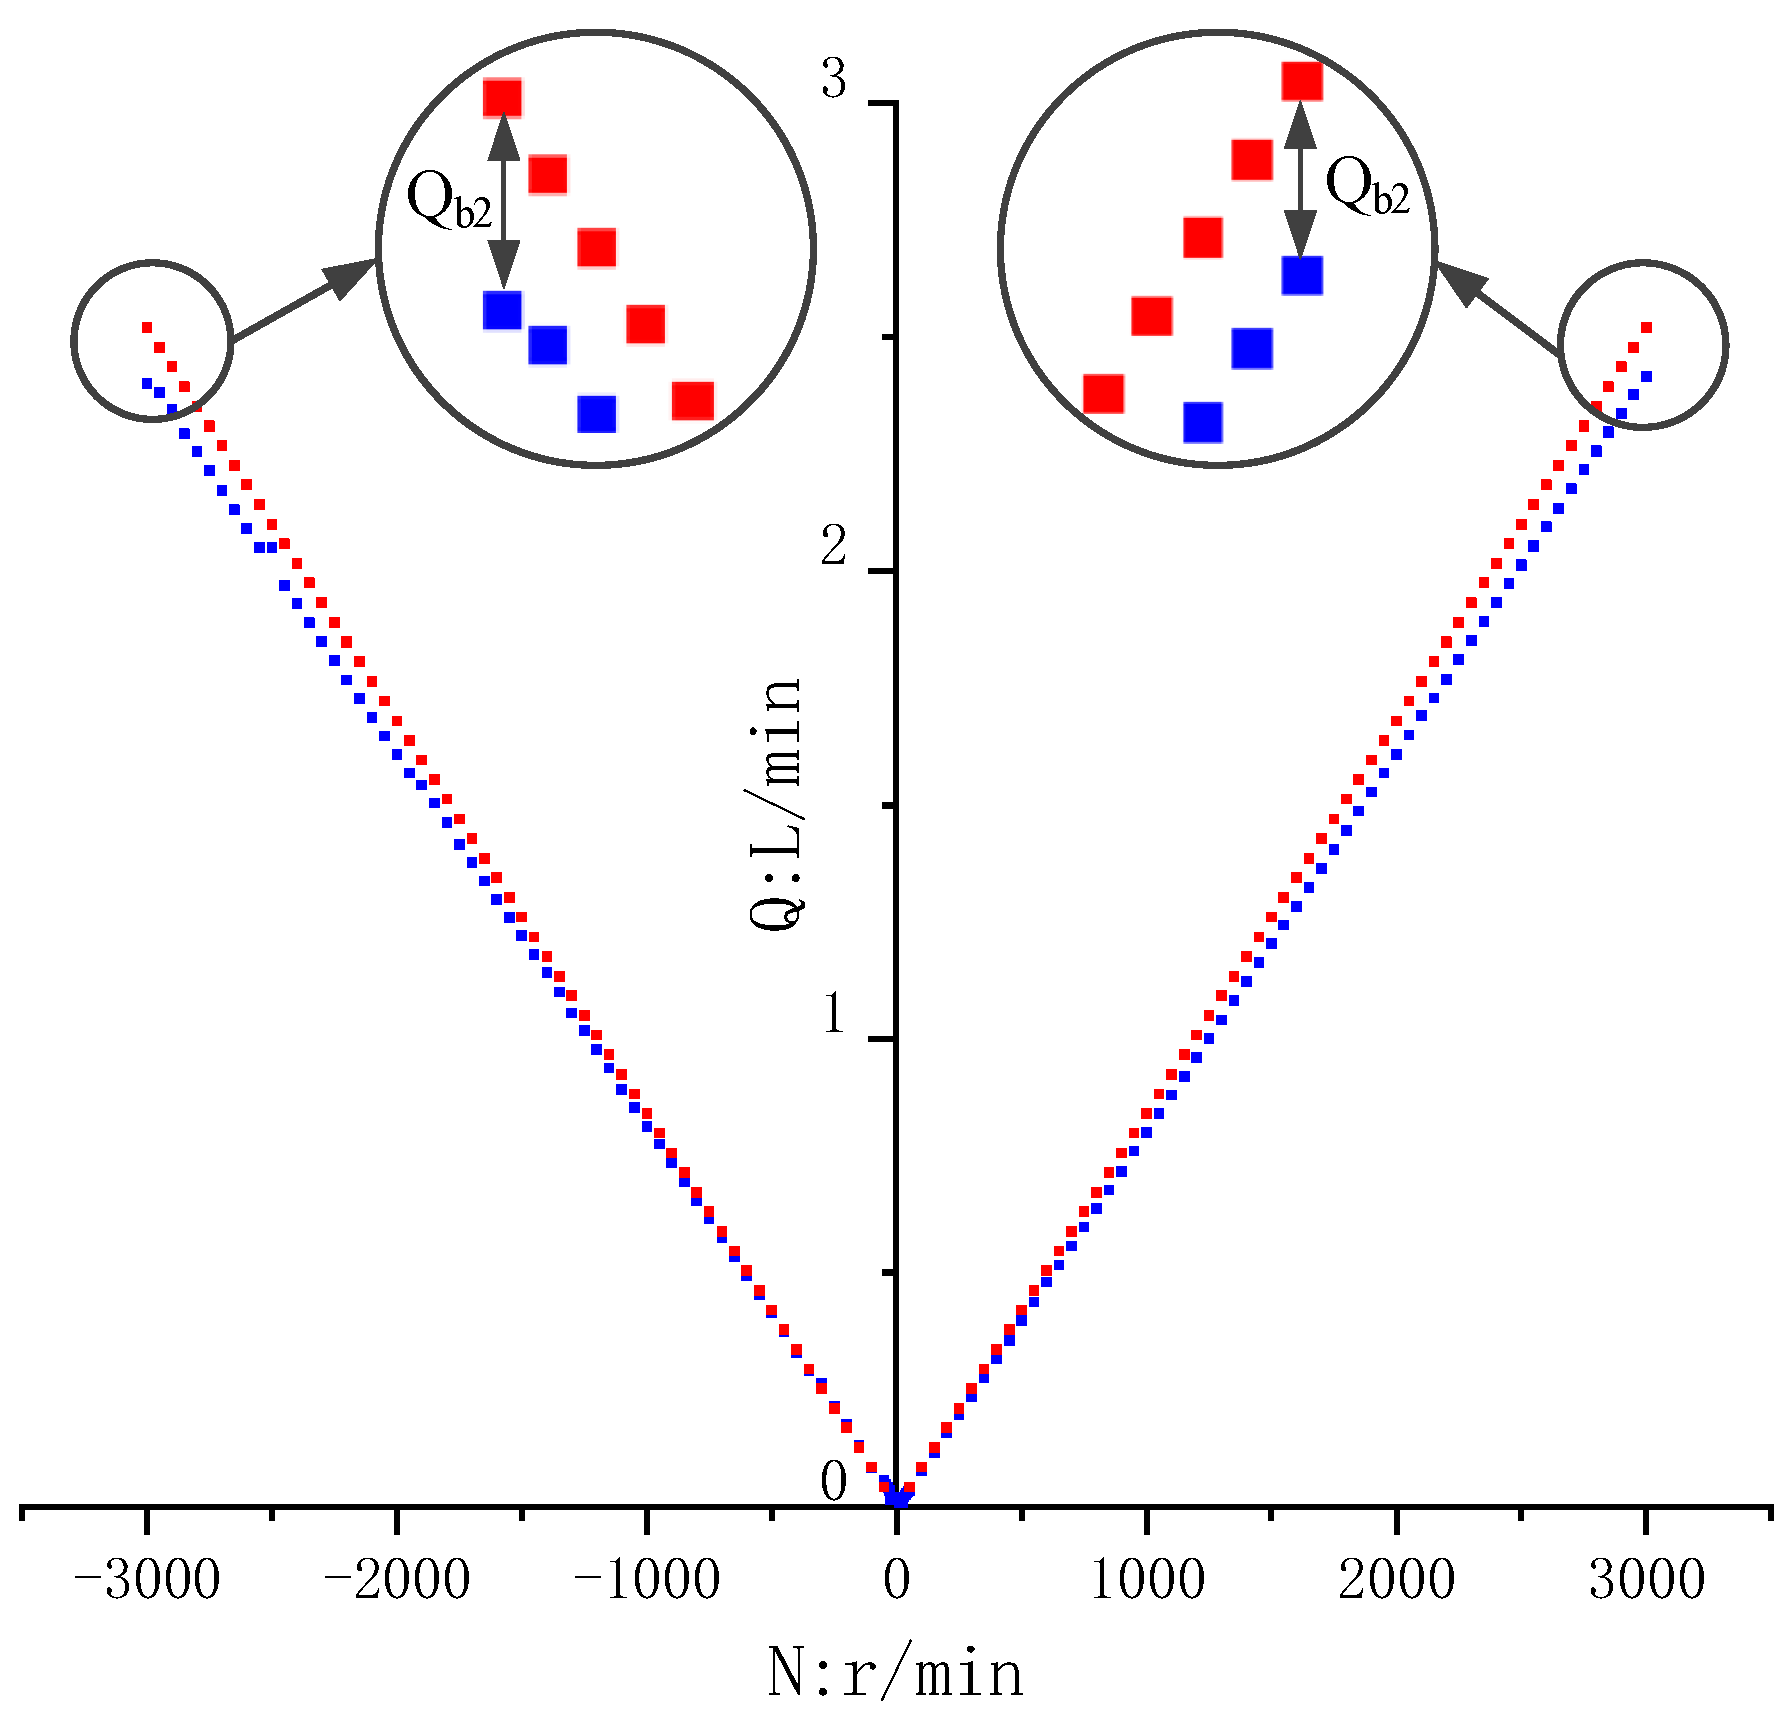
According to the above formula, the idling flow of the positive displacement pump is the theoretical output flow of the pump minus the shear flow leakage of the pump, and the idling flow output of the positive displacement pump is approximately linear. The experimental data are as shown in
Figure 7.
From the experimental results in the above figure, we concluded that when the system is running at no load, the output flow has a high degree of linearity, and the flow dead zone effect of the positive displacement pump is not obvious. The blue line in the figure is the theoretical output flow of the positive displacement pump, and the red line shows the actual output flow of the positive displacement pump. According to Equation (22), is the difference between the theoretical output flow and the actual output flow of the positive displacement pump, and the shear flow leakage of the axial piston pump has a linear relationship with the pump speed. We calibrated the formula through experimental data.
Let , and we can find .
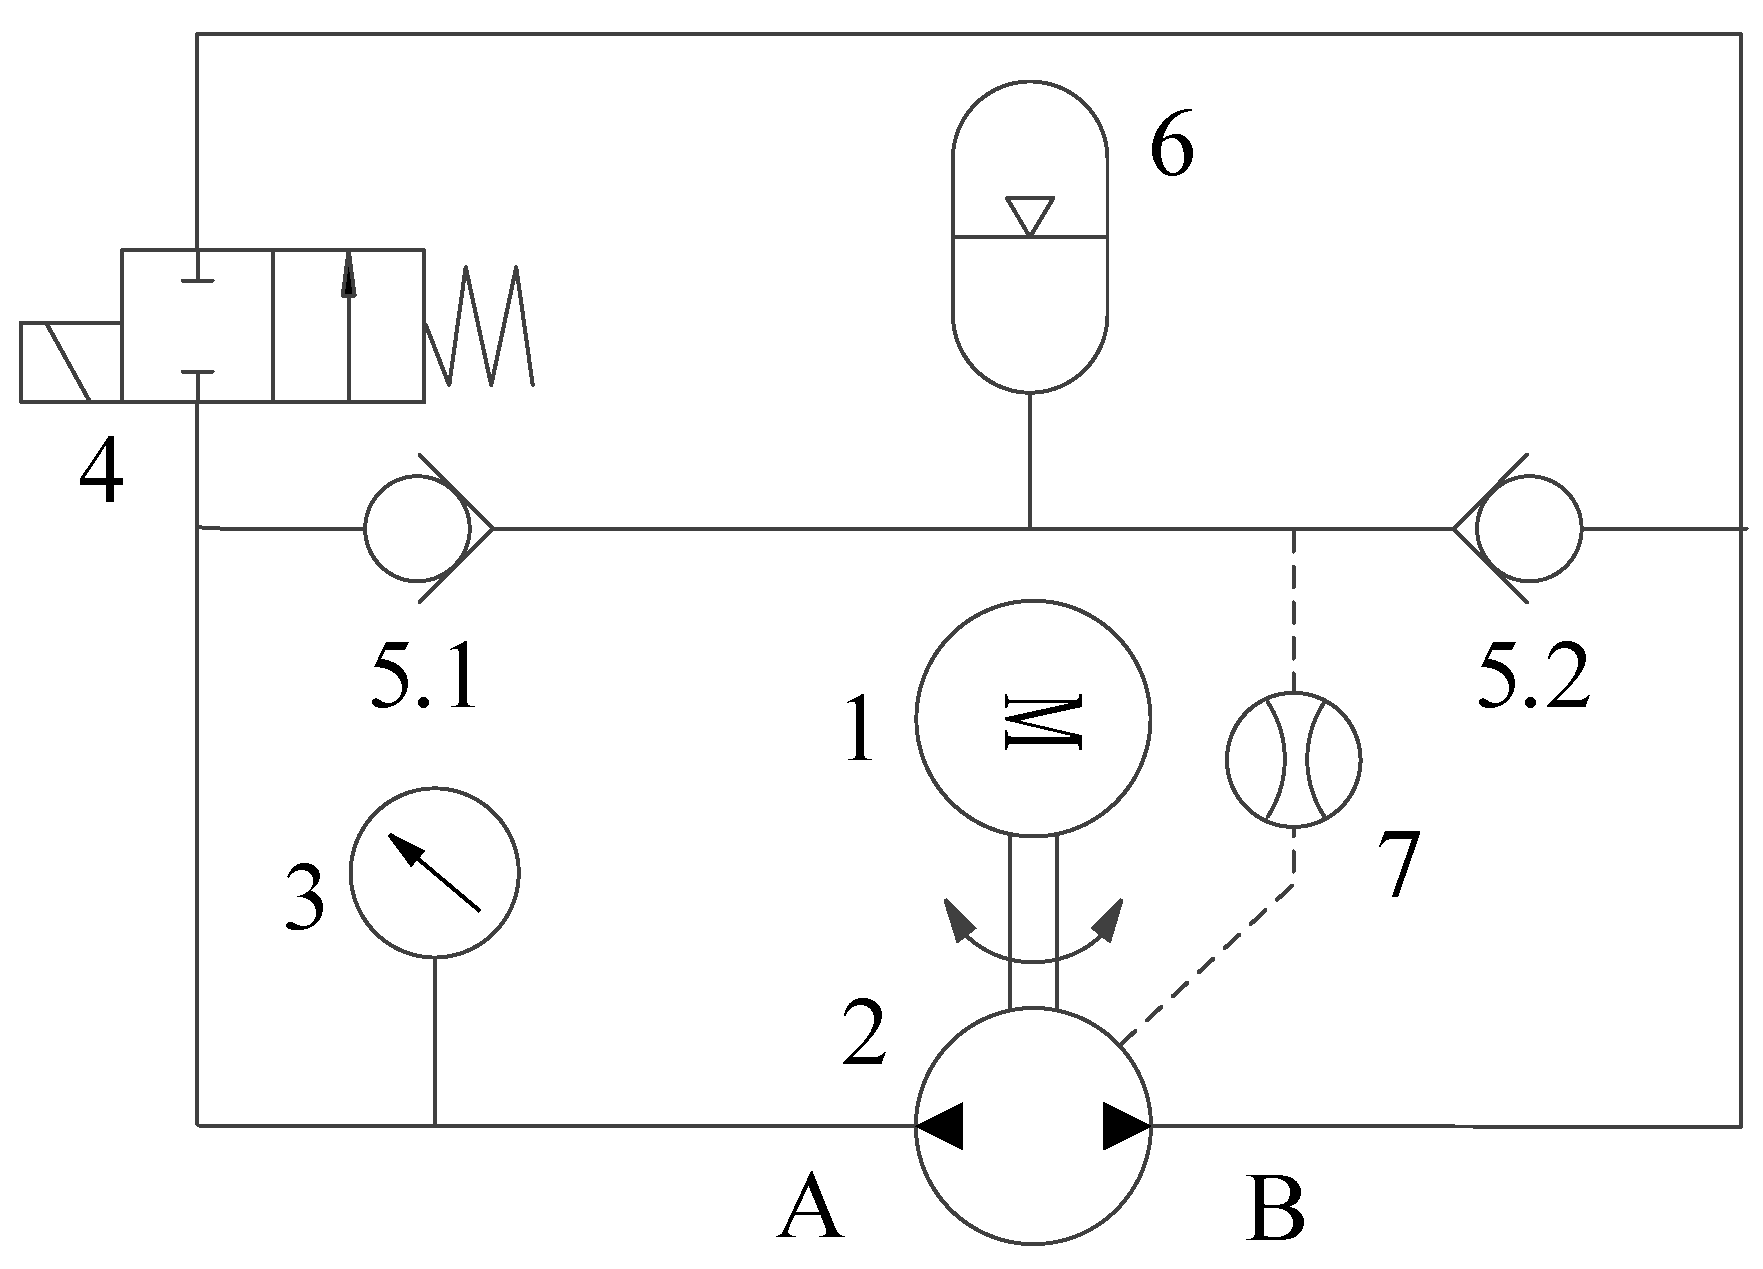
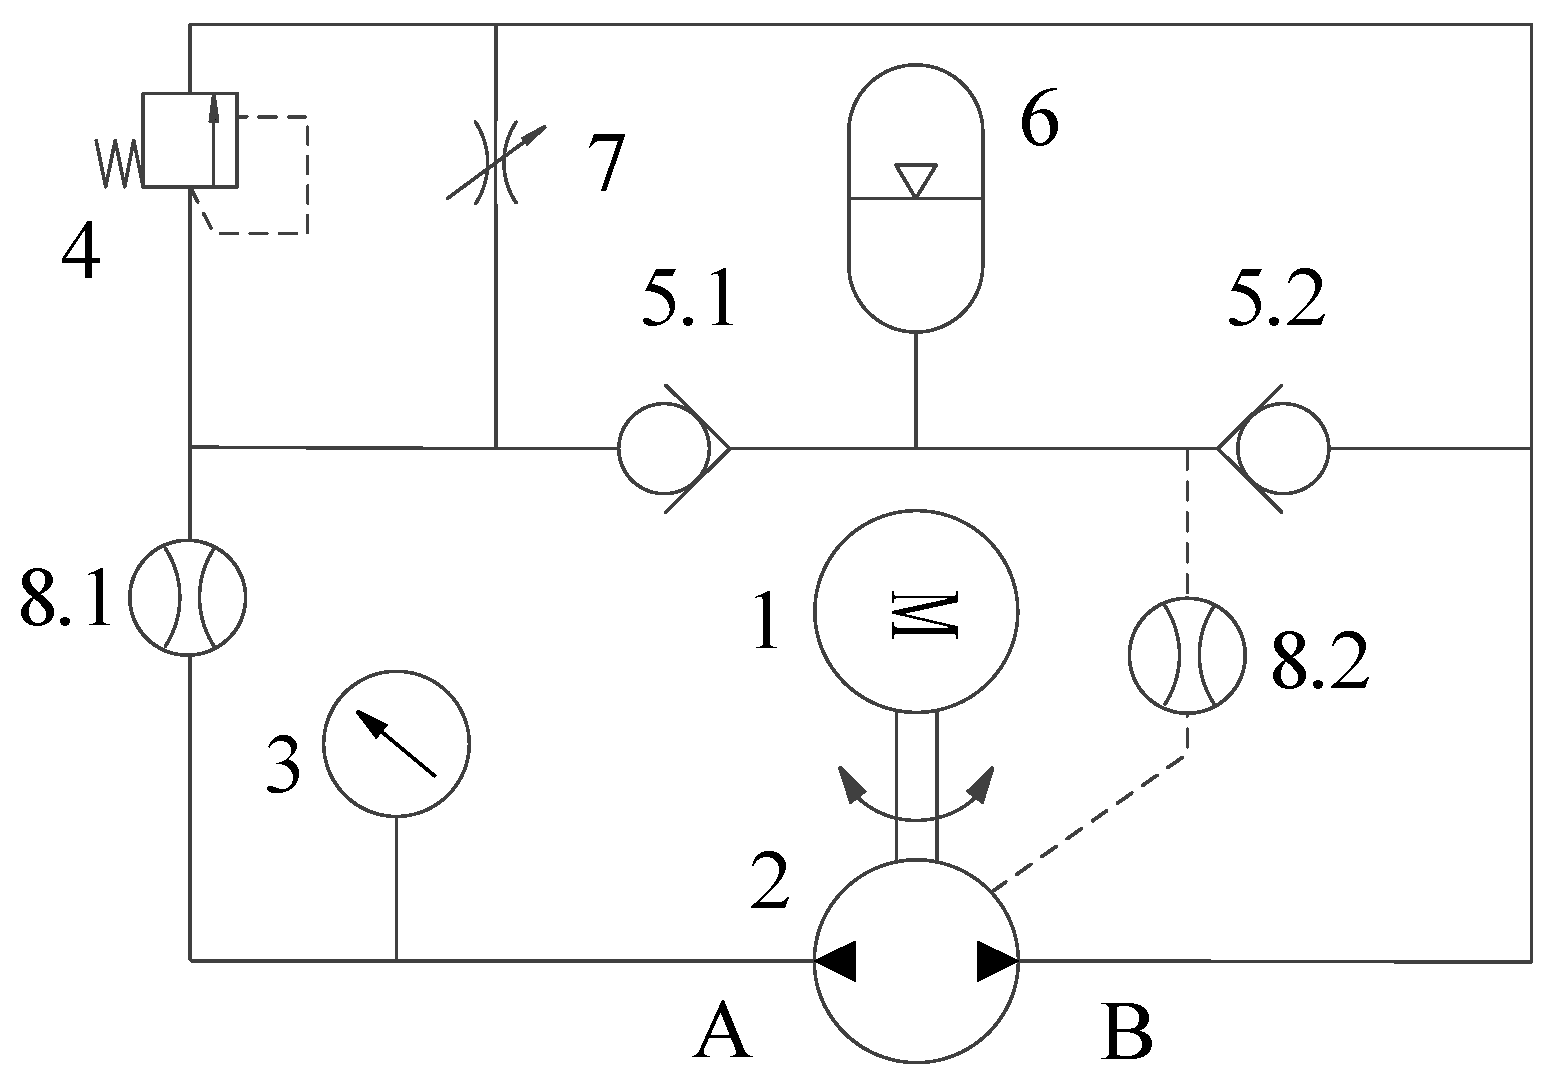
To deeply study the dead zone effect of the positive displacement pump, an experiment was carried out to establish the system pressure of the positive displacement pump under the condition of low speed. The experimental principle is as shown in
Figure 8.
The A cavity of the positive displacement pump is closed by electromagnetic directional valve 4. At this time, the speed is gradually increased, and the maximum pressure that cavity A in the positive displacement pump can reach is recorded. When the system pressure remains unchanged, the flow generated by the positive displacement pump is used to provide the positive displacement pump’s internal leakage and oil compression. The experimental results are shown in
Figure 9.
According to the internal leakage formula of the shear flow of the axial piston pump,
The leakage of the shear flow is proportional to the speed, and the shear flow has nothing to do with the pressure difference between the inlet and the outlet of the positive displacement pump. The above experimental data show that the system pressure and the leakage of differential pressure flow have a linear relationship with the sum of the leakage of the compressed flow. However, if you want to study the leakage of the differential pressure flow, you cannot bypass the compression of the oil, because as long as there is pressure, the rigidity of the oil will not be infinitely large, which will lead to the compression of the oil. However, it is too difficult to decouple the compressed flow and the differential pressure flow, so we redefine a new dead zone flow function,
, the formula of which is as follows.
where
and where
where
is the sum of the compression flow and the differential pressure flow leakage,
is the differential pressure flow leakage,
is the compression leakage,
is the shear flow leakage, and
is the positive displacement pump speed.
5.2.2. Analysis of Output Flow Data in the Load Zone and Saturation Zone
To study the speed fluctuation of the SM under different load conditions, the following experiments were carried out. The experimental principle is as shown in
Figure 10.
According to the motion equation
of the SM, we concluded that, when the moment of inertia of the motor is determined, the difference between the electromagnetic torque and the resistance torque generated by the total resistance determines the acceleration capability of the SM. Now, we define a new function
to describe the servo acceleration capacity of the motor:
When the value is larger, this indicates that the SM torque reserve is sufficient, and the acceleration ability of the SM is stronger. When there is a small range of speed fluctuation, the correction ability of the SM is also stronger, and thus we call the torque reserve rate.
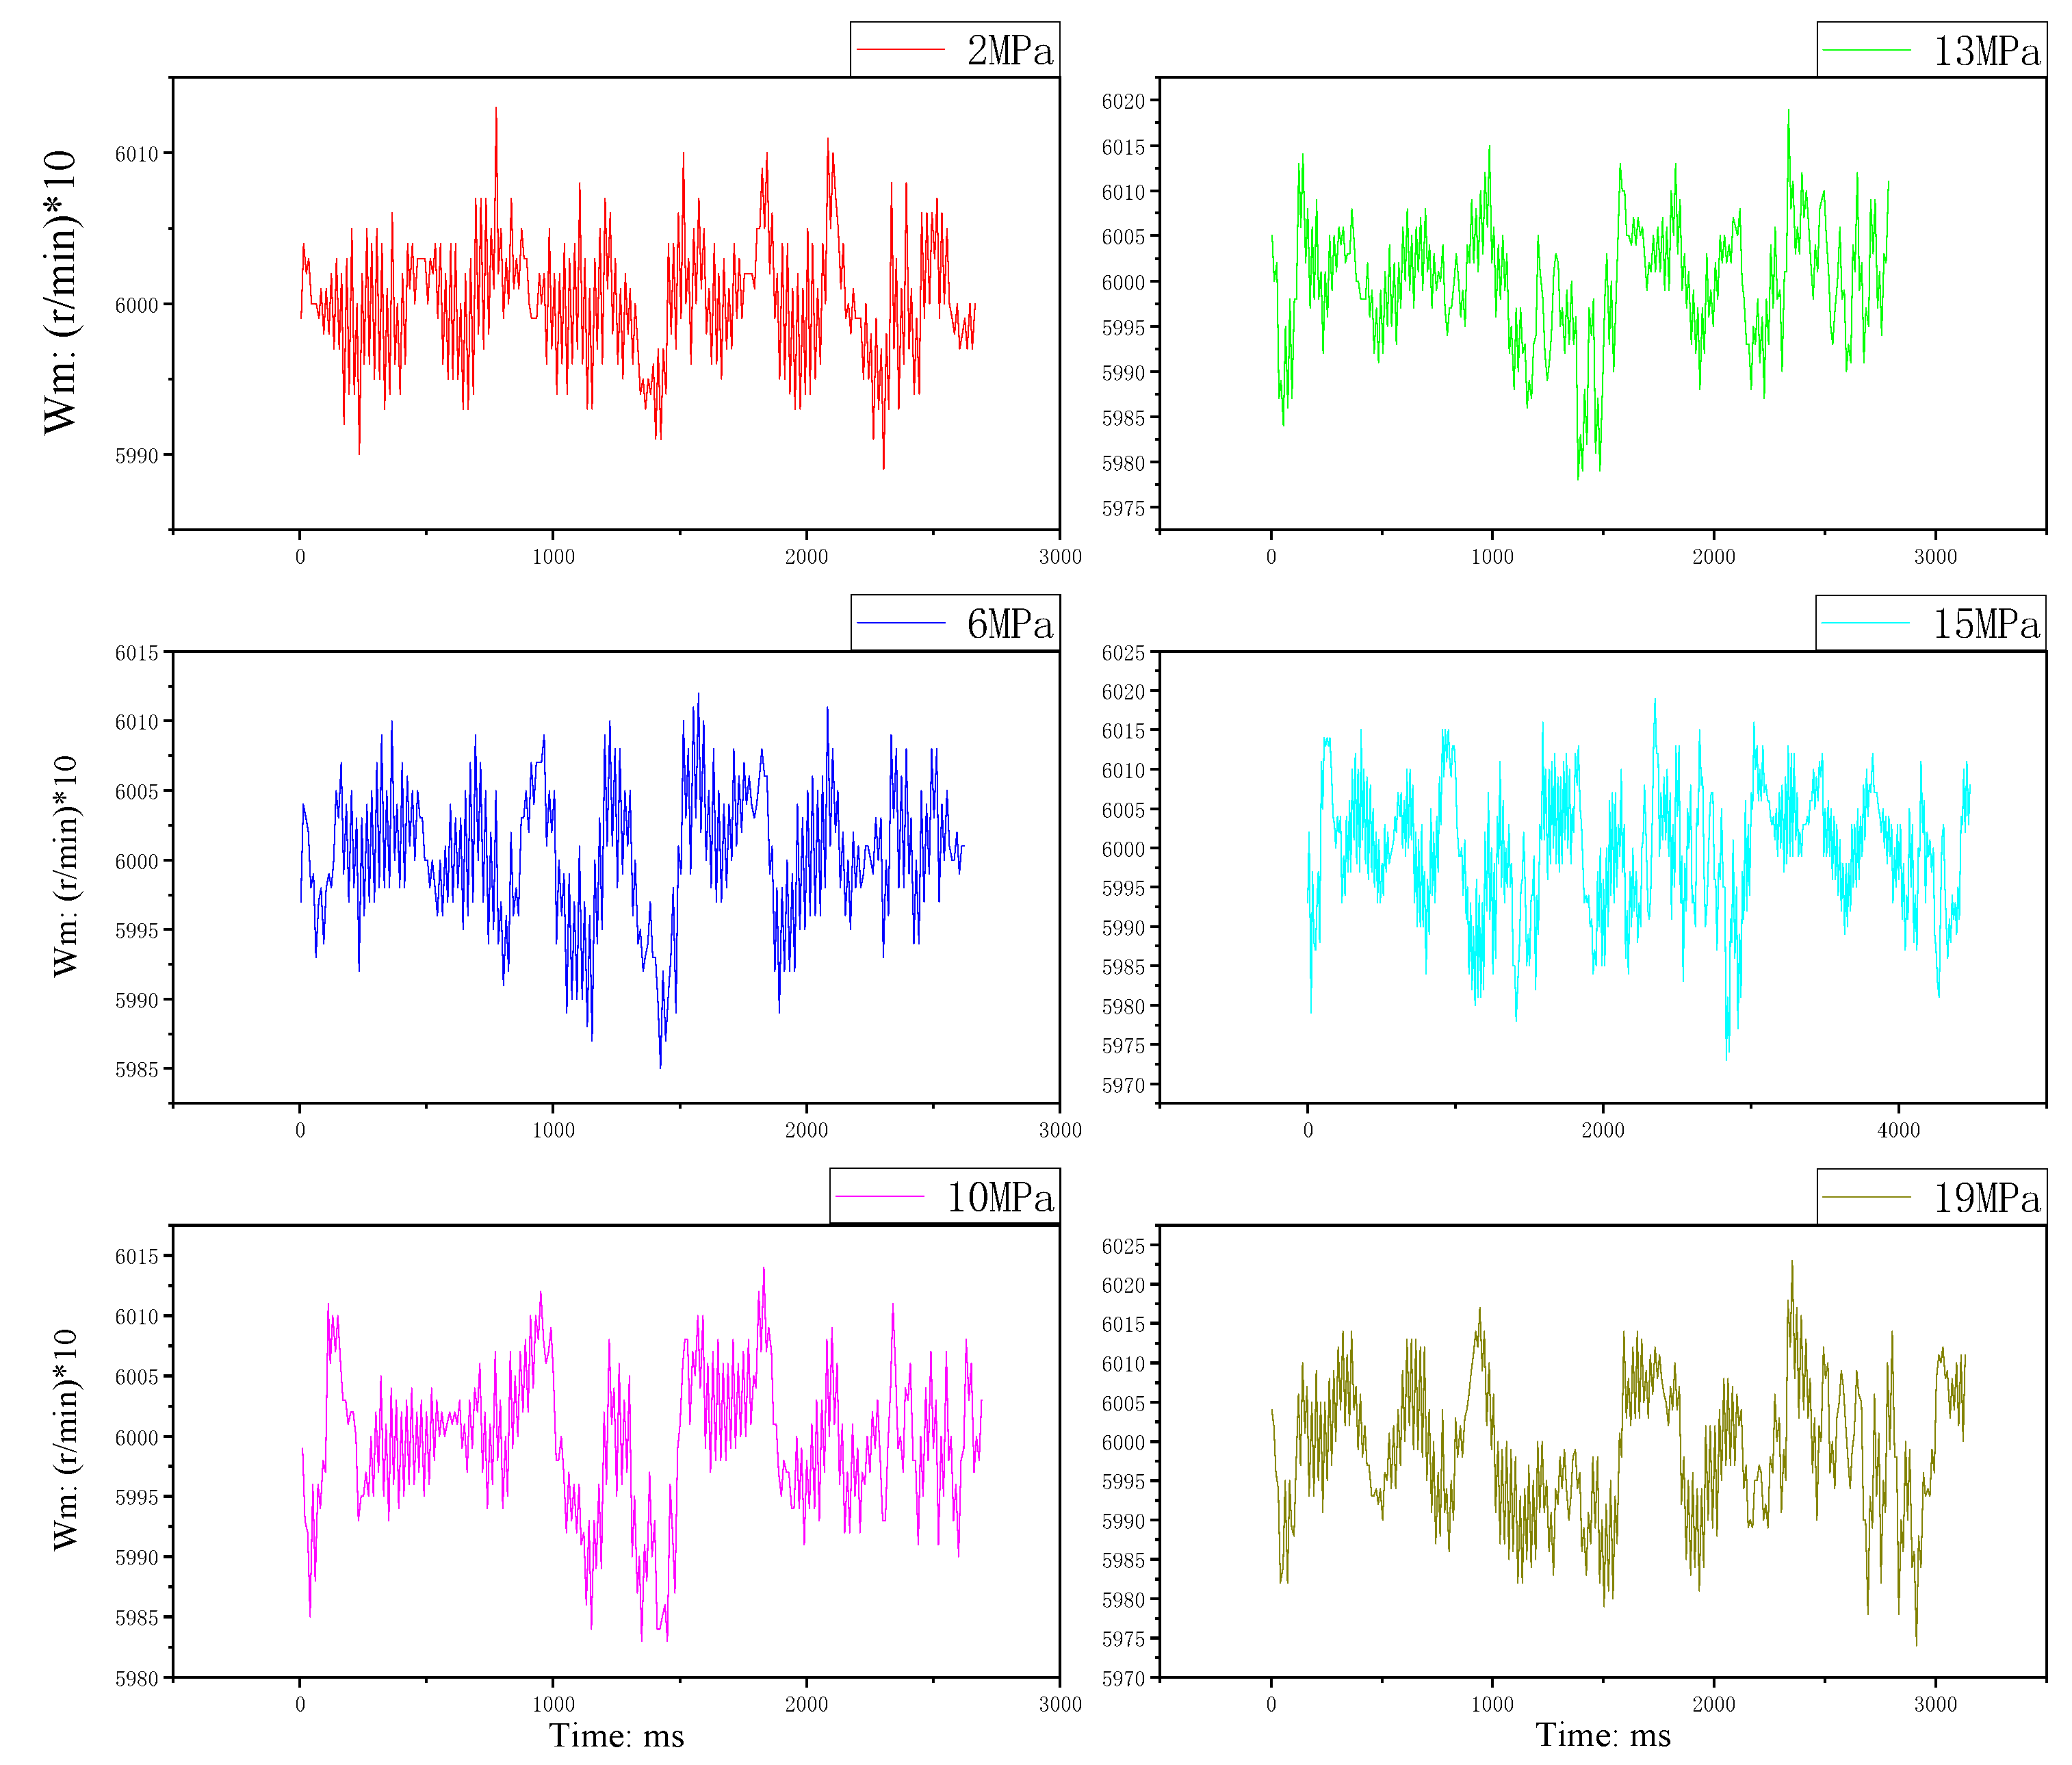
From the experimental data in
Figure 11, it can be seen that, when the system pressure increases, the amplitude of the SM speed fluctuation becomes greater. Through the above figure, only the qualitative relationship between the load torque change and the speed fluctuation can be obtained, so we will process the speed of the SM via the standard deviation, and the experimental data are processed as follows:
According to the data in the speed–pressure–standard
Table 3, we can approximate that, as the torque reserve rate decreases, the speed fluctuation of the SM becomes more severe, and with the increase in the load, the torque reserve rate and the degree of speed fluctuation in the servo motor are inversely proportional.
The rotation friction of the SM affects the fluctuation in the speed. The rotation friction of the SM can be represented as a Stribeck friction curve, which is shown in
Figure 12 below:
The Stribeck friction curve graph reflects the magnitude of the friction force and the conversion of dynamic and static friction under different speeds of the SM. When the internal electromagnetic torque of the SM acts on the rotor of the motor, the rotor is elastically deformed under the action of friction; when the speed of the SM increases, the increase in friction declines sharply, and the decline in the increase in friction leads to the speed of the SM increasing more severely.
The sharp increase in motor speed prompts the SM current loop to make rapid adjustments, which reduces the motor phase current and the SM output torque. When the SM output torque is less than the load torque and the friction torque in harmony, the speed of the SM is drastically reduced. Such periodic non-attenuation of vibration makes the SM speed unstable, and this irregular vibration increases with the increase in the speed in a certain interval; when the speed exceeds a certain value, the increase in friction does not change significantly. This immediately causes the fluctuation in the speed to no longer increase significantly.
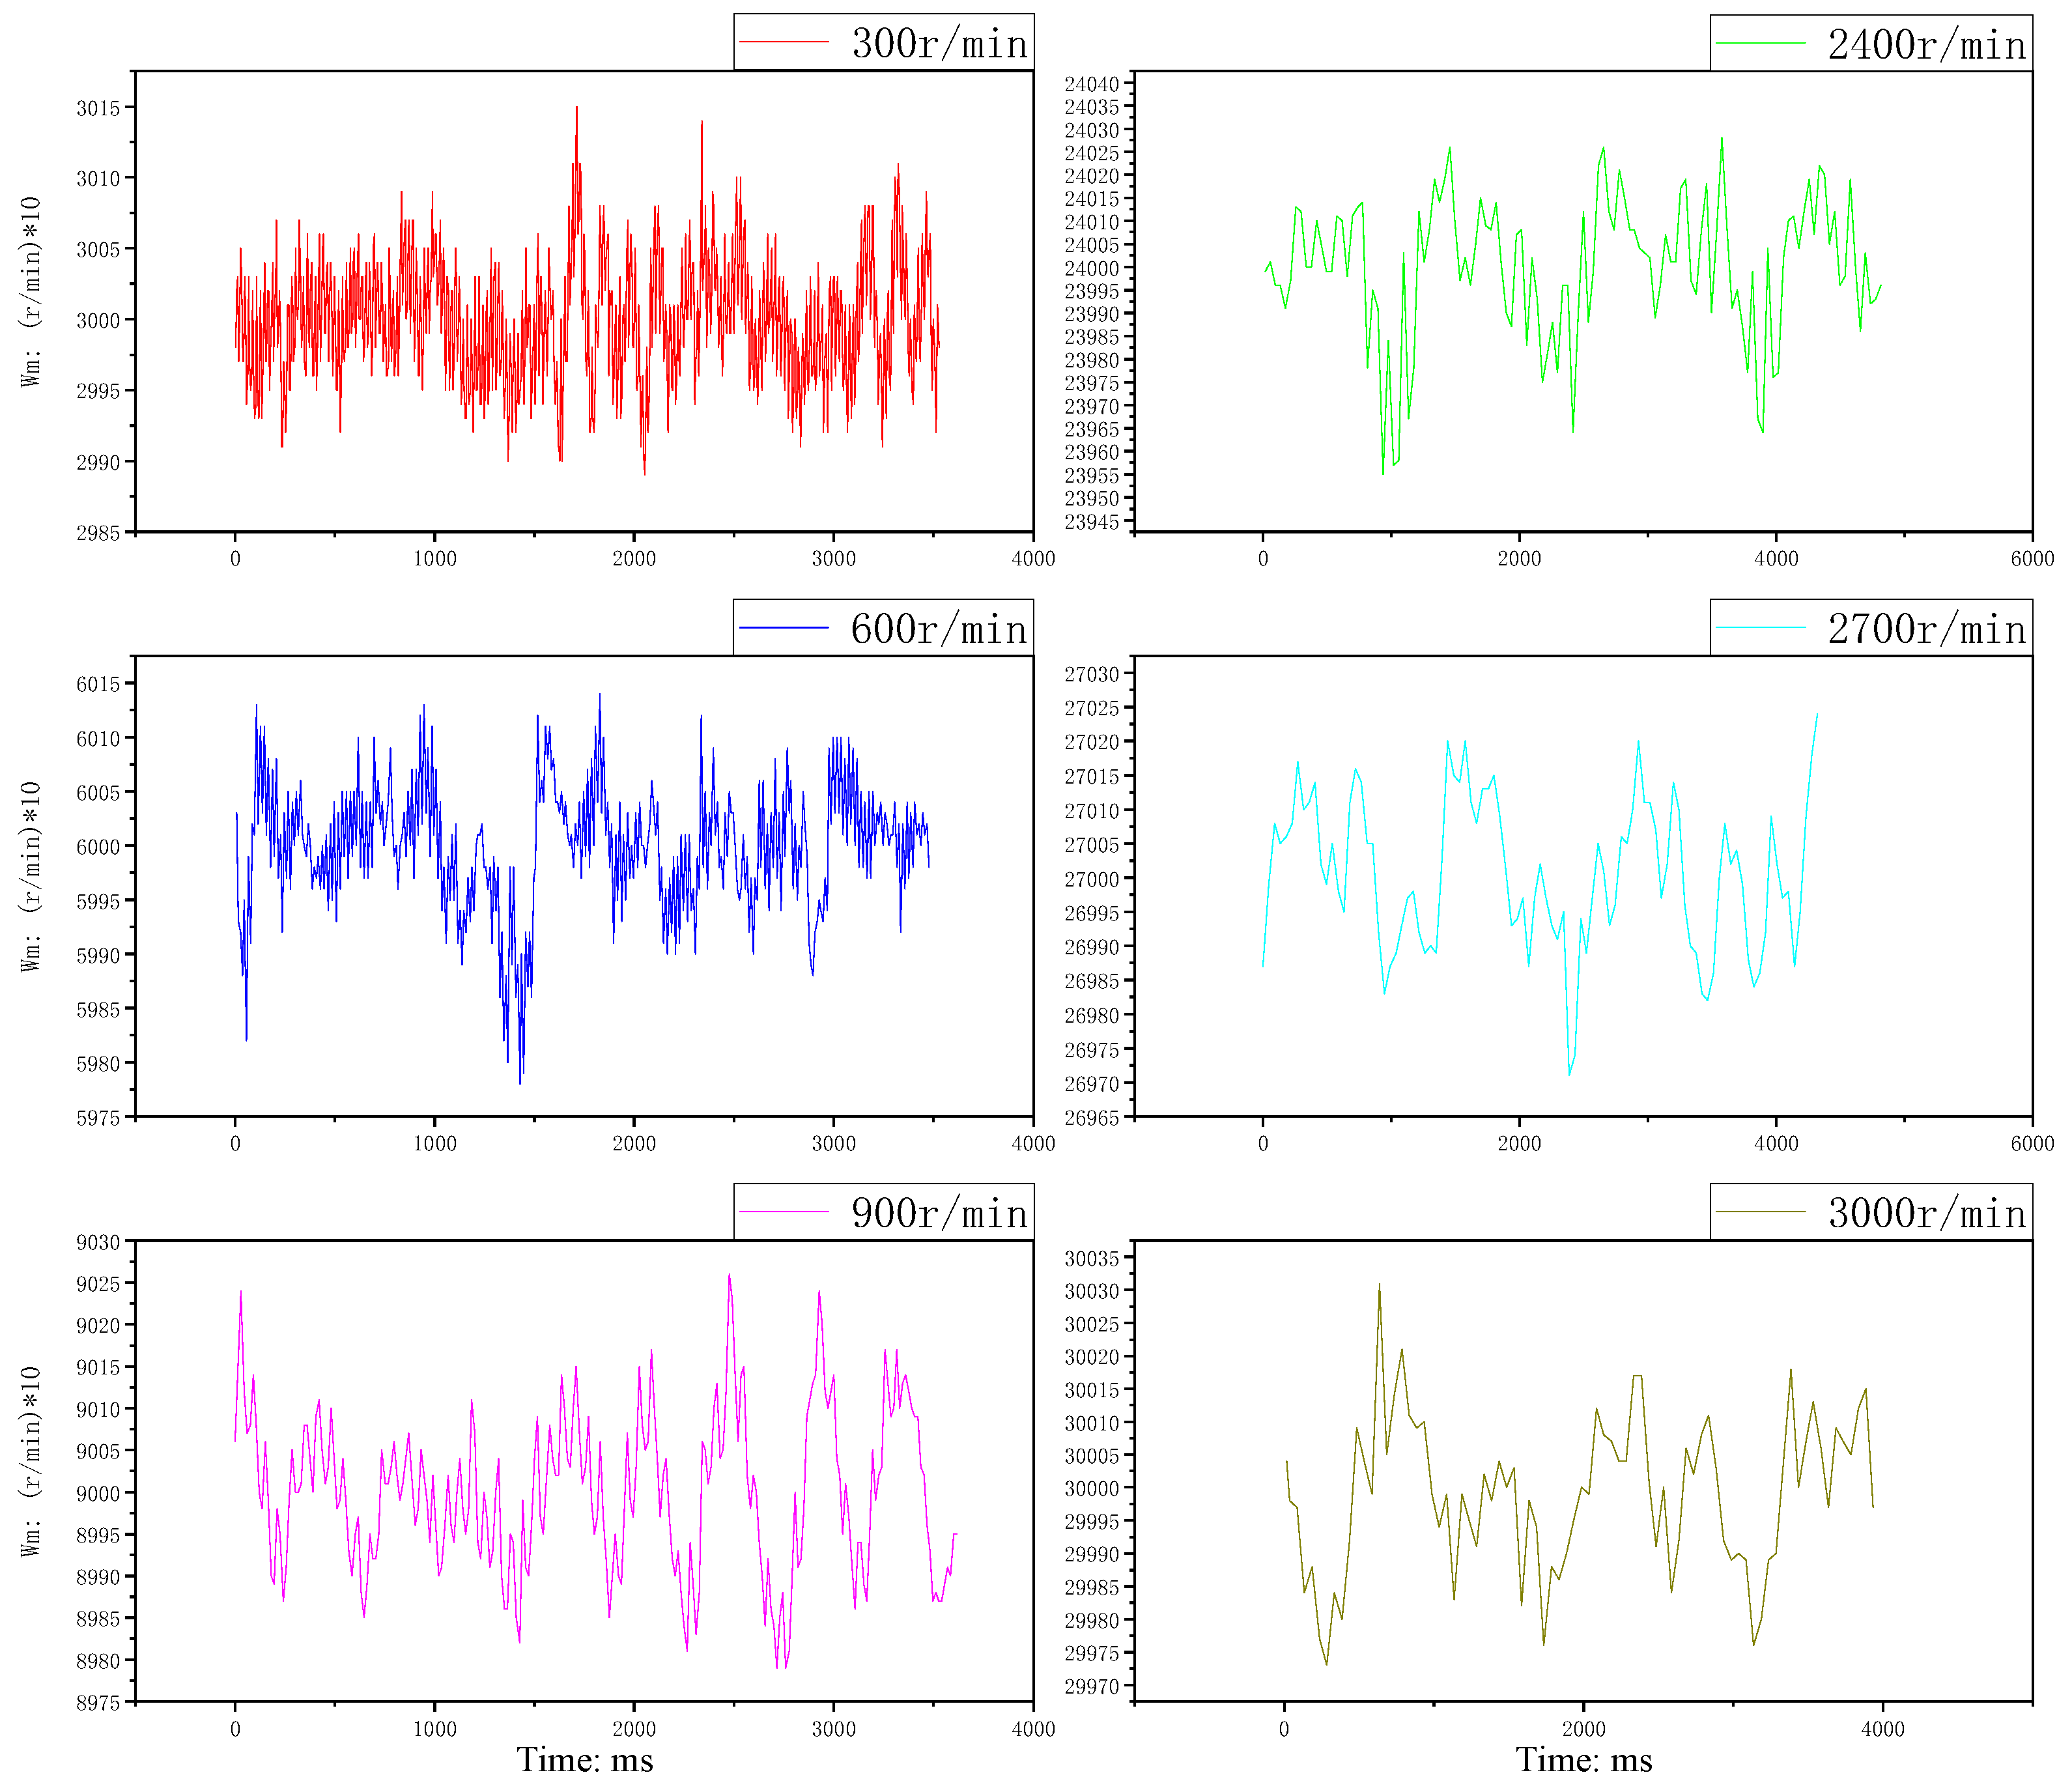
To verify the relationship between the internal friction of the SM and the speed fluctuation of the SM, an experiment on the speed fluctuation under the same load and different speeds was carried out. The experimental data are shown in
Figure 13. To more intuitively reflect the rotational speed under different speed conditions, the standard deviation of the data was used, as shown in
Table 4 below:
According to the above experimental data, we concluded that, when the speed of the SM gradually increased from 300 r/min, the fluctuation in the speed of the SM gradually increased, reflecting the gradual increase in the speed fluctuation of the SM. When the speed reached 1500 r/min, the fluctuation in the speed of the SM remained unchanged, reflecting that the degree of fluctuation in the speed of the SM remained unchanged.
6. Conclusions
Aiming at the nonlinear problem of the output flow of the PCS, we propose the concept of system output flow zoning, which divides the system output flow into a flow output dead zone, a flow output load zone, and a flow output saturation zone. According to the study of the nonlinear characteristics of the SM, the positive displacement pump, and other subsystems, we have obtained: ① the coupling effect of the compression flow and the differential pressure flow leakage; ② evidence that the speed fluctuation and torque reserve rate of the SM under constant speed conditions are inversely proportional; ③ evidence that, under constant load conditions, the amount of fluctuation in the rotation speed of the SM is related to the rotation friction of the SM. By analyzing the nonlinear characteristics of the subsystem, the focus is on the nonlinear characteristics of the flow dead zone and the flow load zone.
Finally, we conclude the following.
Flow dead zone: The internal leakage of the positive displacement pump is a key factor affecting the size of the dead zone. In the leakage of the compression flow, shear flow, and differential pressure flow, when the system is running with no load, the system flow dead zone is mainly affected by the leakage of the shear flow, and, when the system is running under a load, the dead zone of the system flow is mainly affected by the leakage of the compressed flow and the differential pressure flow.
Flow load area: The nonlinear nature of the flow in the load area is affected by the coupling effect of the torque reserve rate of the SM, the rotation friction of the SM, and the leakage in the positive displacement pump.
The research results of this paper will lay a theoretical and technical foundation for application in engineering and the promotion of electro-hydraulic servo pump control technology.


