Abstract
Oxygen plasma micro-nanostructured poly(methyl methacrylate) (PMMA) slides were modified through silver microparticle deposition to create microarray substrates that enhance the emitted fluorescence intensity. Silver deposition relied on a commercially available reagent and was completed in two 30-min incubation cycles of the substrate with the reagent. The fluorescence enhancement achieved using these substrates over flat PMMA slides was determined through the development of a microarray for the multiplexed detection of four mycotoxins, aflatoxin B1, ochratoxin A, fumonisin B1, and deoxynivalenol. It was shown that the implementation of silver-plated oxygen plasma micro-nanotextured PMMA substrates increased the signals obtained for aflatoxin B1 and ochratoxin A by approximately 2.8 times, 5.6 times for deoxynivalenol, and 16-times for fumonisin B1, compared to flat PMMA substrates. Most notably, this signal increase was not accompanied by a significant increase in the non-specific signal. In addition, the spot repeatability both across a single slide as well as between different slides was high, with coefficients of variation lower than 12%. The slides were also stable for at least three months, thus offering a microarray substrate with improved properties compared to standard glass slides, regarding both the absolute spot fluorescence intensity and between spots repeatability.
1. Introduction
Mycotoxins are low molecular weight compounds, produced as secondary metabolites by fungi, that contaminate agricultural products during cultivation, harvest and post-harvest procedures and can have toxic effects on the livestock and humans that consume the contaminated commodities [1]. Over 500 mycotoxins are known today and new ones are continuously being identified; however, only a few have been studied and monitored extensively [2,3]. Mycotoxins are known for their acute and chronic toxic, immunosuppressive, mutagenic, teratogenic, or even carcinogenic effects [3]. These effects have generally been studied for individual mycotoxins or classes thereof, despite the fact that several mycotoxins belonging to different classes might be found in a single product [4,5]. Amongst the various mycotoxins of concern, with regard to effects on human health, are aflatoxins, ochratoxins, fumonisins, and trichothecenes [1], and the main representatives of these classes are aflatoxin B1 (AFB1), ochratoxin A (OTA), fumonisin B1 (FB1), and deoxynivalenol (DON), respectively (Figure 1). It is, therefore, desirable in order to protect both the health of the public but also the farmers and food producers by unnecessary produce recalls, to detect multiple mycotoxins of different classes in a single run.
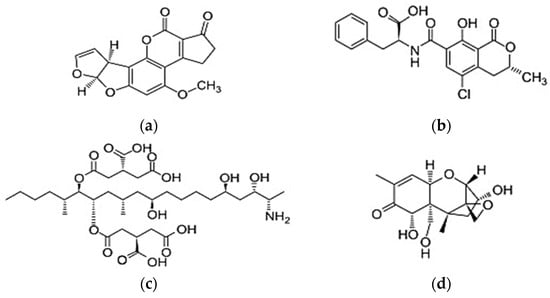
Figure 1.
Structure of the four mycotoxins detected in the current study: (a) Aflatoxin B1; (b) Ochratoxin A; (c) Fumonisin B1, and (d) Deoxynivalenol.
High performance liquid chromatography (HPLC) and gas chromatography (GC) coupled to mass spectrometry (MS) have become the methods of choice for the routine analysis of mycotoxins in food and environmental samples, due to their sensitivity and reliability [6]. However, they are costly, time-consuming, involve tedious sample preparation procedures and can be performed only by highly trained personnel. Alternatively, to provide rapid and sensitive detection in a cost-effective and easy-to-use way that can even be conducted by non-specialists, a series of so-called screening methods have been developed, including traditional immunoassays (e.g., ELISA), biosensors, and microarray-based methods. The latter have evolved into powerful tools for chemical, biological and pharmaceutical contaminants analysis since they meet the high-throughput and multiplex analysis requirements, offering the specificity and speed of traditional immunoassays in a miniaturized format [7]. The immunochemical detection of mycotoxins, due to their low molecular weight, relies mostly on competitive formats which, however, suffer from intrinsically low signal, and thus, strategies that enhance the signal obtained by the specific antibody–analyte reaction should be implemented. Moreover, although the analytical sensitivity is determined by the antibody affinity constant, the low signal could lead to low sensitivity due to the need to extent the assay duration.
The strategies for signal enhancement in a microarray rely either on the implementation of surfaces designed to promote biomolecular binding or increase the emitted signal, or on the use of a system for multiplication of the signal obtained from a single binding event [8,9,10]. Regarding the first approach, there is a trend to replace the standard two-dimensional (2D) substrates that are routinely used for microarray fabrication with 3D substrates that provide high ratios of area available for biomolecule immobilization per projected area. In this context, our group has extensively studied the effect of oxygen, fluorine and fluorocarbon plasmas on organic and Si-containing polymers in order to fabricate micro-nanostructured 3D surfaces for biomolecule immobilization [11,12,13,14,15,16,17]. The approach followed resulted in the simultaneous creation of micro-nanotopography and chemical functionality. It has been shown that 3D micro-nanostructured polymeric surfaces result in the immobilization of significantly higher amounts of proteins through physical adsorption compared to the respective flat (untreated) surfaces. In particular, it has been shown that oxygen plasma 3D micro-nanostructured polymer substrates offer—due to the increased surface area available for protein immobilization per spot—increased specific signal, low spot-to-spot signal variation, and compatibility with all commercial microarray printers and scanners [17].
As for the enhancement of the read-out signal, implementation of fluorescent labels is considered the method of choice for microarrays; however, traditional organic-dye fluorescent labels have limitations regarding the detection sensitivity that can be achieved [18]. Increased effort has therefore been dedicated to developing new labels with specific optical properties and/or enhancing the performance of already used labels. In the first direction, new fluorescent labels such as quantum dots have been introduced, while in the other direction, a variety of metallic nanoparticles—predominantly noble ones, such as gold and silver—have been evaluated for their fluorescence enhancing performance, in the context of the so-called metal-enhanced fluorescence (MEF) [19]. MEF is attributed to the localized surface plasmon resonance of metallic nanostructures, which results in an enhanced electromagnetic field, when excited with photons [19]. MEF is applied in microarray technology following mainly two approaches. The first one, and most usually implemented, is through conjugation of the metal nanoparticles nearby to the fluorescent dye [20,21,22]. This approach, however, leads to relatively high non-specific binding signals due to the non-specific adsorption of fluorescent metal nanoparticle probes. The second approach to enhance fluorescence signal, and thus the detection sensitivity, is through the creation of metal nanostructures directly onto the substrates, thus enabling the microarray substrate surface to play an active role in signal amplification. For example, a gold-based 2D plasmonic substrate has been reported for the sensitive detection of carcinoembryonic antigen [23], another gold 2D plasmonic substrate has been employed for multiplexed protein detection with microarrays demonstrating high sensitivity and broad dynamic range [24], and a sensitive chip sensor for detection of OTA in food and drinks based on silver film over a nanosphere substrate has been also presented [25].
Taking all the aforementioned information into consideration, the objective of the current work was to combine—for the first time—the metal-surface enhanced fluorescence approach with the plasma 3D micro-nanostructured surfaces in order to create microarray substrates that can combine the virtues of both technologies and provide a means for the development of highly sensitive fluorescence microarrays. To achieve this, glass slides covered with film of poly(methyl methacrylate) (PMMA) were 3D micro-nanostructured in oxygen plasma and then covered with a silver film through the self-nucleation of silver ions in presence of a reducing agent. The substrates were employed for the fabrication of microarrays for the simultaneous multiplexed immunochemical detection of four mycotoxins, namely AFB1, OTA, FB1, and DON, in corn samples since these four mycotoxins are most frequently encountered in cereal grains and feeds (corn, oat, wheat, barley, etc.) [26].
2. Materials and Methods
2.1. Reagents and Chemicals
Ochratoxin A (OTA), aflatoxin B1 (AFB1), fumonisin B1 (FB1) and deoxivalenol (DON) were purchased from Sigma-Aldrich (Darmstadt, Germany). Monoclonal antibodies against AFB1 (mAb-AFB1; catalog number AB-03-04), FB1 (mAb-FB1; catalog number AB-05-01) and DON (mAb-DON; catalog number AB-02-04) were purchased from Aokin AG (Berlin, Germany). The polyclonal antibody against OTA had been previously developed by immunizing New Zealand white rabbits with a synthetic OTA derivative conjugated to bovine thyroglobulin through glutaraldehyde cross-linking, by following a previously described procedure that was properly modified [27]. The whole immunoglobulin (IgG) fraction was isolated from the anti-OTA rabbit antiserum by means of sequential precipitation with caprylic acid and ammonium sulphate [28]; total protein concentration was determined with a BCA protein assay kit (Thermo Fisher Scientific, Waltham, MA USA) according to the manufacturers’ instructions, while purity was evaluated with sodium dodecyl sulfate polyacrylamide gel (SDS-PAGE) electrophoresis. The four mycotoxin–protein conjugates (OTA-OVA (catalog number CJ-04-OVA), AFB1-BSA (catalog number CJ-03-BSA), FB1-OVA (catalog number CJ-05-OVA), DON-OVA (catalog number CJ-02-OVA) were also obtained from Aokin AG (Berlin, Germany). The biotinylated goat anti-rabbit IgG antibody (catalog number B7389) was purchased by Sigma-Aldrich. Goat anti-mouse IgG antibody (catalog number AP124) was from Millipore-Merck (Darmstadt, Germany) and was biotinylated in-house according to a previously published method [29]. Streptavidin, goat anti-rabbit IgG antibody and goat anti-mouse IgG antibody labeled with AlexaFluor 647 were from (Thermo Fisher Scientific, Waltham, MA USA) and bovine serum albumin (BSA) from Acros Organics (Geel, Belgium). LI silver enhancement kit™ was a product of Molecular Probes (Eugene, OR, USA). The QuEChERS extraction kit (OMK1-MP) was from CHROMAtific UG (Heidenrod, Germany). Microscope glass slides (25 × 75 × 1.0 mm, W × L × H) were purchased from Knittel Glässer (Braunschweig, Germany). Poly(methyl methacrylate) (PMMA) with molecular weight of 120 kDa, propylene glycol monomethyl ether acetate (PGMEA) and (3-aminopropyl)triethoxysilane (APTES) were purchased from Sigma-Aldrich. All other chemicals used in this work were of analytical grade and purchased by Merck (Darmstadt, Germany). The water used throughout the study was doubly distilled.
2.2. Preparation of Aminosilane-Coated Glass Slides
Glass slides were first cleaned and hydrophilized by O2 plasma treatment (100 mTorr, 100 W, 100 sccm) for 10 min in a Reactive Ion Etcher. Then, the hydrophilized slides were immersed for 20 min in a 2% (v/v) aqueous (3-aminopropyl)triethoxysilane (APTES) solution. Afterwards, the slides were washed with distilled water, dried under a nitrogen stream and cured by heating at 120 °C for 20 min. The APTES-modified slides were used immediately for PMMA film deposition or kept under vacuum at room temperature (RT) until use as microarray substrates.
2.3. Preparation of 3D Micro-Nanostructured Slides
A 25% (w/v) PMMA solution was prepared in anhydrous PGMEA and spin-coated on APTES-modified glass slides at 1500 rpm for 30 s to create a film with a thickness of ~7 μm (thickness variation across the slide <1%), followed by baking at 180 °C for 2 h. The PMMA-coated slides were then processed in oxygen plasma under highly anisotropic etching conditions (plasma power 400 W, pressure 10 mTorr, gas flow 100 sccm) for 6 min using a Nextral RIE parallel plate plasma reactor with an RF source of 13.56 MHz. Finally, a thermal annealing step at 100 °C for 2 h was employed to stabilize the surfaces wetting properties [17].
2.4. Silver Film Deposition
A silver film was deposited on the oxygen-plasma treated 3D micro-nanostructured substrates using a commercially available two components silver enhancement kit. The two components were mixed in 1:1 volume ratio prior to application onto the surface. The mixture was applied over the slides and left to develop for 30 min at RT. Then, the slides were rinsed with deionized water and dried with a nitrogen stream, prior to application of a freshly prepared silver enhancement mixture. After the completion of the second silver deposition cycle, the slides were washed with deionized water, dried with nitrogen and kept under vacuum at RT until use as microarray substrates. Herein, the slides will be referred to as Ag-3D slides.
2.5. Surface Characterization
The surface morphology of flat PMMA slides, as well as of 3D micro-nanostructured substrates, both prior to and after Ag deposition was characterized through scanning electron microscopy employing a JSM-7401F SEM instrument (JEOL Europe B.V., Zaventem, Belgium) working at 30 kV. Samples were observed at an angle of θ = 45o. The wettability of the surfaces was also assessed through measurements of the water contact at ambient atmospheric conditions using the GBX Digidrop instrument (GBX Scientific Ltd., Dublin, Ireland). For each slide, 10 measurements were obtained using 5μL water drops.
2.6. Microarray Fabrication and Detection
For the preparation of microarrays for multiplexed mycotoxin detection, solutions of the four mycotoxin–protein conjugates in 0.05 M carbonate buffer, pH 9.2 (coating buffer), were spotted on the Ag-3D slides using a Bio-Odyssey Calligrapher™ microarray spotter (Bio-Rad Laboratories, Hercules, CA, USA), equipped with a solid pin (SSP015; Arrayit Corporation, Sunnyvale, CA, USA), in 4 × 4 spot arrays with a spot-to-spot distance of 1000 μm. The concentrations of the four mycotoxin–protein conjugates used were 25, 50, 200, and 100 μg/mL for FB1-OVA, AFB1-BSA, OTA-OVA, and DON-OVA, respectively. The slides were then incubated overnight at RT in a controlled humidity chamber (75% humidity), washed with 0.01 M PBS, pH 7.4, 0.05% (v/v) Tween 20 (PBS-T), and immersed in blocking solution (2% w/v BSA in 0.01 M PBS, pH 7.4) for 3 h at RT. Afterwards, the slides were washed as previously, dried under a nitrogen stream, and assembled with a 3 × 8-well silicone gasket (Arrayit Corporation, Sunnyvale, CA, USA) which allowed for the simultaneous application of different calibrators and/or samples. Each well was loaded with 100 μL of 1:1 volume mixtures of calibrators containing the four mycotoxins at different concentrations (AFB1 from 0–5.0 ng/mL; OTA from 0–250 ng/mL; FB1 from 0–200 ng/mL; DON, from 0–200 ng/mL) along with a mixture of the four anti-mycotoxin antibodies in 0.01 M PBS, pH 7.4, containing 0.4% w/v BSA (assay buffer), and the slides were incubated for 60 min at RT. The concentration of anti-mycotoxin antibodies used in the solution prior to mixing with the calibrators/samples were 2 μg/mL pAb-OTA, 0.5 μg/mL mAb-AFB1, 0.25 μg/mL mAb-FB1, and 1 μg/mL mAb-DON. After that, the gasket was removed, the slides were washed with PBS-T and 100 μL of solution containing 10 μg/mL of biotinylated anti-rabbit IgG Ab and 10 μg/mL of biotinylated anti-mouse IgG Ab in assay buffer was applied to the whole slide using a coverslip and incubated for 45 min. The slides were then washed with PBS-T and incubated with 100 μL of a 2.5 μg/mL AlexaFluor 647-labeled streptavidin in assay buffer for 15 min, at RT. A final washing step with PBS-T and distilled water was performed, and the slides were dried with nitrogen prior to scanning. The slides were scanned using a Perkin Elmer Gx microarray scanner (Perkin-Elmer, Norwalk, CT, USA) at fixed laser power (42%) and photomultiplier voltage (42%). The fluorescence intensity of the spots was calculated using the Scan Array Express System Software, and expressed as relative fluorescence units (RFU). A schematic presentation of the procedures for both microarray fabrication and multiplexed detection of the four mycotoxins is provided in Figure 2.
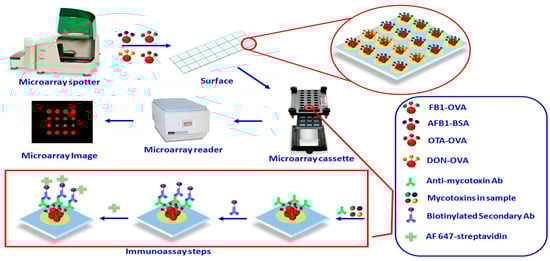
Figure 2.
Schematic presentation of the procedures for both microarray fabrication and multiplexed mycotoxin detection with it. The different steps of the assay are also depicted in the lower part of the figure.
2.7. Analysis of Corn Samples
Corn samples were finely ground using a commercial grinder (Waring, Stamford, CT, USA) and mixed for homogenization. Two and a half grams of grinded samples were spiked with the four mycotoxins at 2 different concentration levels. Spiked samples were shaken for 15 min and left to dry overnight at RT. Then, 10 mL of 80:20 v/v acetonitrile/water mixture was added to each sample and the samples were vigorously shaken for 60 s, followed by the addition of the QuEChERS extraction kit contents. After shaking for 60 s, the samples were centrifuged at 2000 g for 10 min, and the collected supernatants were diluted five times with assay buffer, to eliminate any matrix effect. Diluted corn samples were analyzed as described above. Percentage recovery (%R) was calculated by applying the following equation:
3. Results and Discussion
3.1. Plasmonic 3D Substrate Preparation
The rationale behind the fabrication of Ag-3D substrates was to combine the metal-enhanced fluorescence properties of silver nanoparticles with the high probe loading capacity of plasma micro-nanostructured polymeric surfaces in order to create microarray substrates that could considerably increase the fluorescence signal received from the immunoreactions. In this context, 3D micro-nanostructured polymer films spin-coated over conventional glass slides, which have been previously employed as microarray substrates [16,17] were implemented for preparation of metal-coated 3D substrates using a commercially available silver enhancement kit. This kit is composed of two components, one containing the free Ag ions and the other a reducing agent, whose mixture nucleates rapidly in the presence of gold nanoparticles, increasing their size and facilitating their optical detection. Although nucleation is very limited in absence of gold nanoparticles, from preliminary experiments it was found that nucleation and Ag deposition is possible on both flat, as well as on micro-nanotextured surfaces, especially when repetitive cycles of silver enhancement solution application followed by washings were applied. Thus, at first, the number of Ag deposition cycles was optimized using 3D micro-nanostructured slides and determining the fluorescence signal obtained for the zero calibrator, i.e., the highest signal obtained in the competitive immunoassay, of each of the four mycotoxins. The duration of each silver deposition step was 30 min, which is the longer incubation time suggested by the silver enhancement kit manufacturer. As shown in Figure 3, the maximum fluorescence signal enhancement was observed after two cycles of Ag deposition. The high signals received were preserved after a third Ag deposition step, however, they were diminished when a fourth or fifth deposition cycle was applied. In fact, the fluorescence signals received from 3D micro-nanostructured surfaces after four or five cycles of Ag deposition were lower than the respective signal obtained from these surfaces without any Ag deposition. Regarding, the fluorescence signal increase obtained using 3D micro-nanostructured slides after two or three silver deposition cycles was 2.5 times for FB1 and DON, about 2.1 times for AFB1 and 1.75 times for OTA.
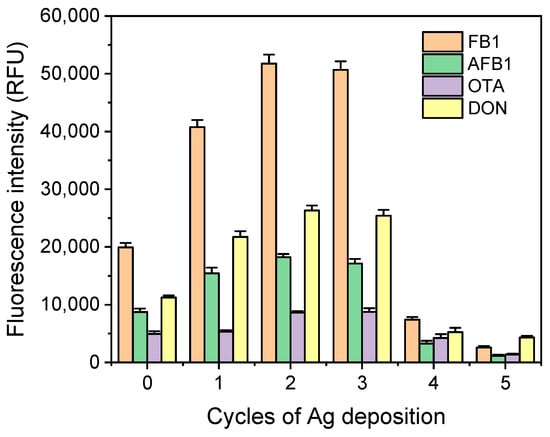
Figure 3.
Fluorescence intensity values corresponding to zero calibrators of each one of the four targeted mycotoxins obtained with 3D micro-nanostructured poly(methyl methacrylate) (PMMA) slides non-treated with silver enhancement solution (column group 0) or treated with silver enhancement solution for 1 to 5 consecutive times (columns groups 1 to 5, respectively). The column designation is as follows: orange fumonisin B1 (FB1); green aflatoxin B1 (AFB1); purple ochratoxin A (OTA); yellow deoxynivalenol (DON). Each value is the mean of 16 spots ± SD.
In addition to comparison with the 3D micro-nanostructured PMMA slides, the fluorescence intensity values obtained for the zero calibrators of the four targeted mycotoxins, i.e., the highest signal obtained for each assay in absence of analyte in a competitive immunoassay format, were compared using the same scanning conditions to those obtained using glass slides modified with APTES without further processing, as well as after the application of 2 Ag deposition cycles. Moreover, the fluorescence values obtained from flat PMMA slides, i.e., slides non-treated with oxygen plasma were also provided. As shown in Figure 4, the fluorescence signals intensity was significantly improved in case of APTES-modified slides for three out of the four mycotoxins, i.e., FB1, AFB1 and DON, whereas for OTA there was no any signal enhancement. On the other hand, for the PMMA slides, there was a considerable increase in the fluorescence signal obtained for the zero calibrators from the combination of micro-nanostructuring and Ag plating. More specifically, the zero calibrator signals of AFB1 and OTA increased by 2.8 times after oxygen plasma micro-nanostructuring and Ag plating, the DON signal increased 5.6 times, while for FB1 an increase of up to 16-times was observed compared to flat PMMA slides. Most notably, this increase in the zero calibrator signal was not accompanied by a significant increase (approx. 50% increase compared to flat PMMA) in the blank signal (blue columns in Figure 4) which corresponds to fluorescence intensity value determined from slide areas outside the spots. The blank signal is the sum of the background signal (light reflected by the substrate) and the non-specific binding of the antibodies, both primary and secondary, at the areas outside the spots.
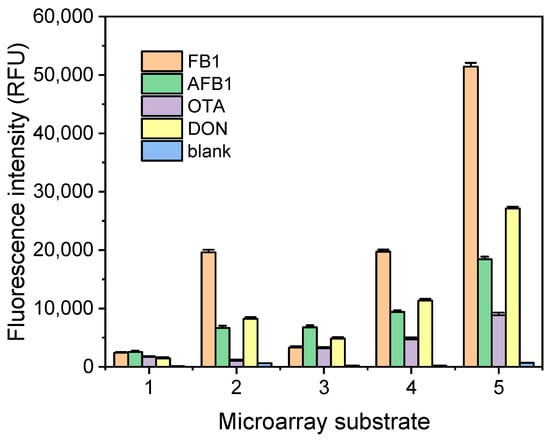
Figure 4.
Fluorescence intensity values corresponding to zero calibrators of each one of the four targeted mycotoxins obtained with (3-aminopropyl)triethoxysilane(APTES)-modified glass slides (column set 1), APTES-modified/Ag plated glass slides (column set 2), flat PMMA slides (column set 3), 3D micro-nanostructured PMMA slides (column set 4) and 3D micro-nanostructured/Ag plated PMMA slides (column set 5). The column designation is as follows: orange FB1; green AFB1; purple OTA; yellow DON; blue blank. Each value is the mean of 16 spots ± SD.
3.2. Plasmonic 3D Substrates Characterization
Scanning electron microscopy (SEM) imaging was implemented to investigate the morphology of the Ag film deposited over the 3D micro-nanostructured PMMA substrates. The SEM images received from PMMA 3D micro-nanostructured slides prior to and after Ag deposition, as well as images of a non-treated PMMA surface (flat) on which Ag deposition was performed are provided in Figure 5. For comparison, an SEM image of the flat PMMA substrate is provided in Figure S1 of Supplementary Material. The SEM image of 3D micro-nanostructured PMMA surface obtained prior to Ag deposition reveals the highly rough structure of the surface with the brush like structures, whereas the image received after Ag deposition shows a complete coverage of the surface with structures of various shapes with a mean diameter of about 100–150 microns (see Figure 5c). A closer look at the surface after the Ag deposition (Figure 5c) shows that although the structure of the underlying PMMA is to a great degree inaccessible, the fact that the Ag layer has been developed on top of this structure leads to a surface of a considerable higher roughness compared to that created on PMMA that has not undergone oxygen plasma treatment (Figure 5d).
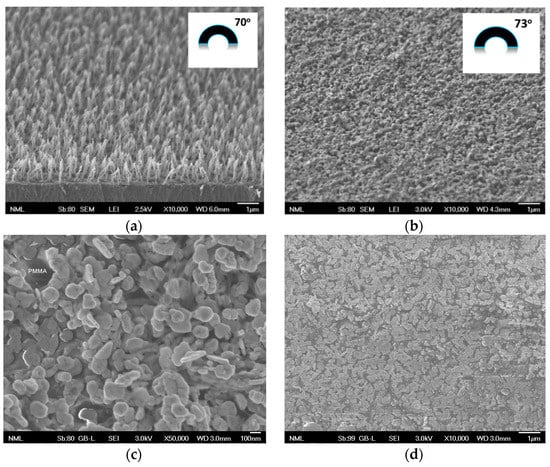
Figure 5.
SEM image of: (a) a 3D micro-nanostructured PMMA surface, (b) a 3D micro-nanostructured PMMA surface after two cycles of Ag deposition, (c) a higher analysis image of (b), and (d) a flat PMMA surface after two cycles of Ag deposition the inserts in (a,b) show the corresponding water contact angles measurements performed in each surface.
The wetting properties of the 3D micro-nanostructured PMMA substrates were also determined prior to and after Ag deposition through measurements of water contact angles. For the 3D micro-nanostructured slides, a mean water contact angle of 70 ± 5o was determined, while for the Ag-3D substrates the mean contact angle value was 73 ± 6o. In other words, Ag deposition over the micro-nanoscructures created onto the PMMA film through the oxygen plasma treatment does not affect the wetting properties of the surface. This is an important finding since in a previous report it was shown that the wettability of the 3D micro-nanostructured substrate is a crucial characteristic determining the quality of spots and especially the spot size and uniformity, thus also determining the detection sensitivity of the microarrays [17].
3.3. Analytical Performance of Multiplex Microarray
The potential of the Ag-3D slides to serve as microarray substrates for the development of sensitive multiplex assays was investigated through design and fabrication of a microarray for the simultaneous immunochemical detection of four mycotoxins, namely FB1, AFB1, OTA and DON, in a single run. Due to the low molecular weight of the mycotoxins/analytes, an indirect competitive immunoassay format was employed using mycotoxin–protein conjugates as solid-phase reagents and highly specific anti-mycotoxin antibodies to detect all four targeted analytes. Thus, at first the cross-reactivity of each one of the antibodies used was tested against the other three mycotoxins conjugates in a microarray experiment. It should be noticed that from the four antibodies employed the three, i.e., those for FB1, AFB1 and DON, are mouse monoclonal antibodies, whereas the OTA antibody is a rabbit polyclonal one. In Figure 6, a representative image, obtained after scanning a microarray in which all the conjugates have been spotted in rows and then reacted with each of the antibodies as well as with a mixture of the four antibodies, is provided. As shown, all four antibodies were highly specific for the corresponding mycotoxin, showing no cross-reaction with any of the other three mycotoxins since no fluorescence signal was detected from spots where the other three mycotoxin-conjugates have been immobilized, whereas a signal is obtained in all cases from the spots corresponding to the mycotoxin conjugate the particular Ab recognizes. In addition, the fluorescent signals obtained from the spots after incubation with each one of the antibodies separately were not statistically different from the signals obtained when a mixture of all four antibodies was applied. This finding is an indication that the binding of each antibody to the corresponding analyte is not hindered by the presence of the other three antibodies in the mixture. The lack of cross-reactivity towards the three other mycotoxins was also demonstrated for each antibody by the absence of any signal drop when running the assay with each anti-mycotoxin antibody separately and using calibrators containing the other three mycotoxins.
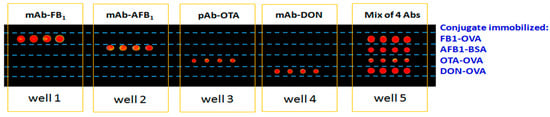
Figure 6.
Representative fluorescence image obtained from a microarray created on an Ag-3D slide by spotting each one of the mycotoxin-conjugates along the long axis of the substrate (row 1: FB1-OVA; row 2: AFB1-BSA; row 3: OTA-OVA; row 4: DON-OVA) and probing four spots of each conjugate with either each one of the mycotoxin antibodies separately (wells 1 to 4) or a mixture of all antibodies (well 5).
After showing lack of cross-reactivity towards the other mycotoxins for each anti-mycotoxin antibody used, the parameters of each assay were optimized bearing in mind that common buffers and durations of the different assay steps should be used. In this context, the two basic parameters of every indirect competitive immunoassay, i.e., the concentration of conjugate used for coating and the concentration of analyte-specific antibody, were optimized. These two parameters determine not only the zero calibrator’s signal amplitude, but also the assay detection limit, i.e., the lowest analyte concentration that can be discriminated from the zero calibrator. To determine the optimum mycotoxin–protein conjugate and anti-mycotoxin antibody concentrations for each one of the assays, Ag-3D slides were spotted with conjugate concentrations ranging from 25 to 400 μg/mL and probed with a 1 μg/mL solution of each antibody. As shown in Figure S2, maximum plateau values were obtained for conjugate concentrations equal to or higher than 25 μg/mL for FB1-OVA, 50 μg/mL for AFB1-BSA, 200 μg/mL for OTA-OVA, and 100 μg/mL for DON-OVA. Using these conjugate concentrations for spotting, the fluorescence intensity values obtained for the zero calibrator using antibody concentrations ranging from 0.1 to 5 μg/mL were determined. From the results presented in Figure S3, it can be concluded that maximum plateau fluorescence values were obtained using 0.25 μg/mL of mab anti-FB1, 0.5 μg/mL of mAb anti-AFB1, 2 μg/mL of pAb anti-OTA, and 1 μg/mL of mAb anti-DON. Based on these results the mycotoxin–protein conjugate and respective antibody concentrations finally selected were as follows: for FB1 25 μg/mL of FB1-OVA and 0.25 μg/mL of mAb anti-FB1; for AFB1 50 μg/mL of AFB1-BSA and 0.5 μg/mL of mAb anti-AFB1; for OTA: 200 μg/mL of OTA-OVA and 2 μg/mL of pAb anti-OTA, and for DON: 100 μg/mL of DON-OVA and 1 μg/mL of mAb anti-DON. The reaction with the mycotoxin-specific antibody (primary immunoreaction) was followed by two additional reactions aiming at signal enhancement. These reactions employed, first, a mixture of biotinylated secondary antibodies (anti-mouse IgG and anti-rabbit IgG antibody) and, second, streptavidin labeled with the fluorescent dye AlexaFluor 647, as is schematically depicted in Figure 2. The implementation of these two additional reaction steps aimed at increasing the fluorescence signal without causing substantial increase in the total analysis time. As shown in Figure S4 the fluorescence intensity values obtained using fluorescently labeled secondary antibodies were two to three times lower than those obtained for the same reaction duration (60 min) using biotinylated labeled secondary antibodies in combination with fluorescently labeled streptavidin. Thus, the three steps assay that included the primary immunoreactions, the reaction with the biotinylated secondary antibodies and the streptavidin was selected. The reaction time with the biotinylated secondary antibodies was optimized with respect to the zero calibrator fluorescence intensity signals and it was found that the maximum plateau values were obtained after 45 min of reaction (Figure S5). Similarly, the reaction with the fluorescently labeled streptavidin reached plateau values after 15 min of reaction. Keeping the duration of the above reaction steps stable, i.e., 45 min for biotinylated secondary antibodies and 15 min for fluorescently-labeled streptavidin, the duration of the primary immunoreactions was optimized. It was found that for all assays, maximum plateau values were obtained for primary reaction duration of 1 h, although for OTA and DON, a 30-min primary reaction was adequate to obtain the maximum plateau values. Thus, the total analysis time was set to 2 h, not-including the washing and scanning steps. Once the assay conditions for each one analyte were established, the multiplex microarrays were prepared by spotting the four mycotoxin conjugates (four spots from each conjugate in a 4x4 spots array with a between-spots-distance of 1 mm) onto the area defined by a single well in the gasket and the arrays created were used to receive the final calibration curves and analyze the corn samples.
Prior to corn sample analysis, the effect of the matrix on the calibration curves was investigated by determining the zero calibrator signal obtained for each one of the four analytes in presence of corn extract diluted with assay buffer one to 20 times. This investigation was necessary, since in order to extract the mycotoxins from the corn samples treatment with an acetonitrile/water mixture (80:20 v/v) was employed followed by the addition of the QuEChERS extraction kit contents. Thus, the solution to be analyzed had a quite different composition from the assay buffer used to prepare the calibrators and perform the assay, which might influence the fluorescence signals obtained. In addition, the corn extract might contain—in addition to the mycotoxins—other residual substances, e.g., proteins, sugars, etc., that could interfere with the assay. As shown in Figure 7, a five-time dilution of corn extract with assay buffer was enough to eliminate any matrix effect since the values received for the four analytes were identical to those obtained with assay buffer. On the other hand, the use of less diluted samples had a detrimental effect on the zero calibrator signals.
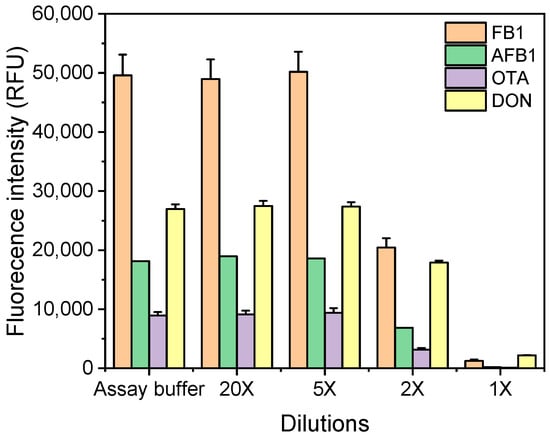
Figure 7.
Zero calibrator signals obtained from microarrays prepared in Ag-3D slides for each one of the four mycotoxins in assay buffer or in corn extract diluted 1X to 20X with assay buffer. Each bar represents the mean value of 3 measurements (16 spots each) ± SD.
The effect of the corn extract matrix on the calibration curves was also determined. In Figure 8, typical calibration curves for the four targeted analytes obtained using calibrators in assay buffer or in 5-fold diluted corn extract are provided. As shown, the two calibration curves are identical, providing further indication that there is no matrix effect. In addition, representative fluorescence images obtained from each mycotoxin analysis are shown as inserts. From the images, it is obvious that the Ag-3D slides do not suffer from the “coffee-ring effect”, i.e., the high signal intensity at the periphery of the spots, which is common on microarrays spotted on flat glass substrates. This was one of the main advantages of the 3D PMMA slides when they were implemented as microarray substrates and it seems that this is preserved after Ag deposition [17]. The spots were also quite uniform, with within spot fluorescence intensity variations of less than 10%, and between spot intensity coefficients of variation for the same slide of less than 12% for all four analytes. The slide-to-slide repeatability was also quite good, with coefficients of variation ranging from 12 to 16% for the four analytes. In addition, the batch-to-batch reproducibility was tested by preparing five batches of four slides each and testing them with respect to the zero calibrator signals obtained for all four mycotoxins. The results obtained from the different batches were repeatable with coefficients of variation less than 16% for the four analytes, demonstrating the repeatability of the fabrication procedure. The stability of Ag-3D slides over time was also evaluated by preparing a batch of six, storing them in a desiccator away from direct light, and testing them every 15 days over a period of 3 months. It was found, that the absolute fluorescence intensity values were dropped about 10% after storage for up to 3 months, while the intra- and between-spots repeatability for a single slide was not affected. Thus, the proposed Ag-3D substrates exhibit a shelf life of at least 3-months, although use after this time could be possible.
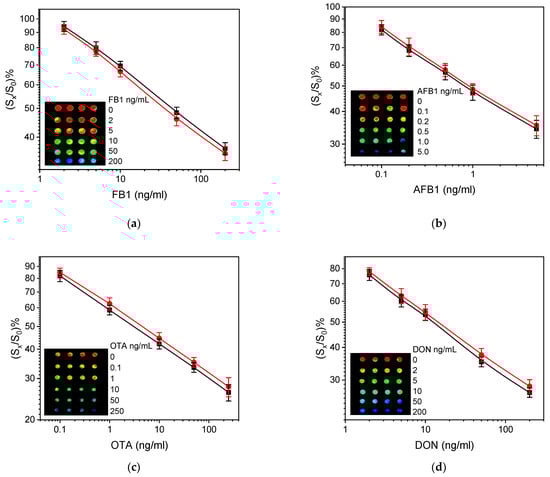
Figure 8.
Typical calibration curves obtained with calibrators prepared in assay buffer (black squares) or 5-times diluted corn extract (red circles). Inserted into each graph are representative fluorescence images of the spots corresponding to the calibrator concentrations shown on the right of each image.
Based on the calibration curves presented in Figure 8, the analytical characteristics of the developed multiplex microarray assay of the four mycotoxins in corn samples were determined and are summarized in Table 1, along with the respective maximum residue limits (MRL) set by the EU for corn. The limit of detection (LoD) for each individual assay was defined as the concentration corresponding to percent signal equal to 100-3SDs of the mean value of 16 spots corresponding to the zero calibrator. As can be concluded from the values presented in Table 1, the LoDs achieved for each one of the four mycotoxins were below the respective MRLs, and thus, the developed multiplex assay meets the current regulatory limits enabling a reliable and sensitive determination of the four mycotoxins. It should be noted that the LoDs obtained from microarrays prepared using 3D-slides not modified with Ag, were approximately two times higher for FB1 and OTA (8 and 0.5 ng/mL, respectively), three times higher for DON (12.5 ng/mL) and five times for AFB1 (1 ng/mL). In addition, the linear response ranges were quite broad, thus allowing the detection of the four mycotoxins in a wide range of concentrations. The intra-assay coefficients of variation (CVs) were determined by analyzing a corn extract spiked with three levels of each one of the four mycotoxins in three different slides within the same day, while the inter-assay CVs were determined by analyzing the same samples in three different slides run in three different days within a period of one month.

Table 1.
Analytical characteristics of the multiplex mycotoxin assay.
To validate the accuracy of the multiplex assay, corn samples were spiked with the four mycotoxins, and then the sample preparation procedure was followed (extraction and five-time dilution) and percent recovery was determined as described in the experimental section. Table 2 summarizes the % recovery values determined for each mycotoxin. In all cases, the percent recovery values fall within the acceptable range of 80–120%, certifying the analytical accuracy of the developed multiplex microarray.
Table 2.
Recovery of exogenous added mycotoxins in corn samples.
4. Discussion
Glass slides coated with a PMMA layer which underwent micro-nanostructuring through treatment in oxygen plasma were characterized by an increased protein adsorption capability (six-fold compared to untreated surfaces and four-fold compared to the epoxy-coated glass slides) [16]. This increase was attributed to an almost six times increase in the active spot area with respect to the projected one, as a result of surface micro-nanostructuring, and led to a considerable increase in detection sensitivity. In addition to the improved spot fluorescence intensity, it was found that the spot homogeneity and reproducibility within the slide was considerably improved, mainly due to the lack of the “coffee-ring” effect observed for the spots created on the epoxy-coated glass slides that were implemented for comparison [17]. The latter feature greatly facilitated the automatic spot intensity calculation by the dedicated scanner software. On the other hand, fluorescence signal enhancement by implementation of noble metals (mostly gold and silver) in the form of either free standing nanoparticles [20,22] or nanostructured surfaces [23,24] is also well documented and attributed to plasmonic effects [21].
In order to combine these two fluorescence signal enhancement mechanisms, in the current work, oxygen plasma micro-nanostructured PMMA slides—referred to for simplicity reasons as 3D slides—were exposed to further processing by Ag deposition onto their surface. This was achieved by implementing a commercially available silver enhancement kit that combined free Ag ions with a reducing agent to induce size growth of gold nanoparticles by Ag deposition. The size increase is proportional to the duration of gold nanoparticles incubation with the reagent and it could be applied multiple times to achieve the required detection sensitivity. In theory, Ag deposition should be negligible in absence of gold nanoparticles, nonetheless we observed that Ag deposition was possible onto several surfaces after prolonged incubation with the Ag deposition solution. Moreover, through repetition of the incubation, an almost homogeneous Ag layer could be obtained.
It is important to notice that a higher increase in the fluorescence intensity was achieved by the surface that had been exposed to two to three cycles of Ag deposition, while further repetition of the process resulted in a dramatic reduction in the fluorescence signal. This result can be attributed to the fact that in order to benefit from the increased surface area for biomolecule immobilization and the plasmonic fluorescence signal enhancement, Ag deposition should not completely cover the underlying micro-nanostructure. This is evident in the SEM images of the Ag plated 3D slides (Figure 5b,c), where the creation of Ag particles onto the surface was shown to preserve the 3D structure. The application of more Ag deposition steps could lead to reduction in the 3D structure of the surface, similar to the one created in the flat PMMA slides (Figure 5d). In addition, the film created might quench rather than enhance the emitted fluorescence signal due to the darker surface color (near black) of the substrates subjected to four or five cycles of Ag deposition.
Another interesting finding was the fact that the fluorescence signal increase with respect to the 3D non-plated slides was not the same for all assays; 2.5 times for FB1 and DON, about 2.1 for AFB1 and 1.75 for OTA. These differences might reflect the fact that the effect of Ag nanoparticles on the fluorescence signal enhancement depends on the initial signal amplitude, since the ratio of signal increase is higher for the higher signals and lower for the lower ones. The differences between the assays were more pronounced when the Ag-3D slides were compared with the flat PMMA slides. In this case, the signals of AFB1 and OTA were found to increase by 2.8 times after oxygen plasma micro-nanostructuring and Ag plating, 5.6 times for DON, and 16 times for FB1. This difference might also reflect a different surface adsorption capacity towards the four mycotoxin–protein conjugates since the flat PMMA surface is far from the ideal microarray support. The multi-parametric nature of the observed fluorescence enhancement is also depicted in the findings regarding glass-slides modified with APTES prior to and after Ag deposition. The highest signal increase was observed for FB1 (by almost eight times), whereas the signal for OTA was reduced by approximately 40%. On the other hand, the signal increases for AFB1 and DON were 2.6 and 5.6 times, respectively, in other words close to those obtained when moving from flat PMMA to Ag-3D slides. Nonetheless, even after Ag deposition, the signals obtained from the APTES-modified glass slides were at least 2.5 times lower than the respective ones obtained for the Ag-3D slides.
Another characteristic of the 3D slides that was conserved after Ag deposition, was the quality of the spots regarding the within-spot homogeneity as well as the spot-to-spot repeatability [17]. This arises from the fact that neither of the two substrates suffer from the “coffee-ring effect” and that the water contact angle of the Ag-3D slides is the same as that of the 3D slides prior to Ag deposition. Despite this, a constant difference in the size of spots corresponding to the OTA was observed, which were significantly smaller in diameter compared to the spots corresponding to the other three analytes. Taking into account that the size of the spot is mainly defined by the contact angle of the surface and the surface tension of the droplet, the smaller spot size of the OTA-OVA conjugate might arise from the fact that the concentration of the OTA-OVA conjugate used for spotting was higher compared to the other three conjugates. To the advantages of the proposed microarray substrates, one could also count the fact that, for the period of time examined (three months), neither the absolute fluorescence intensity nor the spot uniformity and repeatability was affected.
The unique characteristics of the Ag-3D slides were exploited through the development of a microarray for the multiplexed immunochemical determination of four mycotoxins, namely FB1, AFB1, OTA and DON. A competitive immunoassay format was employed using mycotoxin–protein conjugates as solid phase reagents, non-labeled primary and biotinylated secondary antibodies detected by fluorescently-labeled streptavidin. The multiplexed determination of the four mycotoxins was facilitated by the fact that there was no detectable cross-reaction of the primary antibodies implemented towards the other three analytes. In addition, the use of biotinylated secondary antibodies in combination with fluorescently-labeled streptavidin offered further signal enhancement, reducing the whole analysis time to 2 h. Since these two reaction steps were performed on the whole slide by applying a coverslip, the consumption of the reagents was the minimum possible one. The assays developed had limits of detection (LoD) below the MRLs set by the EU legislation, wide linear response ranges, and high repeatability and accuracy regarding the determination of the four mycotoxins in corn extracts.
In conclusion, the Ag-3D slides provided significant fluorescence signal enhancement compared to both 3D PMMA and APTES-modified glass slides along with excellent spot-to-spot and slide-to-slide repeatability. The compatibility of the Ag-3D slides with commercially available microarray spotters and scanners facilitates their implementation as substrates for microarrays for multiplexed determination of analytes in a single run.
Supplementary Materials
The following are available online at https://www.mdpi.com/2227-9717/9/2/392/s1, Figure S1: SEM image of a flat PMMA surface (prior to plasma micro-nanostructuring), Figure S2. Fluorescence intensity values obtained from Ag-3D slides versus the mycotoxin–protein concentration used for spotting when each antibody has been used at a concentration of 1 μg/mL. Black squares correspond to FB1, red circles to AFB1, blue up triangles to OTA, and green down triangles to DON. Each point is the mean value of 16 spots ± SD, Figure S3. Fluorescence intensity values obtained from Ag-3D slides spotted with 25 μg/mL of FB1-OVA, 50 μg/mL of AFB1-BSA, 200 μg/mL of OTA-OVA, and 100 μg/mL of DON-OVA versus the anti-mycotoxin antibody concentration. Black squares correspond to FB1, red circles to AFB1, blue up triangles to OTA, and green down triangles to DON. Each point is the mean value of 16 spots ± SD, Figure S4. Fluorescence intensity values received using secondary antibodies either fluorescently labeled (orange bars) or biotinylated in combination with fluorescently labeled streptavidin (purple bars). The primary immunoreactions duration was 1 h in all cases. Each point is the mean value of 16 spots ± SD, Figure S5. Fluorescence intensity values versus the reaction time with the biotinylated secondary antibodies. Orange bars correspond to FB1, green bars to AFB1, purple bars to OTA, and yellow bars to DON. The primary immunoreactions’ duration was 1 h in all cases and the reaction with the fluorescently labeled streptavidin lasted 15 min. Each point is the mean value of 16 spots ± SD, Figure S6. Fluorescence intensity values versus the primary immunoreactions’ duration. Orange bars correspond to FB1, green bars to AFB1, purple bars to OTA, and yellow bars to DON. The reaction time with the biotinylated secondary antibodies was 45 min and with the fluorescently labeled streptavidin 15 min. Each point is the mean value of 16 spots ± SD.
Author Contributions
Conceptualization, G.K., C.-E.K. and P.S.P.; methodology, G.K. and C.-E.K.; validation, G.K. and C.-E.K.; formal analysis, G.K. and C.-E.K.; investigation, G.K., C.-E.K. and A.K.; resources, E.L., S.E.K. and P.S.P.; data curation, G.K. and C.-E.K.; writing—original draft preparation, C.-E.K.; writing—review and editing, K.T., E.L., S.E.K. and P.S.P.; visualization, G.K. and C.-E.K.; supervision, E.L., S.E.K., and P.S.P. All authors have read and agreed to the published version of the manuscript.
Funding
This research was supported by the project “NCSRD—INRASTES research activities in the framework of the national RIS3” (MIS 5002559) which is implemented under the “Action for the Strategic Development on the Research and Technological Sector”, funded by the Operational Program “Competitiveness, Entrepreneurship and Innovation” (NSRF 2014-2020) and co-financed by Greece and the European Union (European Regional Development Fund).
Institutional Review Board Statement
Not applicable.
Informed Consent Statement
Not applicable.
Data Availability Statement
Not applicable.
Acknowledgments
The authors would like to thank K. Ellinas, A. Tserepi and E. Gogolides (Institute of Nanoscience and Nanotechnology, NCSR “Demokritos” and Nanoplasmas Private Company) for their assistance and support. They would like also to thank C.M. Skoulikidou for her excellent technical assistance in the characterization of surfaces via SEM.
Conflicts of Interest
The authors declare no conflict of interest.
References
- Wu, F.; Groopman, J.D.; Pestka, J.J. Public health impacts of foodborne mycotoxins. Annu. Rev. Food Sci. Technol. 2014, 5, 351–372. [Google Scholar] [CrossRef]
- Streit, E.; Schwab, C.; Sulyok, M.; Naehrer, K.; Krska, R.; Schatzmayr, G. Multi mycotoxin screening reveals the occurrence of 139 different secondary metabolites in feed and feed ingredients. Toxins 2013, 5, 504–523. [Google Scholar] [CrossRef] [PubMed]
- Anfossi, L.; Giovannoli, C.; Baggiani, C. Mycotoxin detection. Curr. Opin. Biotechnol. 2016, 37, 120–126. [Google Scholar] [CrossRef] [PubMed]
- Klaric, M.S.; Rasic, D.; Peraica, M. Deleterious effects of mycotoxin combinations involving ochratoxin A. Toxins 2013, 5, 1965–1987. [Google Scholar] [CrossRef] [PubMed]
- Creppy, E.E.; Chiarappa, P.; Baudrimont, I.; Borracci, P.; Moukha, S.; Carratu, M.R. Synergistic effects of fumonisinB1 and ochratoxin A: Are in vitro cytotoxicity data predictive of in vivo acute toxicity? Toxicology 2004, 201, 115–123. [Google Scholar] [CrossRef] [PubMed]
- Mohamed, R.; Guy, P.A. The pivotal role of mass spectrometry in determining the presence of chemical contaminants in food raw materials. Mass Spectrom. Rev. 2011, 30, 1073–1095. [Google Scholar] [CrossRef] [PubMed]
- Zhang, Z.; Hu, W.; Zhang, Q.; Li, P.; Li, C. Competitive immunoassays using antigen microarrays. Methods Mol. Biol. 2016, 1368, 237–247. [Google Scholar]
- Liu, Y.; Li, C.M. Advanced immobilization and amplification for high performance protein chips. Anal. Lett. 2012, 45, 130–155. [Google Scholar] [CrossRef]
- Krizkova, S.; Heger, Z.; Zalewska, M.; Moulick, A.; Adam, V.; Kizek, R. Nanotechnologies in protein microarrays. Nanomedicine 2015, 10, 2743–2755. [Google Scholar] [CrossRef]
- Sauer, U. Analytical protein microarrays: Advancements towards clinical applications. Sensors 2017, 17, 256. [Google Scholar] [CrossRef] [PubMed]
- Tsougeni, K.; Tserepi, A.; Boulousis, G.; Constantoudis, V.; Gogolides, E. Tunable poly(dimethylsiloxane) topography in O2 or Ar plasmas for controlling surface wetting properties and their ageing. Jpn. J. Appl. Phys. 2007, 46, 744. [Google Scholar] [CrossRef]
- Vourdas, N.; Tserepi, A.; Gogolides, E. Nanotextured super-hydrophobic transparent poly(methyl methacrylate) surfaces using high-density plasma processing. Nanotechnology 2007, 18, 125304. [Google Scholar] [CrossRef]
- Tsougeni, K.; Petrou, P.S.; Tserepi, A.; Kakabakos, S.E.; Gogolides, E. Nano-texturing of poly(methyl methacrylate) polymer using plasma processes and applications in wetting control and protein adsorption. Microelectron. Eng. 2009, 86, 1424–1427. [Google Scholar] [CrossRef]
- Tsougeni, K.; Vourdas, N.; Tserepi, A.; Gogolides, E.; Cardinaud, C. Mechanisms of oxygen plasma nanotexturing of organic polymer surfaces: From stable super hydrophilic to super hydrophobic surfaces. Langmuir 2009, 25, 11748–11759. [Google Scholar] [CrossRef] [PubMed]
- Vourdas, N.E.; Vlachopoulou, M.-E.; Tserepi, A.; Gogolides, E. Nano-textured polymer surfaces with controlled wetting and optical properties using plasma processing. Int. J. Nanotechnol. 2009, 6, 196–207. [Google Scholar] [CrossRef]
- Tsougeni, K.; Tserepi, A.; Constantoudis, V.; Gogolides, E.; Petrou, P.S.; Kakabakos, S.E. Plasma nanotextured PMMA surfaces for protein arrays: Increased protein binding and enhanced detection sensitivity. Langmuir 2010, 26, 13883–13891. [Google Scholar] [CrossRef] [PubMed]
- Tsougeni, K.; Ellinas, K.; Koukouvinos, G.; Petrou, P.S.; Tserepi, A.; Kakabakos, S.E.; Gogolides, E. Three-dimensional (3D) plasma micro-nanotextured slides for high performance biomolecule microarrays: Comparison with epoxy-silane coated glass slides. Colloid Surf. B Biointerfaces 2018, 165, 270–277. [Google Scholar] [CrossRef] [PubMed]
- Nagl, S.; Schaeferling, M.; Wolgbeis, O.S. Fluorescence analysis in microarray technology. Microchim. Acta 2005, 151, 1–21. [Google Scholar] [CrossRef]
- Tseng, M.L.; Huang, Y.W.; Hsiao, M.K.; Huang, H.W.; Chen, H.M.; Chen, Y.L.; Chu, C.H.; Chu, N.N.; He, Y.J.; Chang, C.M.; et al. Fast fabrication of an Ag nanostructure substrate using the femtosecond laser for broad-band and tunable plasmonic enhancement. ACS Nano 2012, 6, 5190–5197. [Google Scholar] [CrossRef]
- Fu, Y.; Zhang, J.; Lakowicz, J.R. Plasmon enhanced fluorescence from single fluorophores end-linked to gold nanorods. JACS 2010, 132, 5540–5541. [Google Scholar] [CrossRef]
- Larguinho, M.; Baptista, P.V. Gold and silver nanoparticles for clinical diagnostics—From genomics to proteomics. J. Proteom. 2012, 75, 2811–2823. [Google Scholar] [CrossRef]
- Gu, X.; Wu, Y.; Zhang, L.; Liu, Y.; Li, Y.; Yan, Y.; Wu, D. Hybrid magnetic nanoparticle/nanogold clusters and their distance-dependent metal-enhanced fluorescence effect via DNA hybridization. Nanoscale 2014, 6, 8681–8693. [Google Scholar] [CrossRef]
- Liu, C.; Meng, F.; Wang, B.; Zhang, L.; Cui, X. Plasmonicnanograting enhanced fluorescence for protein microarray analysis of carcinoembryonic antigen (CEA). Anal. Methods 2018, 10, 145–150. [Google Scholar] [CrossRef]
- Li, H.; Wang, M.; Qiang, W.; Hu, H.; Li, W.; Xu, D. Metal-enhanced fluorescent detection for protein microarrays based on a silver plasmonic substrate. Analyst 2014, 139, 1653–1660. [Google Scholar] [CrossRef] [PubMed]
- Todescato, F.; Antognoli, A.; Meneghello, A.; Cretaio, E.; Signorini, R.; Bozio, R. Sensitive detection of Ochratoxin A in food and drinks using metal-enhanced fluorescence. Biosens. Bioelectron. 2014, 57, 125–132. [Google Scholar] [CrossRef]
- Lee, H.J.; Ryu, D. Worldwide occurrence of mycotoxins in cereals and cereal-derived food products: Public health perspectives of their co-occurrence. J. Agric. Food Chem. 2017, 23, 7034–7051. [Google Scholar] [CrossRef] [PubMed]
- Papasarantos, I.; Klimentzou, P.; Koutrafouri, V.; Anagnostouli, M.; Zikos, C.; Paravatou-Petsotas, M.; Livaniou, E. Solid-phase synthesis of a biotin derivative and its application to the development of anti-biotin antibodies. Appl. Biochem. Biotechnol. 2010, 162, 221–232. [Google Scholar] [CrossRef]
- Perosa, F.; Carbone, R.; Ferrone, S.; Dammacco, F.F. Purification of human immunoglobulins by sequential precipitation with caprylic acid and ammonium sulphate. J. Immunol. Methods 1990, 128, 9–16. [Google Scholar] [CrossRef]
- Koukouvinos, G.; Petrou, P.S.; Misiakos, K.; Drygiannakis, D.; Raptis, I.; Goustouridis, D.; Kakabakos, S.E. A label-free flow-through immunosensor for determination of total- and free-PSA in human serum samples based on white-light reflectance spectroscopy. Sens. Actuator B 2015, 209, 1041–1048. [Google Scholar] [CrossRef]


Publisher’s Note: MDPI stays neutral with regard to jurisdictional claims in published maps and institutional affiliations. |
© 2021 by the authors. Licensee MDPI, Basel, Switzerland. This article is an open access article distributed under the terms and conditions of the Creative Commons Attribution (CC BY) license (http://creativecommons.org/licenses/by/4.0/).