Article

In Situ Modification of Activated Carbons by Oleic Acid under Microwave Heating to Improve Adsorptive Removal of Naphthalene in Aqueous Solutions

1
School of Environmental and Chemical Engineering, Xi’an Polytechnic University, Xi’an 710048, China
2
Department of Drug Science and Technology, University of Turin, 10125 Turin, Italy
*
Authors to whom correspondence should be addressed.
These authors shared co-first authorship.
Processes 2021, 9(2), 391; https://doi.org/10.3390/pr9020391
Submission received: 31 January 2021 / Revised: 13 February 2021 / Accepted: 19 February 2021 / Published: 21 February 2021
(This article belongs to the Special Issue Activated Carbon in Contaminant Removal)

Abstract

:
This study aimed to improve the adsorption capacity of activated carbon (AC) towards naphthalene (NAP) in aqueous solutions. Starch-based AC (SAC) and pulverized coal-based AC (PCAC) were prepared in a one-pot procedure by activation with oleic acid and KOH under microwave heating. Brunauer–Emmett–Teller (BET) specific surface areas reached 725.0 and 912.9 m2/g for in situ modified SAC (O-SAC1) and PCAC (O-PCAC1), respectively. π–π bond, H-bond, and hydrophobic effects were directly involved in the NAP adsorption process. Batch adsorption data were well fitted by pseudo-second order kinetics and the Freundlich isotherm model. As compared to ACs prepared with only KOH activation, NAP adsorption capacities of PCAC and SAC prepared by the one-pot method increased by 16.9% and 13.7%, respectively. Influences of varying factors were investigated in column adsorption of NAP using O-SAC1 and O-PCAC1. Based on breakthrough curves analysis, the larger column height (H), lower flow rate (Q0), and lower initial concentration (C0) resulted in the longer breakthrough and exhaustion times in both cases. Specifically, we concluded that O-PCAC1 exhibits better adsorption capacity than O-SAC1 in the given conditions. The optimized operating parameters were 1 cm (H), 1 mL/min (Q0) and 30 mg/L (C0). Finally, column adsorption data could be well fitted by the Thomas model.

1. Introduction

Naphthalene (NAP), an important hydrophobic organic compound and the smallest polycyclic aromatic hydrocarbons (PAHs), is usually generated from fossil fuels [1,2]. This bicyclic aromatic compound is highly toxic, extremely stable, and easily enriched in several environmental districts (at ambient temperature the water solubility of NAP is 25–31 mg/L [2]). Recent investigations of the biological carcinogenic mechanism of NAP indicated that molecule-organics derived from NAP can cause DNA damage [2,3,4]. With the increasing attention to health and environmental protection, a major effort has been made in the search for efficient and environmentally friendly methods for the removal of NAP from water.
Currently, adsorption with activated carbon (AC) is one of the most practical, cost-effective, and efficacious treatments for the removal of organic contaminants from water [5,6,7]. In the development of this technology, the adsorption capacity is a critical indicator for evaluating the performance of adsorbents. Over past decades, researchers have been committed to increasing the adsorption capacity of ACs by modification with different chemicals [8,9,10,11].
Well known are the advantages of hydrophobic materials in oil recovery, water repellency, self-cleaning, anti-sticking and anti-corrosion, and so forth [12]. Fatty acids usually possess long hydrocarbon chains and terminal carboxylic functions that could physically interact with the adsorbent surface during hydrophobic modification [12,13,14,15]. Oleic acid (OA) is a widely used fatty acid for grafting on adsorbents and hydrophobic modification of materials [15,16,17]. Hu et al. fabricated a superhydrophobic surface (the water contact angle >150°) by modification of calcium carbonate using OA. The new material exhibited self-cleaning properties (the sliding angle was 1.75°). Materials where the water contact angle is larger than 150° while sliding angle is less than 10° possess self-cleaning properties [16]. Cabrales et al. successfully grafted OA onto cotton fabric and the as-modified material shows excellent water repellency (water contact angle >150°) [18]. Sathasivam and Haris modified banana trunk fibers (BTF) using OA and other three fatty acids in n-hexane at the temperature of 338 ± 5 K for 6 h. The results suggested that OA modified BTF (OBTF) exhibits the best adsorption capacity for engine oil and the Langmuir adsorption capacity of OBTF towards engine oil and dissolved organic compounds were increased by 168% (from 149.3 to 400.1 mg/g) [14]. Banerjee et al. grafted sawdust using OA and other fatty acids in n-hexane at 338 ± 2 K for 6 h, and they concluded that OA-grafted sawdust possesses the best adsorption capacity towards crude oil, and the adsorption capacity increases from 3.8 to 6.4 g/g after modification [13].
In general, the hydrophobic surface favors NAP removal from water due to the enhanced reciprocal interactions [15,17]. Zhu et al. produced an OA-grafted walnut shell by the reaction in n-hexane and this adsorbent showed the maximum partition coefficient for the adsorption of NAP than the other fatty acid (capric acid, lauric acid, and palmitic acid)-modified walnut shells, because of its lowest polarity and highest aromaticity. The NAP adsorption capacity was increased from 3890 μg/g to 7210 μg/g with OA graft [15]. There, n-hexane was used as a solvent for the esterification reaction between –COOH in OA and –OH in the activated carbon surface.
However, the reaction where traditional heating used for OA grafted on a material’s surface requires a long time in the presence of solvent [13,14,15,16]. Currently, microwave heating has been widely used for material synthesis because of the advantages like selectivity, high speed, low energy consumption, uniform-heat transfer, thus chemical reactions could occur in a short time [19,20,21]. Aguilera et al. reported microwave heating causing a significant improvement of the epoxidation kinetics of OA in the presence of H2O2 at 313–333 K in comparison to conventional heating as the selective heating by microwave leads to a higher interfacial mass transfer [22]. Kim et al. investigated the esterification between OA and methanol (1:20 M ratio) with a heterogeneous catalyst (S–ZrO2, 5 wt%) under microwave irradiation at 333 K and atmospheric pressure. The result is more than 90% conversion of the esterification obtained by microwave heating for 20 min, while it took about 130 min by conventional heating [23]. Cabrales and Abidi obtained a hydrophobic cotton fabric grafted using OA by microwave plasma for 4 min, which exhibited excellent water repellency [18]. Indeed, microwave dielectric heating is strongly promoting material surface grafting with OA.
Furthermore, in situ modification with microwave heating, an approach to optimize the physicochemical property of materials in the absence of solvents, has been widely used [24,25]. The in situ modification can not only produce the desired porosity in the material but also enhance the esterification reaction within a short period to obtain a hydrophobic surface [15,17]. Zhou et al. synthesized a microwave absorbing material by in situ polymerization and grafting of methyl methacrylate (MMA) on an ordered mesoporous carbon (OMC) in the absence of any solvent at 323 K for 10 h. As a result, the maximum absorbance efficiency of microwaves for the in situ polymerized sample (minimum reflection loss (RL) of −27 decibels) increases remarkably compared to that material prepared by the solvent mixing method (minimum RL of −10 decibels). The minimum RL is consistent with the maximum absorption of incident microwave power [24]. Liao et al. prepared poly(ε-caprolactone)/clay nanocomposites by microwave-assisted in situ ring-opening polymerization of ε-caprolactone in the presence of either unmodified clay or clay modified by quaternary ammonium cations containing hydroxyl groups in a solventless system at 393 K for 60 min. This poly(ε-caprolactone) showed significantly improved monomer conversion and molecular weight compared with that produced by conventional heating (oil bath) [25].
In our previous works [19], we prepared starch-based carbon (SC), pulverized coal (PC) from starch and coal, respectively; subsequently, starch/pulverized coal-based ACs (SAC/PCAC) have been prepared using SC and PC as raw materials. In this study, the aforementioned materials such as SC, PC, SAC ad PCAC were further modified by an in situ modification with microwave heating in absence of solvents (one-pot method, simultaneous modification by OA and KOH activation) to achieve better NAP adsorption performance. The physicochemical properties and adsorption performance of the above-prepared materials were comparatively investigated with the materials prepared by conventional modification with OA in n-hexane.
Different methods, such as Brunauer–Emmett–Teller (BET), Barrett–Joyner–Halenda (BJH) and t-plot methods, Fourier transform infrared spectroscopy (FT-IR), X-ray photoelectron spectroscopy (XPS), energy-dispersive X-ray analysis (EDAX), and scanning electron microscopy (SEM) were used to characterize the materials. The adsorption removal of NAP in aqueous solutions with the prepared materials was carried out in batch or flow mode. The batch adsorption aims to identify adsorption performance and behavior, e.g., the adsorption kinetics, adsorption isotherm, mass transfer mechanisms, pH influence, and regeneration efficiency. The flow adsorption with the ACs prepared by the one-pot method was carried out to explore their dynamic adsorption behavior. The effects of column height, flow rate, and initial concentration on the breakthrough curves were studied and the breakthrough and exhaustion points were analyzed.

2. Materials and Methods

2.1. Materials

OA (≥99%) and NAP (≥97%) were purchased from Aladdin Reagent Co. Ltd., Shanghai, China. KOH (≥99%) and ethanol (≥99%) were provided from Tianjin Guangfu Science and Technology Development Co., Ltd, Tianjin, China, and n-hexane (≥99%) was supplied by Tianjin Fuyu Fine Chemical Co., Ltd., Tianjin, China.

2.2. Preparation of Starch-Based Carbon (SC), Starch-Based Activated Carbon (SAC), Pulverized Coal (PC), and Pulverized Coal-Based Activated Carbon (PCAC)

SC, SAC, PC, and PCAC were synthesized in our previous work [19]. SC was prepared from starch by hydrothermal synthesis. PC was produced by crushing anthracite and passing it through a 100 mesh screen. SAC and PCAC were produced from SC and PC by using conventional KOH activation under microwave irradiation, respectively.

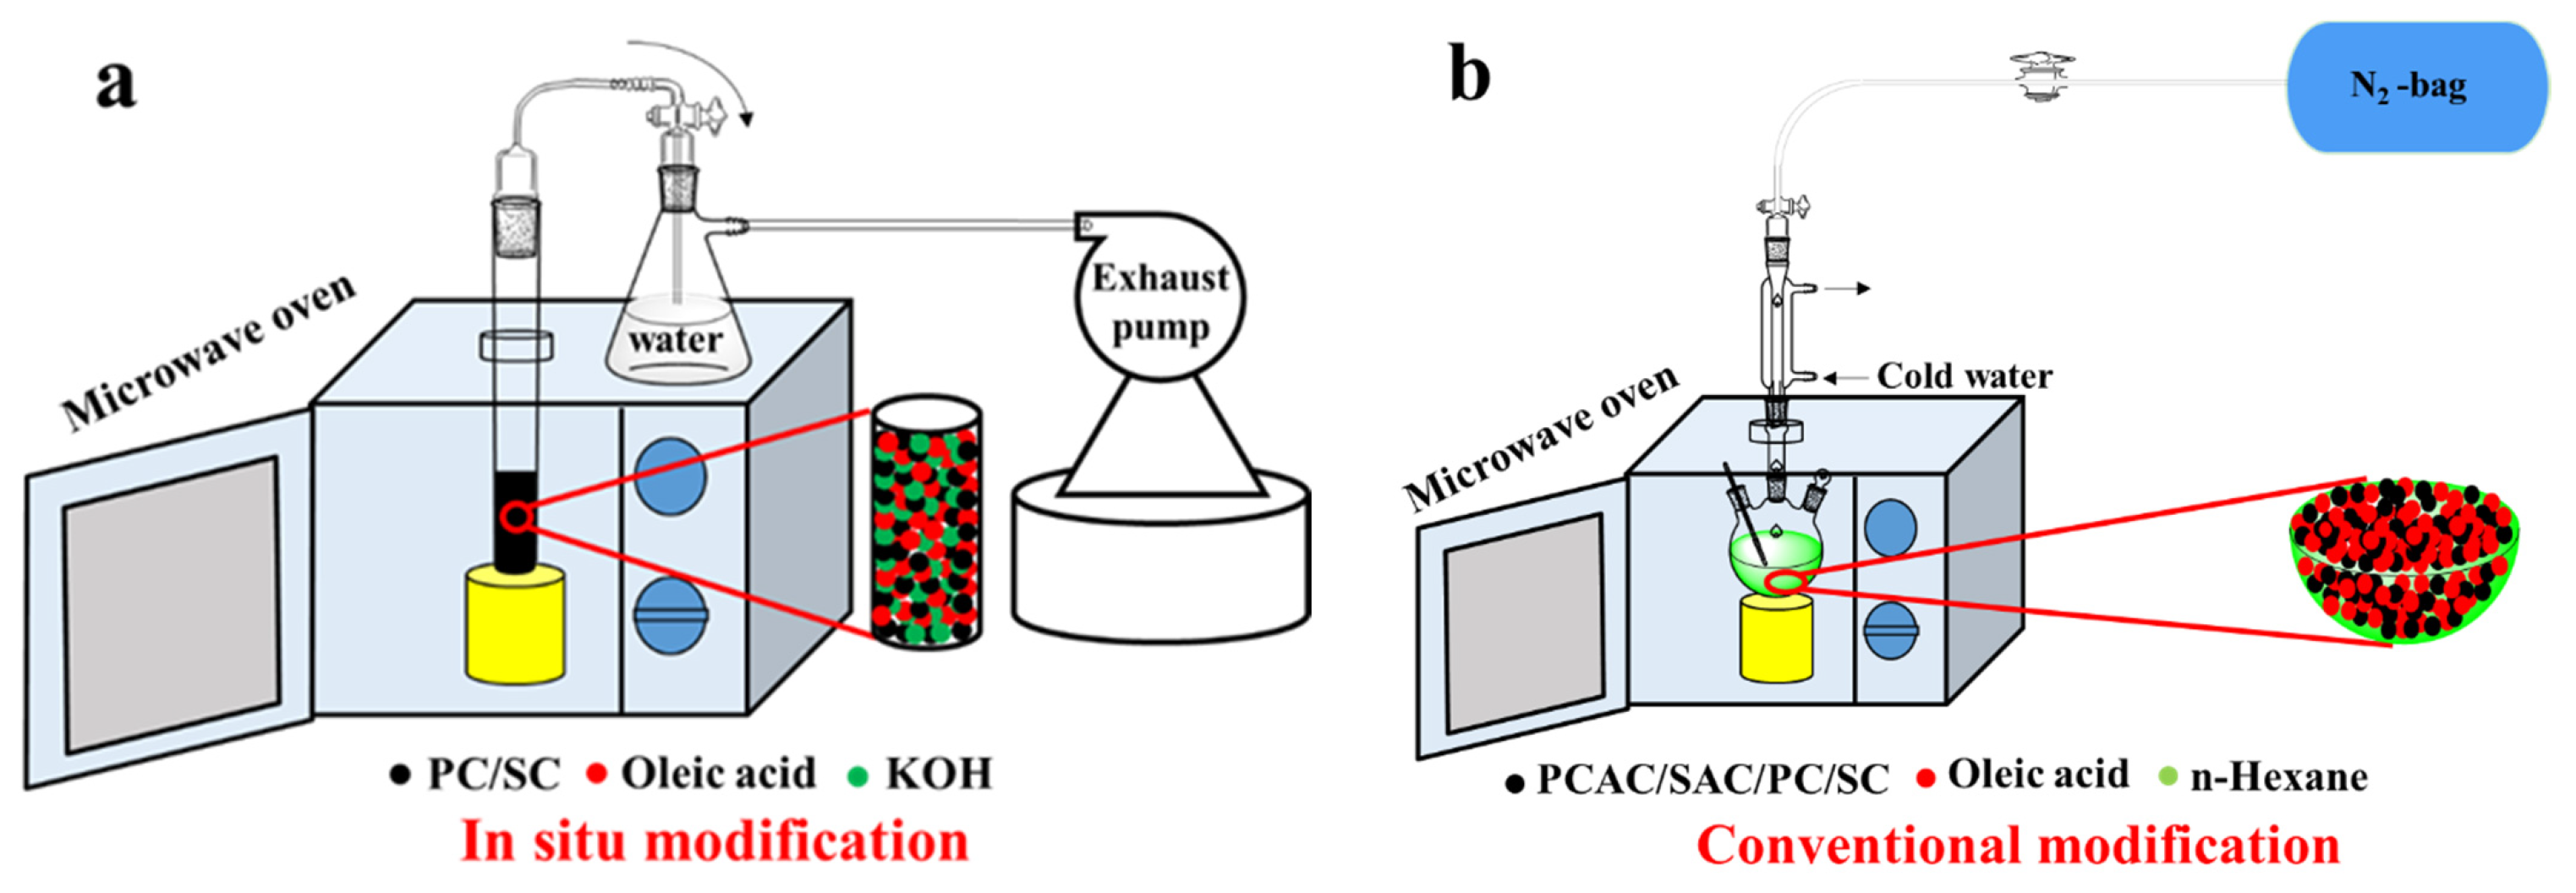
2.3. One-Pot Preparation of Activated Carbons (ACs) by Simultaneous Oleic Acid (OA) Modification and KOH Activation

The in situ modification process was performed as follows: 1.0 g OA was mixed with 5.0 g SC or PC in 50% ethanol solution. After being stirred at 338 K for 4 h and dried, 5.0 g KOH was added, then this mixture was heated by microwave irradiation for 15 min at the output power of 900 W (Figure 1a). The final product was labeled as O-SAC1 and O-PCAC1, respectively.

2.4. Modification of Materials with OA in n-Hexane

The modification of materials with OA in n-hexane was performed as follows: 1.0 g OA was mixed with 5.0 g SAC (or PCAC) in a 250 mL round bottom flask, and then 50 mL n-hexane was added as a solvent. This mixture was reacted for 40 min in a microwave reactor at 338 K under stirring at 800 rpm (Figure 1b). The final products were labeled as O-SAC2 and O-PCAC2, respectively.
All the products were subsequently filtered and washed with deionized water and ethanol until the pH of the effluent was stable at neutral. Then these products were further dried at 373 K for 24 h. and collected for the characterization and adsorption experiments.

2.5. Characterization

All raw and modified materials were characterized prior to the adsorption experiments using the following methods: BET (Micromeritics ASAP 2020 surface area analyzer), BJH and t-plot methods, FT-IR (PHI5700 ESCA spectrophotometer), XPS (PHI5700 ESCA system), EDAX (Vario EL cube analyzer), and SEM (JEOL, JSM-6490LV, Tokyo, Japan). BET, BJH, and t-plot methods were used to explore the surface area and pore characteristics of all samples to illustrate the variation via different modification paths. FT-IR and XPS were used to determine the surface functional groups to explain the relationship between surface chemical properties of adsorbents and their adsorption performance. EDAX was used to investigate the elemental composition of samples to reveal the effect of hydrophobicity on NAP adsorption performance. SEM was used to observe the sample’s surface morphology.

2.6. Adsorption Experimental Studies

2.6.1. Batch Adsorption

Batch adsorption studies were used to investigate the adsorption behaviors of NAP onto the in situ modified ACs (IMACs), including adsorption kinetics, adsorption equilibrium, the effect of pH on adsorption, and adsorbents reusability.
Adsorption kinetics experiments were carried out as follows: in a 250 mL Erlenmeyer flask, 0.015 g IMACs were mixed with 100 mL of 30 mg/L NAP aqueous solution. The flask placed in a thermostatic water bath shaker was subjected to a rotation rate of 140 rpm at 303 K for a period of 0.5, 1.0, 3.0, 5.0, 10.0, 20.0, 40.0, and 80.0 min. These kinetic experimental data were fitted to pseudo-first-order (PFO), pseudo-second-order (PSO), and Elovich (Table S2) reaction models. Weber-Morris (intraparticle diffusion) and Boyd’s (film diffusion) models (Table S2) were also used to explore the NAP mass-transfer mechanisms from the bulk solution to the active sites within the inner pores of absorbents.
To assess the isothermal behavior of NAP sorption onto IMACs, NAP solutions with various initial concentrations (10–50 mg/L, a certain amount of NAP was dissolved in a mixture of ethanol and water, v/v = 3/7) were used to produce different equilibrium concentrations for 40 min at 303 K and pH 7 with the shaking speed of 140 rpm. The mean adsorption isotherm data of NAP on adsorbents were then fitted with Langmuir and Freundlich (Table S2) models using Origin 9.0.
After adsorption, these mixtures were quickly filtered. The water samples were analyzed by ultraviolet–visible (UV-Vis) spectrophotometer at 219 nm.
The regeneration efficiency of IMACs was analyzed by 5 consecutive adsorption/desorption cycles. NAP from used adsorbents was eluted as follows: The used adsorbents were immersed in 95% ethanol solution (solid/liquid ratio = 6.5 wt%) and exposure to ultrasound field (20 kHz, 100 W, Jiekang Ultrasonic Equipment Co., Dongguan, China) at ambient temperature, and then the mixture was separated by filtration, washed and dried subsequently at 373 K overnight [11,21].

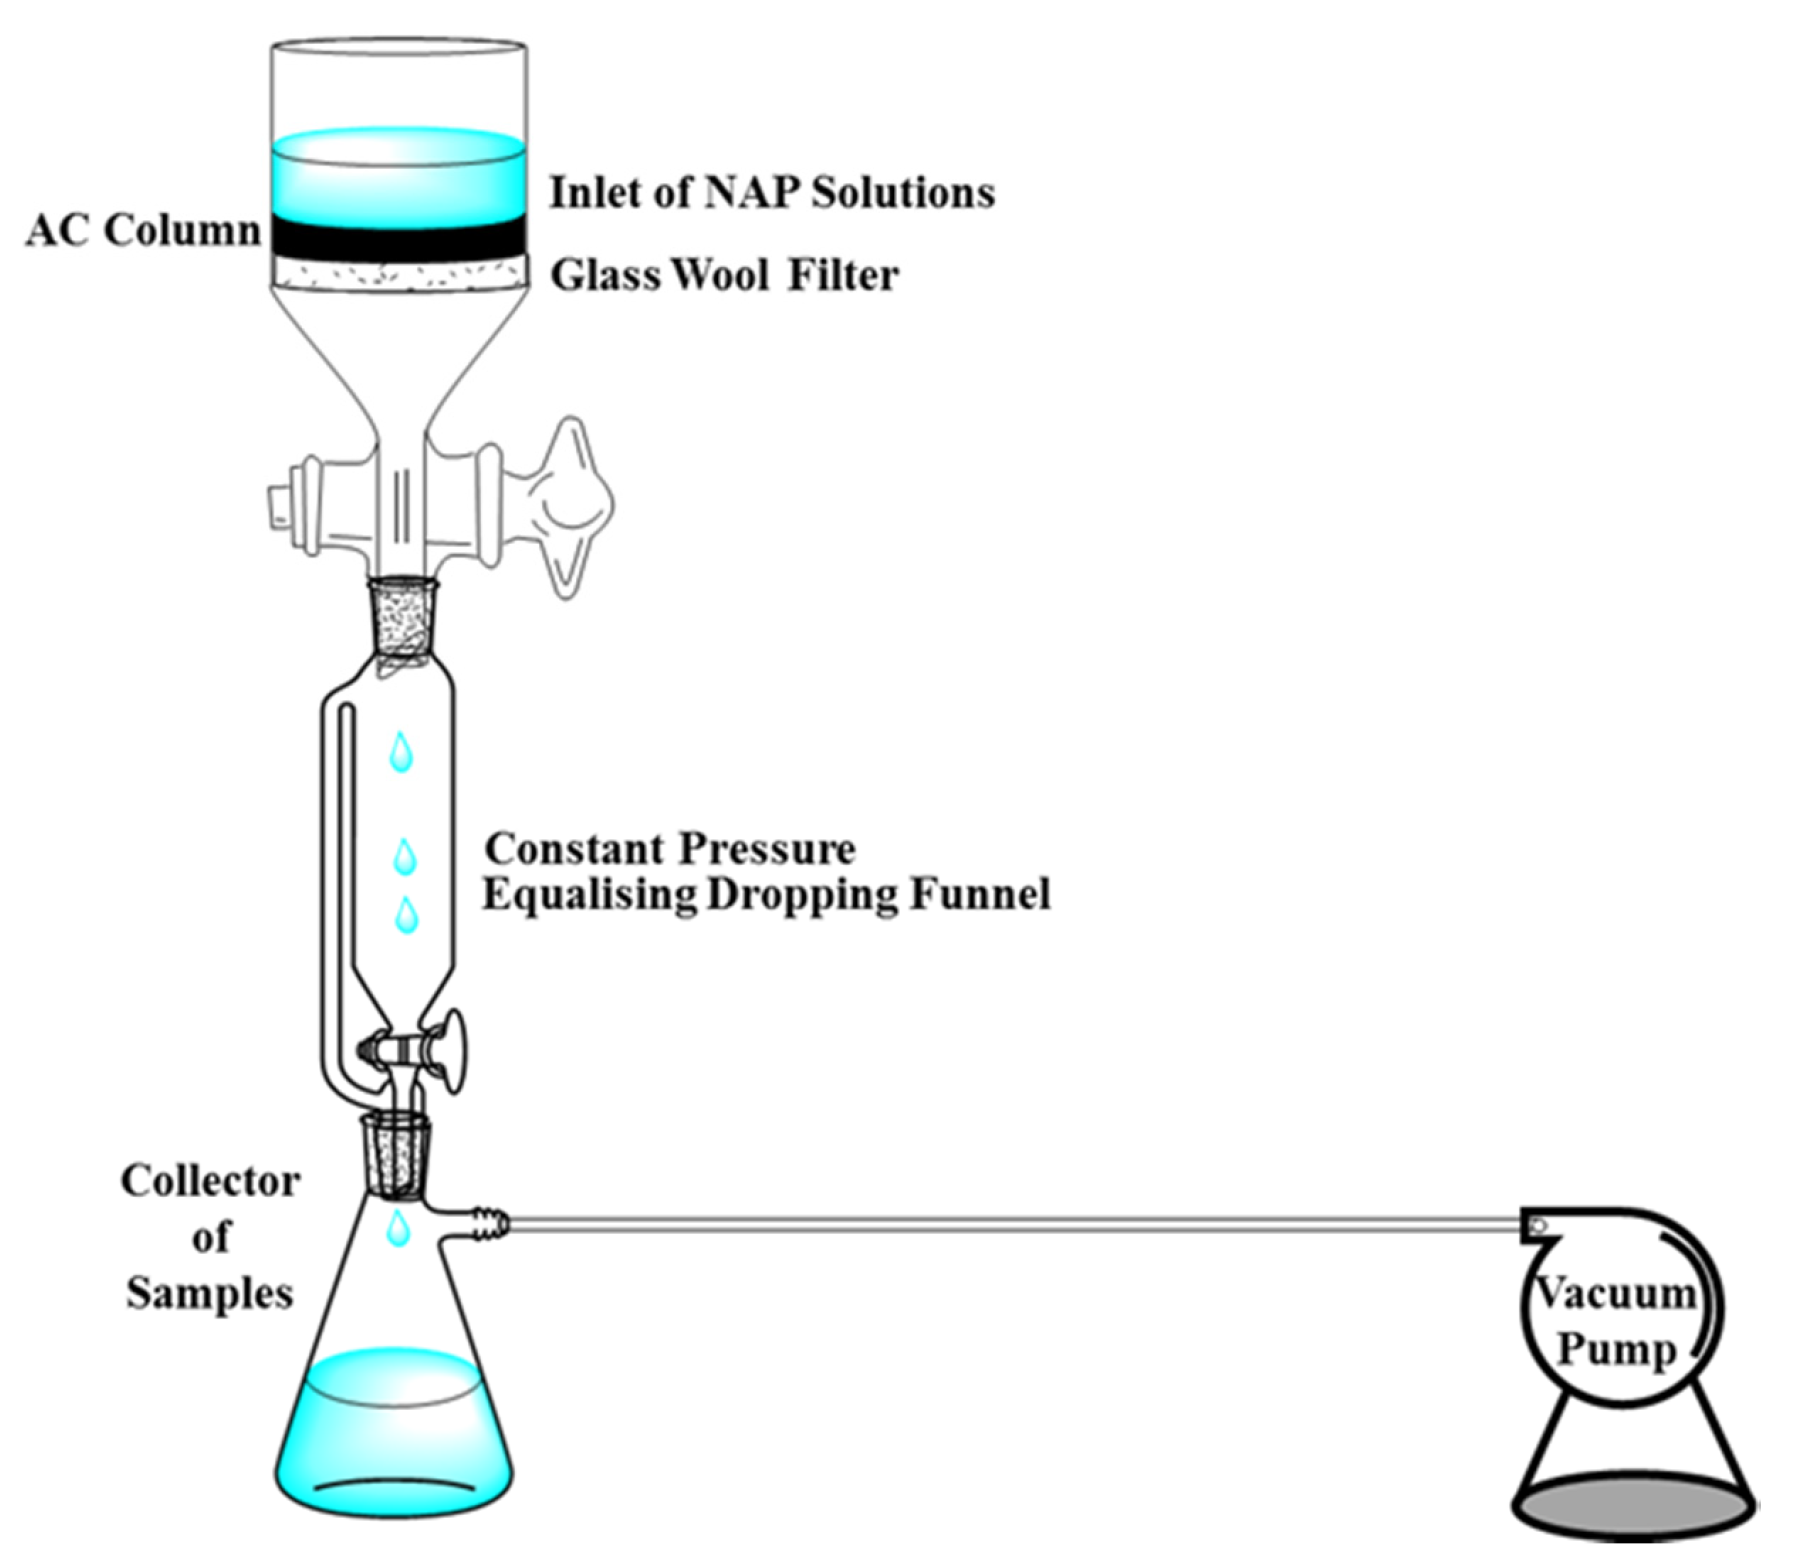
2.6.2. Column Adsorption

Column adsorption experiments were undertaken using a glass column (20.0 cm length, 1.5 cm internal diameter), and some glass wools were placed at bottom of the column to prevent the outflow of IMACs (Figure 2). The fixed-bed was infiltrated with deionized water for 15 min to guarantee that the adsorbent samples could be appropriately filled to minimize non-uniform flow [26,27]. Then a NAP working solution was continuously fed in a downward-flow mode into the column by a vacuum pump (SHB-III, Zhengzhou Great Wall Science and Industry Co., Ltd., Zhengzhou, China). The influent contained varying NAP concentrations (10, 20, and 30 mg/L) passed through different column bed-heights (1, 2 and 3 cm) using three flow rates (1, 2, and 3 mL/min). Samples were collected periodically to explore these factors’ effects on column adsorption with the assistance of a UV-Vis spectrophotometer [27,28,29].

2.7. Data Analysis

The adsorption capacity equilibrium, qe (mg/g), for NAP was determined using Equation (1):
q e = ( C 0 C e ) V m
where C0 is the initial NAP concentration, Ce (mg/L) is the equilibrium NAP concentration, V (L) is the volume of the NAP solution; m (g) is the mass of adsorbents used.
All experiments were carried out in triplicate, and the data were reported as means. Root mean square error (RMSE) tests were used to analyze the errors within the data (see Equation (S1) in Supplementary Materials).
The breakthrough time (tb) was taken when the outlet NAP concentration (Ct, mg/L) attained 5% of the inlet concentration (C0, mg/L), while the exhaustion time (te) was determined when the effluent NAP level reached 95% of the inlet concentration. The maximum column capacity (qtotal, mg) for a given set of conditions was calculated from the area under the plot for the adsorbed NAP concentration, C0Ct, versus time, as given by:
q total = QA c 1000 = Q 1000 t = 0 t total ( C 0 C t ) d t
where ttotal is the total flow time (min), Q is the flow rate (mL/min) and Ac is the area under the breakthrough curve (cm2) [26,27]. The equilibrium uptake was calculated using the following:
q Eq = q total W
where qEq (mg/g) and W (g) are the amount of NAP adsorbed per unit dry weight and the total amount of IMACs in the column, respectively. The data of dynamic adsorption were fitted using Thomas and Adams–Bohart models (Table S2).
All experiments were carried out in triplicate, and the data were reported as means. RMSE tests were used to analyze the errors within the data (see Equation (S1) in Supplementary Materials).

3. Results

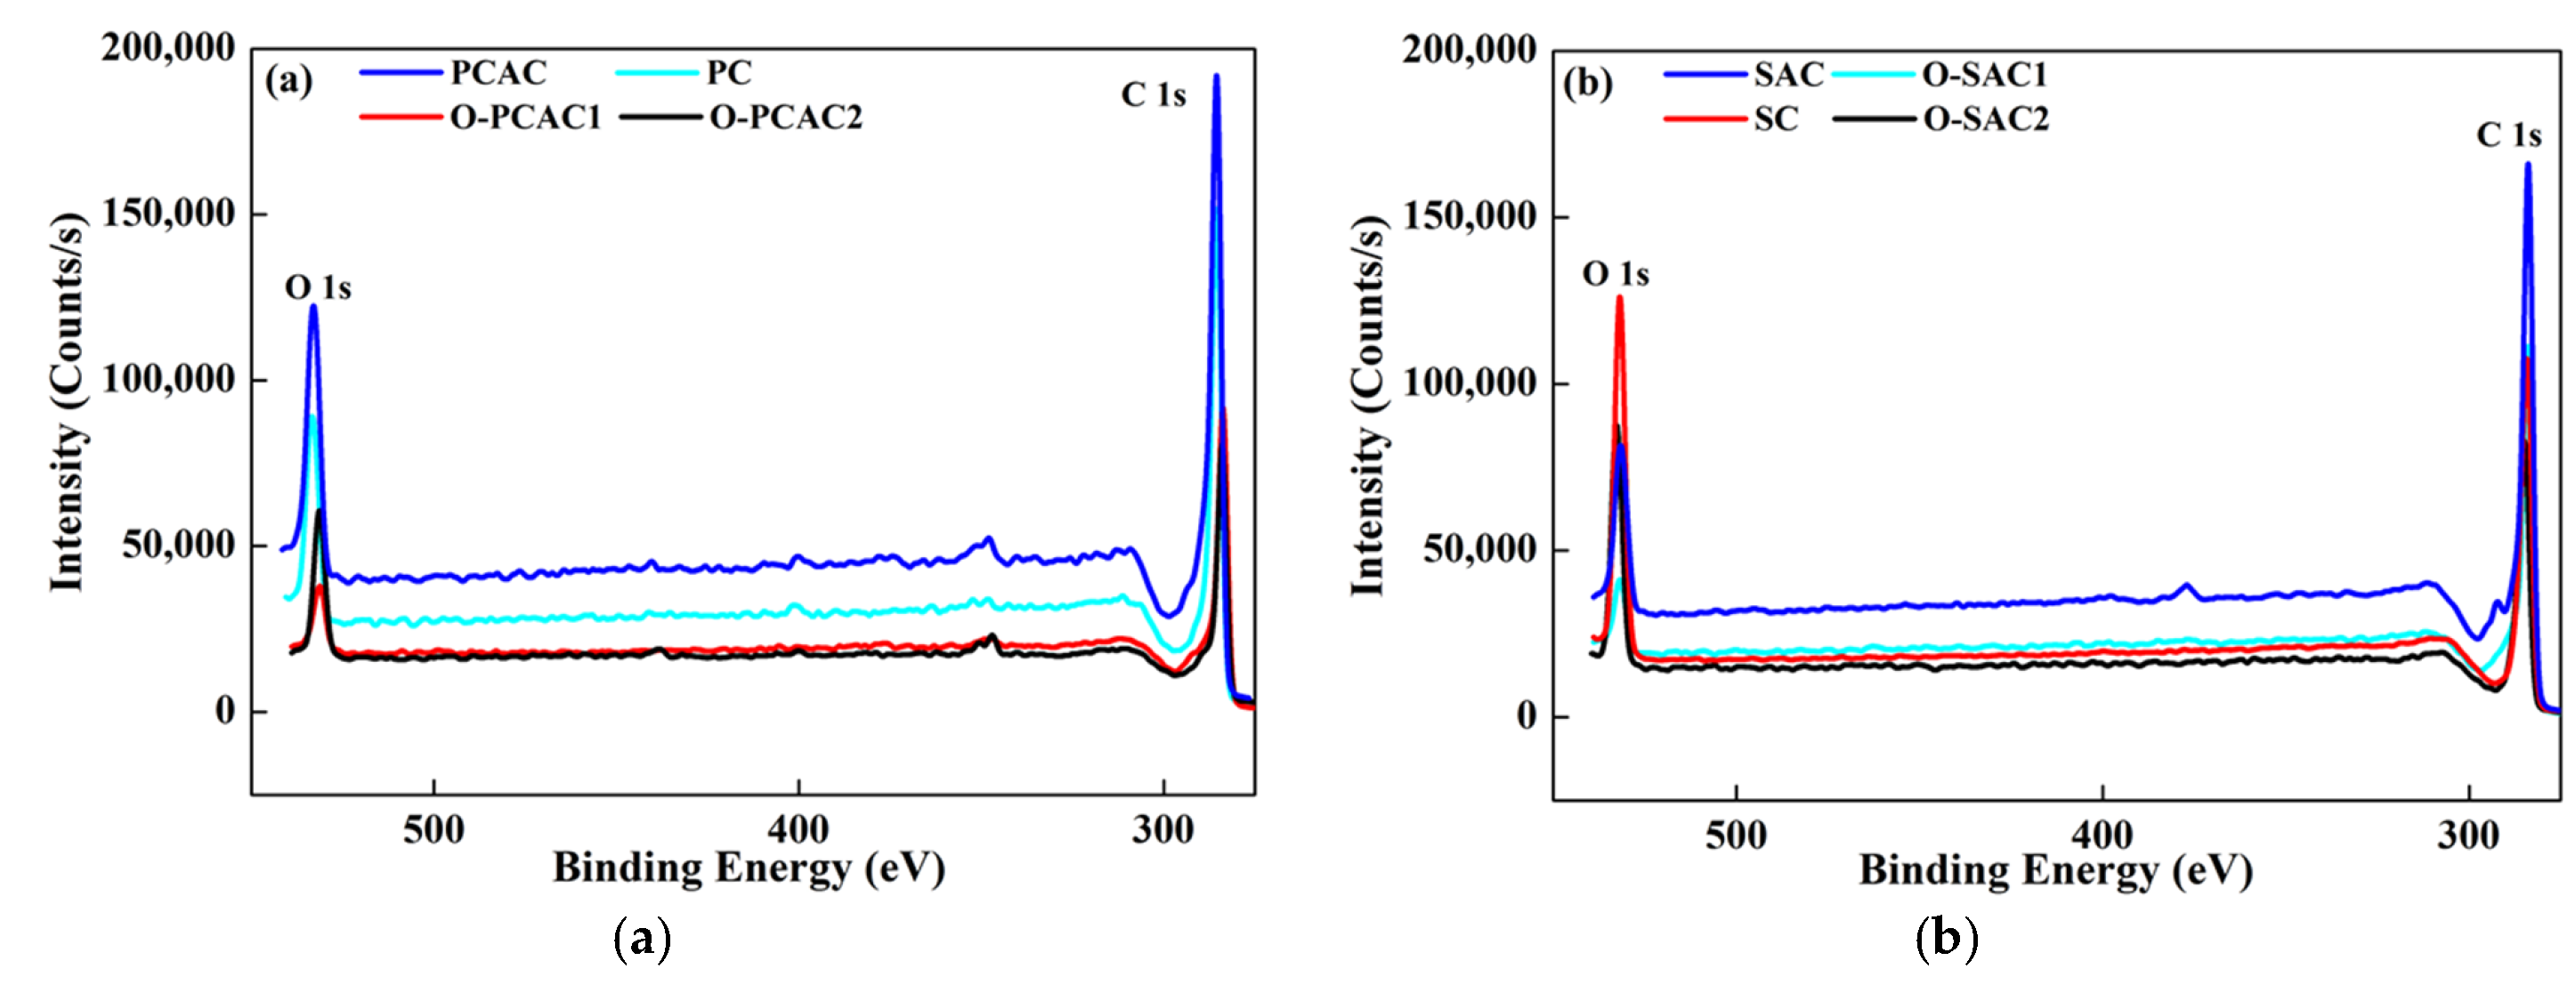
3.1. Characterization of Materials

N2 physisorption isotherms of the raw and modified adsorbents are presented in Figure S1. PCAC, SAC, O-PCAC1, O-PCAC2, and O-SAC1 show a Type I isotherm, indicating the presence of micropores and some narrow mesopore, rather than monolayer adsorption [30]. In contrast, SC, PC, and O-SAC2 clearly showed a Type II isotherm, which corresponds to the filling of ‘micropores’, rather than monolayer adsorption [21,30,31]. The main textural parameters, BET specific surface area (ABET), micropore specific surface area (AMicro), external specific surface area (AE), total pore volume (VTotol), micropore volume (VMicro), mesopore volume (VMeso), and average pore size (APS) of all materials considered in this study are listed in Table 1.
As listed in Table 1, all adsorbents were essentially mesopores and the APSs are in the range of 2.12–12.97 nm. Compared to precursor materials (SAC and PCAC), IMACs (O-SAC1 and O-PCAC1) exhibited greatly increased BET specific surface area and pore volumes, while the opposite results were observed for O-SAC2 O-SAC2 and O-PCAC2 [18,19]. The increased ABET may contribute to the change of the original pore structure during the grafting process under microwave irradiation [11,15]. The decreased ABET may be attributed to the adhesion of the water-insoluble modifier to the pores of the adsorbents, and the micropores are blocked preferentially according to the report [32], while the modifier in the micropores and mesopores are pyrolyzed with the catalysis of KOH at high temperature during the in situ modification. These blocked pores in conventional modified ACs are considered a disadvantage to NAP adsorption and mass transfer in adsorbents. The increased ABET of IMACs can provide more adsorption sites resulting in a high NAP adsorption capacity. Hence, the improved surface areas in IMACs are expected to be a favourable factor for the removal of NAP from water [33].
Figure 3 displays the XPS spectrums of raw and modified adsorbents, and two main peaks were identified and labelled as C 1s and O 1s. Assignments and peak parameters of different O 1s components of adsorbents are listed in Table 2. As we can see, there were significant differences in the C=O, C–O, R–O*–C=O, and O*=C–OH concentrations in peak I, II, III, and IV at 531.2, 532.4, 533.3, and 534.3 eV in the O 1s spectrum, respectively [34].
Compared with raw materials, an increase in C contents and a slight decrease in O contents were observed in modified adsorbents (Figure 3). Moreover, the modification using OA influenced the surface functional groups on adsorbents [21,34]. As listed in Table 2, the content of functional groups of –C=O, and R–O*–C=O on O-SAC1 and O-PCAC1, significantly increased over those onto SAC and PCAC, resulting in a positive influence on the adsorption of NAP. In particle, the content of O*=C–OH in O-PCAC1 reached 20.9%, which was much higher than that in PCAC (8.7%). In contrast, the content of O*=C–OH in O-SAC1 was only 12.3%, which was much lower than that in SAC (30.4%). Probably, it is the reason that the adsorption performance of O-PCAC1 is better than that of O-SAC1. Such functional groups were verified via FT-IR analysis (Figure S2 and Table S1).
The elemental composition of raw and modified adsorbents obtained from EDAX analysis are summarized in Table 3. A previous study showed that H/C and [O + N]/C (or O/C) can be used to evaluate aromaticity and polarity of adsorbents, respectively [15,34].
The high values of C% (>56.9) and O% (>20.2) confirmed that all these materials are dominated by C structures probably with various O-containing functional groups on their surface.
According to Zhu et al., adsorbent where H/C < 0.5 is seen as a hydrophobic material [15]. Obviously, the H/C ratios of adsorbents prepared in this work were in the range of 0.012–0.068, indicating the presence of unsaturation C-chain and aromatic structures, which promotes the adsorption of NAP.
Low [O+N]/C (or O/C) of O-PCAC1 after in situ modification suggests that the modification of ACs during KOH-activation using OA under microwave heating is a feasible method to prepare superhydrophobic adsorbents [15,34].
SEM images of raw and modified adsorbents are shown in Figure S3 and noticeable differences can be found. O-PCAC1 and O-SAC1 showed well-developed visible pores in micrometer ranges, while O-SAC2 and O-PCAC2 exhibited blocked pores. An inevitable consequence of using a blocked-pore adsorbent is a significant decline in the mass transfer of NAP between solution and adsorbent surface followed by a decrease in adsorption capacity [32,33].

3.2. Batch Adsorption

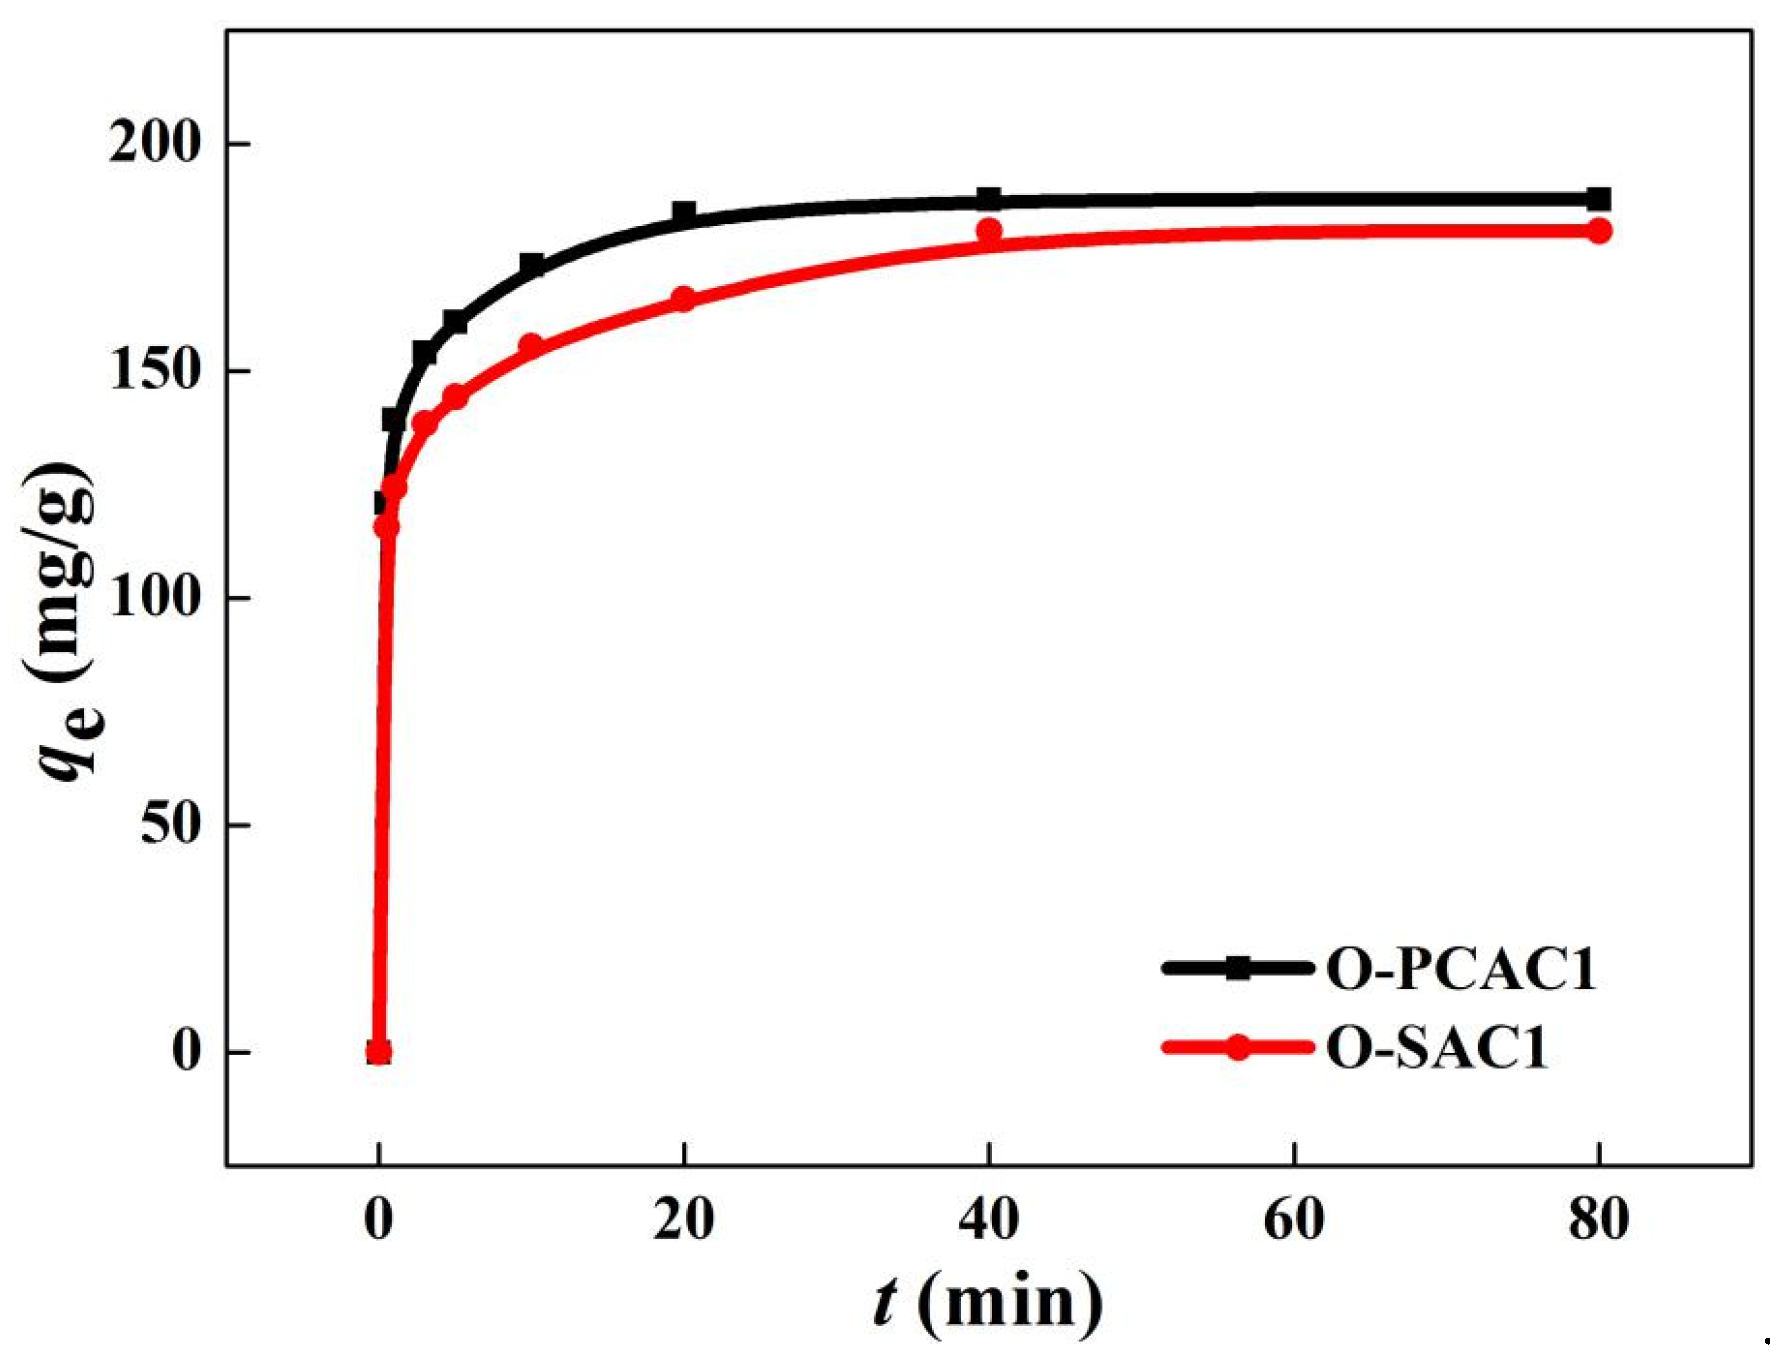
3.2.1. Adsorption Kinetics

Figure 4, Figure S4, and Table 4 give the kinetics data for the adsorption of NAP onto IMACs at pH 7. The adsorption reached equilibrium after 40 min, which is similar to the previous study [21]. Figure 4 illustrates that the adsorption rates rapidly increased at the beginning (0–10 min), and then it slowed down until achieving the adsorption equilibrium. In Table 4, the PSO model (low RMSE and high correlation coefficients R2) exhibits a better description of the kinetics data than Elovich and PFO models [15]. Moreover, the PSO model is considered to be usable in the whole adsorption range [21]. Herein, the qe values of O-SAC1 and O-PCAC1 are 180.8 and 187.8 mg/g, respectively. The NAP adsorption capacities of our and other adsorbents were evaluated and compared in Table 5. The high adsorption capacity (qe) of these two IMACs can be attributed to their high pore volumes and surface areas.

3.2.2. Adsorption Isotherms

The equilibria data of the NAP adsorption on IMACs were non-linearly fitted to both the Langmuir and Freundlich isotherm equations. The good Freundlich isotherm fit (lower RMSE and higher R2) in Figure S5 and Table 6, implies a multilayer NAP adsorption with non-uniform distribution of adsorption heat/affinities alongside a heterogenous surface following different energy sites on the selected adsorbents [6,15,35,37,38]. The surface heterogeneity (1/n) values were 0.3433 for O-SAC1 and 0.4156 for O-PCAC1, where both of them are below unity suggests an excellent adsorption capacity [38,39]. This result can be attributed to π–π electron interaction between NAP molecules and aromatic cores on the surface of adsorbents [12].

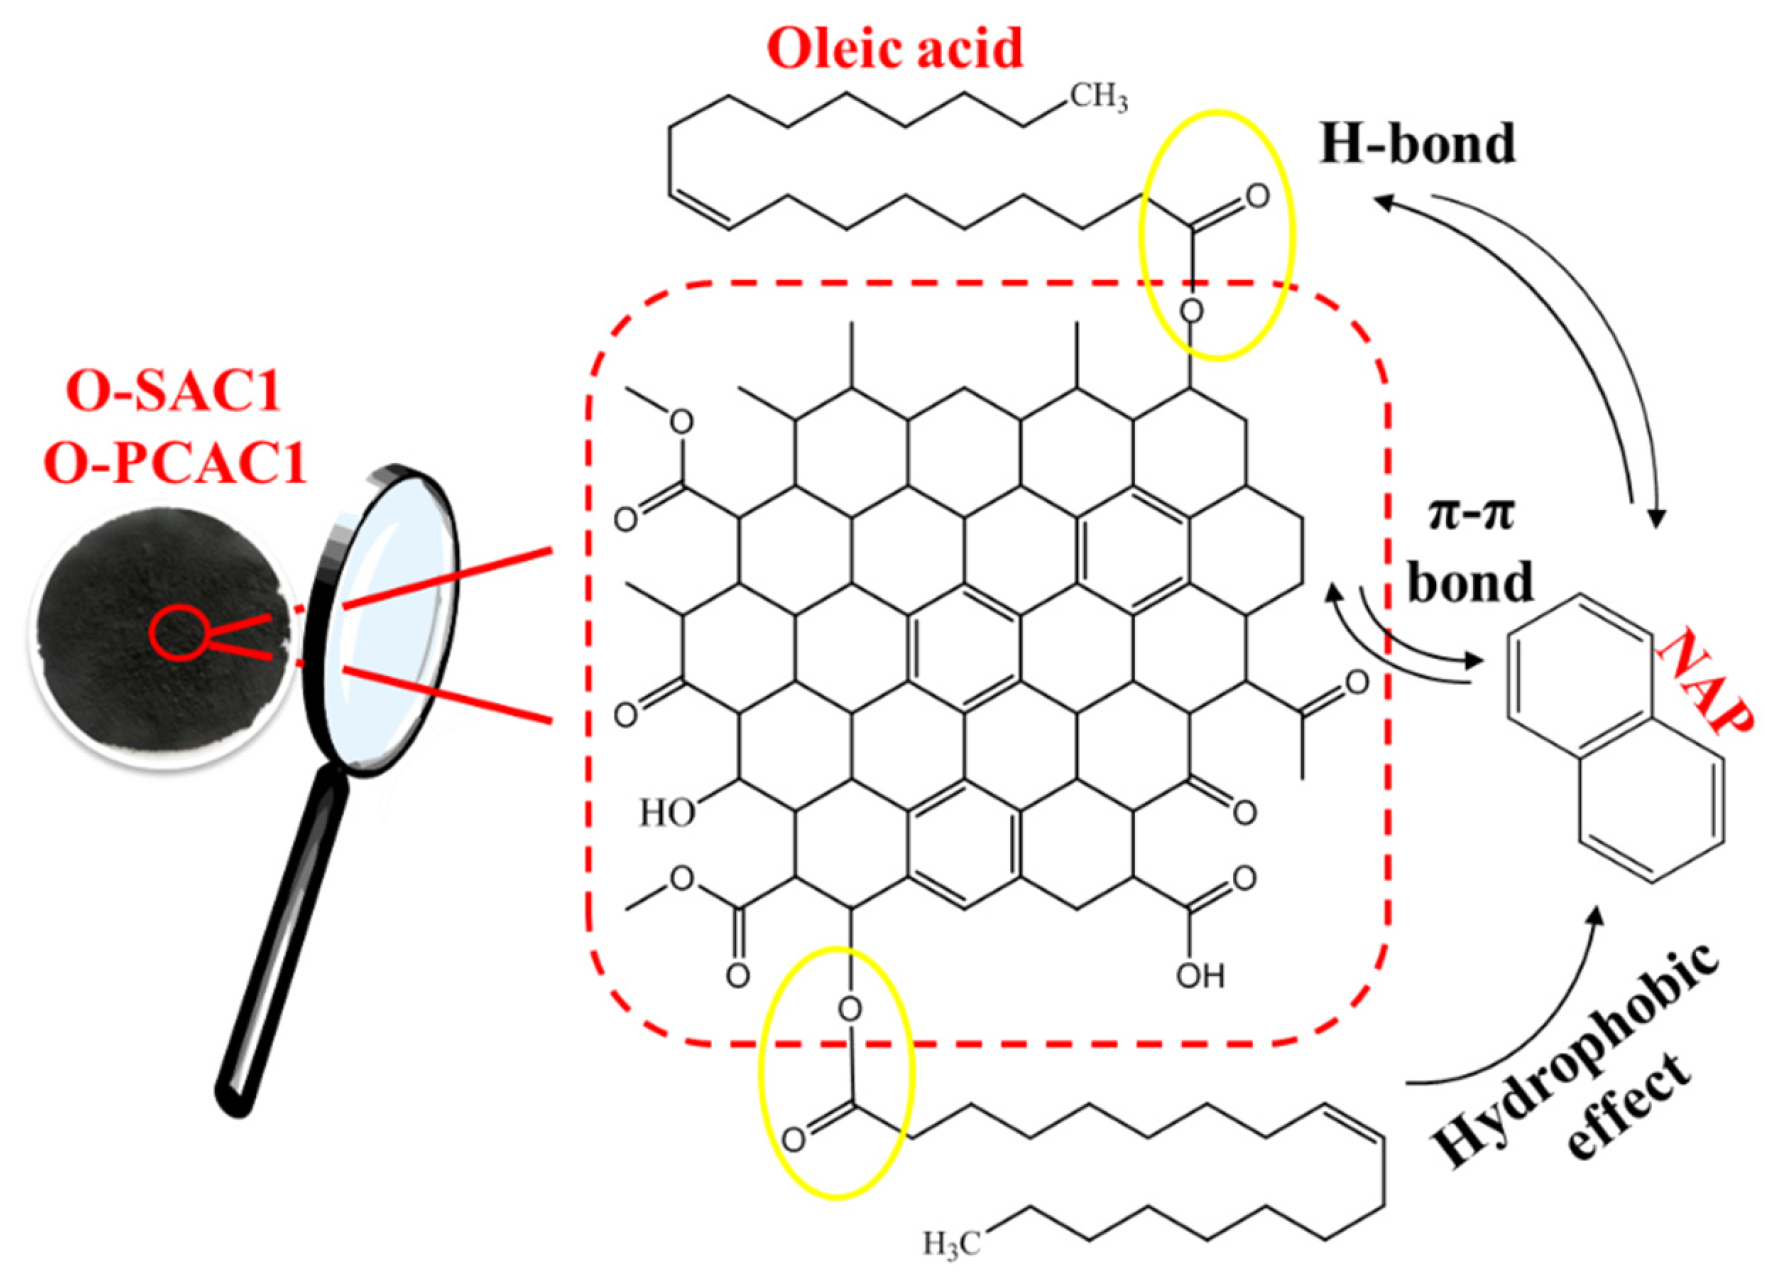
3.2.3. Adsorption Mechanism

Figure S6a shows the kinetics data fitted by Weber-Morris model. It can be noticeably seen that three consecutive steps occurred during the NAP adsorption on IMACs [12]. Indeed, the initial rapid part is associated with NAP transfer from the bulk solution to the external surface of used adsorbents; at the second phase, NAP moves into the inner pores of adsorbents; In the final stage, the adsorption equilibrium takes place [12]. Specifically, KPi represents the calculated diffusion rate parameter at different stages (slope of t0.5 vs. qt.exp), and it implies the rate of the adsorption process. From Table S3, where the first stage diffusion rates (KP1) are significantly higher than that of the second stage (KP2) as there are a large amount of fresh sites on the surface of the adsorbent at the beginning followed by efficient adsorption resulting from capillary and film diffusion. Specifically, the similar KP2 of O-PCAC1 (11.20 mg/g min1/2) O-SAC1 (10.04 mg/g min1/2) indicating a similar adsorption rate towards NAP as well as the same adsorption equilibrium time (40 min). This result is mainly attributed to their closer micropore properties, such as AMicro, VMicro, and APS. The higher AMicro proportion of O-PCAC1 and O-SAC1 also demonstrating there are more fresh sites provided by adsorbents for NAP during the second stage adsorption process (Table 2) [12,40]. Subsequently, due to the weak concentration gradient between solid and liquid interface, it is difficult for NAP diffusion to the residual active sites, and the adsorption thus became inefficient. Consequently, both inside and surface-active sites are involved in the adsorption process. According to KPi, the NAP adsorption capacities of IMACs are governed by the second stage. This means that the intraparticle diffusion is the rate limit steps before the adsorption equilibrium was reached [12,40,41].
The kinetics of O-PCAC1 are linearly fitted by Boyd’s model, while the kinetics of O-SAC1 is linearly fitted by Boyd’s model after a short lag phase (Figure S6b and Table S2). As observed, both the lines for IMACs indeed do not pass through the origin regardless of their linearity extents, demonstrating that the film diffusion is the rate-limiting step [37]. Additionally, this analysis supports the isotherms results.
NAP adsorption performances of IMACS exhibit low pH dependence (see Section S7 and Figure S7 in Supporting Information). The adsorption is believed to contribute to varying factors [12,21], as follows: (a) π–π bond. It is considered an intensive factor for NAP adsorption. Both C and O atoms in -COOR-, which are produced from OA and other analogous intermediate acids during the in situ modification, show sp2 hybridization with two unshared electron pairs, providing several fresh ‘π-orbital’ as the active site. These vacant ‘π-orbital’ interweave react building a superhydrophobic surface improving NAP adsorption on the hydrophobic surface of IMACs; (b) H-bond. The high electronegativity of O atom in ester is possible to form a strong H-bond with NAP molecule; (c) hydrophobic effects. The roles of the hydrophobic effect become more important due to the low polarity of NAP molecule and the strong affinity with C18 alkyl chain on the adsorbent surface. Nevertheless, the mass transfer inside and outside the capillary and pore is the dominant process when the surface of the exterior superhydrophobic C18 alkyl chain reached the largest NAP adsorption capacity; (d) Acidic functional group. As discussed in FT-IR and XPS analysis, the low acidic group in adsorbents favours NAP adsorption from water. The adsorption mechanism for NAP adsorption on IMACs is presented in Figure 5.

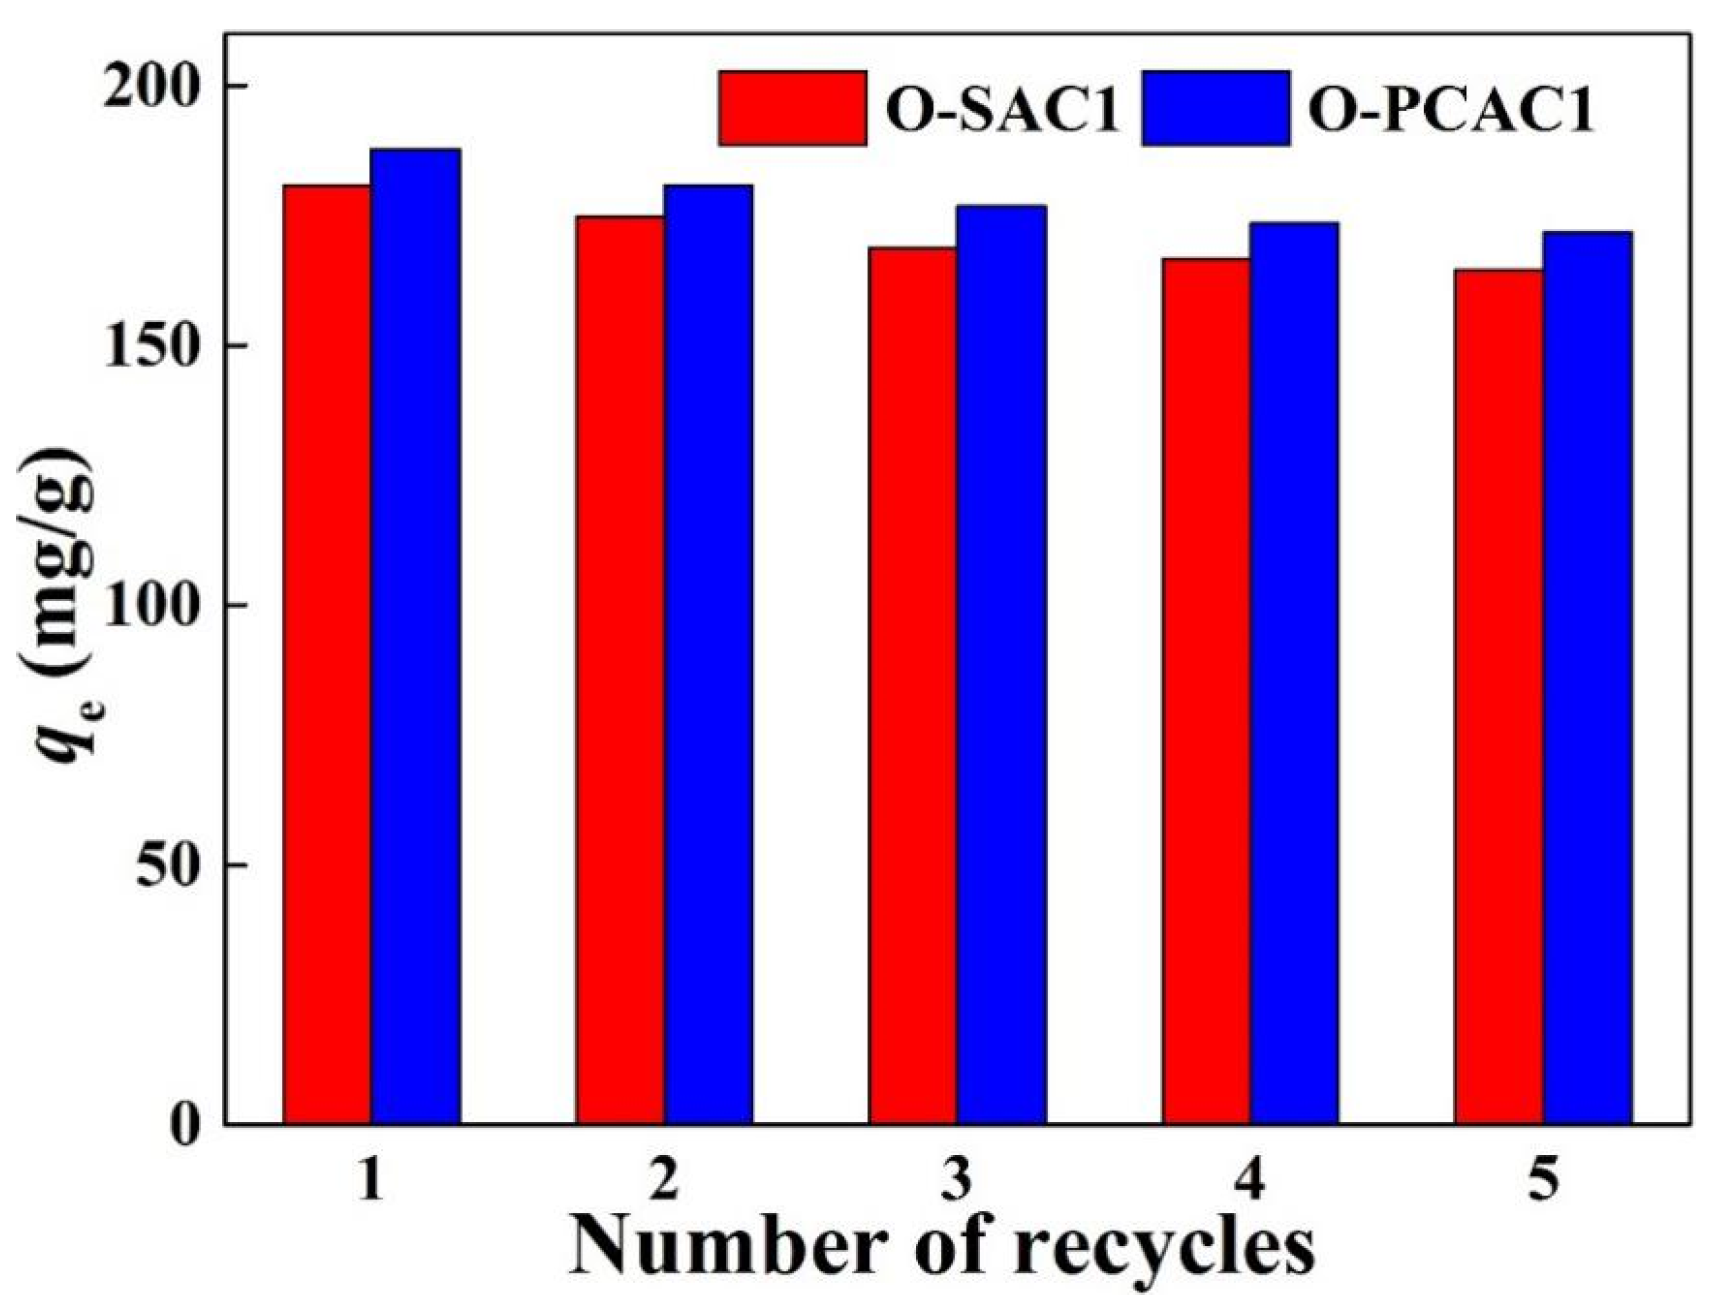
3.2.4. Regeneration of In Situ Modified Activated Carbons (IMACs)

Herein, the regeneration of IMACs was performed to assess process efficiency and desorption behaviour of adsorbents [11,27]. From Figure 6, the NAP adsorption capacity slightly reduced with the recycle times of IMACs for the adsorption/desorption with 95% ethanol solution, and the adsorption capacity of NAP after 5 adsorption–regeneration recycles was 166.75 mg/g for O-SAC1 and 173.5 mg/g for O-PCAC1, and the corresponding loss of the adsorption capacity was 6.64% and 3.68%, respectively. Thus these adsorbents can be reused at least 5 times for NAP removal from water with excellent adsorption performance [32]. Additionally, the method of alternately washing with alcohol-deionized water is confirmed as a good choice for the regeneration of NAP-exhausted adsorbents [11].

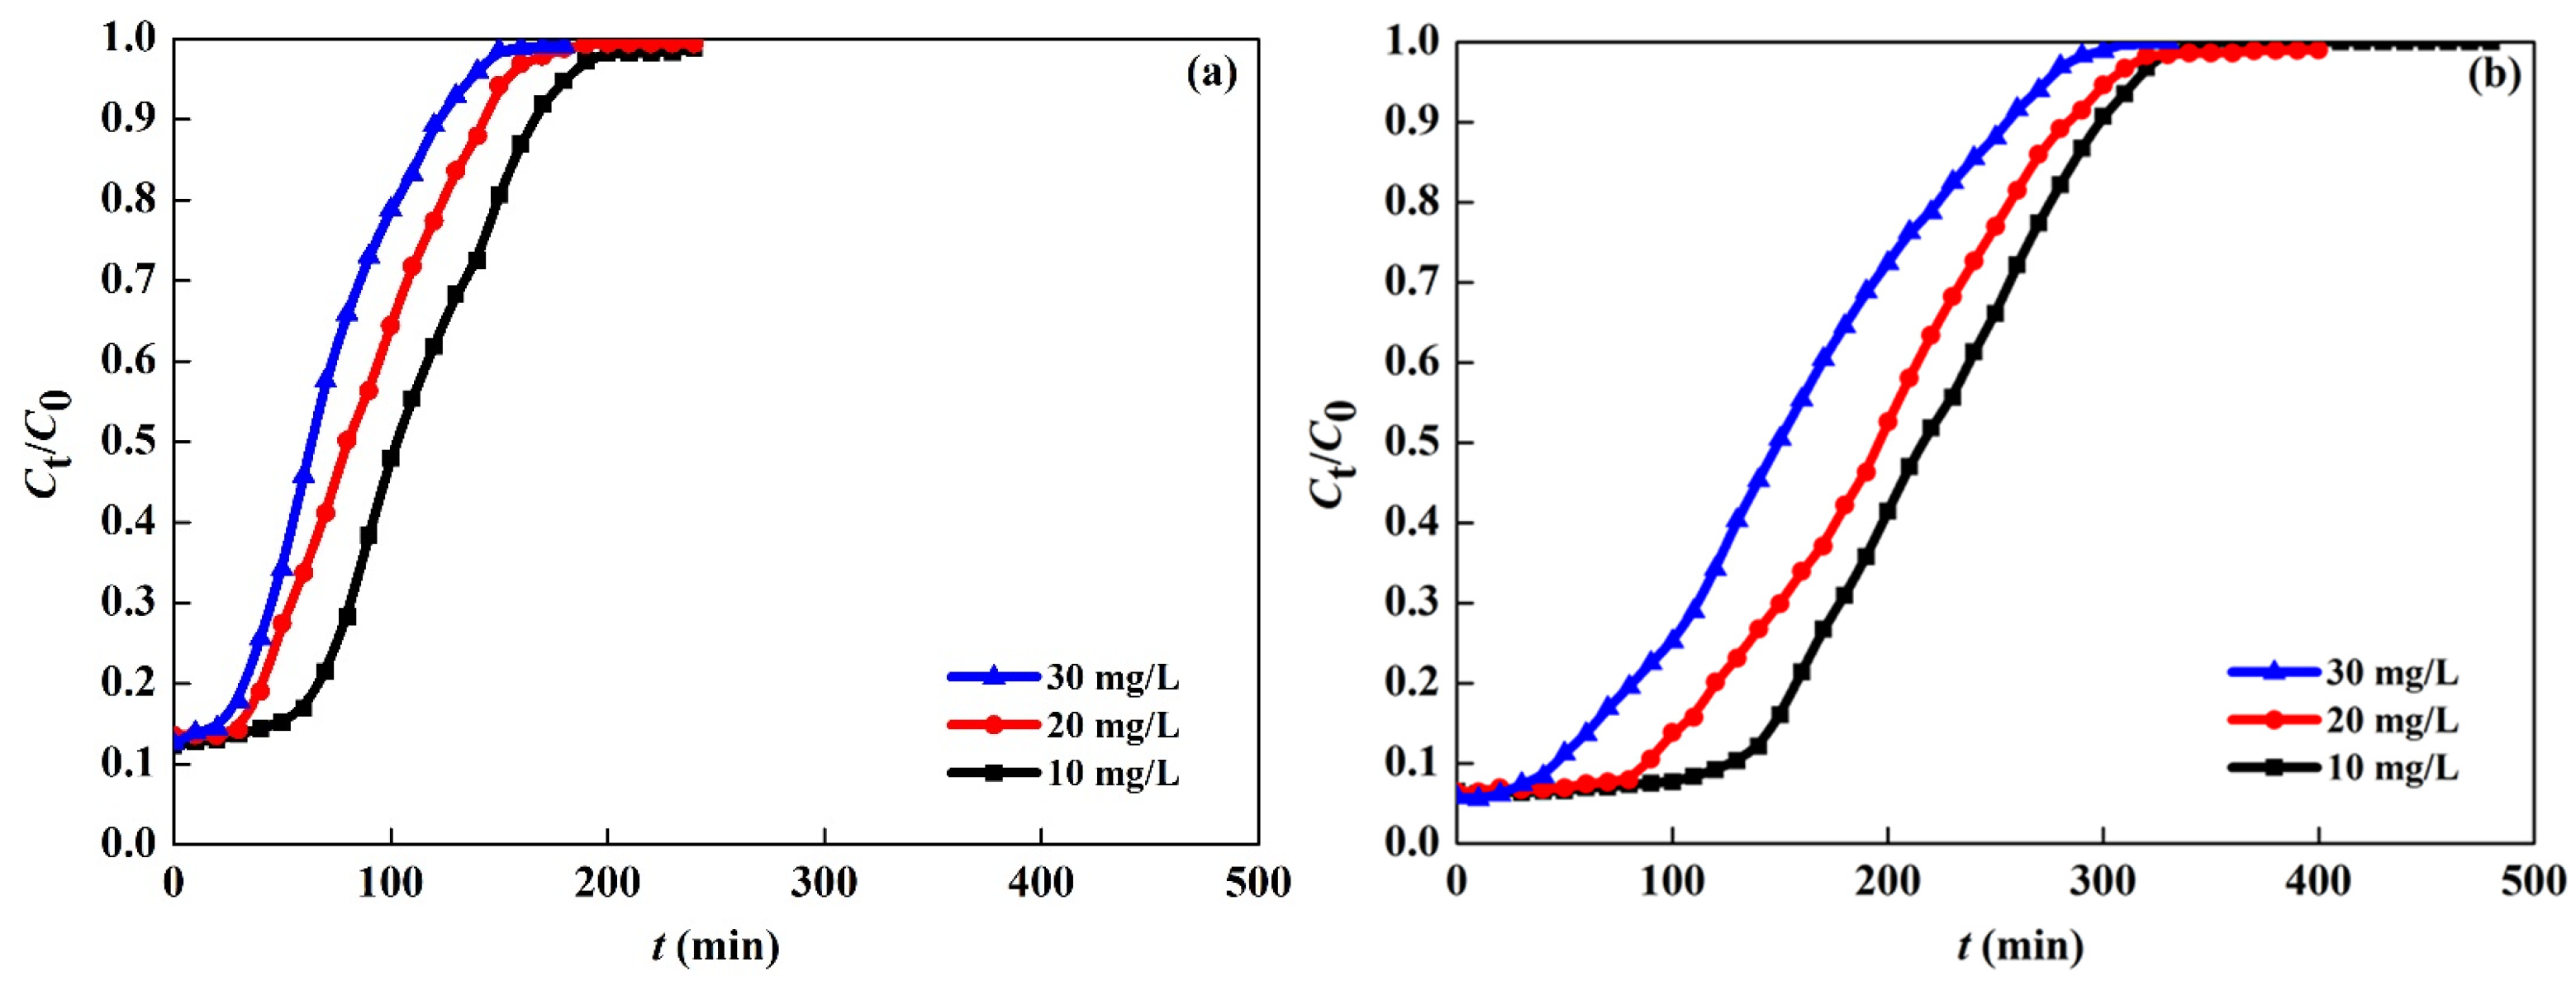
3.3. Column Adsorption

The flow rate, column height, and the initial concentration can influence the mass transfer of NAP between solid/liquid phases [27]. In this study, the effects of the above-mentioned factors on the dynamic adsorption behaviour of NAP onto IMACs under continuous flow were investigated [26].

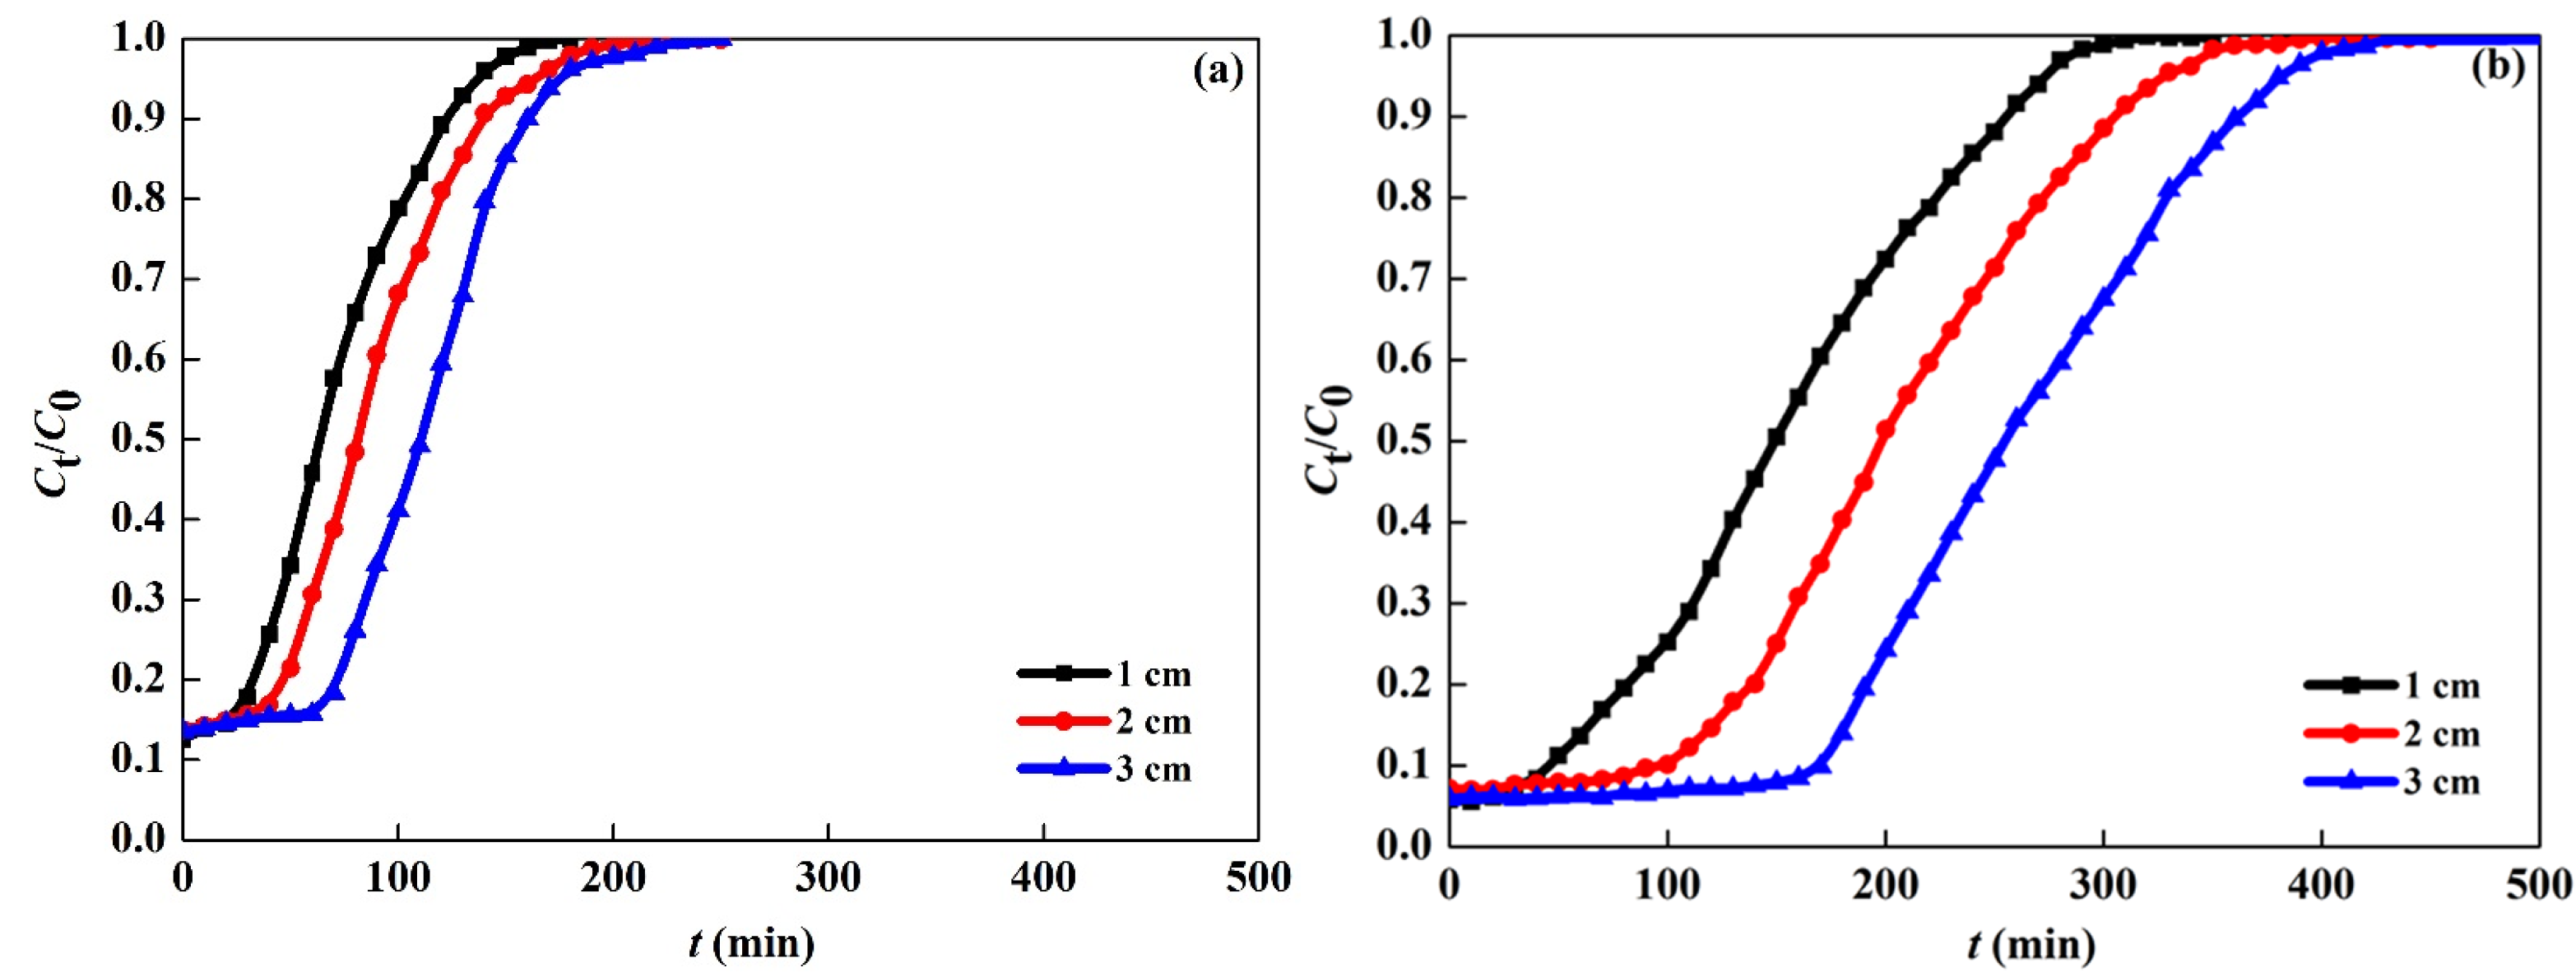
3.3.1. Effect of Column Height

Figure 7a,b show typical O-SAC1 and O-PCAC1 breakthrough profiles for the NAP adsorption studied at different column bed heights (1, 2, and 3 cm). A foreseeable consequence of increasing the column bed heights is a significant extension in tb and te of breakthrough curve [28]. The profiles of both adsorbents exhibit a deep extension in tb and te, alongside a right-shifted breakthrough curve with an increasing column height. The benefit of the increasing column height to NAP adsorption is caused by the wider service zone and more effective binding sites of adsorbents [27]. As observed, there are faster breakthrough points at shorter column height. Specifically, the breakthrough and exhaustion time increased from 10 and 170 min to 50 and 220 min for O-SAC1, while those increased from 20 and 310 min to 160 and 430 min for O-PCAC1, respectively. Increasing column height reduces the axial dispersion in mass transfer and improves the adsorbate diffusion into the adsorbent, thereby the longer breakthrough and exhaustion time occurred [27]. Additionally, the reduction of NAP adsorption capacity with the increasing column height most probably was caused by the increased mass of adsorbents [29,42].

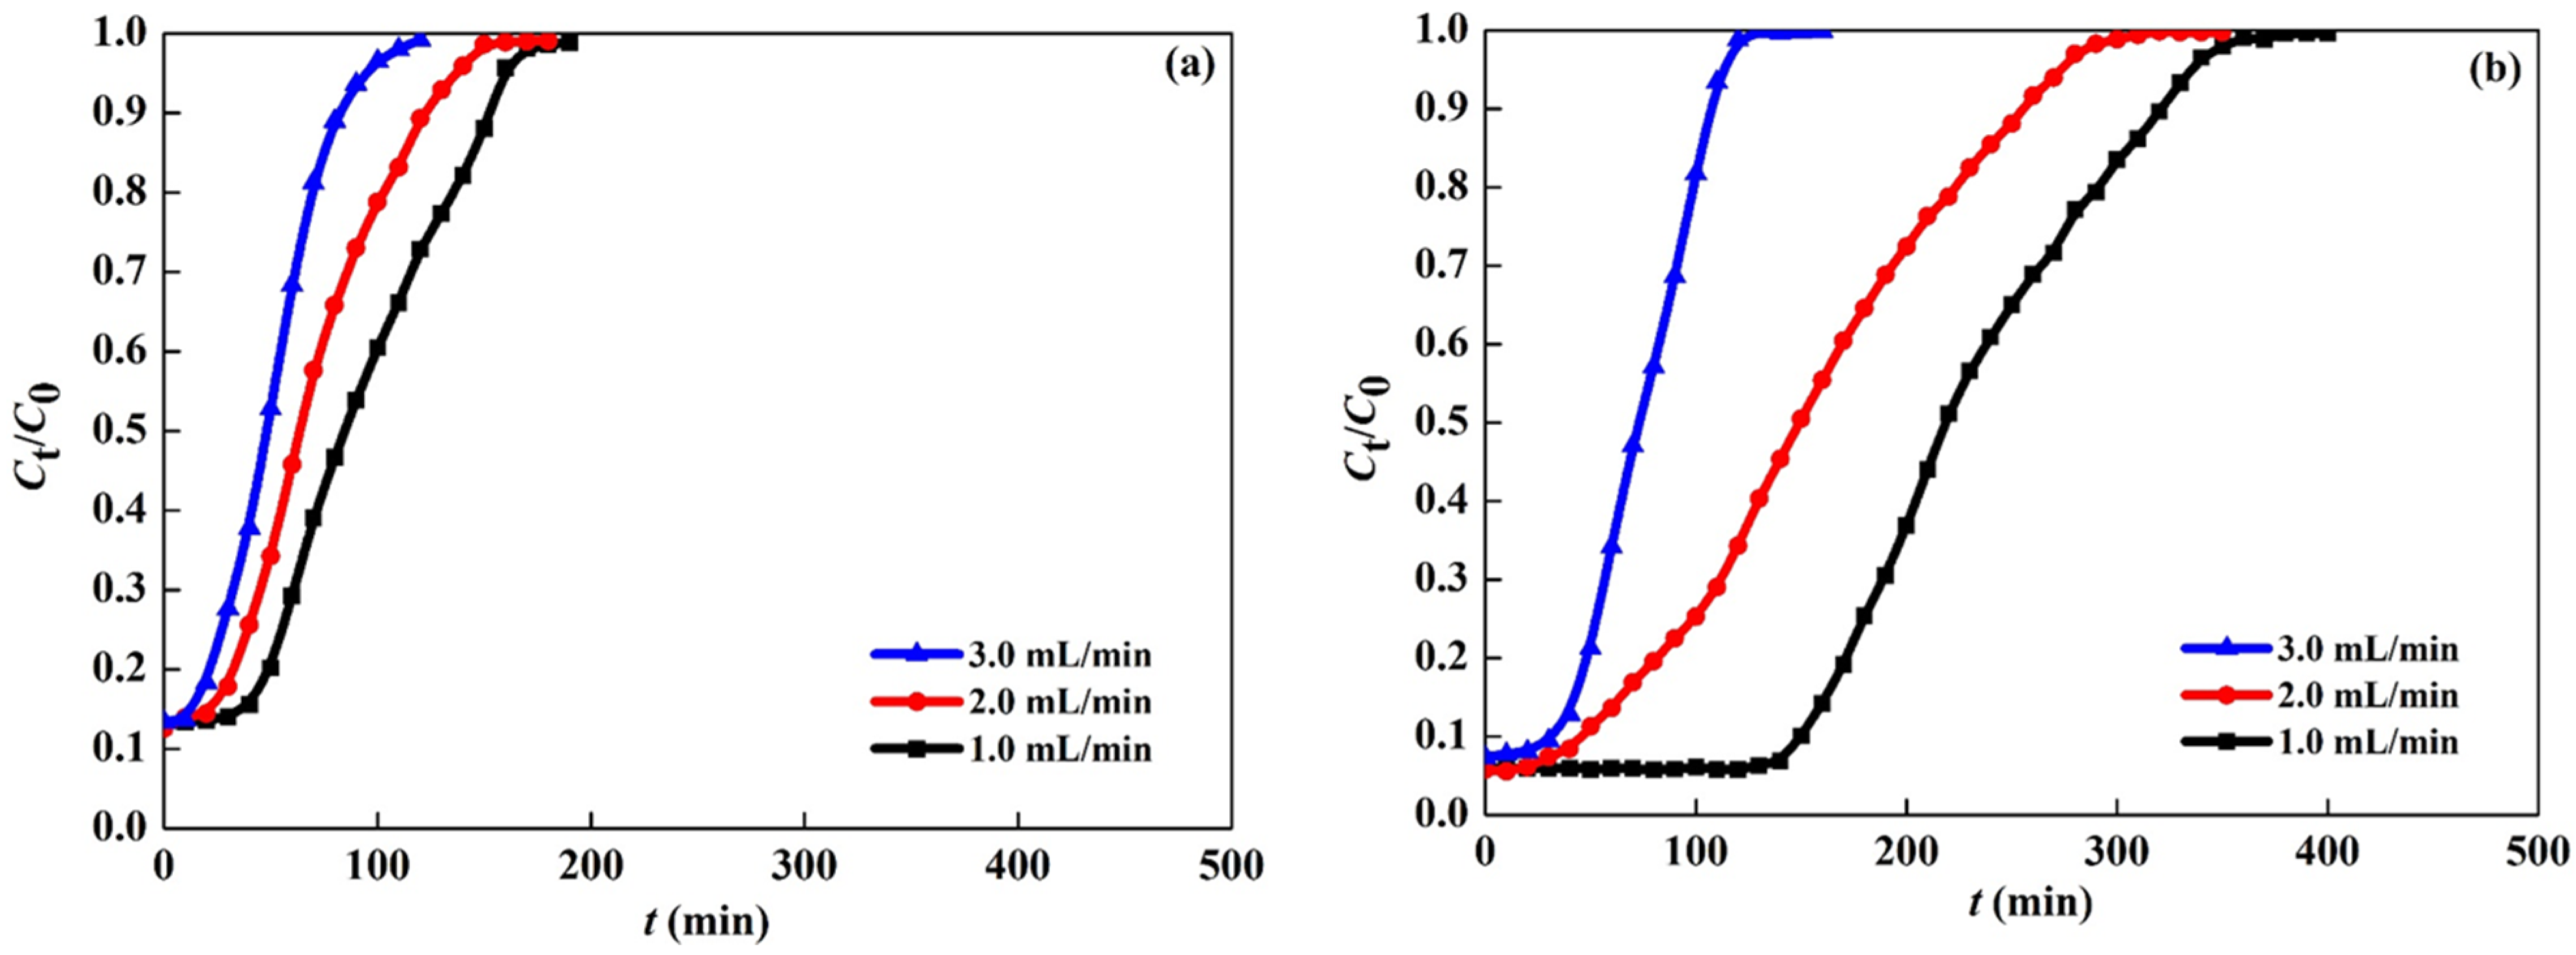
3.3.2. Effect of Flow Rate

The influences of the NAP solution flow rate (1, 2, and 3 mL/min) on the adsorption onto O-SAC1 and O-PCAC1 are presented in Figure 8a and Figure 8b, respectively. The tb decreased from 40 to 20 min for O-SAC1, and from 100 to 10 min for O-PCAC1 with the increasing flow rate. Also, the te reduced from 170 to 100 min, and 340 to 120 min for O-PCAC1 when the flow rate varied from 1 to 3 mL/min. It means that the breakthrough point occurred faster at higher flow rates and this is likely attributed to the decrease in mass transfer and adsorption efficiency [27,28,29]. In contrast, the saturation point was reached slowly at lower flow rates, a similar phenomenon has been observed by A.F. Hassan et al. [29]. In both cases, O-SAC1 and O-PCAC1, the greater adsorption capacity was obtained at the lower flow rate. Since there is inadequate residence time for NAP solution through the column at high flow rates, it would be drained before being fully adsorbed [27,28,29]. It is worth noting that the intensive turbulence at higher influent rates could cause a weaker intraparticle mass transfer and interaction between the NAP molecules and adsorbents [28].

3.3.3. Effect of Initial NAP Concentration

Changes in initial concentration also significantly influenced the interaction between NAP and IMACs, as shown in Figure 9. The tb and te were extended for both O-SAC1 (10–50 and 150–210 min) and O-PCAC1 (20–110 and 290–430 min) with the initial NAP concentration decreased from 30 to 10 mg/L. Since the narrow concentration gradient reduces the mass transfer or diffusion rates [27,28,29]. The adsorption rapidly arose at the initial stage as the availability of readily accessible surface sites could capture the NAP molecules from the adsorption system. Hence, the adsorption gradually becomes tardiness and the effluent exhibits high concentration with the flowed NAP solution until the saturation points were attained. The roles of the initial concentration gradient provide an avital driving force to respond to the mass transfer. Besides, the S-shape breakthrough curve implies a limited mass transfer zone and an insignificant axial dispersion [28]. The high initial concentration enhanced the adsorption capacity, data consistent with the previous report [27].

3.3.4. Breakthrough Analysis

The breakthrough analysis aims to interpret the interpretation among the surface properties of IMACs, adsorption mechanisms, and affinity extent towards NAP [28]. The Thomas equation supposes that the adsorption process follows the PSO reversible reaction kinetics and Langmuir isotherm, and the absence of plug influent of axial dispersion or diffusion resistance in the column. The Thomas rate constant (KTh) and adsorption capacity (q0) were calculated from the curves of lnC0/Ct against t (Tables S4 and S5). As we can see, the KTh increase with low bed height, low initial NAP concentration, and great flow rate [28,43]. The high R2 (0.9109–0.9863 for O-SAC1 and 0.9033–0.9701 for O-PCAC1) suggests that the breakthrough curves can be well predicted by the Thomas model based on the kinetics and isotherms parameters from the batch model [11,28]. Compared with batch adsorption, the dynamic adsorption mode exhibits excellent adsorption capacity for NAP (Table 4, Tables S4 and S5). Moreover, a large solution volume of NAP can be purification during flow mode. These results indicate that both O-PCAC1 and O-SAC1 with high potential for NAP adsorption under dynamic flow mode. Therefore, the dynamic mode is more suitable for industrial applications in NAP removal. The optimized operating parameters by breakthrough curve analysis combined with the Thomas model above are listed as follows: 1 cm (H), 1 mL/min (Q0), and 30 mg/L (C0).
The Adams–Bohart model is in view of the adsorption rate controlled by external diffusion and the equilibrium is non-transient [28]. The data of column adsorption were linearly fitted by lnC0/Ct against t, the parameters are presented in Tables S4 and S5. The kinetics constant, kAB, decreased with the increased column heights, while increased with the increased initial NAP concentration and influent rate. It is unsuitable for using the Adams–Bohart model to describe the experimental breakthrough curves [28].

4. Conclusions

Two methods were compared for SAC and PCAC modification using OA under microwave heating. The in situ procedure gave much better physicochemical properties than the conventional process. Important factors ABET, VMeso, and qe were higher for IMACs over the conventional modified-ACs. The ABET and VMeso were 912.89 m2/g and 0.356 cm3/g for O-PCAC1, and 725.00 m2/g and 0.27 cm3/g for O-SAC1. Similar NAP adsorption capacities of 180.8 mg/g and 187.8 mg/g were obtained at 308 K for O-SAC1 and O-PCAC1, respectively. EDAX analysis showed great hydrophobicity in these two adsorbents. NAP adsorption on O-SAC1 and O-PCAC1 was followed by PSO kinetics and Freundlich isotherm models. The adsorption exhibited a low response to solution pH. O-SAC1 and O-PCAC1 could be reused at least 5 times. Optimal conditions for dynamic adsorption were based on column height (1 cm), flow rate (1 mL/min), and initial NAP concentration (30 mg/L). The Thomas model described the dynamic adsorption well.
These results provide a reference for the removal of NAP in industrial wastewater by AC adsorption, especially with column adsorption. In future studies the new adsorption material will be used to treat real wastewater.

Supplementary Materials

The following are available online at https://www.mdpi.com/2227-9717/9/2/391/s1.

Author Contributions

Conceptualization, P.L.; methodology, P.L.; software, P.L.; validation, P.L., Z.W. (Zhansheng Wu), Z.W. (Zhilin Wu) and G.C.; formal analysis, P.L.; investigation, P.L.; resources, Z.W. (Zhansheng Wu), G.C.; data curation, P.L.; writing—original draft preparation, P.L.; writing—review and editing, P.L., Z.W. (Zhansheng Wu) and Z.W. (Zhilin Wu); visualization, Z.W. (Zhansheng Wu) and G.C.; supervision, G.C.; project administration, Z.W. (Zhansheng Wu); funding acquisition, Z.W. (Zhansheng Wu). All authors have read and agreed to the published version of the manuscript.

Funding

This research was funded by the National Natural Science Foundation of China (21868034) and the International Science and Technology Cooperation Program of Shihezi University (GJHZ201601).

Acknowledgments

This work was supported financially by funding from the National Natural Science Foundation of China (21868034) and the International Science and Technology Cooperation Program of Shihezi University (GJHZ201601). Pengyun Liu was supported by China Scholarship Council (No. 201909505008).

Conflicts of Interest

The authors declare no conflict of interest including financial, personal or other relationships with anybody or organizations.

Nomenclature

Abbreviations
ACactivated carbon
ABETBET specific surface area
AMicromicropore specific surface area
AEexternal specific surface area
APSaverage pore size
BTFbanana trunk fibers
BETBrunauer-Emmett-Teller
BJHBarrett-Joyner-Halenda
EDAX Energy Dispersive X-ray Analysis
FT-IR Fourier Transmission InfraRed spectroscopy
IMACs in situ modified ACs
NAPnaphthalene
OAOleic acid
OBTFOA modified BTF
OMCordered mesoporous carbon
O-PCAC1in situ modified PCAC
O-PCAC2conventional- modified PCAC with OA
O-SAC1in situ modified SAC
O-SAC2conventional- modified SAC with OA
PCpulverized coal
PCACpulverized coal-based ACs
PFOpseudo-first-order
PSOpseudo-second-order
RL reflection loss
RMSERoot mean square error
SACStarch-based AC
SC starch-based carbon
SEM Scanning Electron Microscopy
VMesomesopore volume
VMicromicropore volume
VTotoltotal pore volume
XPSX-ray photoelectron spectroscopy
Symbols
Acthe area under the breakthrough curve
Ca constant related to the boundary layer thickness
C0initial/inlet NAP concentration
Ceequilibrium NAP concentration
Ctthe outlet NAP concentration
C0-Ctthe adsorbed NAP concentration
Hcolumn height
K1pseudo-first-order rate constant
K2pseudo-second-order rate constant
kABthe kinetic constant
Kbfliquid-film diffusion constant
KFa constant related to the bonding energy
KLa constant related to the free energy
KPthe intraparticle diffusion constant
KPithe calculated diffusion rate parameter at different stages
kThthe Thomas rate constant
mthe mass of adsorbents used
N0the saturation concentration
Qthe flow rate
Q0low rate
q0the adsorption capacity
qethe equilibrium adsorption capacity
qEqthe amount of NAP adsorbed per unit dry weight
qmthe maximal adsorption capacity
qtotalthe maximum column capacity
R2correlation coefficients
Tthe temperature of adsorption system
tethe exhaustion time
tbbreakthrough time
ttotalthe total flow time
Vthe volume of the NAP solution
Wthe total amount of IMACs in the column
αinitial sorption constant
βinitial desorption constant
vthe feed flow rate
U0the superficial velocity
zthe bed depth of the fixed bed column
1/na constant related to adsorption intensity

References

  1. Yang, W.; Wang, Y.; Sharma, P.; Li, B.; Liu, K.; Liu, J.; Flury, M.; Shang, J.Y. Effect of naphthalene on transport and retention of biochar colloids through saturated porous media. Colloid Surface A 2017, 530, 146–154. [Google Scholar] [CrossRef]
  2. Lair, A.; Ferronato, C.; Chovelon, J.M.; Herrmann, J.M. Naphthalene degradation in water by heterogeneous photocatalysis: An investigation of the influence of inorganic anions. J. Photochem. Photobiol. A Chem. 2008, 193, 193–203. [Google Scholar] [CrossRef]
  3. Ohnishi, S.; Hiraku, Y.; Hasegawa, K.; Hirakawa, K.; Oikawa, S.; Murata, M.; Kawanishi, S. Mechanism of oxidative DNA damage induced by metabolites of carcinogenic naphthalene. Mutat. Res. Genet. Toxicol. Environ. Mutagen. 2018, 827, 42–49. [Google Scholar] [CrossRef]
  4. Abo-State, M.A.M.; Riad, B.Y.; Bakr, A.A.; Abdel, A.M.F. Biodegradation of naphthalene by Bordetella avium isolated from petroleum refinery wastewater in Egypt and its pathway. J. Radiat. Res. Appl. Sci. 2018, 11, 1–9. [Google Scholar]
  5. Beltrame, K.K.; Cazetta, A.L.; de Souza, P.S.; Spessato, L.; Silva, T.L.; Almeida, V.C. Adsorption of caffeine on mesoporous activated carbon fibers prepared from pineapple plant leaves. Ecotoxicol. Environ. Saf. 2018, 147, 64–71. [Google Scholar] [CrossRef] [PubMed]
  6. Saha, D.; Mirando, N.; Levchenko, A. Liquid and vapor phase adsorption of BTX in lignin derived activated carbon: Equilibrium and kinetics study. J. Clean. Prod. 2018, 182, 372–378. [Google Scholar] [CrossRef]
  7. Shimizu, Y.; Ateia, M.; Yoshimura, C. Natural organic matter undergoes different molecular sieving by adsorption on activated carbon and carbon nanotubes. Chemosphere 2018, 203, 345–352. [Google Scholar] [CrossRef]
  8. Liu, H.; Wang, X.Z.; Zhai, G.Y.; Zhang, J.; Zhang, C.L.; Bao, N.; Cheng, C. Preparation of activated carbon from lotus stalks with the mixture of phosphoric acid and pentaerythritol impregnation and its application for Ni (II) sorption. Chem. Eng. J. 2012, 209, 155–162. [Google Scholar] [CrossRef]
  9. Liu, H.; Liang, S.; Gao, J.H.; Ngo, H.H.; Guo, W.S.; Guo, Z.Z.; Wang, J.; Li, Y.R. Enhancement of Cr (VI) removal by modifying activated carbon developed from Zizania caduciflora with tartaric acid during phosphoric acid activation. Chem. Eng. J. 2014, 246, 168–174. [Google Scholar] [CrossRef]
  10. Dehghani, M.H.; Farhang, M.; Alimohammadi, M.; Afsharnia, M.; Mckay, G. Adsorptive removal of fluoride from water by activated carbon derived from CaCl2-modified Crocus sativus leaves: Equilibrium adsorption isotherms, optimization, and influence of anions. Chem. Eng. Commun. 2018, 205, 955–965. [Google Scholar] [CrossRef]
  11. Peng, X.M.; Hu, F.P.; Zhang, T.; Qiu, F.X.; Dai, H.L. Amine-functionalized magnetic bamboo-based activated carbon adsorptive removal of ciprofloxacin and norfloxacin: A batch and fixed-bed column study. Bioresour. Technol. 2018, 249, 24–934. [Google Scholar] [CrossRef] [PubMed]
  12. Younis, S.A.; El-Sayed, M.; Moustafa, Y.M. Modeling and optimization of oil adsorption from wastewater using an amorphous carbon thin film fabricated from wood sawdust waste modified with palmitic acid. Environ. Process. 2017, 4, 147–168. [Google Scholar] [CrossRef]
  13. Banerjee, S.S.; Joshi, M.V.; Jayaram, R.V. Treatment of oil spill by sorption technique using fatty acid grafted sawdust. Chemosphere 2006, 64, 1026–1031. [Google Scholar] [CrossRef]
  14. Sathasivam, K.; Haris, M.R.H.M. Adsorption kinetics and capacity of fatty acid-modified banana trunk fibers for oil in water. Water Air Soil Poll. 2010, 213, 413–423. [Google Scholar] [CrossRef]
  15. Zhu, M.; Yao, J.; Dong, L.; Sun, J.J. Adsorption of naphthalene from aqueous solution onto fatty acid modified walnut shells. Chemosphere 2016, 144, 1639–1645. [Google Scholar] [CrossRef] [PubMed]
  16. Hu, Z.S.; Deng, Y.L. Superhydrophobic surface fabricated from fatty acid-modified precipitated calcium carbonate. Ind. Eng. Chem. Res. 2010, 49, 5625–5630. [Google Scholar] [CrossRef]
  17. Kumar, J.A.; Amarnath, D.J.; Kumar, P.S.; Kaushik, C.S.; Varghese, M.E.; Saravanan, A. Mass transfer and thermodynamic analysis on the removal of naphthalene from aqueous solution using oleic acid modified palm shell activated carbon. Desalin Water Treat. 2018, 106, 238–250. [Google Scholar] [CrossRef]
  18. Cabrales, L.; Abidi, N. Microwave plasma induced grafting of oleic acid on cotton fabric surfaces. Appl. Surf. Sci. 2012, 258, 4636–4641. [Google Scholar] [CrossRef]
  19. Liu, P.Y.; Wu, Z.S.; Sun, Z.H.; Ye, J. Comparison study of Naphthalene Adsorption on activated carbons prepared from different raws. Korean J. Chem. Eng. 2018, 35, 2086–2096. [Google Scholar] [CrossRef]
  20. Liu, P.Y.; Wu, Z.S.; Ge, X.Y.; Yang, X. Hydrothermal synthesis and microwave-assisted activation of starch-derived carbons as an effective adsorbent for naphthalene removal. RSC. Adv. 2019, 9, 11696–11706. [Google Scholar] [CrossRef] [Green Version]
  21. Ge, X.Y.; Tian, F.; Wu, Z.S.; Yan, Y.J.; Cravotto, G.; Wu, Z.L. Adsorption of naphthalene from aqueous solution on coal-based activated carbon modified by microwave induction: Microwave power effects. Chem. Eng. Process. 2015, 91, 67–77. [Google Scholar] [CrossRef]
  22. Aguilera, A.F.; Tolvanen, P.; Eränen, K.; Leveneur, S.; Salmi, T. Epoxidation of oleic acid under conventional heating and microwave radiation. Chem. Eng. Process. 2016, 102, 70–87. [Google Scholar] [CrossRef]
  23. Kim, D.; Choi, J.; Kim, G.-J.; Seol, S.K.; Ha, Y.-C.; Vijayan, M.; Jung, S.; Kim, B.H.; Lee, G.D.; Park, S.S. Microwave-accelerated energy-efficient esterification of free fatty acid with a heterogeneous catalyst. Bioresour. Technol. 2011, 102, 3639–3641. [Google Scholar] [CrossRef] [PubMed]
  24. Zhou, H.; Wang, J.C.; Zhuang, J.D.; Liu, Q. A covalent route for efficient surface modification of ordered mesoporous carbon as high performance microwave absorbers. Nanoscale 2013, 5, 12502–12511. [Google Scholar] [CrossRef]
  25. Liao, L.Q.; Zhang, C.; Gong, S.Q. Preparation of Poly (varepsilon-caprolactone)/Clay Nanocomposites by Microwave-Assisted in situ Ring-Opening Polymerization. Macromol. Rapid Commun. 2007, 28, 1148–1154. [Google Scholar] [CrossRef]
  26. Pan, J.M.; Huang, X.B.; Gao, L.; Peng, Y.X.; Liu, S.C.; Gu, R.X. Experimental investigation of a natural favonoid adsorption on macroporous polymers with intrinsic cis-diol moieties recognition function: Static and dynamic methods. Chem. Eng. J. 2017, 312, 263–274. [Google Scholar] [CrossRef]
  27. Auta, M.; Hameed, B.H. Acid modified local clay beads as effective low-cost adsorbent for dynamic adsorption of methylene blue. J. Ind. Eng. Chem. 2013, 19, 1153–1161. [Google Scholar] [CrossRef]
  28. Foo, K.Y.; Hameed, B.H. Dynamic adsorption behavior of methylene blue onto oil palm shell granular activated carbon prepared by microwave heating. Chem. Eng. J. 2012, 203, 81–87. [Google Scholar] [CrossRef]
  29. Hassan, A.F.; Hrdina, R. Chitosan/nanohydroxyapatite composite based scallop shells as an efficient adsorbent for mercuric ions: Static and dynamic adsorption studies. Int. J. Biol. Macromol. 2018, 109, 507–516. [Google Scholar] [CrossRef] [PubMed]
  30. Iruretagoyena, D.; Bikane, K.; Sunny, N.; Lu, H.; Kazarian, S.G.; Chadwick, D.; Pini, R.; Shah, N. Enhanced selective adsorption desulfurization on CO2 and steam treated activated carbons: Equilibria and kinetics. Chem. Eng. J. 2020, 379, 1–6. [Google Scholar] [CrossRef]
  31. Li, N.; Cheng, W.Y.; Pan, Y.Z. Adsorption of naphthalene on modified zeolite from aqueous solution. J. Environ. Prot. 2017, 8, 416–425. [Google Scholar] [CrossRef] [Green Version]
  32. Iannicelli-Zubiani, E.M.; Stampino, P.G.; Cristiani, C.; Dotelli, G. Enhanced lanthanum adsorption by amine modified activated carbon. Chem. Eng. J. 2018, 341, 75–82. [Google Scholar] [CrossRef]
  33. Niazi, L.; Lashanizadegan, A.; Sharififard, H. Chestnut oak shells activated carbon: Preparation, characterization and application for Cr (VI) removal from dilute aqueous solutions. J. Clean. Prod. 2018, 185, 554–561. [Google Scholar] [CrossRef]
  34. Wei, X.H.; Wu, Z.S.; Wu, Z.L.; Ye, B.C. Adsorption behaviors of atrazine and Cr (III) onto different activated carbons in single and co-solute systems. Powder Technol. 2018, 329, 207–216. [Google Scholar] [CrossRef]
  35. Ghaedi, M.; Daneshyar, A.; Asfaram, A.; Purkait, M.K. Adsorption of naphthalene onto high-surface-area nanoparticle loaded activated carbon by high performance liquid chromatography: Response surface methodology, isotherm and kinetic study. RSC Adv. 2016, 6, 54322–54330. [Google Scholar] [CrossRef]
  36. Zhu, M.; Tian, W.; Chai, H.K.; Yao, J. Acid-hydrolyzed agricultural residue: A potential adsorbent for the decontamination of naphthalene from water bodies. Korean J. Chem. Eng. 2017, 34, 1073–1080. [Google Scholar] [CrossRef]
  37. Norouzi, S.; Heidari, M.; Alipour, V.; Rahmanian, O.; Fazlzadeh, M.; Mohammadi-Moghadam, F.; Nourmoradi, H.; Goudarzi, B.; Dindarloo, K. Preparation, characterization and Cr (VI) adsorption evaluation of NaOH-activated carbon produced from Date Press Cake; an agro-industrial waste. Bioresour. Technol. 2018, 258, 48–56. [Google Scholar] [CrossRef]
  38. Oginni, O.; Singh, K.; Oporto, G.; Dawson-Andoh, B.; McDonald, L.; Sabolsky, E. Influence of one-step and two-step KOH activation on activated carbon characteristics. Bioresour. Technol. Rep. 2019, 7, 1–10. [Google Scholar]
  39. Marrakchi, F.; Bouaziz, M.; Hameed, B.H. Adsorption of acid blue 29 and methylene blue on mesoporous K2CO3-activated olive pomace boiler ash. Colloid Surface A 2017, 535, 157–165. [Google Scholar] [CrossRef]
  40. Liu, N.; Charrua, A.B.; Weng, C.H.; Yuan, X.L.; Ding, F. Characterization of biochars derived from agriculture wastes and their adsorptive removal of atrazine from aqueous solution: A comparative study. Bioresour. Technol. 2015, 198, 55–62. [Google Scholar] [CrossRef] [PubMed]
  41. Liu, Y.J.; Ying, D.Y.; Sanguansri, L.; Cai, Y.X.; Le, X.Y. Adsorption of catechin onto cellulose and its mechanism study: Kinetic models, characterization and molecular simulation. Food Res. Int. 2018, 112, 225–232. [Google Scholar] [CrossRef] [PubMed]
  42. Wang, L.; Yang, C.; Lu, A.; Liu, S.; Pei, Y.; Luo, X. An easy and unique design strategy for insoluble humic acid/cellulose nanocomposite beads with highly enhanced adsorption performance of low concentration ciprofloxacin in water. Bioresour. Technol. 2020, 302, 122812. [Google Scholar] [CrossRef] [PubMed]
  43. Mthombeni, N.H.; Mbakop, S.; Ray, S.C.; Leswifi, T.; Ochieng, A.; Onyango, M.S. Highly efficient removal of chromium (VI) through adsorption and reduction: A column dynamic study using magnetized natural zeolite-polypyrrole composite. J. Environ. Chem. Eng. 2018, 6, 4008–4017. [Google Scholar] [CrossRef]
Figure 1. A schematic diagram illustration of the in situ and conventional modification with oleic acid (OA) using microwave heating.
Processes 09 00391 g001
Figure 2. A schematic diagram showing the column adsorption of NAP.
Processes 09 00391 g002
Figure 3. X-ray photoelectron spectroscopy (XPS) survey scans of pulverized coal (PC)-based (a) and starch-based carbon (SC)-based (b) samples.
Processes 09 00391 g003
Figure 4. The effect of contact time on the adsorption capacity of in situ modified activated carbons (IMACs).
Processes 09 00391 g004
Figure 5. The adsorption mechanism for NAP adsorption on O-SAC1 and O-PCAC1.
Processes 09 00391 g005
Figure 6. Reusability of IMACs for the adsorption of NAP (NAP concentration 30 mg/L, contact time 80 min) after elution with 95% ethanol solution in ultrasound field.
Processes 09 00391 g006
Figure 7. Effect of different column heights on NAP adsorption onto O-SAC1 (a) and O-PCAC1 (b) at a concentration of 30 mg/L and flow rate of 2 mL/min.
Processes 09 00391 g007
Figure 8. Effect of different flow rates on column adsorption of NAP onto O-SAC1 (a) and O-PCAC1 (b) at a concentration of 30 mg/L and column height of 1 cm.
Processes 09 00391 g008
Figure 9. Effect of initial NAP concentrations on column adsorption of NAP onto O-SAC1 (a) and O-PCAC1 (b) at a flow rate of 2 mL/min and column height of 1 cm.
Processes 09 00391 g009
Table 1. Textural characteristics of all materials used in this study.
SamplesABET
m2/g
AMicro
m2/g
AE
m2/g
VTotol
cm3/g
VMicro
cm3/g
VMeso
cm3/g
APS
nm
Ref.
SC8.908.530.0062.62[19]
SAC616.80522.6594.180.3270.2552.12[19]
O-SAC1912.89481.16431.730.5880.2320.3562.58This study
O-SAC2284.25284.250.2980.2800.0184.80This study
PC4.191.462.730.0140.0010.01312.97This study
PCAC401.70337.3064.400.2100.1602.34[19]
O-PCAC1725.00435.34289.660.4840.2140.2702.67This study
O-PCAC230.5825.035.550.0200.0070.0132.67This study
Table 2. Assignments and peak parameters of different O 1s components of adsorbents.
Component Assignment Binding Energy
(eV)
Peak IPeak IIPeak IIIPeak IV
C=OC–OR–O*–C=OO*=C–OH
531.2532.4533.3534.3
Concentration (%)SC14.726.730.428.2
SAC21.022.726.030.4
O-SAC129.630.028.012.3
O-SAC231.129.729.110.0
PC9.343.318.329.0
PCAC21.452.417.58.7
O-PCAC127.525.526.120.9
O-PCAC218.429.715.536.5
* The atoms in oxygen functional groups bonding with adsorbents surface.
Table 3. The elemental composition of adsorbents.
SamplesN%C%H%S%O,diff%N/CH/CO/C[O+N]/C
SC0.0262.986.780.4029.820.0000.1080.4740.480
SAC0.0767.844.680.2627.150.0100.0690.4000.405
O-SAC10.5357.781.850.7339.110.0090.0320.6770.686
O-SAC20.0956.851.400.3241.340.0020.0250.7270.729
PC0.6568.330.480.3430.200.0100.0070.4420.451
PCAC0.2167.103.810.2328.650.0030.0570.4270.433
O-PCAC10.6076.811.740.6520.210.0080.0230.2630.271
O-PCAC20.5757.611.031.2239.590.0100.0180.6870.697
Table 4. Kinetics parameters of NAP adsorption onto IMACs at 303 K.
ModelsParameterO-SAC1O-PCAC1
C0 (mg/L)3030
qexp (mg/g)180.8187.8
PFOqe, cal (mg/g)70.9362.87
K1 (1/min)0.07560.1156
R20.86880.8911
RMSE11.913.0
PSOqe, cal (mg/g)181.82188.68
K2 (g/mg min)0.00470.0091
R20.99880.9999
RMSE3.63.9
Elovichqe, cal (mg/g)184.46196.94
(1/β)ln(αβ) (mg/g)124.18137.44
1/β13.757013.5780
R20.98700.9508
RMSE16.115.4
Table 5. Adsorption capacities of adsorbents.
AdsorbentsC0 (mg/L)T (K)qe (mg/g)Ref.
Modified walnut shells252987.20[15]
Modified coal-based AC30298131.20[21]
Modified zeolite13030.30[31]
ZnS-NPs-AC50298142.70[35]
Modified hazelnut shell2529817.30[36]
SC3030352.9[19]
SAC30303158.9[19]
PC3030375.26This study
PCAC30303160.7[19]
O-SAC130303180. 8This study
O-PCAC130303187.8This study
O-SAC2 *30303116.2This study
O-PCAC2 *30303120.5This study
* The adsorption capacities of O-SAC2 and O-PCAC2 towards NAP were obtained under specific conditions (amount of adsorbents: 0.015 g; solution volume: 100 mL; NAP concentration: 30 mg/L; Contact time: 40 min; temperature: 303 K). Due to the low adsorption capacities to NAP, the systematic investigation of NAP batch or column adsorption on O-SAC2 and O-PCAC2 was not the object of this study.
Table 6. Langmuir and Freundlich isotherm model constants and correlation coefficients (303 K) of IMACs.
ModelsParametersO-SAC1O-PCAC1
Langmuirqmax (mg/g)270.27333.33
KL (L/mg)0.58730.6122
R20.98890.9820
RMSE9.79.6
FreundlichKF (L/mg)103.52123.48
1/n0.34330.4156
R20.99340.9926
RMSE2.92.1
Publisher’s Note: MDPI stays neutral with regard to jurisdictional claims in published maps and institutional affiliations.

