Article

Large Eddy Simulation of Leakage Flow in a Stepped Labyrinth Seal

1
Department of Mechanical Engineering, Graduate School, Kookmin University, 77 Jeongneung-ro, Seongbuk-gu, Seoul 02707, Korea
2
School of Mechanical Engineering, Kookmin University, 77 Jeongneung-ro, Seongbuk-gu, Seoul 02707, Korea
*
Author to whom correspondence should be addressed.
Processes 2021, 9(12), 2179; https://doi.org/10.3390/pr9122179
Submission received: 8 November 2021 / Revised: 25 November 2021 / Accepted: 30 November 2021 / Published: 2 December 2021
(This article belongs to the Section Manufacturing Processes and Systems)

Abstract

:
Large eddy simulation (LES) and Reynolds averaged Navier-Stokes simulation (RANS) of leakage flow in straight-through and stepped labyrinth seals were performed in order to compare their performances in sealing the secondary flow passage of the gas turbine based on the respective discharge coefficients. The results indicate a 17.8% higher leakage prevention performance for the stepped seal relative to that of the straight seal. Further, while the LES predicts an ~7% reduction in the discharge coefficient due to shaft rotation, this effect is underestimated by the RANS. Moreover, the LES correctly predicts a laminarized flow pattern in the clearance, whereas the RANS overestimates the turbulence kinetic energy. In addition, a turbulence kinetic energy spectrum analysis was performed based on the vorticity at selected points in order to identify the flow structure that has a dominant influence on the oscillation of the discharge coefficient. This analysis also enabled identification of the changes in the flow structure due to shaft rotation.

1. Introduction

The gas turbine is a rotating machine based on the Brayton cycle. A number of studies aimed at increasing the efficiency of the gas turbine have demonstrated that the overall efficiency increases with the increasing of the inlet temperature [1]. However, it is necessary to cool the turbine blade by the application of a film of cold air in order to avoid damage under excess inlet temperatures [2,3]. The cooling air is bled from a compressor and supplied to the blade via a secondary air system comprised of a rotating part and a stationary part [1]. This system needs to be suitably sealed in order to prevent leakage of the cooling air. For this purpose, non-contact labyrinth seals are widely used [4]. These consist of a stator and rotor, along with a series of teeth and cavities to create desirable flow resistance, and may be shaped in a stepped, staggered, or straight-through configuration [5]. Due to the large pressure difference upstream and downstream of the labyrinth seal, air flows into the tooth structure at high speed, and a vortex is generated in the cavity. Strong viscous resistance continues to occur inside the vortex, which rotates at high speed, thus greatly affecting the dissipation of kinetic energy and flow resistance of the fluid passing through the labyrinth seal structure. The fluid loses kinetic energy as it passes through the multiple teeth, thus reducing the amount of fluid leakage through the labyrinth seal. Several efforts have been made to identify the leakage flow rate of the labyrinth seal according to the shaft rotation velocity [5] or honeycomb structure [6]. Numerous studies were conducted using experimental [7,8,9] and numerical [5,10,11,12] methods such as Reynolds averaged Navier-Stokes simulation (RANS) [13,14,15,16] or large eddy simulation (LES) [17], and optimization of the system was suggested [13,17].
The mathematical relation for the flow rate of fluid leaking through the labyrinth seal structure was first presented by Martin [18] based on the assumption that each tooth structure is an orifice and that all the kinetic energy of the fluid is dissipated after passing one such orifice. Vermes [19] suggested a correlation between the leakage flow rate and various labyrinth seal structures based on their geometrical parameters. Based on the expression proposed by Martin, Egli [20] established an expression for the change in the discharge coefficient according to the number of teeth, which is the basic geometrical parameter of the labyrinth seal. Hodkinson [21] used both an experimental method and a simulation to establish the concept of the carry over coefficient, which is related to the ratio of the kinetic energy of the fluid before and after clearance and transfer from one cavity to the next. Wittig et al. [7] experimentally obtained the discharge coefficient of the fluid passing through the structure by changing the pressure ratios of the straight-through and stepped labyrinth seals, and used the experimental results to validate those of a computational fluid dynamics (CFD) analysis. Vakili [22] obtained the discharge coefficient according to the pressure ratio of the stepped seal in the stationary state via experimentation, 2D axisymmetric modelling, and CFD analysis, and interpreted the results based on vortex generation and viscous loss. Szymanski et al. [23] conducted a comparative study of the basic straight-through and honeycomb structured labyrinth seals. Beak et al. [13] quantified the influence of various discharge coefficients of the straight-through labyrinth seal having a constant axial space according to various geometrical parameters, and suggested an optimal design. In particular, the clearance and the cavity width were shown to have a dominant effect upon the discharge coefficient [13]. However, there is limited freedom to vary these parameters since they are greatly influenced by the axial space and eccentricity control of the labyrinth seal. Hence, further research is needed into methods for lowering the discharge coefficient by actively utilizing other parameters and designs. In addition, there is a lack of research on the effect of high-speed rotation of the shaft upon the discharge coefficient under the operating conditions of the gas turbine, and a CFD analysis is needed in order to quantify the rotation of the fluid passing through the labyrinth seal cavity and the resulting kinetic energy dissipation.
In the present study, the leakage flow generated in the straight-through and stepped labyrinth seals, applied to the secondary air system inside the gas turbine, is analyzed via 3D CFD simulation using RANS and LES. Discharge coefficient reduction performance of straight-through and stepped labyrinth seal was compared. The weakness of the RANS-based turbulence model on the prediction of turbulence kinetic energy at the clearance was identified. Flow structure, which has a dominant influence on the discharge coefficient at the stepped labyrinth seal, was identified through turbulence kinetic energy spectrum analysis.

2. Numerical Method and Verification

Computational Domain and Boundary Conditions

The straight labyrinth seal has six teeth, the stepped labyrinth seal has five teeth, and the difference between the upstream and downstream pressures is 1 atm in each case. The sealing performance is evaluated according to the discharge coefficient, which is the ratio of the actual mass flow rate to the theoretical flow rate obtained by the isentropic process for a flow path having the same cross-sectional area, as stated in Equations (1) and (2):
Isentropic mass flow rate ( m ˙ i d ):
m ˙ i d = P i n A c T i n 2 γ R ( γ 1 ) [ ( P o u t P i n ) 2 γ ( P o u t P i n ) γ + 1 γ ]
Discharge coefficient ( C d ):
C d = m ˙ m ˙ i d
First, the results of each simulation are compared with the experimental results in order to validate the prediction of the discharge coefficient in the straight-through seal. Next, the predictions of each model are compared regarding the change in the sealing performance when the straight-through seal is replaced by a stepped seal. As previous studies have indicated that the turbulence kinetic energy in the clearance is overestimated by RANS [24], the present study investigates whether or not the LES can provide an accurate prediction. In addition, the performances of the LES and RANS are compared for predicting the change in sealing performance according to shaft rotation velocity.
Finally, since the flow structure plays an important role in the pressure loss, a power spectrum analysis of the LES data was performed using MatLAB R2021a [25] in order to identify the average flow field. An LES analysis was also performed for the rotating shaft in order to determine the energy change of each flow structure due to rotation.
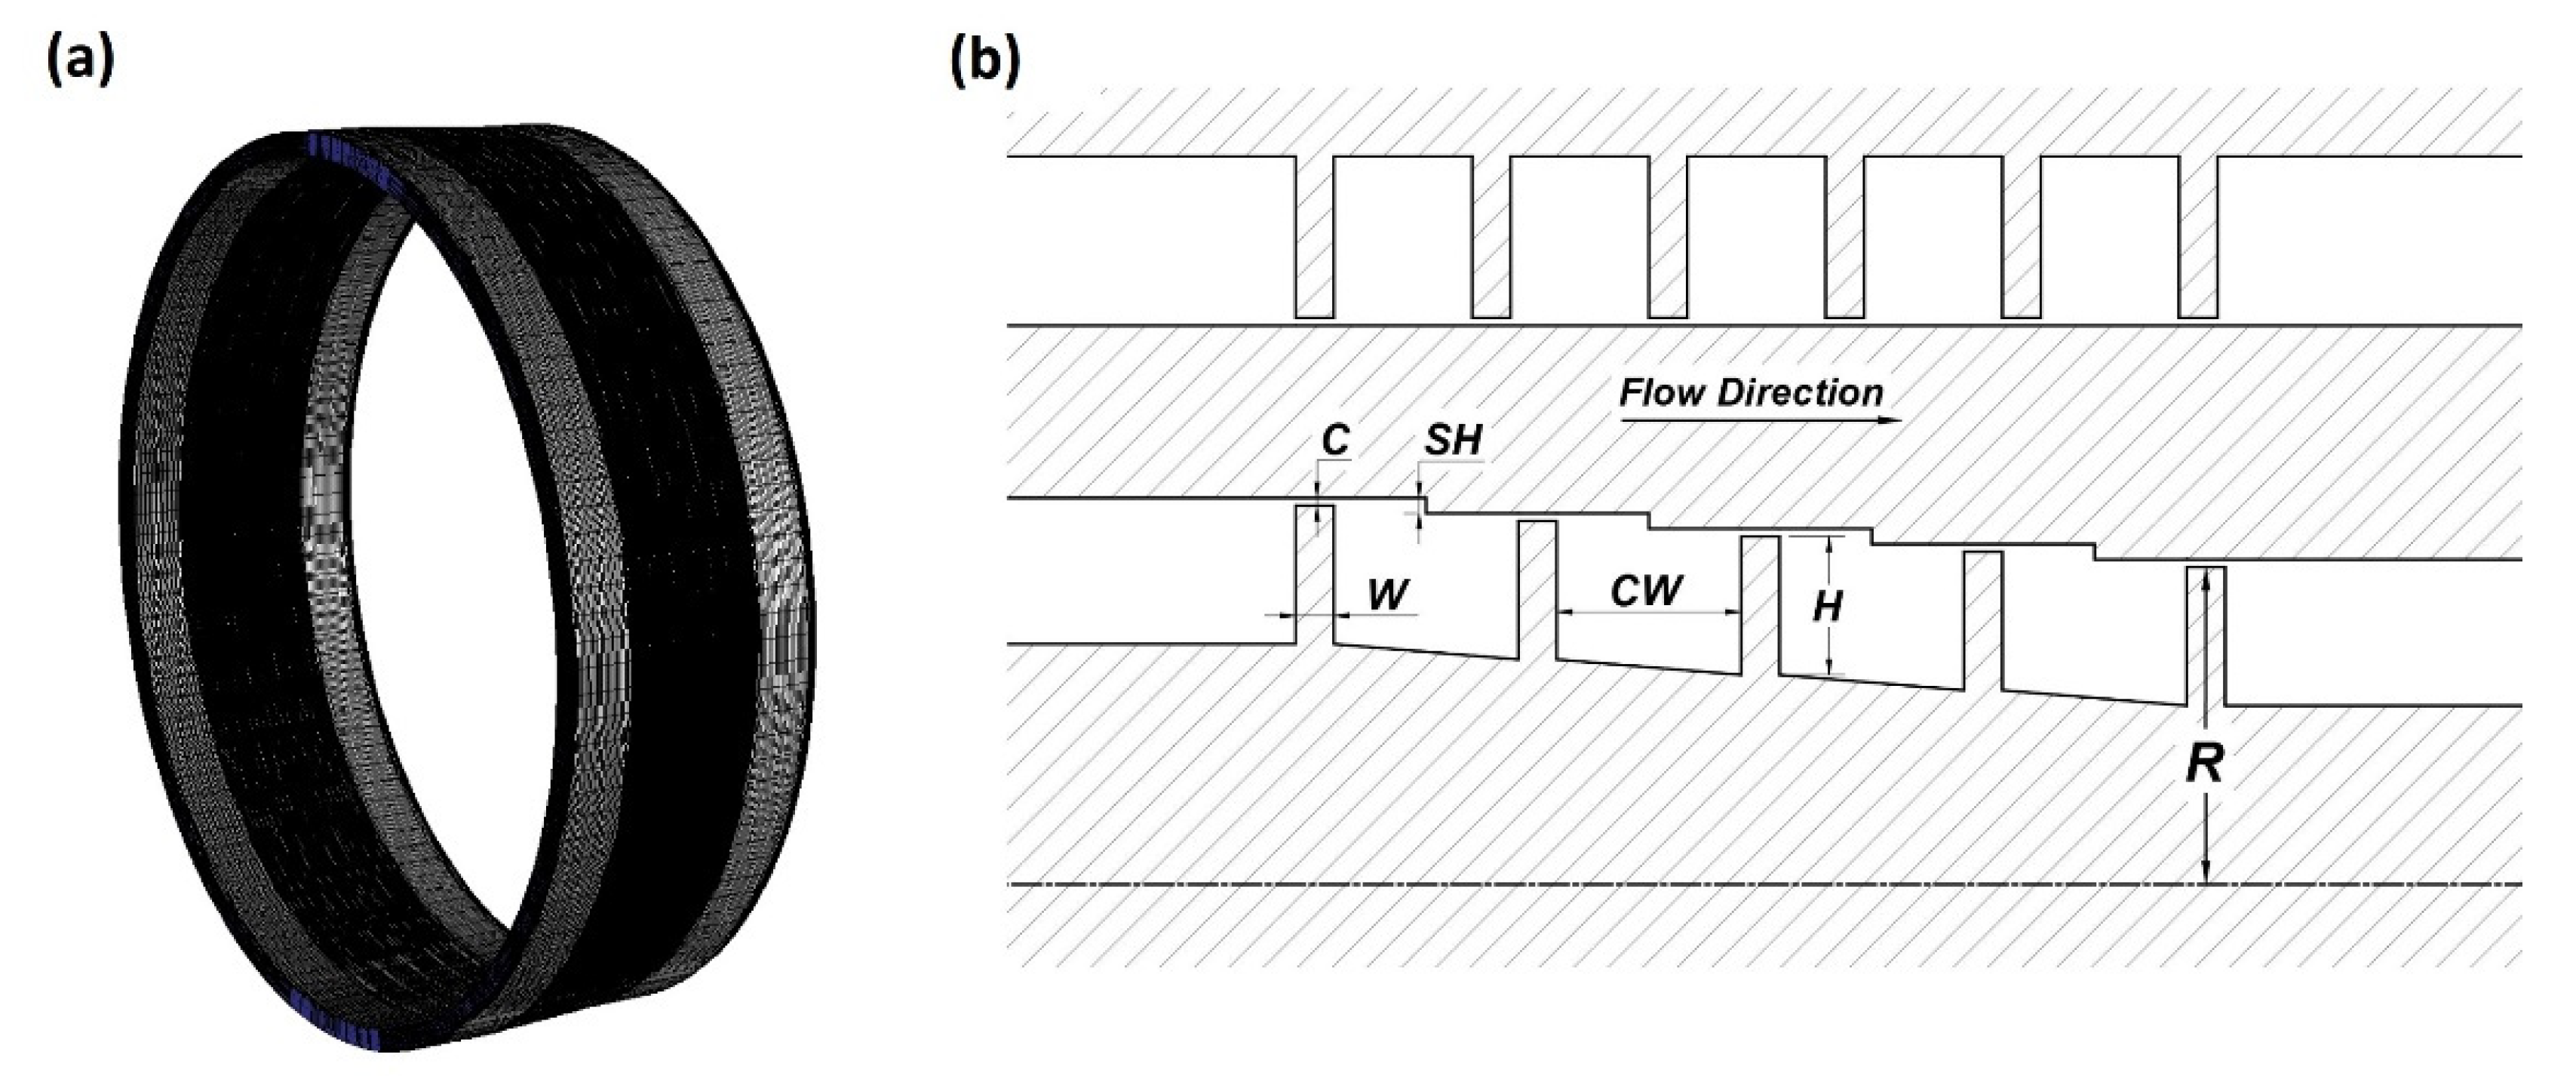
The computational domain is the entire 3D area of the straight-through or stepped labyrinth seal with a minimum radius of 200 mm. One-dimensional (1D) schematic representations of the stepped labyrinth seal and its boundary conditions are presented in Figure 1, while 3D and 2D schematic representations are presented in Figure 2. The detailed geometrical parameters are presented in Table 1. To confirm the effect of recirculation flow and tangential movement near the inlet and outlet, the computational domain was extended to ~32 mm along the axial direction from both the upstream and downstream points of the teeth. For the purpose of comparison, the straight-through labyrinth seal was designed according to the experimental parameters used by Wittig [7]. For the stepped labyrinth seal, the step height (SH) was set to 0.7 mm, which is 1.4 times the clearance (i.e., 1.4 C), and the cavity width (CW) was set to 11.5 mm (23 C). To compare the leakage flow rate under the same axial space as the straight-through seal, the number of teeth in the stepped labyrinth seal was reduced to five. The selected boundary conditions were the same for both types of seal, and are presented in Table 2. The inlet conditions were a total gauge pressure of 101.325 kPa, an intensity of 1%, and a length of 0.1 times the height. For the outlet, the total gauge pressure was 0 kPa, and non-slip conditions were applied for the wall. The grid was composed of about 7.57 million hexahedrons, and at least 20 grids were located in y+ = 30, so that the velocity gradient of the boundary layer could be sufficiently resolved.
The commercial CFD code ANSYS Fluent is widely used in the field of turbomachinery and is known to provide reliable results in a wide range of numerical simulations [26]. Hence, v.20.2 of this code was used for the present numerical simulations. Meanwhile, the ICEM CFD v20 is a commercial software package that enables the generation of high-accuracy cyclic mesh structures via a blocking method [27]; hence, v 20 of this code was used to generate the grid in the present study (Figure 3). The Semi-Implicit Method for Pressure Linked Equations (SIMPLE) was used to couple pressure with velocity, and least squares cell-based gradient evaluation was used to calculate the gradient between cells. The scalar face values were calculated using a second-order upwind scheme in order to render the scalar transport equations discrete and to calculate the convection between cells.
For the RANS analysis, the governing equations are those of the time-average conservation of mass, momentum, and energy [28], along with the cartesian coordinate states, as stated in Equations (3)–(5):
Conservation of mass:
x i ( ρ u i ¯ ) = 0
Conservation of momentum:
x i ( ρ u i u i ¯ ) = d p ¯ d x i + x i ( μ x i u i ) + { ( ρ u i u i ¯ ) x i ( ρ u i u j ¯ ) x j ( ρ u i u k ¯ ) x k }
Conservation of energy:
x i · ( x i k T ) ρ c p T u i ¯ x i ρ c p T u j ¯ x i ρ c p T u k ¯ x i = 0
For closure of Equation (5), the nonlinear terms ρ u i u i ¯ ,   ρ u i u j ¯ ,   ρ u i u k ¯ ,   ρ u j u i ¯ ,   ρ u j u k ¯   and ρ u k u k ¯ from Equation (4), and T u i ¯ ,   T u j ¯ and T u k ¯ from Equation (5) must be modeled. According to Boussinesq’s hypothesis [29], the transfer of momentum due to turbulence can be modeled via the turbulence viscosity.
The six Reynolds stress components can be expressed by Equation (6):
ρ u i u j ¯ = μ t ( u i x j + u j x i 2 3 u k x k δ i j ) 2 3 ρ k δ i j
In addition, the turbulence viscosity, μ t must be modeled according to Equation (7) [30]:
ρ C μ k 2 ε = μ t
The calculation was performed for 20 h using a 3.2 GHz Intel Xeon Gold 32-core processor, and all residuals converged to a level of 10−5.
For the LES analysis, the governing equations that maintain the nonlinearity are given as Equations (8) and (9) [30].
Conservation of mass:
ρ t + x i ( ρ u i ¯ ) = 0
Conservation of momentum:
( ρ u i ¯ ) t + x j ( ρ u i ¯ u j ¯ ) = d p ¯ d x i + x j [ μ ( u i ¯ x j + u j ¯ x i ) 2 3 μ u k ¯ x k δ i j ] + τ i j x j
Any turbulence and heat transfer occurring on a scale below the grid size are modeled as sub-grid scale (SGS) stresses, which are assumed to follow a gradient-diffusion process similar to that of molecular motion. Consequently, the i-j plane sub-grid scale stress ( τ i j ) is given by Equation (10):
τ i j 1 3 τ k k δ i j = μ t ( u i x j + u j x i )
and the SGS viscosity ( μ t ) in the Smagorinsky-Lilly model is given by Equation (11):
μ t = ρ L s 2 1 2 ( u i ¯ x j + u j ¯ x i ) ( u i ¯ x j + u j ¯ x i )
The timestep size was fixed at 2e−6 s, the calculation was assumed to enter a statistically steady state at about 2e−2 s, the result was obtained at the 4000th timestep, and the time average value was used. The calculation took about seven days using the 3.2 GHz Intel Xeon Gold 32-core processor.
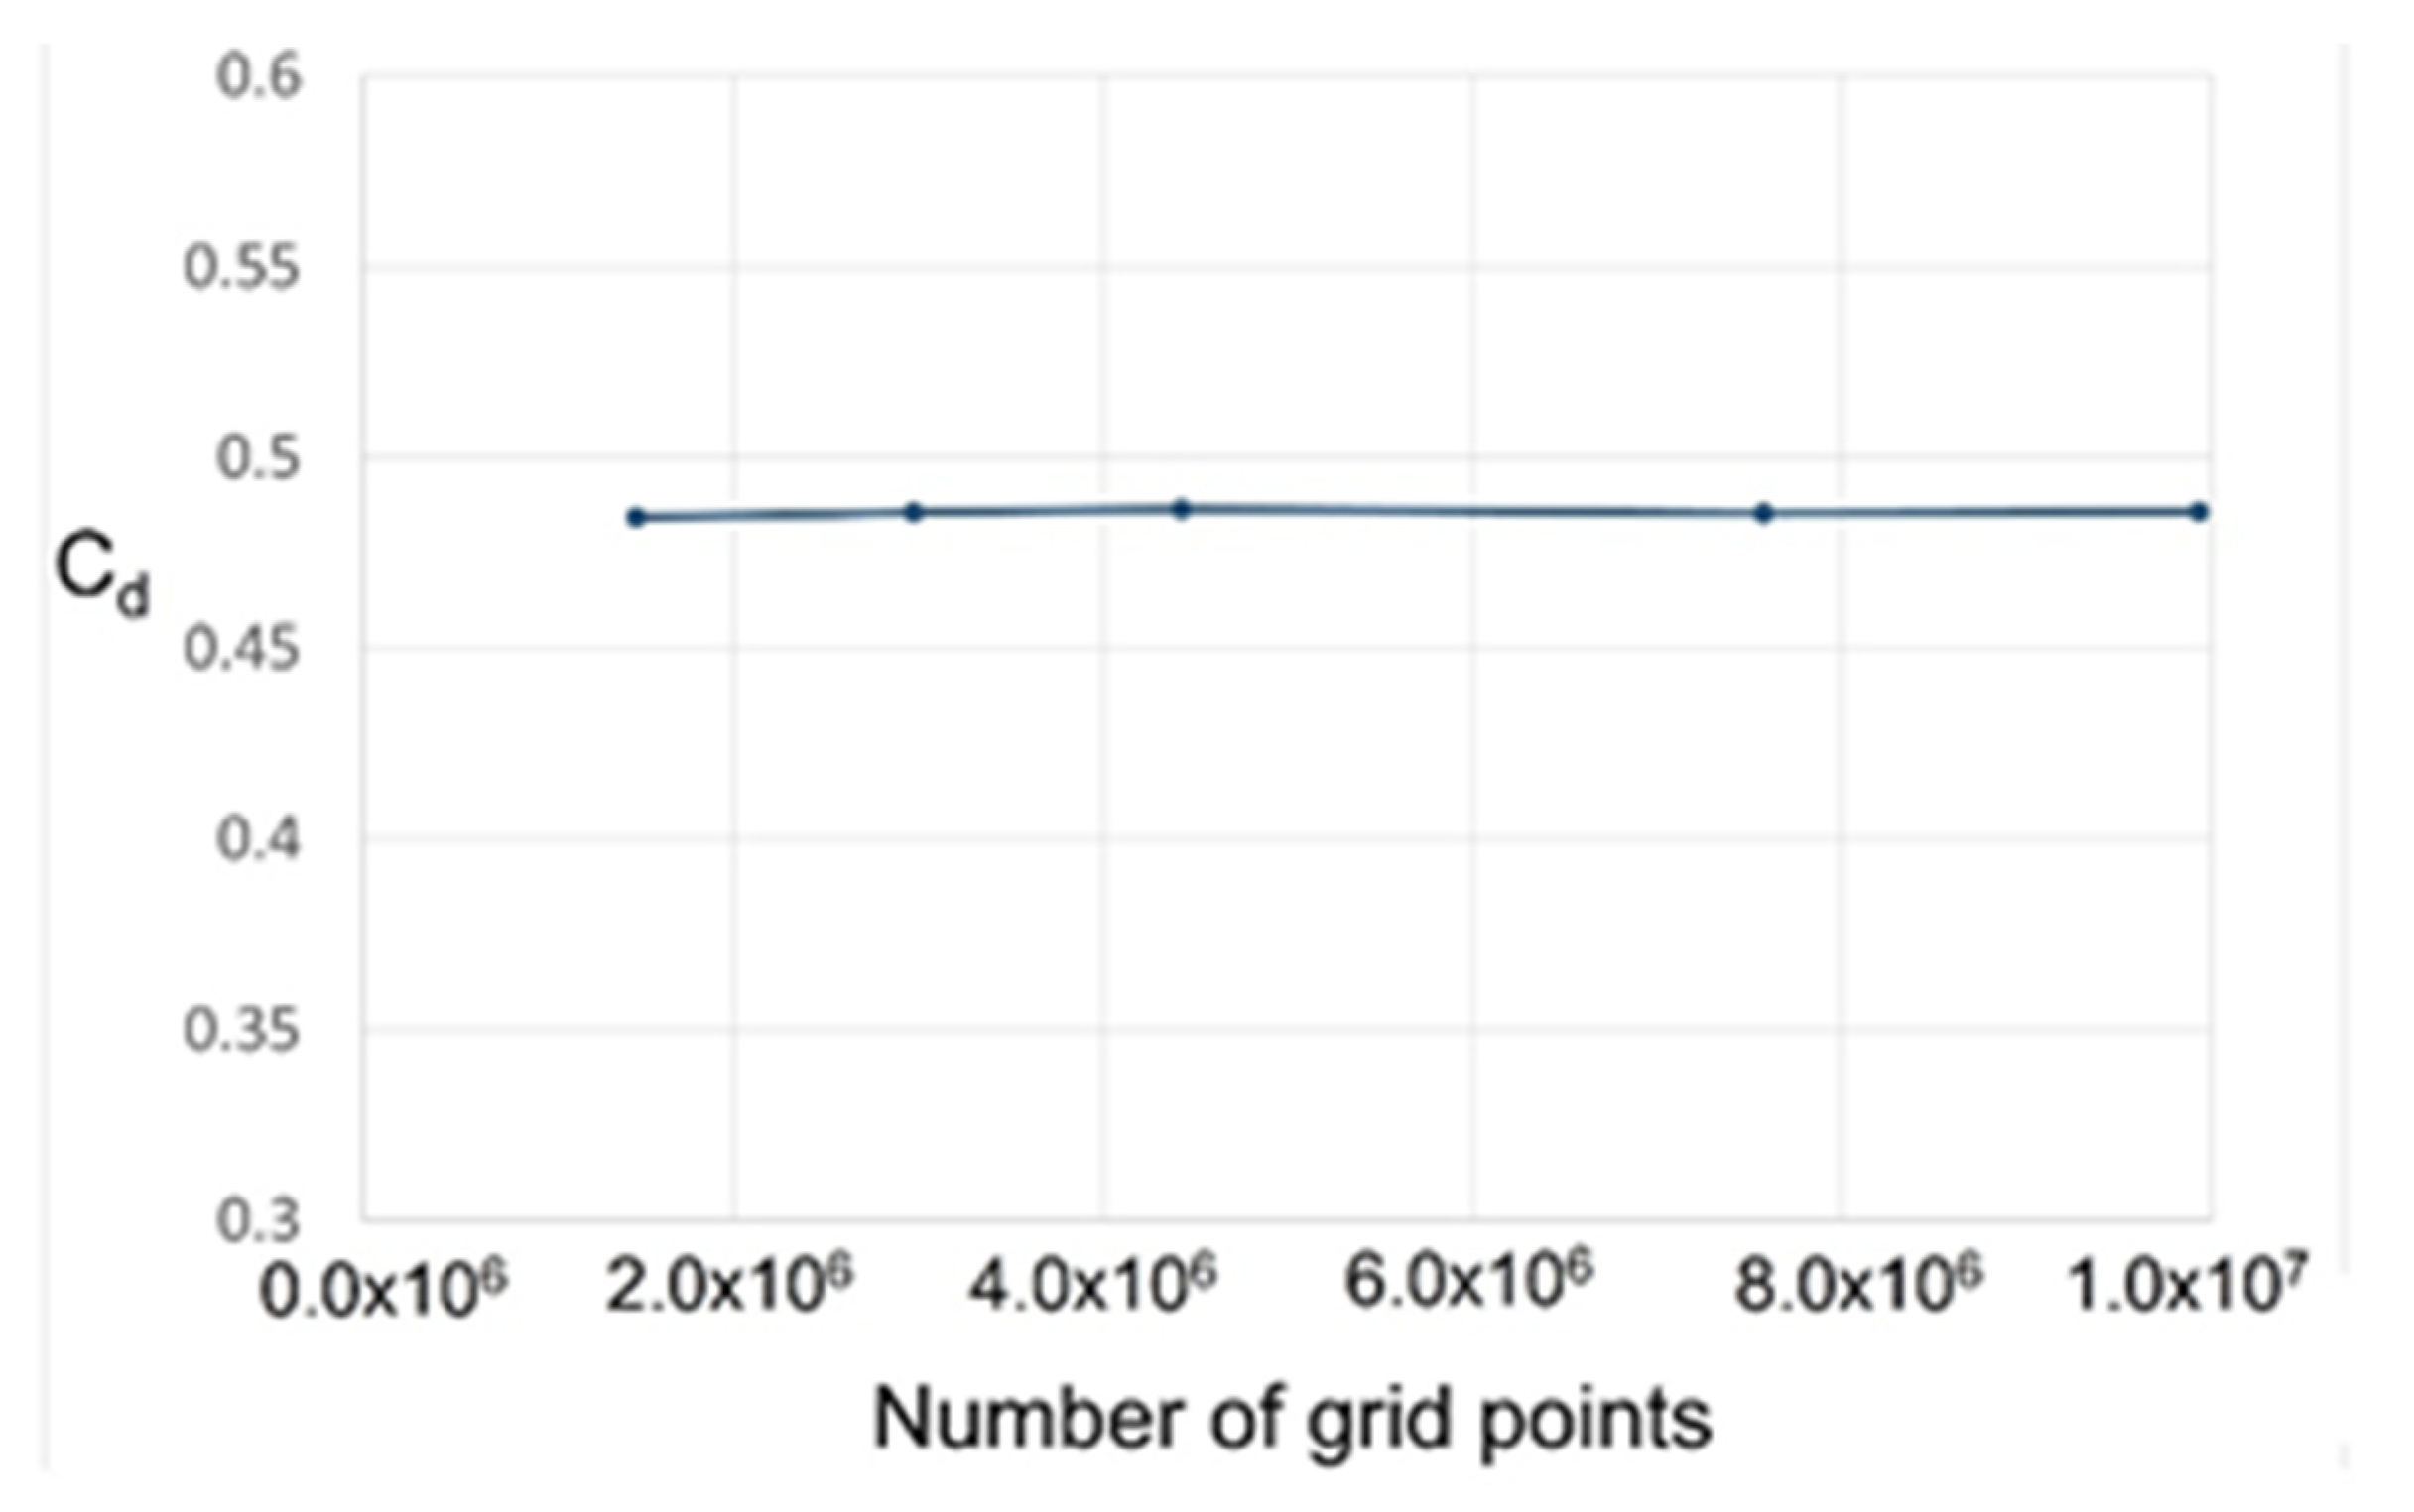
An analysis using k-epsilon turbulence model was then performed to confirm the dependence on grid resolution, and the results are presented in Figure 4. The grid was analyzed using a total of 1.5–9.6 million grid units, and all grids were maintained at y+ < 3. The above results indicate that the discharge coefficient is not significantly changed at a grid resolution of up to 2.0 million, but grids with a resolution of around 7.0 million cannot adequately resolve a part of the flow structure in which complex flow occurs. Hence, in view of the complex flow structures that may occur in the stepped labyrinth seal, the subsequent analysis was conducted using at least 7.0 million grid units.

3. Results

3.1. Discharge Coefficient and Flow Structure

To predict the discharge coefficients and flow structures, and to compare them with experimental values, k-epsilon (RANS) and LES simulations of (i) the straight through labyrinth seal, (ii) the stepped labyrinth seal in which the stepped structure was added to the casing to obtain an additional reduction in discharge coefficient relative to that of the straight-through labyrinth seal, and (iii) the stepped labyrinth seal under the conditions of a stationary or rotating shaft were conducted.

3.1.1. Straight-Through Seal

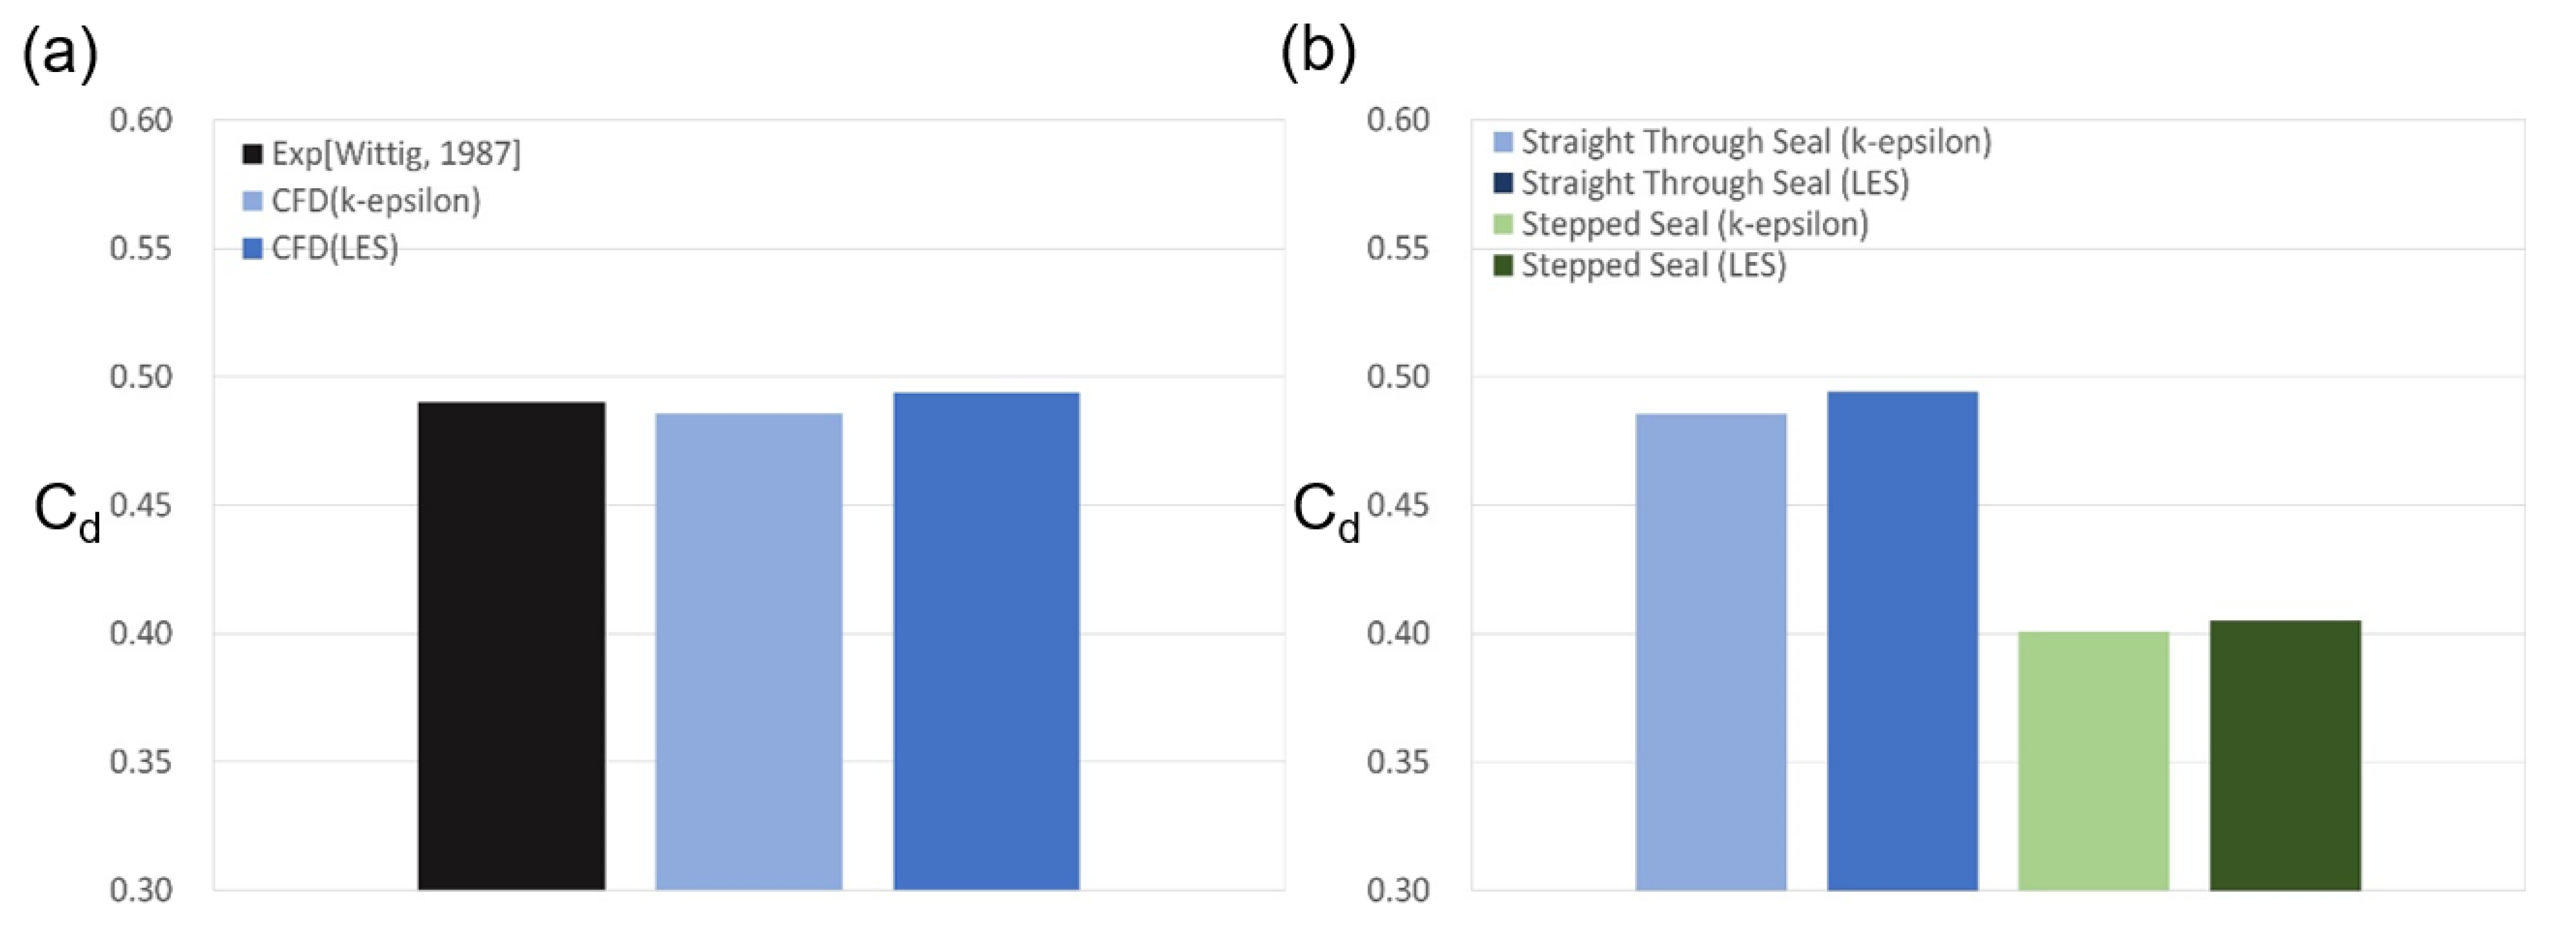
In the case of the straight-through labyrinth seal with the stationary shaft, a steady RANS (k-epsilon) analysis was performed, and so the LES calculation was performed for 3000 timesteps of 0.015 s each commencing from the point at which the change in the discharge coefficient disappeared. The results are presented in Figure 5a, where the discharge coefficient is seen to coincide with the experimental value to within 1% of the error range for both the RANS and LES turbulence models, with the LES predicting a slightly larger coefficient.
As shown in Figure 6, the k-epsilon and LES also predict similar flow structures. Due to the high-pressure gradient between one cavity and the next, the working fluid flowing into the clearance is rapidly accelerated and a vena-contracta is formed. In addition, due to the vortex structure generated inside the cavity, and the dissipation of kinetic energy by interaction between jets, the discharge coefficient shows a small value of about 0.5. However, most of the flow that passes through the clearance at high speed flows into the next clearance, thus allowing the fluid to stay inside the structure for a long time and, hence, resulting in an unsuitable flow structure for dissipating the kinetic energy of the fluid.

3.1.2. Stationary Stepped Seal

The velocity distribution results obtained using k-epsilon and LES at the same grid and time resolutions for the stepped labyrinth seal are presented in Figure 7, and the corresponding discharge coefficients are compared in Figure 5b. Thus, the discharge coefficient of the stepped labyrinth seal is seen to be ~ 17.5% lower than that of the straight-through labyrinth seal, with a difference of ~1% between the LES and RANS analyses. Moreover, a similar flow structure is predicted by the k-epsilon and LES analyses. The significant decrease in the discharge coefficient of the stepped labyrinth seal is due to a rapid change in the flow direction brought about by the stepped structure after passage through the clearance, which delays the inflow into the next clearance. In addition, two further changes in the direction of flow occur as a small vortex is created before the next clearance is entered. This altered flow structure is believed to exert a dominant influence on the discharge coefficient, and presence of the large vortex influences the dissipation of kinetic energy differently to that developed in the straight-through labyrinth seal.

3.1.3. Rotating Stepped Seal

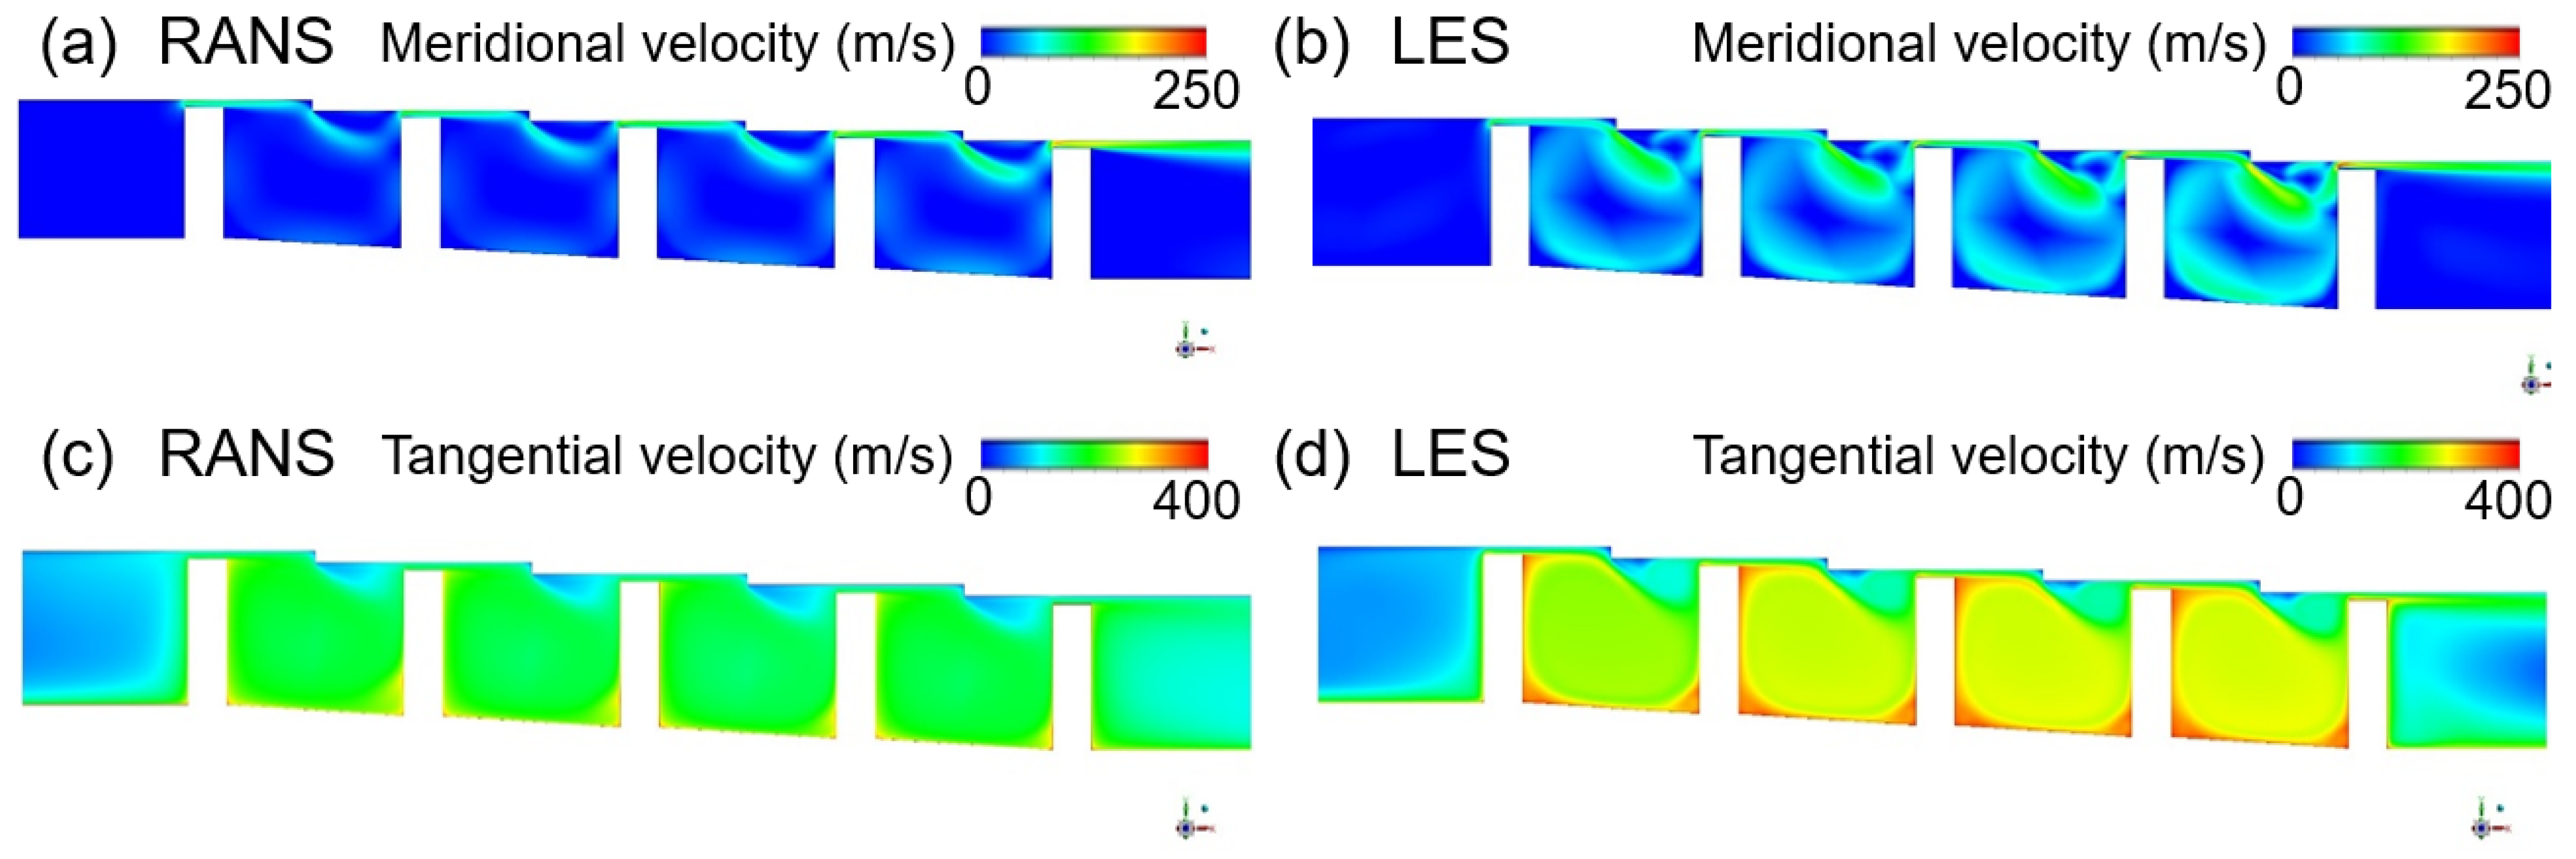
If the shaft rotates at 20,000 RPM when the shaft radius is 200 mm, the tangential speed of the wall is about 430 m/s and, when the non-slip condition is applied, the influence of the shaft rotation upon the flow structure cannot be ignored. The predicted effects of shaft rotation upon the velocity distributions are presented for the two models in Figure 8, and the specific effects of the tangential fluid velocity upon the discharge coefficient are presented in Figure 9a. Here, the k-epsilon model predicts that shaft rotation will lead to a decrease of ~3.8% in the discharge coefficient relative to that obtained with the stationary axis, while the LES analysis predicts a decrease of ~7.2%. For the flow structure in the xy plane, which exerts a dominant influence on the leakage of the working fluid, the k-epsilon model predicts a similar flow field in both the rotational and stationary states, whereas the LES predicts a somewhat large rotational speed for the vortex generated inside the cavity.
As shown in Figure 9b, the two models also give different results for the average tangential velocity, with the LES analysis giving an ~14.6% larger value. For this reason, it is impossible to accurately predict the generation and dissipation of turbulence due to shear stress in a stationary wall, which is closely related to the tangential velocity, via the k-epsilon model. Consequently, the predicted changes in the discharge coefficient and flow structure according to the operating conditions are also difficult to trust.

3.2. Turbulence Kinetic Energy Estimation

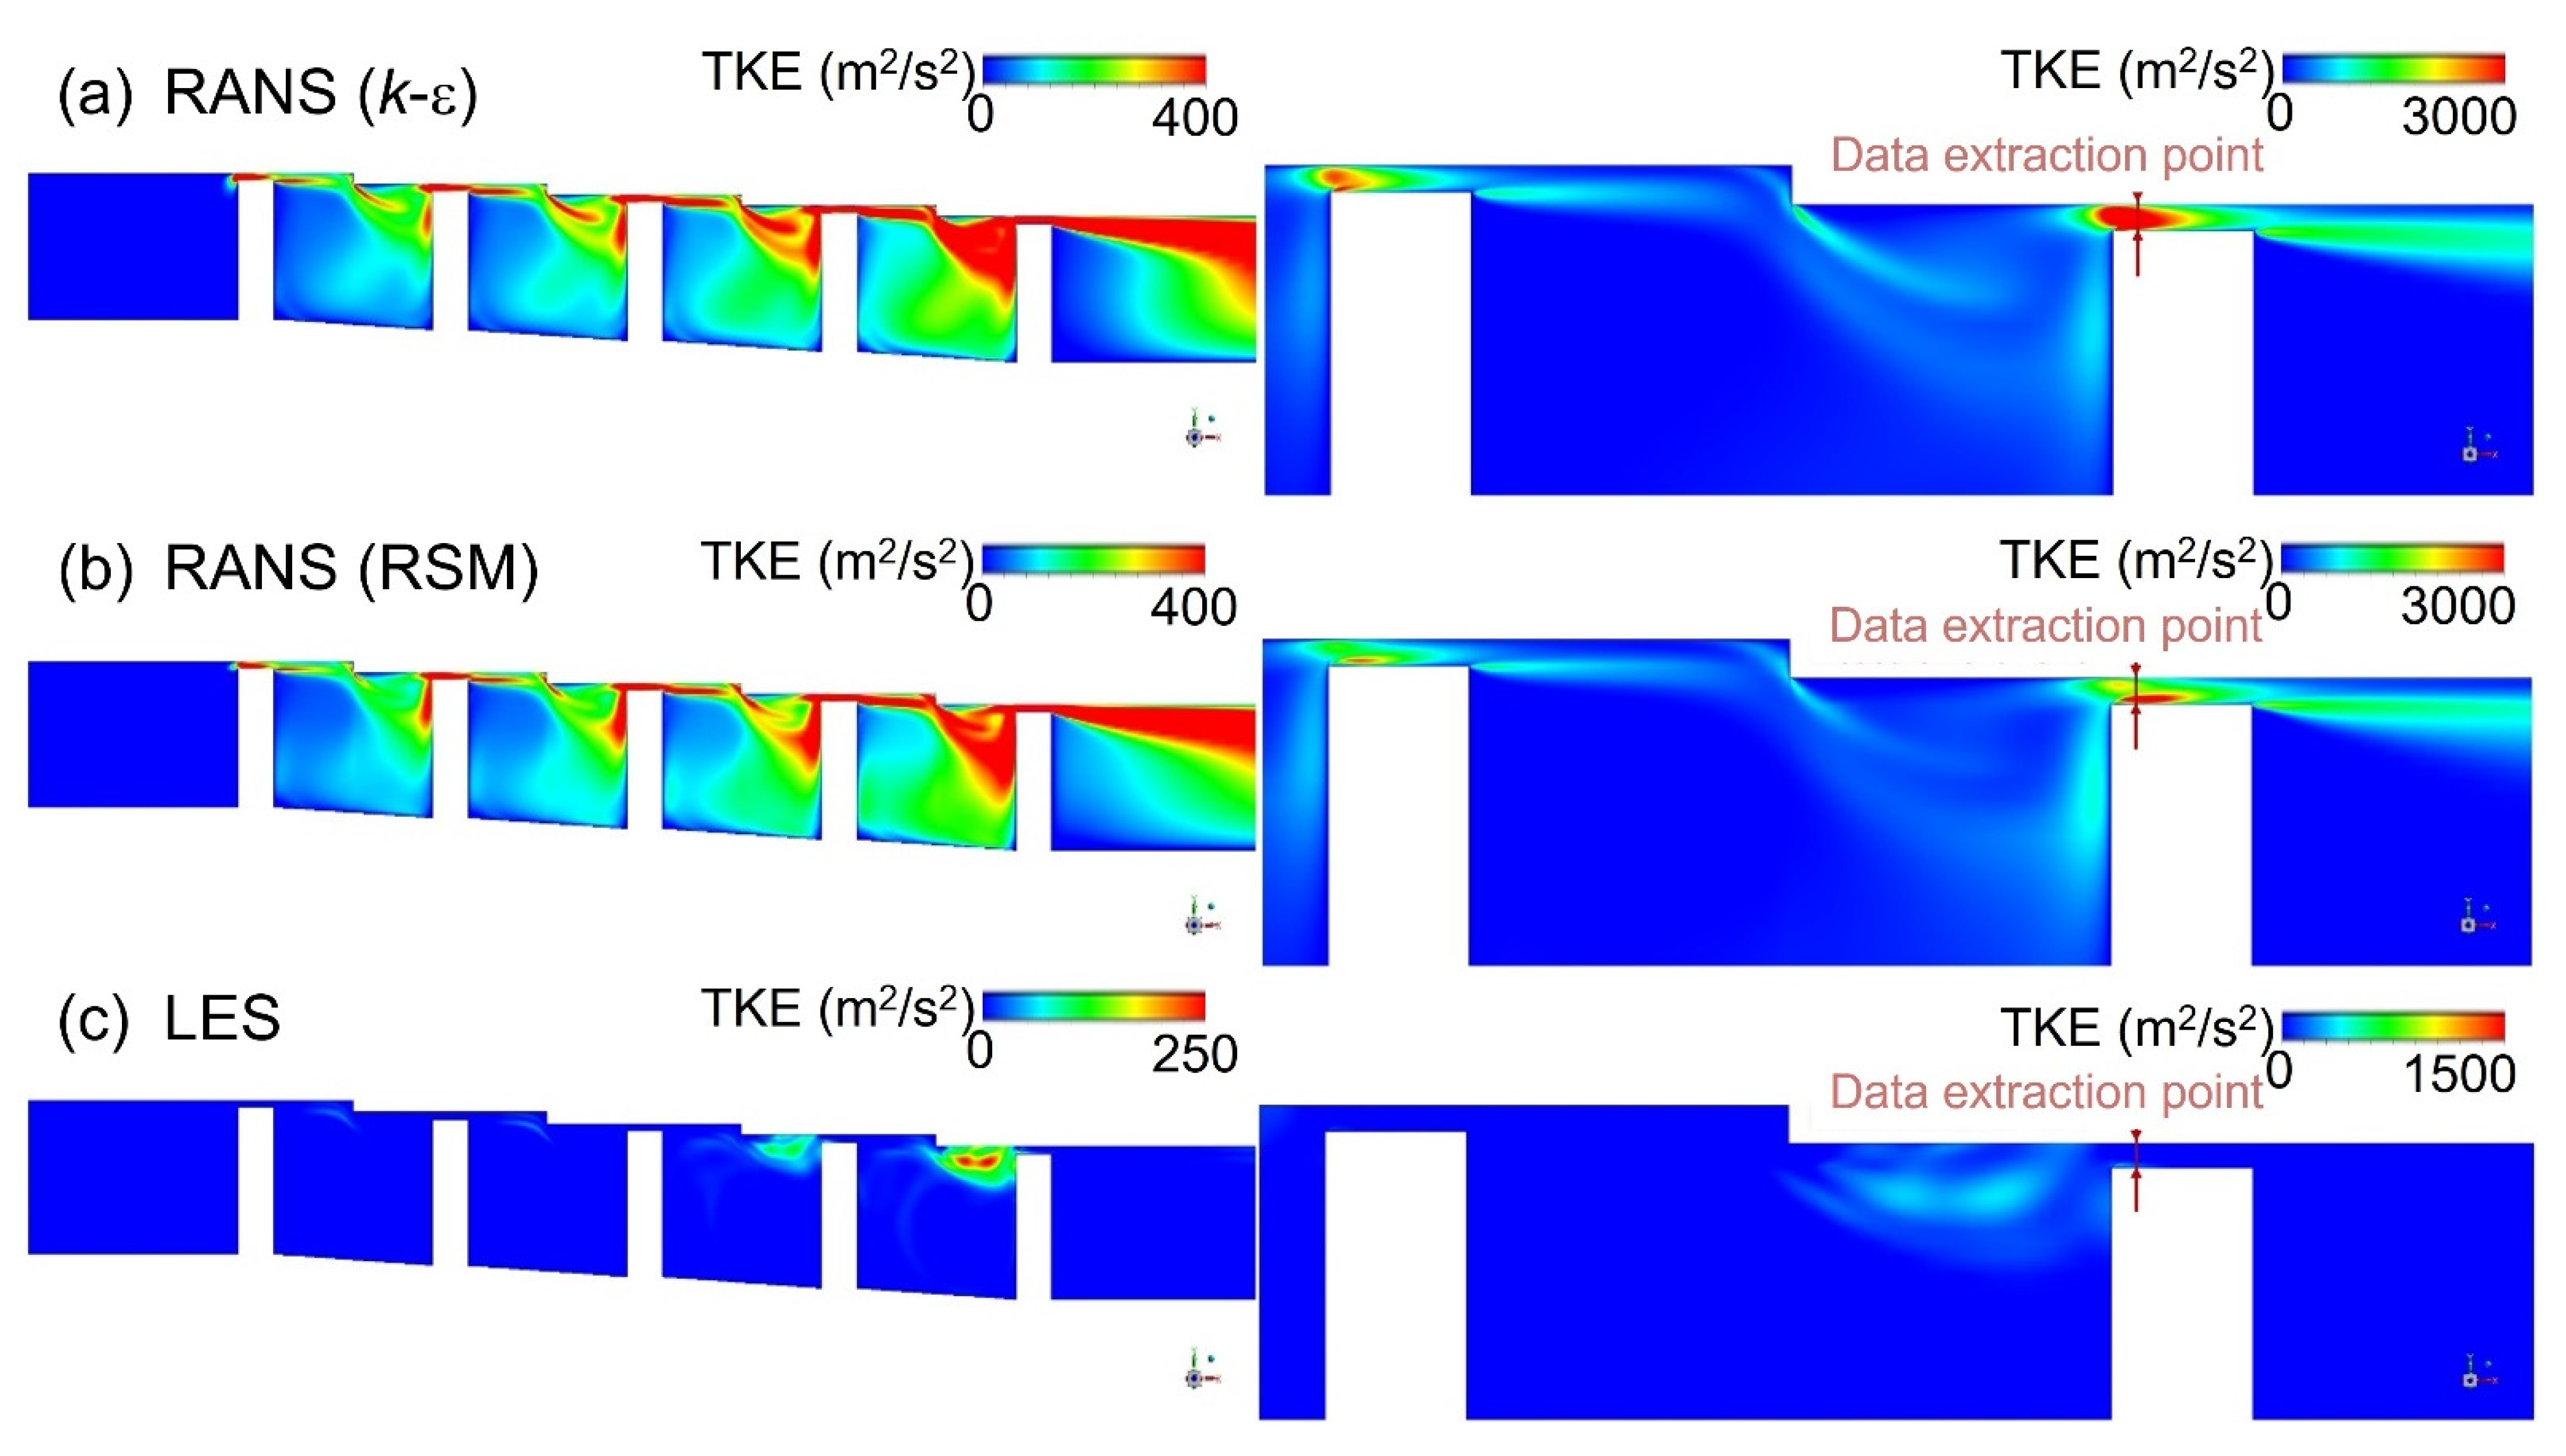
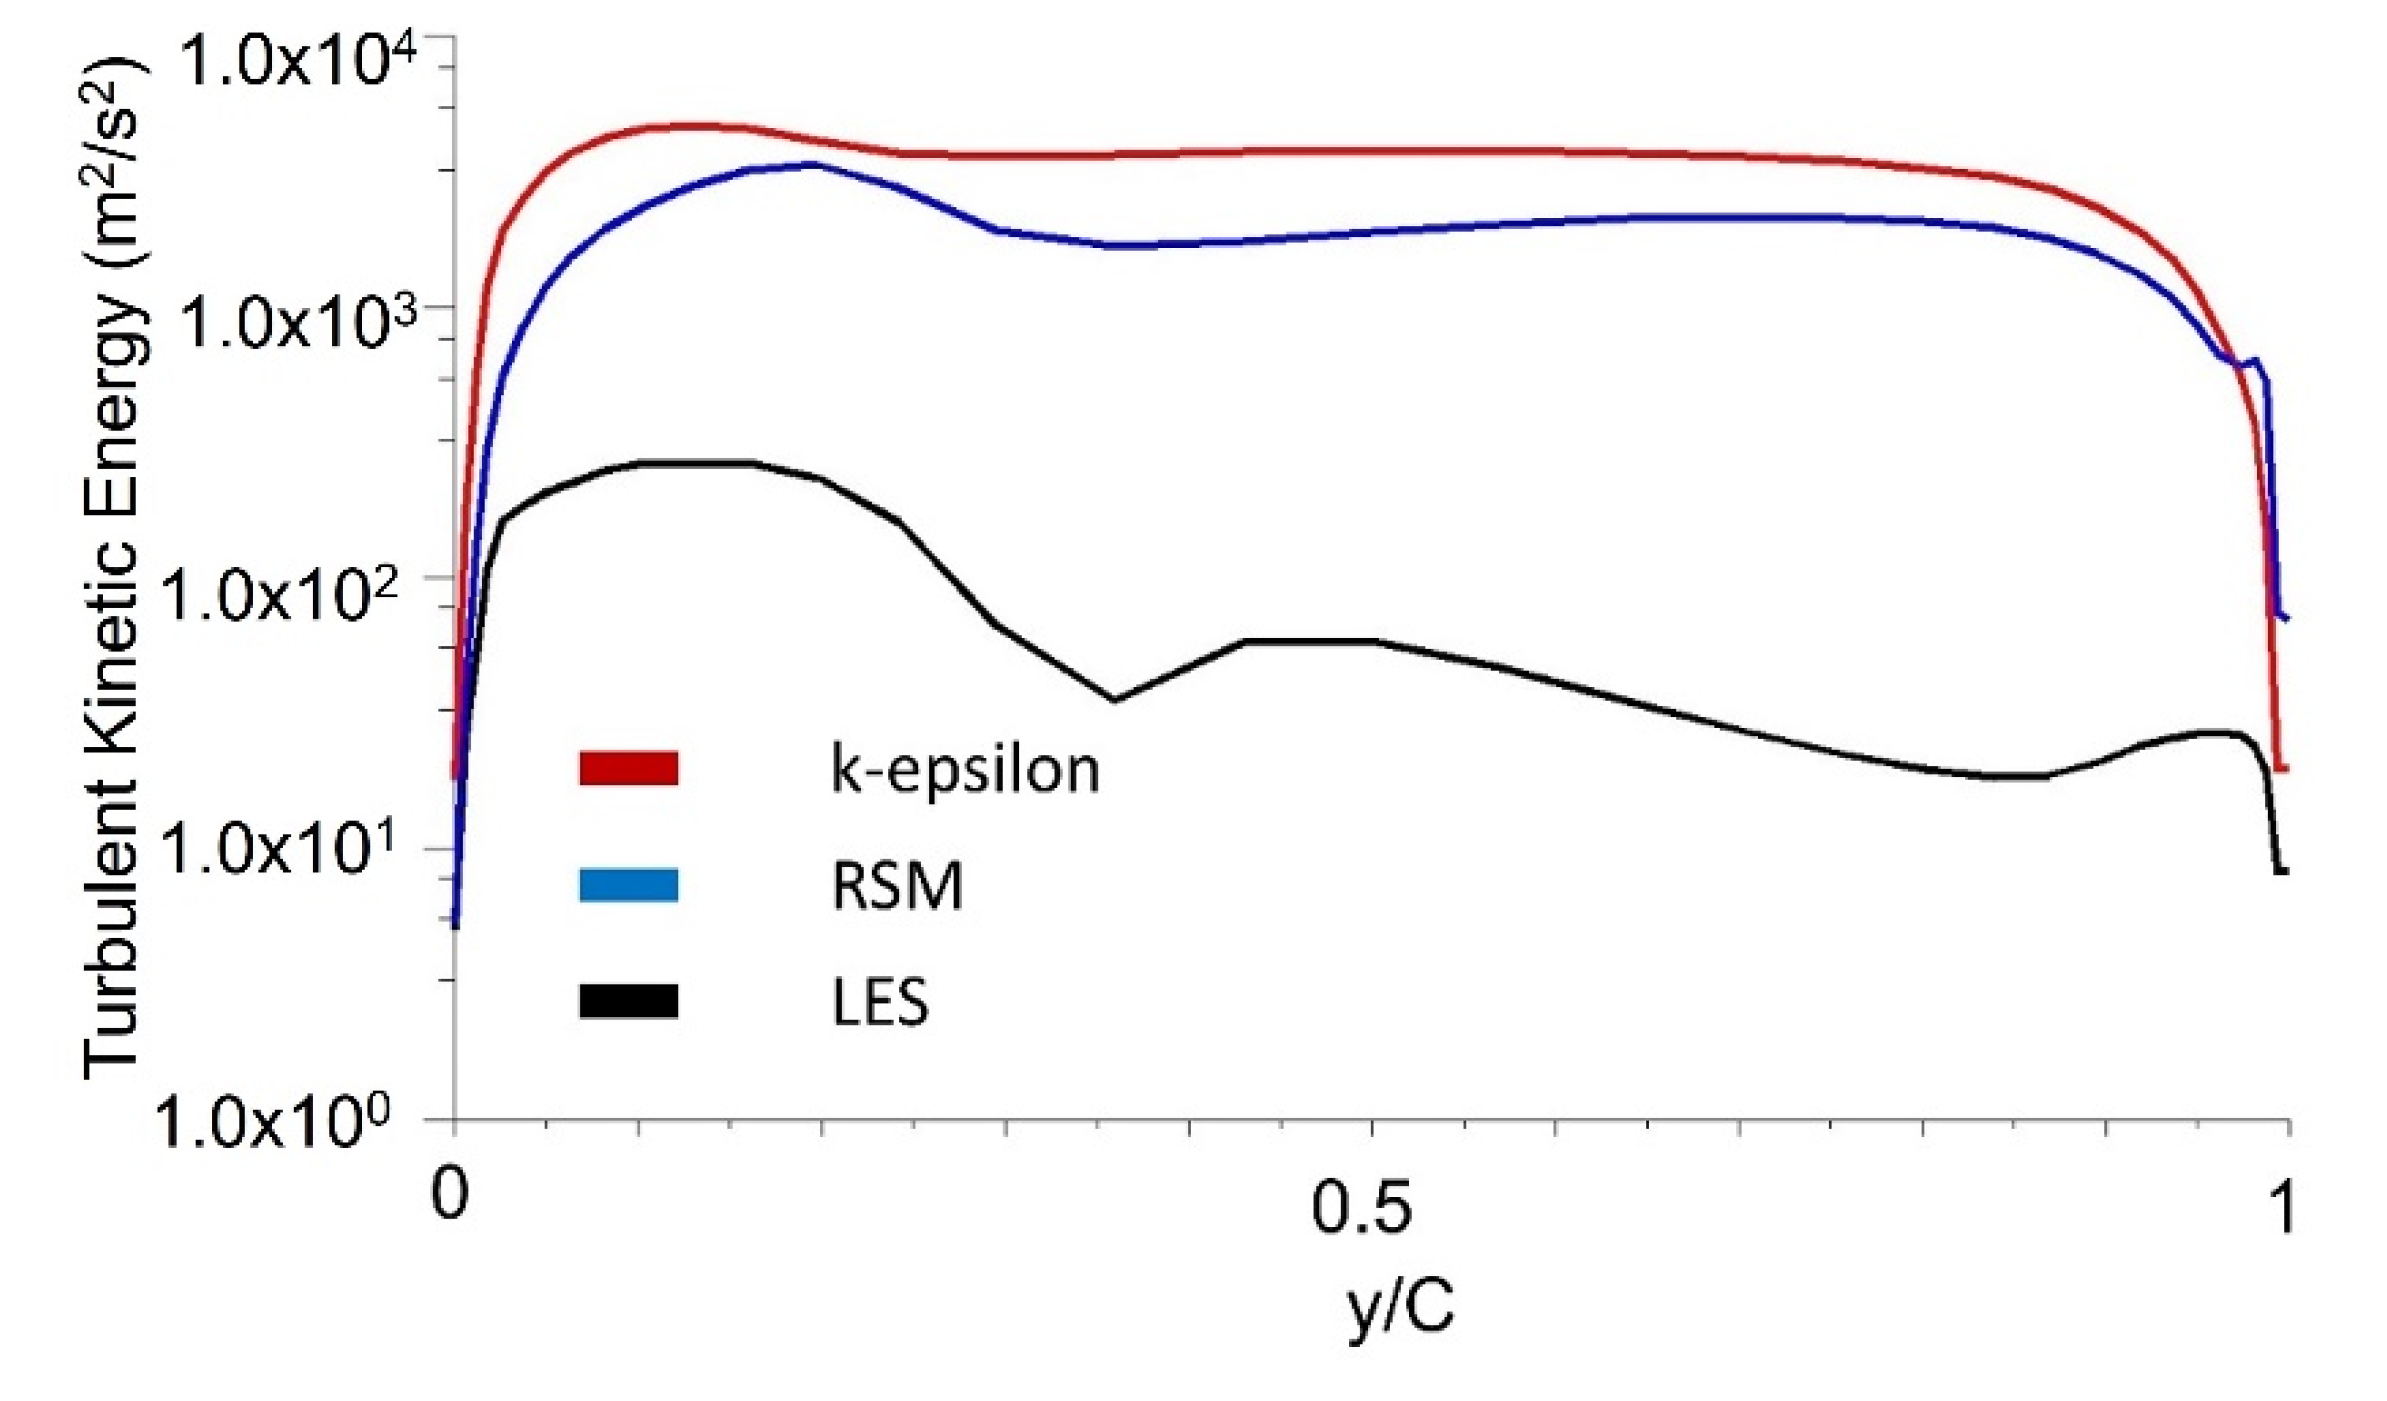
The results of turbulence kinetic energy simulation in the stepped labyrinth seal using the k-epsilon (k-ε) model are compared with those obtained via the response surface methodology (RSM) and LES models in Figure 10. Thus, the k-epsilon model predicts a significant amount of turbulence kinetic energy in the area flowing into the clearance (Figure 10a), which is clearly different from the experimentally observed phenomenon. In fact, even if a fluid flows into a large area of turbulence kinetic energy from a large-scale eddy, the flow rapidly transforms via a set of relatively small velocity changes into a laminar flow structure and has a very small amount of turbulence kinetic energy. Therefore, when the k-epsilon model is applied, the turbulence kinetic energy at the clearance is not accurately predicted, which may cause uncertainty in predicting the flow structure and discharge coefficient. Moreover, the error resulting from the isotropic analysis is confirmed by the RSM results in Figure 10b. Further, the corresponding turbulence kinetic energy profiles in Figure 11 indicate that the accuracy of the RSM model is slightly increased relative to that of the k-epsilon model, with about half as much turbulence kinetic energy being predicted at the clearance. Nevertheless, the predicted kinetic energy remains excessively large. Therefore, even if the applied turbulence model takes account of anisotropy, it is impossible to accurately predict the turbulence kinetic energy at the clearance. This can be assumed to be a fundamental problem with the RANS-based turbulence model.
By contrast, the turbulence kinetic energy is accurately predicted by application of the LES, as shown in Figure 10c. Here, the large amount of turbulence kinetic energy present before the fluid flows into the clearance is dissipated as soon as the clearance is entered. This can be explained according to the governing equation of the RANS-based turbulence kinetic energy model, given here in 2D form as Equation (12):
U k x i + V k x j = u i u i ¯ U x i u j u j ¯ V x j u i u j ¯ ( U x j + V x i ) x i [ k u i ¯ + ( ( p u i ¯ ) ρ ) ] x j [ k u j ¯ + ( ( p u j ¯ ) ρ ) ] ε k
Here, the velocity gradients are included in the terms for production by normal stresses and shear stresses. Since the fluid accelerates significantly when it flows into the clearance, the velocity gradient inevitably has a high value in this region. For this reason, turbulence modeling techniques such as k-epsilon and k-omega SST and RSM models lead to turbulence kinetic energy predictions that differ significantly from the experimentally observed values in sections with a large velocity gradient. By contrast, since the LES analysis directly resolves the turbulence kinetic energy without modeling it, this error does not occur, thus allowing accurate prediction of the generation and dissipation of turbulence kinetic energy, along with prediction of the experimentally-observed rapid inflow to the cavity prior to development of the eddy structure in the clearance.

3.3. Flow Structure Effects on Mass Flow Rate Oscillation

The generation and dissipation of kinetic energy by shear stress has a major effect in reducing the discharge coefficient of the fluid. As discussed above, when turbulence is modeled, accurate prediction of turbulence kinetic energy cannot be guaranteed. Therefore, in this section, the flow structure having a dominant effect on the fluctuation of the discharge coefficient is analyzed based on the oscillation of the turbulence kinetic energy that can be confirmed via LES. In addition, the changes in the flow structure that operate in the stationary and rotating shaft states are discussed.

3.3.1. Stationary Condition

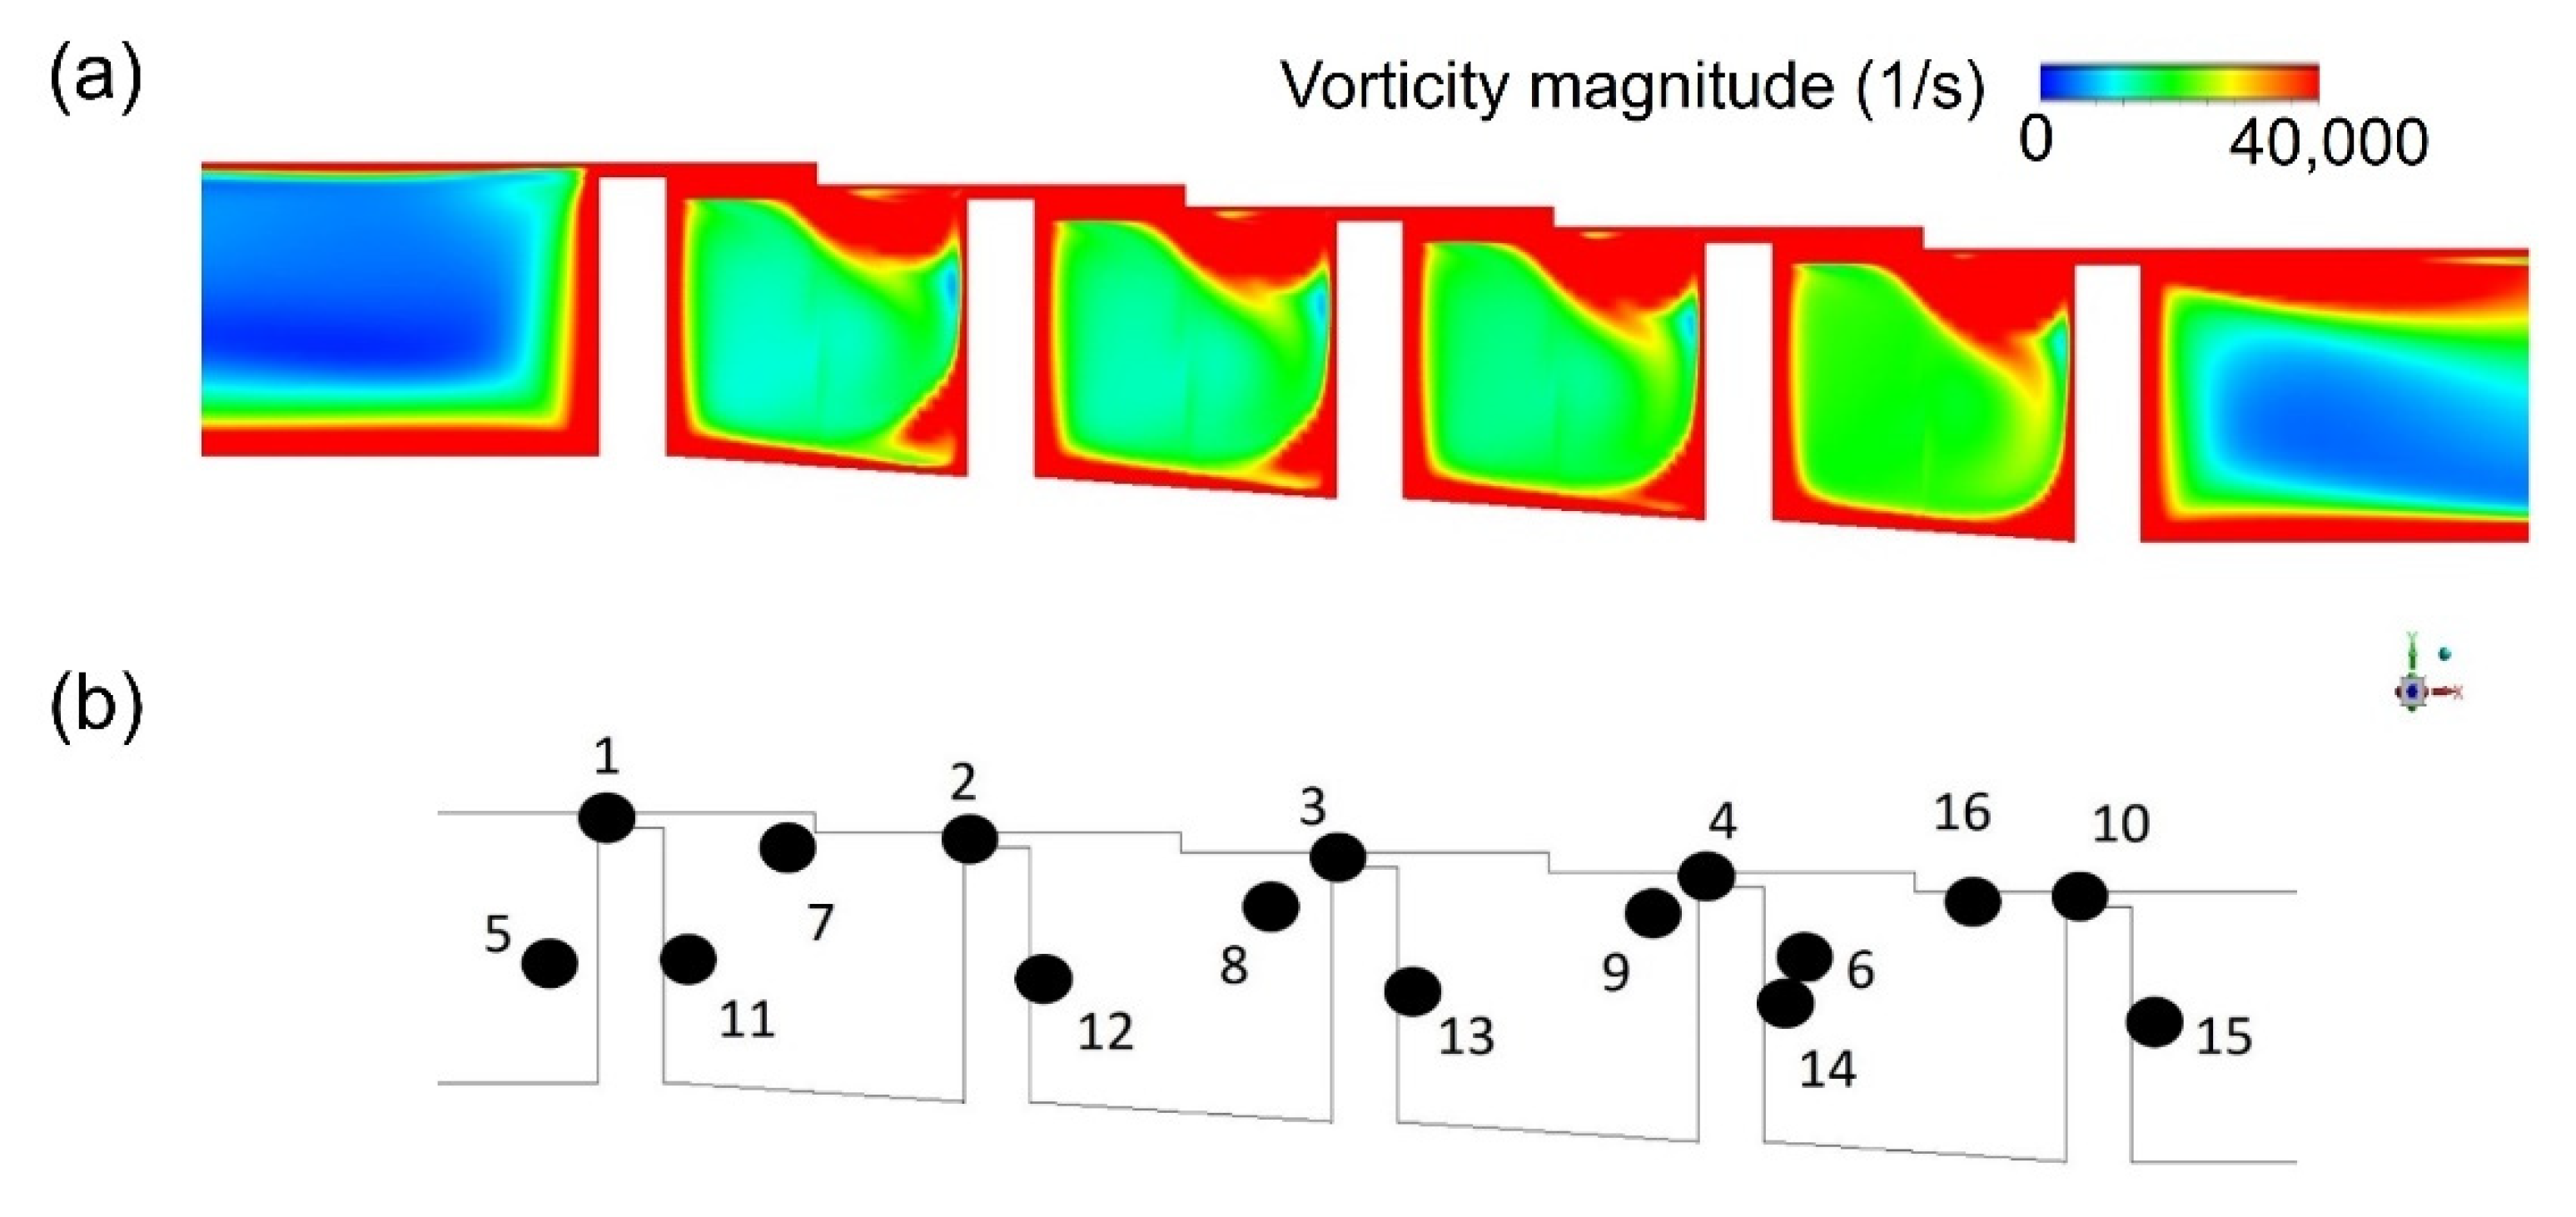
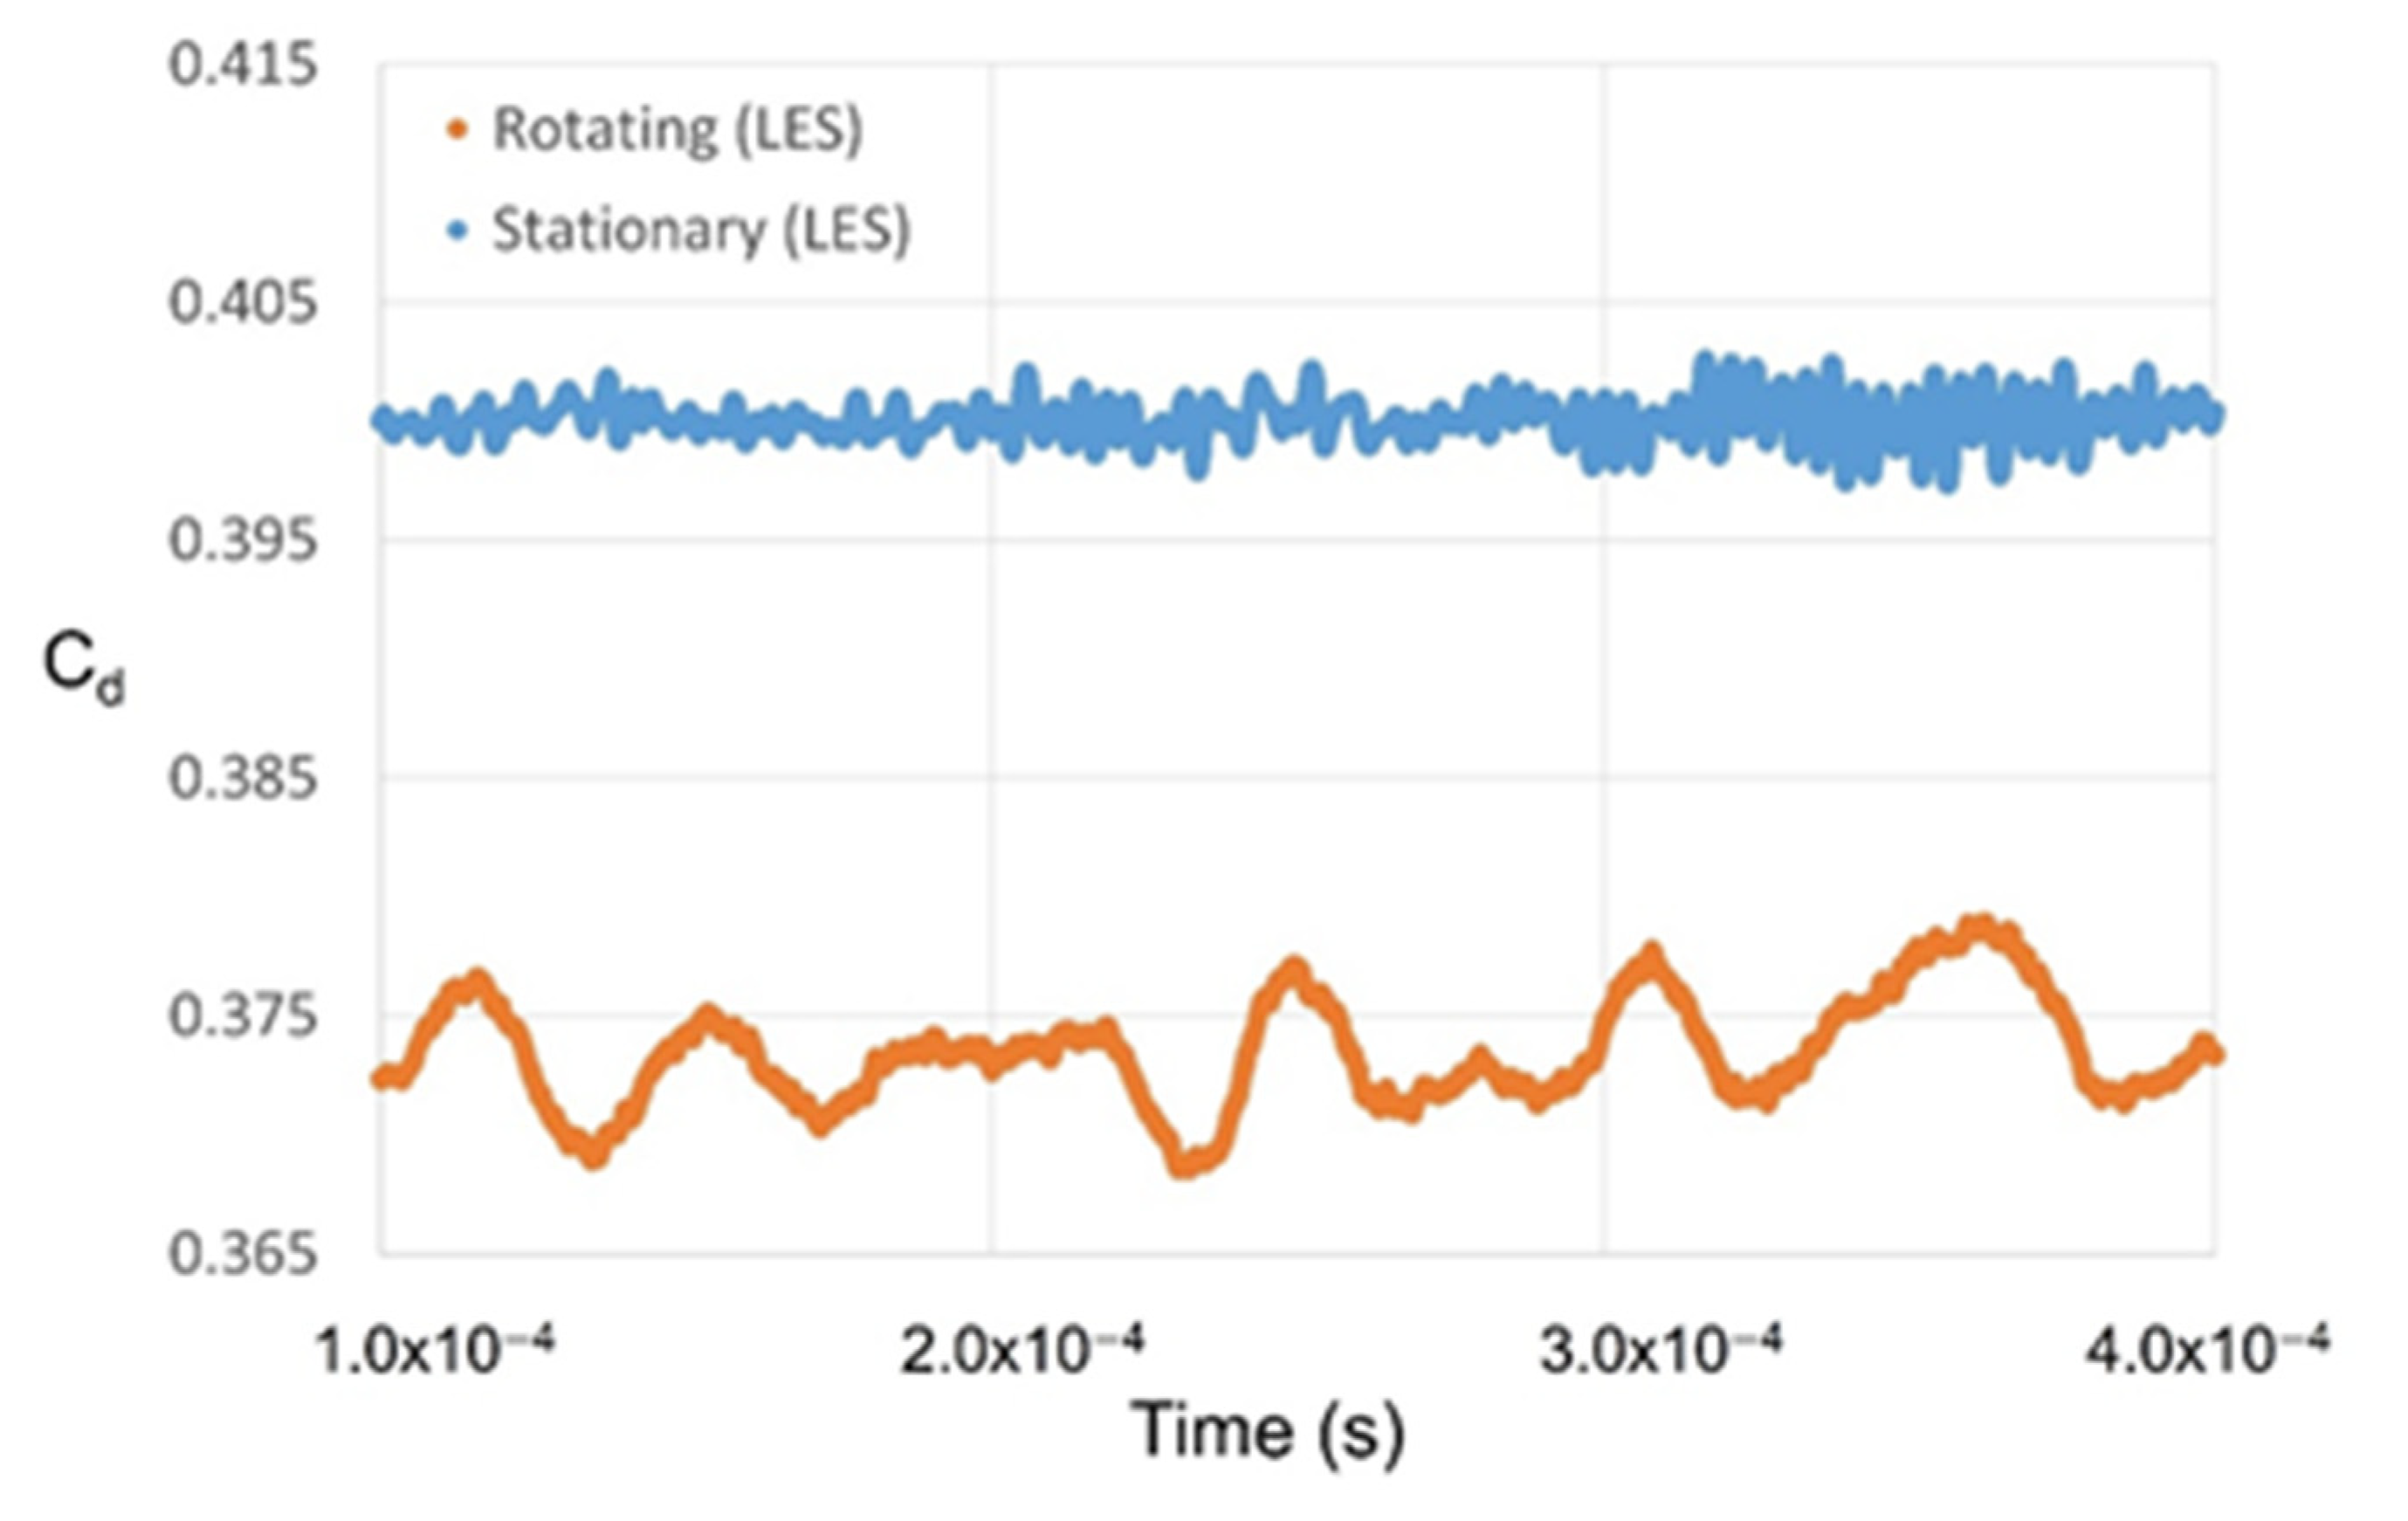
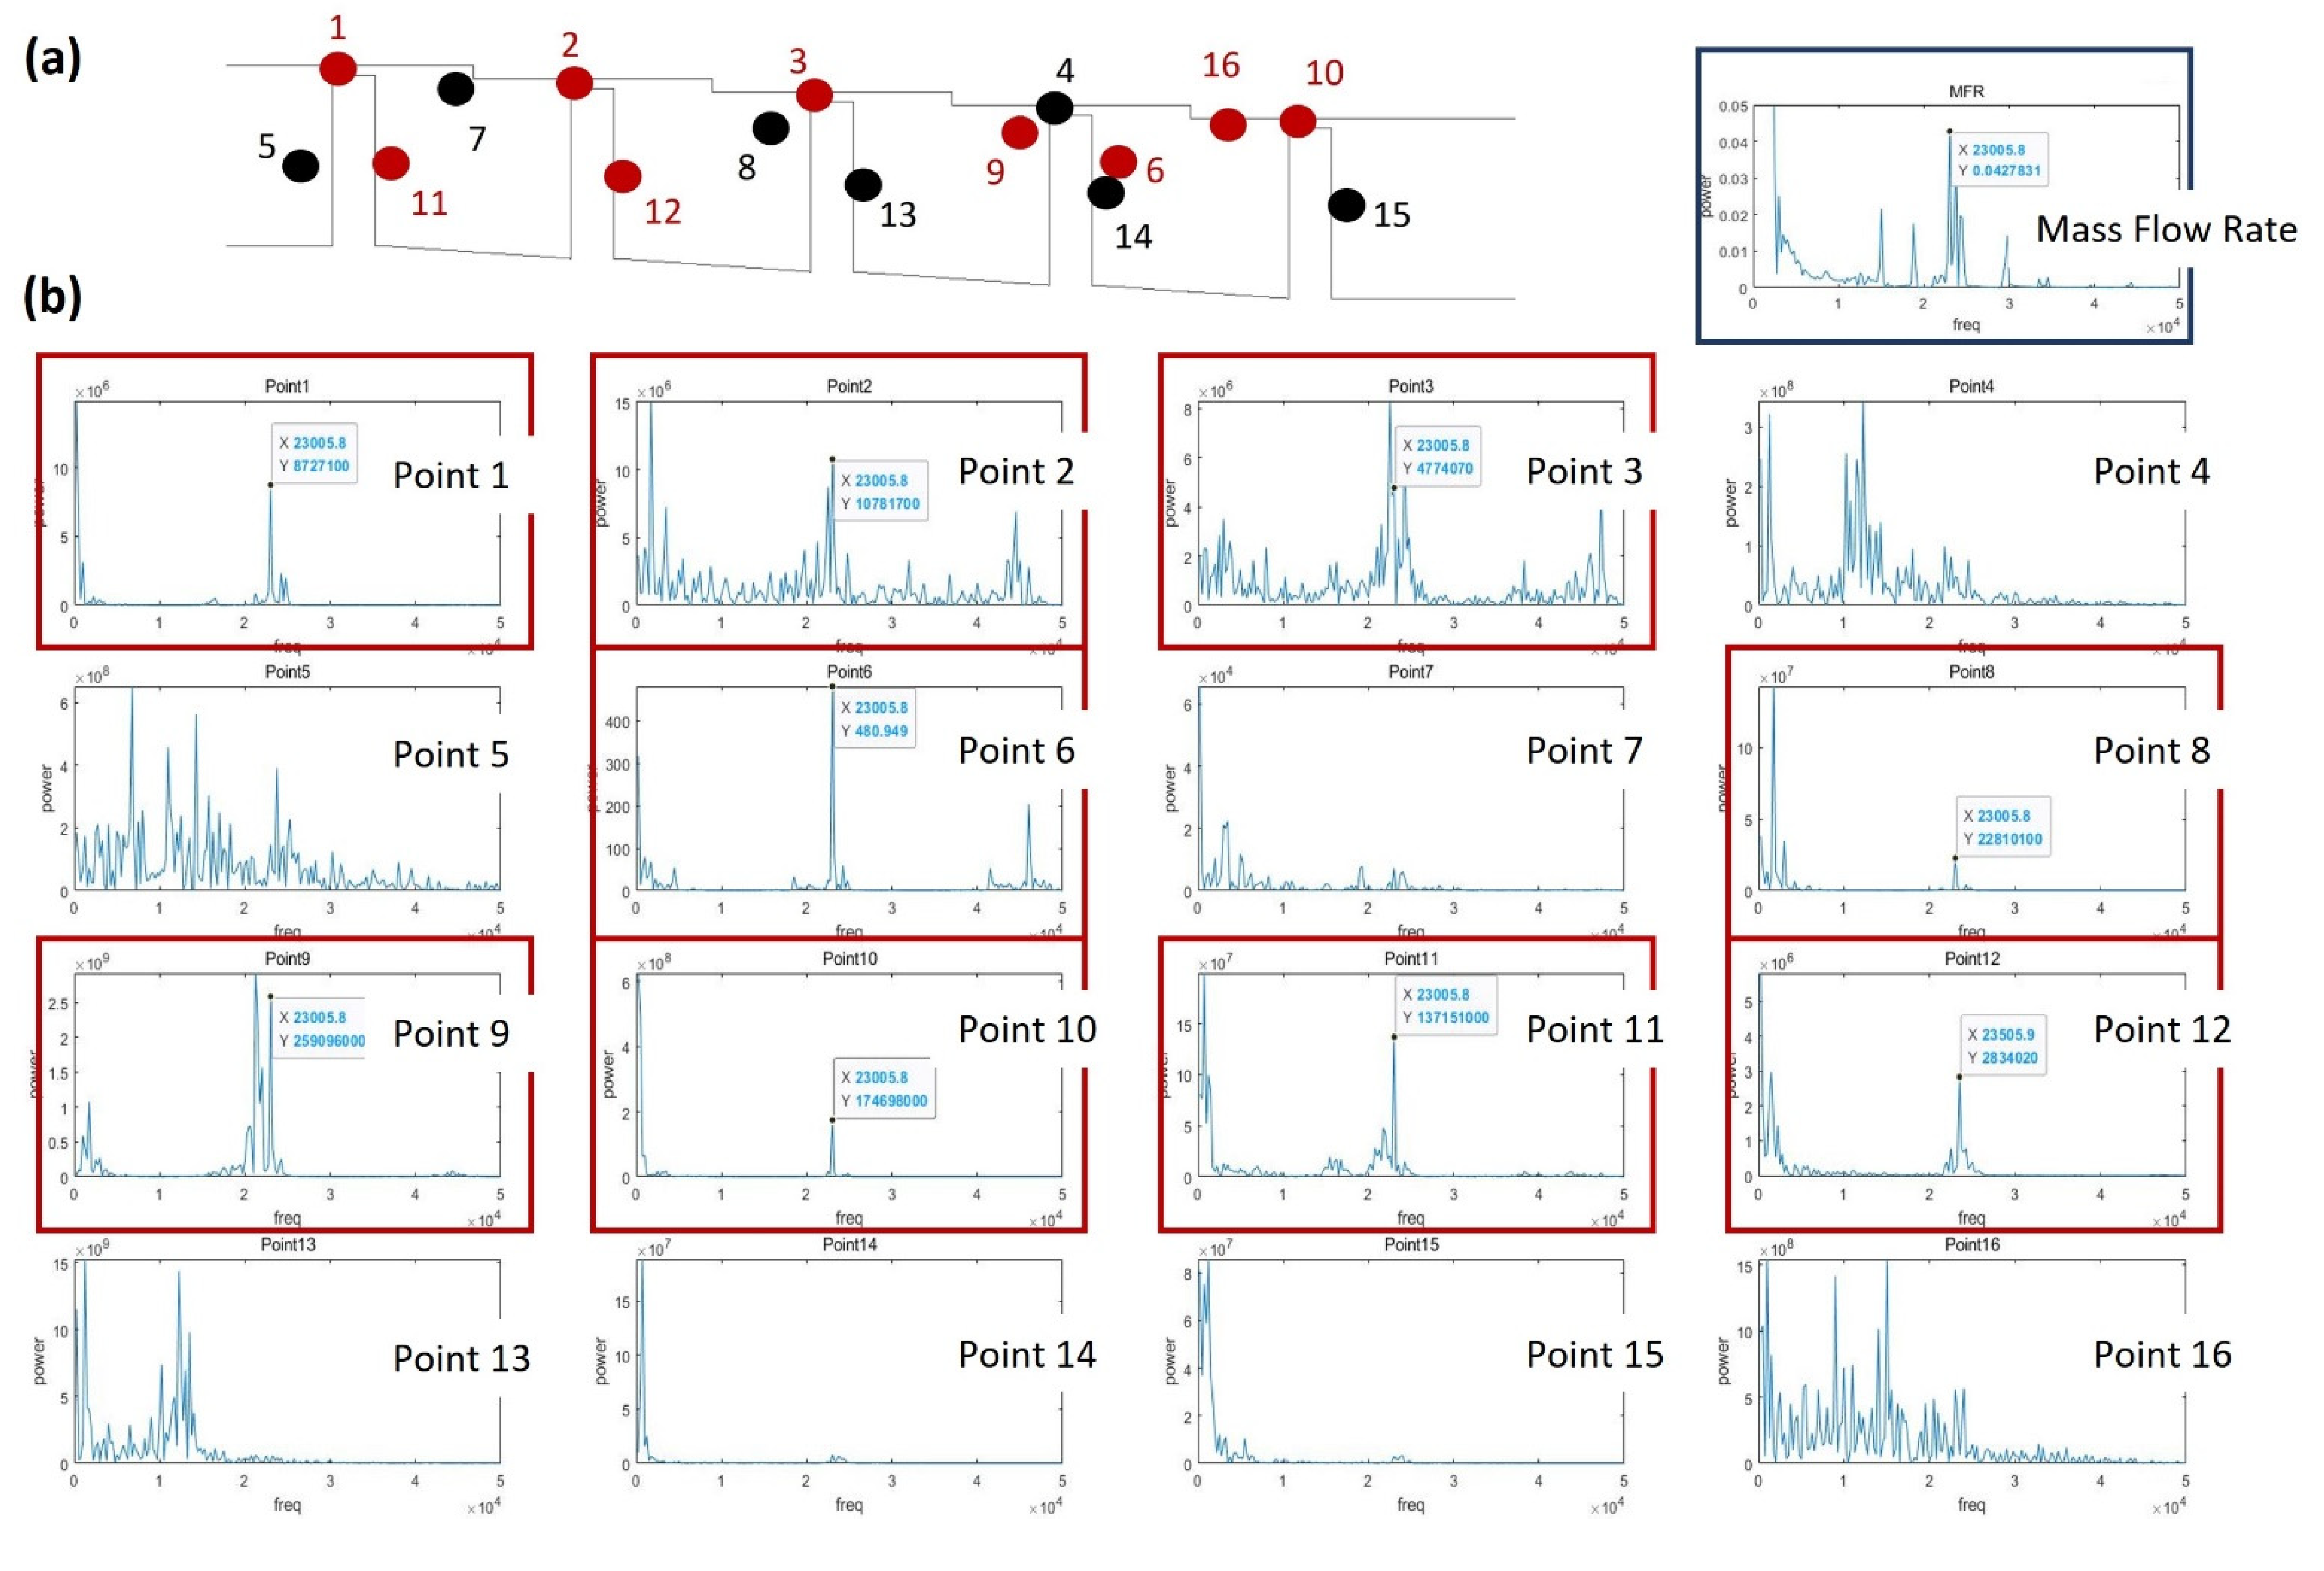
The vorticity magnitude [31] obtained by simulation using the k-epsilon model was used to specify the position where the oscillation of turbulence kinetic energy due to the velocity gradient is expected to appear, as shown in Figure 12. An LES analysis was then performed to obtain the turbulence kinetic energy and leakage flow rate data at the corresponding points (Figure 13). The oscillation of points in the flow structure due to turbulence kinetic energy having a dominant effect on the discharge coefficient is expected to exhibit the same frequency as that of the discharge coefficient. This is confirmed by comparing the total amount of energy at each frequency via Fast Fourier Transform (FFT) analysis. The fluctuation frequency of the discharge coefficient was found to be ~25,000 Hz, and the amplitude was ~0.003. The points having peaks at matching frequencies are shown in Figure 14, thus indicating that leakage of the working fluid when the shaft is in the stationary state is greatly affected by the flow structure formed in the major vortex inside the cavity and clearance.

3.3.2. Rotating Condition

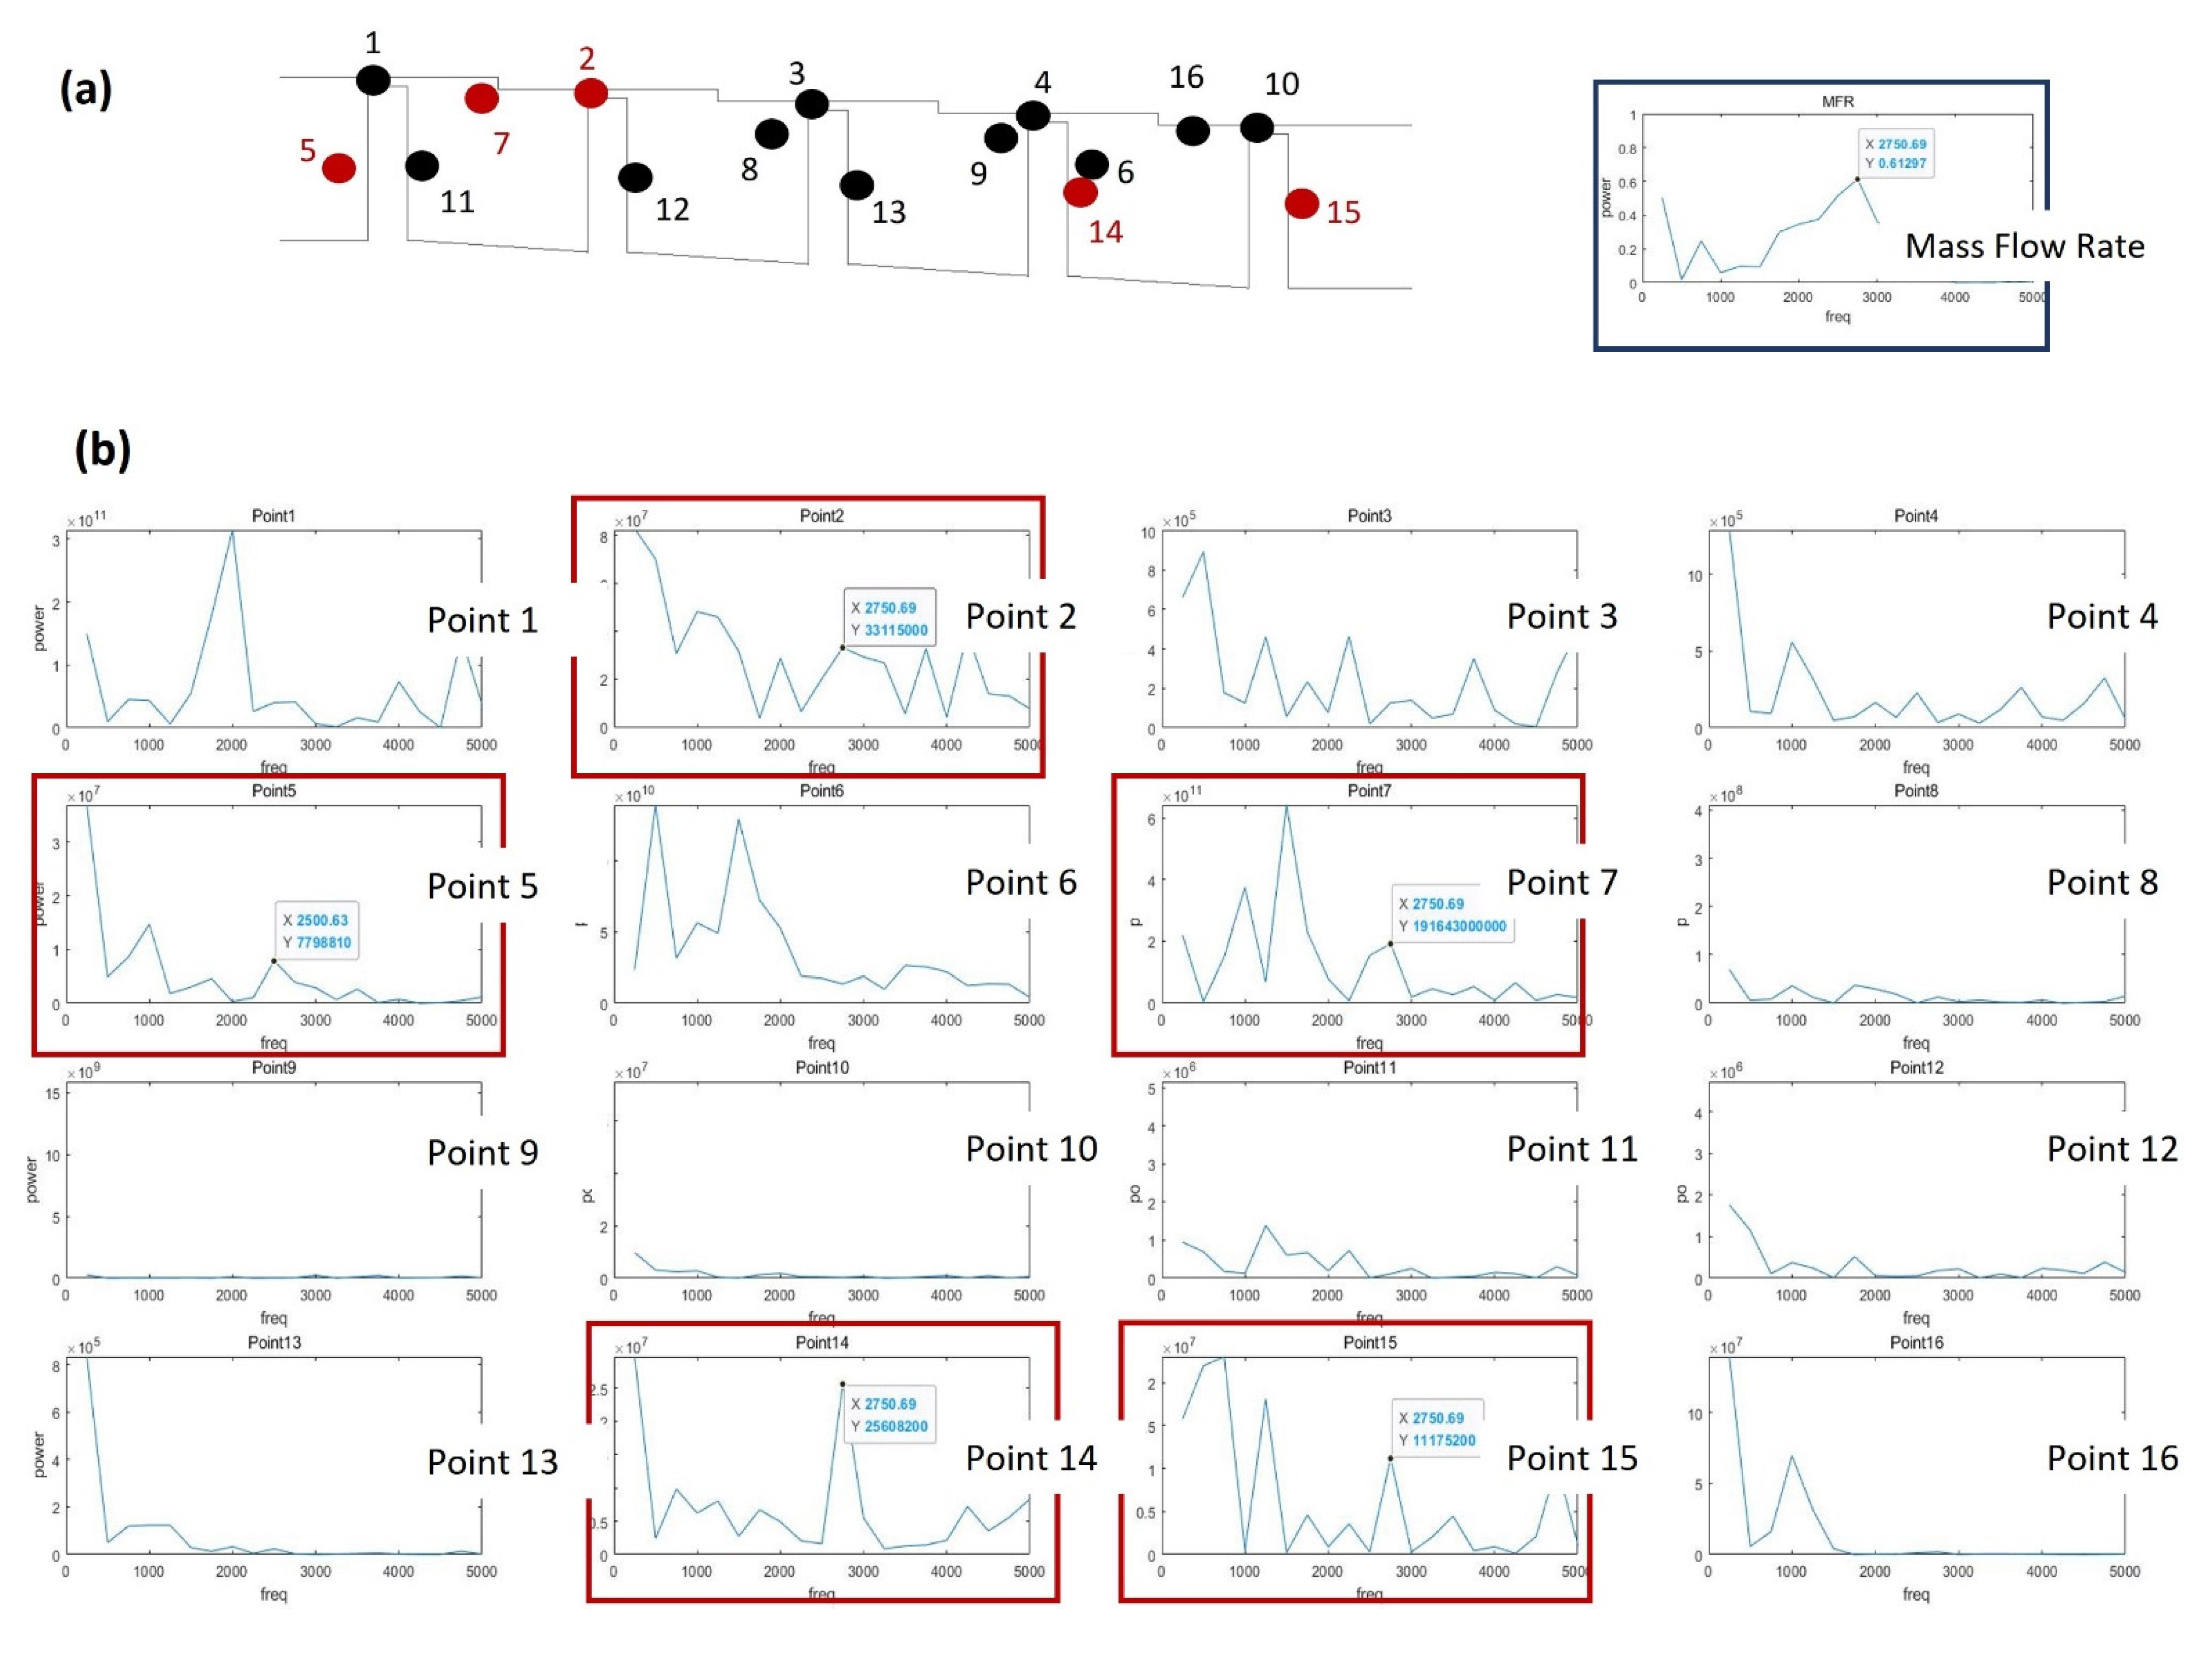
The oscillation of the discharge coefficient obtained via LES analysis when the shaft rotates at 20,000 RPM is presented in Figure 13. Here, the fluctuation frequency is seen to have decreased by about a factor of 10 (to 2500 Hz) compared to the stationary shaft condition, while a three-fold increase the amplitude (to ~0.01) is observed. The FFT analysis of the turbulence kinetic energy signal at each point is presented in Figure 15, where the points that match the frequency of the discharge coefficient are indicated by the full red circles in part (a), and the locations of the points on the stepped labyrinth seal are indicated by the red-outlined panels in part (b). These results indicate that most of the influence of the large-scale vortex disappears when the shaft rotates, and the turbulence kinetic energy is the same in both the inlet and outlet.
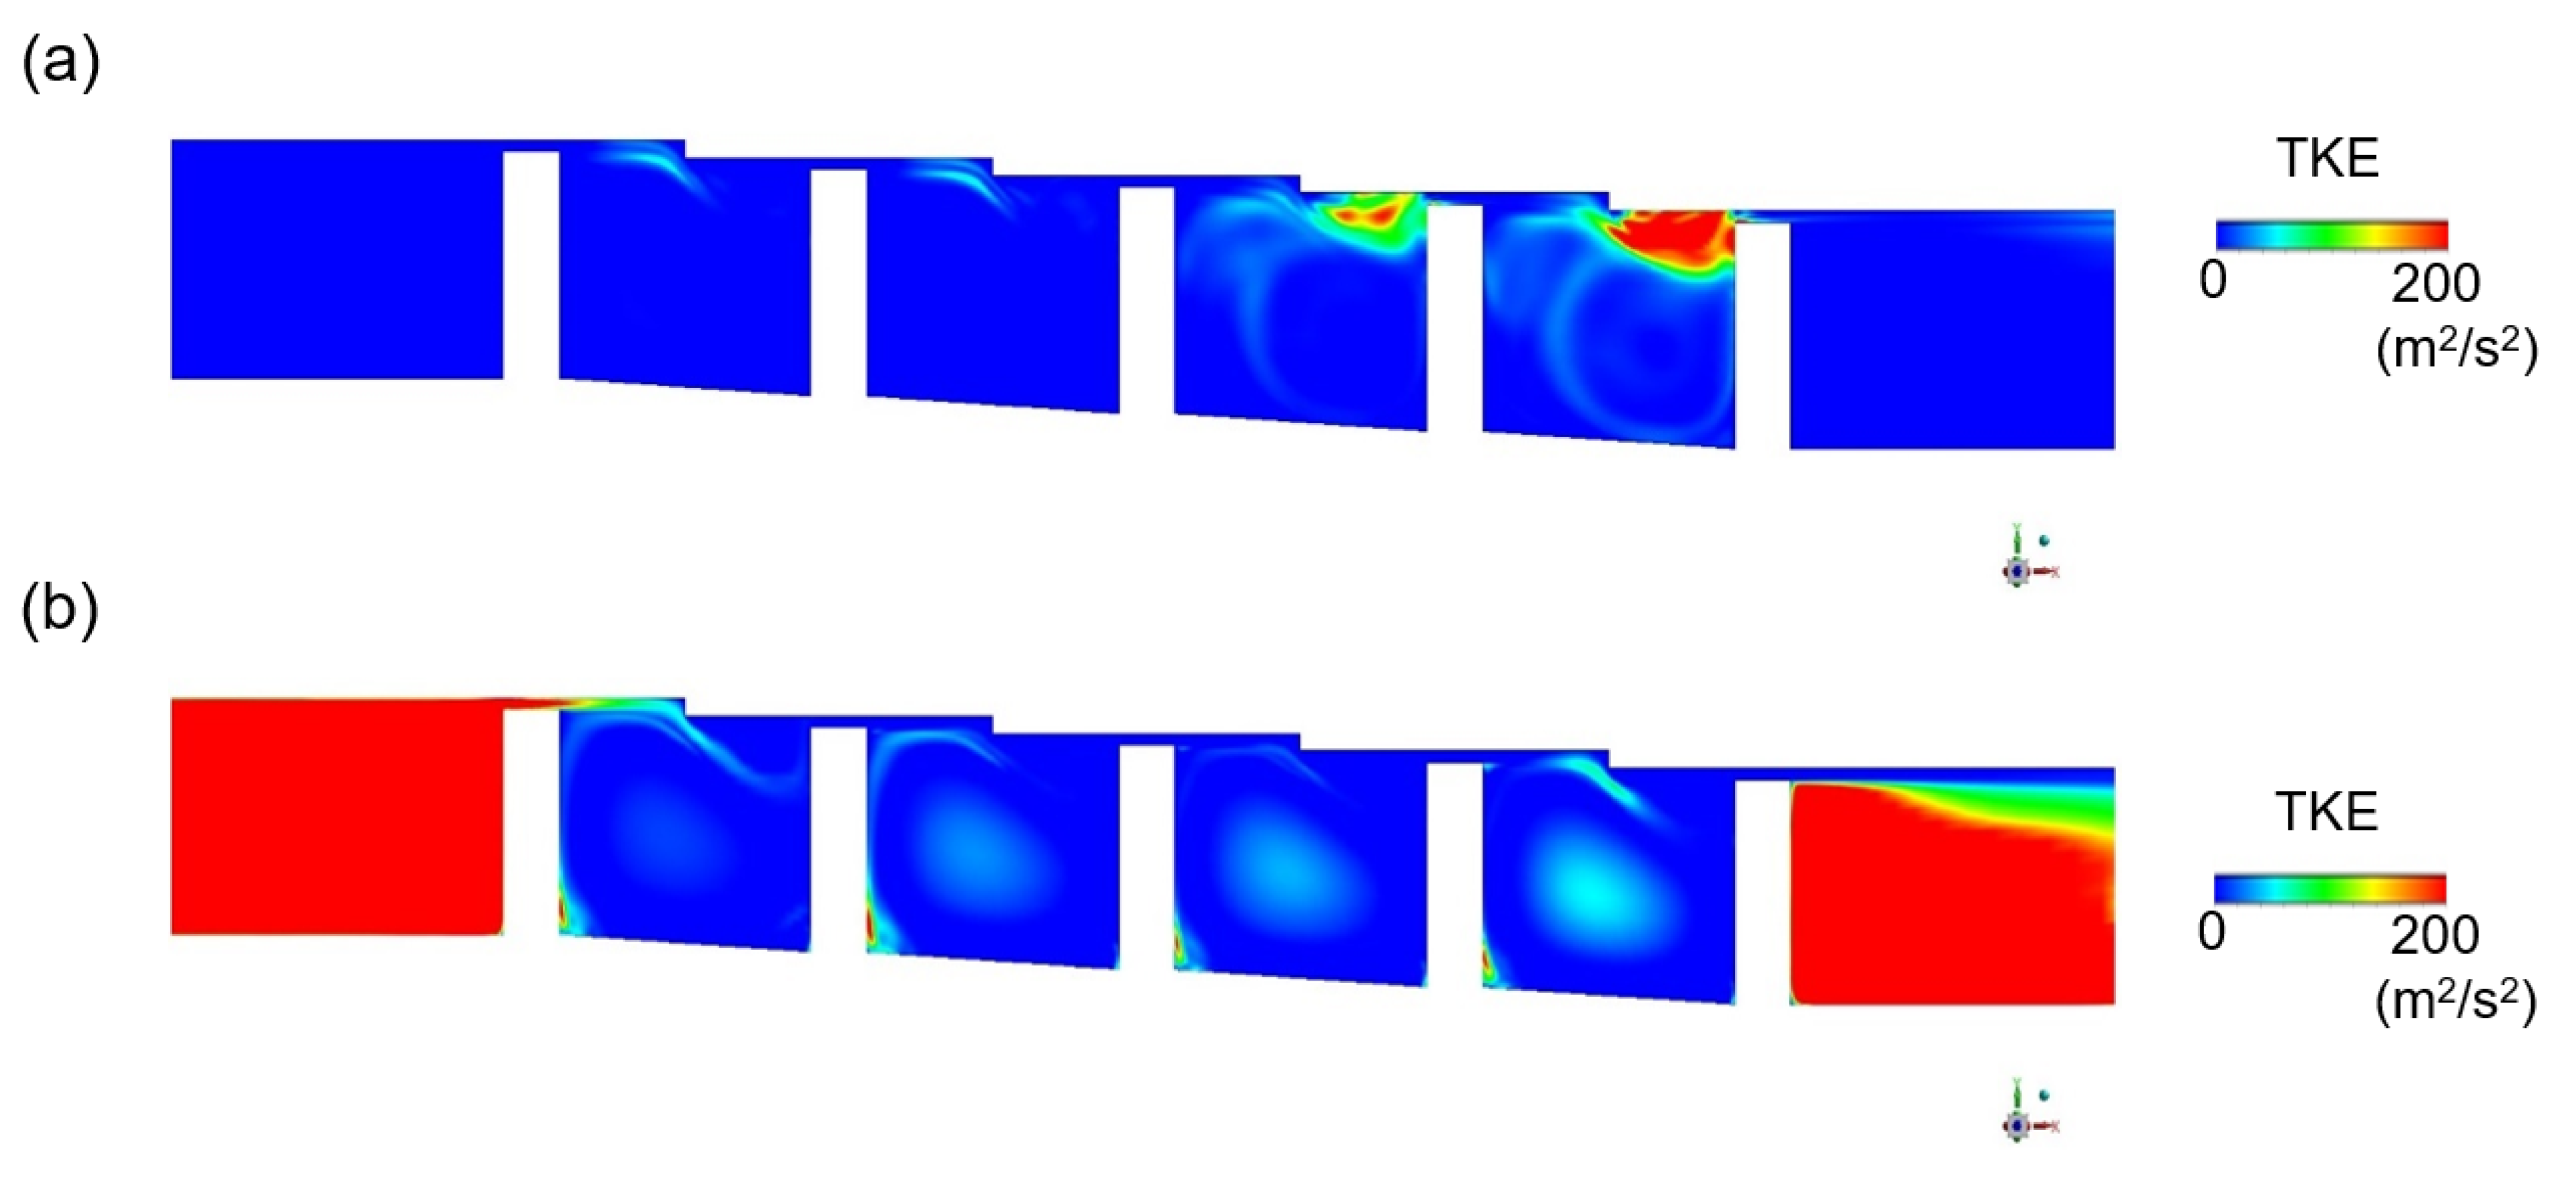
The mean turbulence kinetic energy according to operating condition is indicated in Figure 16. Where shaft rotation is seen to generate a large turbulence kinetic energy in the inlet and outlet, and this exerts a dominant influence on the discharge coefficient.

4. Conclusions

In this study, Reynolds averaged Navier-Stokes simulation (RANS) and large eddy simulation (LES) were performed on straight-through and stepped labyrinth seals, and the following primary results were obtained. For the straight-through seal, the RANS prediction for the discharge coefficient was 1% smaller than that of the LES, but both values were consistent with the experimental values within 1%. The stepped seal was predicted to reduce the discharge coefficient by 17.5% compared to the straight seal with the same axial length. The discharge coefficients predicted by the RANS and the LES for the stepped seal with a stationary shaft were nearly identical. However, for the stepped seal with a rotating shaft, the RANS and LES predicted differing reductions of 3.8 and 7.2%, respectively, in the discharge coefficient, while the tangential velocity predicted by the LES was 14.6% larger than that of the RANS. By comparison with the experimental results, the LES analysis is therefore required for the accurate prediction of the change in the discharge coefficient change due to shaft rotation.
When the RANS was applied using the k-epsilon model, an excessively large turbulence kinetic energy was observed in the clearance region. When the RSM model was applied, this value was reduced by about one half, but the value remained excessive. By contrast, the LES correctly predicted a very small value. Therefore, an LES analysis is needed in order to correctly predict the change in the discharge coefficient due to the dissipation of kinetic energy.
A power spectrum analysis was also performed based on the LES data, and the flow structure having a dominant influence on the fluctuations of the discharge coefficient was located mainly in the vortices and clearances inside the cavity. When the shaft rotated at 20,000 rpm, the amplitude of the discharge coefficient variation was found to increase approximately three-fold compared to the stationary case, and the frequency decreased to about 0.1. In the rotating stepped seal, the flow structure having a dominant influence on the discharge coefficient fluctuation moved from the cavity to the inlet and outlet positions.

Author Contributions

J.-H.K. carried out the simulations, analyzed the CFD data, and helped to write the paper. J.A. supervised the research, analyzed the CFD data, and wrote the paper. All authors have read and agreed to the published version of the manuscript.

Funding

This research was funded by the UAV High Efficiency Turbine Research Center program of Defense Acquisition Program Administration and Agency for Defense Development in South Korea.

Institutional Review Board Statement

Not applicable.

Informed Consent Statement

No applicable.

Data Availability Statement

Data are contained within this article.

Acknowledgments

This work was supported by the UAV High Efficiency Turbine Research Center Program of Defense Acquisition Program Administration and Agency for Defense Development in South Korea.

Conflicts of Interest

The authors declare no conflict of interest.

Nomenclature

AcCross sectional area of labyrinth seal [m2]
CdDischarge coefficient
CpSpecific heat
kTurbulence kinetic energy [m2/s2]
LsMixing length for sub-grid scales
TTemperature [K]
Ux Velocity component [m/s]
uFlow velocity [m/s]
uRMS of the turbulent velocity fluctuations [m/s]
PPressure [Pa]
RSpecific gas constant
tTime [s]
Mass flow rate [kg/s]
Vy velocity Component [m/s]
xcoordinate
Greek Symbols
ρDensity [kg/m3]
τ Turbulence stress
εTurbulence kinetic energy dissipation [m2/s3]
νKinematic viscosity [m2/s]
γSpecific heat ratio
μDynamic Viscosity [kg/m∙s]
μtTurbulence viscosity
Subscripts
idideal
ininlet
outoutlet

References

  1. Lakshminarayana, B. Fluid Dynamics and Heat Transfer of Turbomachinery; Wiley: Hoboken, NJ, USA, 1996; pp. 155–322. [Google Scholar] [CrossRef]
  2. Ahn, J.; Song, J.C.; Lee, J.S. Fully Coupled Large Eddy Simulation of Conjugate Heat Transfer in a Ribbed Channel with a 0.1 Blockage Ratio. Energies 2021, 14, 2096. [Google Scholar] [CrossRef]
  3. Goldstein, R.J.; Eckert, E.R.G.; Ramsey, J.W. Film Cooling with Injection through Holes: Adiabatic Wall Temperatures Downstream of a Circular Hole. J. Eng. Power. 1968, 90, 384. [Google Scholar] [CrossRef]
  4. Rolls-Royce Ltd. The Jet Engine; Rolls-Royce plc: Derby, UK, 2005; pp. 89–91. [Google Scholar]
  5. Zhang, W.; Zhang, Y.; Yang, J.; Li, C. Influence of tilting rotor on characteristics of fluid-induced vibration for labyrinth seals. J. Vibroeng. 2016, 18, 5416–5431. [Google Scholar] [CrossRef]
  6. Schramm, V.; Willenborg, K.; Kim, S.; Wittig, S. Influence of a Honeycomb Facing on the Flow Through a Stepped Labyrinth Seal. J. Eng. Gas Turbines Power. 2000, 124, 140–146. Available online: https://asmedigitalcollection.asme.org/gasturbinespower/article/124/1/140/461748/Influence-of-a-Honeycomb-Facing-on-the-Flow (accessed on 25 November 2021). [CrossRef]
  7. Wittig, S.; Schelling, U.; Kim, S.; Jacobsen, K. Numerical Predictions and Measurements of Discharge Coefficients in Labyrinth Seals. In Proceedings of the ASME 1987 International Gas Turbine Conference and Exhibition, Anaheim, CA, USA, 31 May–4 June 1987; Available online: https://asmedigitalcollection.asme.org/GT/proceedings/GT1987/79238/V001T01A064/237847 (accessed on 25 November 2021).
  8. Denecke, J.; Dullenkopf, K.; Wittig, S.; Bauer, H.-J. Experimental Investigation of the Total Temperature Increase and Swirl Development in Rotating Labyrinth Seals. ASME J. Turbomach. 2005, 3, 1161–1171. Available online: https://asmedigitalcollection.asme.org/GT/proceedings-abstract/GT2005/47268/1161/312940 (accessed on 25 November 2021).
  9. Szymanski, A.; Dykas, S.; Wroblewski, W.; Fraczek, D. Experimental and Numerical Validation Study of the Labyrinth Seal Configurations. In Proceedings of the 12th European Conference on Turbomachinery Fluid Dynamics & Thermodynamics ETC12, Stockholm, Sweden, 3–7 April 2017; Available online: https://www.euroturbo.eu/publications/proceedings-papers/etc2017-340/ (accessed on 25 November 2021).
  10. Zimmermann, H.; Wolff, K.H. Comparison Between Empirical and Numerical Labyrinth Flow Correlations. In Proceedings of the ASME 1987 International Gas Turbine Conference and Exhibition, Anaheim, CA, USA, 31 May–4 June 1987; V001T01A028. ASME: New York, NY, USA, 1987; Volume 1, pp. 1–6. Available online: https://asmedigitalcollection.asme.org/GT/proceedings/GT1987/79238/V001T01A028/237848 (accessed on 25 November 2021).
  11. Zimmermann, H.; Wolff, K.H. Air system correlations part 1: Labyrinth seals. Proc. ASME Turbo Expo 1998, 4, 1–8. Available online: https://asmedigitalcollection.asme.org/GT/proceedings/GT1998/78651/V004T09A048/248910 (accessed on 25 November 2021).
  12. Kaszonwski, P.; Dzida, M. CFD analysis of fluid flow through the labyrinth seal. Trans. Inst. Fluid-Flow Mach. 2015, 130, 71–82. Available online: https://www.researchgate.net/publication/323847858_CFD_analysis_of_fluid_flow_through_the_labyrinth_seal (accessed on 25 November 2021).
  13. Baek, S.I.; Ahn, J. Optimizing the Geometric Parameters of a Straight-Through Labyrinth Seal to Minimize the Leakage Flow Rate and the Discharge Coefficient. Energies 2021, 14, 705. Available online: https://www.mdpi.com/1996-1073/14/3/705 (accessed on 25 November 2021). [CrossRef]
  14. Eser, D.; Kazakia, J.Y. Air flow in cavities of labyrinth seals. Int. J. Eng. Sci. 1995, 33, 2309–2326. Available online: https://www.sciencedirect.com/science/article/pii/0020722595000726 (accessed on 25 November 2021). [CrossRef]
  15. Wein, L.; Kluge, T.; Seume, J.R.; Hain, R.; Fuchs, T.; Kähler, C.; Schmierer, R.; Herbst, F. Validation of RANS Turbulence Models for Labyrinth Seal Flows by Means of Particle Image Velocimetry. In Proceedings of the ASME Turbo/ Expo, Virtual, Online, 21–25 September 2020; ASME: New York, NY, USA, 2020; Volume 10A. V10AT25A015. Available online: https://asmedigitalcollection.asme.org/GT/proceedings-abstract/GT2020/84218/V10AT25A015/1095264 (accessed on 25 November 2021).
  16. Gao, F.; Chew, J.W.; Beard, P.F.; Amirante, D.; Hills, N.J. Numerical Studies of Turbine Rim Sealing Flows on a Chute Seal Configuration. In Proc ETC 12; Rolls-Royce plc: Derby, UK, 2017; ETC2017-284; Available online: https://www.euroturbo.eu/publications/proceedings-papers/etc2017-284/ (accessed on 25 November 2021).
  17. Tyacke, J.C.; Dai, Y.; Watson, R.; Tucker, P.G. Design Optimisation of Labyrinth Seals Using LES. Math. Model. Nat. Phenom. 2021, 2, 1–23. Available online: https://www.researchgate.net/publication/347638823_Design_Optimisation_of_Labyrinth_Seals_using_LES (accessed on 25 November 2021). [CrossRef]
  18. Martin, H.M. Labyrinth Packings. Engineer 1908, 85, 35–36. [Google Scholar]
  19. Vermes, G. A Fluid Mechanics Approach to the Labyrinth Seal Leakage Problem. ASME J. Eng. Power 1961, 83, 161–169. [Google Scholar] [CrossRef]
  20. Egli, A. The Leakage of Steam Through Labyrinth Seals. Trans. ASME 1935, 57, 115–122. [Google Scholar]
  21. Hodkinson, B. Estimation of the Leakage Through a Labyrinth Gland. Proc. Inst. Mech. Eng. 1939, 141, 283–288. [Google Scholar] [CrossRef]
  22. Vakili, A.D.; Meganathan, A.J.; Michaud, M.; Radhakrishnan, S. An Experimental and Numerical Study of Labyrinth Seal Flow. In Proceedings of the Turbo Expo 2005, Reno, NV, USA, 6–9 June 2005; pp. 1121–1128. Available online: https://asmedigitalcollection.asme.org/GT/proceedings-abstract/GT2005/47268/1121/312900 (accessed on 25 November 2021).
  23. Szymański, A.; Wróblewski, W.; Bochon, K.; Majkut, M.; Strozik, M.; Marugi, K. Experimental validation of optimised straight-through labyrinth seals with various land structures. Int. J. Heat Mass Transf. 2020, 158, 119930. Available online: https://www.sciencedirect.com/science/article/pii/S0017931020302957 (accessed on 25 November 2021). [CrossRef]
  24. Launder, B.E.; Loizou, P.A. Laminarization of three-dimensional accelerating boundary layers in a curved rectangular-sectioned duct. Int. J. Heat Fluid Flow 1992, 13, 124–131. Available online: https://www.semanticscholar.org/paper/Laminarization-of-three-dimensional-accelerating-in-Launder-Loizou/78be90a8044caa0888d28c17084fcdd8d8f719cd (accessed on 25 November 2021). [CrossRef]
  25. MATLAB Documentation. Available online: https://mathworks.com/help/index.html (accessed on 14 October 2021).
  26. ANSYS Fluent v19.1 Theory Guide. Available online: https://ansyshelp.ansys.com/account/secured?returnurl=/Views/Secured/corp/v193/flu_th/flu_th.html (accessed on 14 October 2021).
  27. ANSYS ICEM CFD Help Manual. Available online: https://ansyshelp.ansys.com/account/secured?returnurl=/Views/Secured/corp/v193/icm_help/icm_help.html (accessed on 14 October 2021).
  28. Potter, M.C.; Wiggert, D.C.; Ramadan, B.H. Mechanics of Fluids, 4th ed.; CENGAGE Learning: Boston, MA, USA, 2016; pp. 192–221. [Google Scholar]
  29. Boussinesq, J.V. Théorie de l’écoulement Tourbillonnant et Tumultueux des Liquides dans les Lits Rectilignes a Grande Section; Quai Des Grands-Augustins, 55; Gauthier-Villars et fils: Paris, France, 1897; pp. 44–50. [Google Scholar]
  30. Wilcox, D.C. Turbulence Modeling for CFD; DCW Industries: La Cañada Flintridge, CA, USA, 1998; pp. 377–398. [Google Scholar]
  31. Saffman, P.G. Vortex Dynamics. In Cambridge Monographs on Mechanics; Cambridge University Press: Cambridge, UK, 1993; pp. 1–19. Available online: https://www.cambridge.org/core/books/vortex-dynamics/2F33335617172249253B949EA3406F89 (accessed on 25 November 2021). [CrossRef]
Figure 1. A schematic diagram of the stepped seal and its boundary conditions.
Processes 09 02179 g001
Figure 2. The computational domain of the stepped seal: (a) the grid system; (b) the geometric parameters.
Processes 09 02179 g002
Figure 3. The grid system near the clearance of the labyrinth seal.
Processes 09 02179 g003
Figure 4. The discharge coefficient according to the number of grid points.
Processes 09 02179 g004
Figure 5. Prediction of the discharge coefficient of the labyrinth seal: (a) code validation study; (b) comparison of the LES and RANS prediction results.
Processes 09 02179 g005
Figure 6. The velocity distributions in a straight-trough seal, as predicted by (a) RANS (k-ε), and (b) LES.
Processes 09 02179 g006
Figure 7. The velocity distributions in a stepped seal, as predicted by (a) RANS (k-ε), and (b) LES.
Processes 09 02179 g007
Figure 8. The velocity distributions in a stepped seal with a rotating shaft: (a,b) the meridional velocity according to (a) the RANS and (b) the LES; (c,d) the tangential velocity according to (c) the RANS and (d) the LES.
Processes 09 02179 g008
Figure 9. The effects of shaft rotation in the stepped seal upon (a) the discharge coefficient, and (b) the average tangential velocity.
Processes 09 02179 g009
Figure 10. The turbulence kinetic energy in a stepped seal according to (a) RANS (k-ε), (b) RANS (RSM), and (c) LES.
Processes 09 02179 g010
Figure 11. The turbulence kinetic energy profiles at clearance according to the turbulence model.
Processes 09 02179 g011
Figure 12. The selection of data extraction points for power spectrum analysis: (a) the vorticity magnitude distribution obtained by RANS; (b) the selected data extraction points.
Processes 09 02179 g012
Figure 13. The temporal variation in the discharge coefficient.
Processes 09 02179 g013
Figure 14. Power spectrum analysis of the LES data for a stationary stepped seal: (a) the analyzed points and flow fluctuations; (b) the power spectrum at each point; (c) the flow structure at the points where power peaks are observed.
Processes 09 02179 g014aProcesses 09 02179 g014b
Figure 15. Power spectrum analysis of the LES data for a stepped seal with a rotating shaft: (a) the analyzed points and flow fluctuations; (b) the power spectrum at each point; (c) the flow structure at the points where power peaks are observed.
Processes 09 02179 g015aProcesses 09 02179 g015b
Figure 16. The time averaged turbulence kinetic energy inside the stepped seal with (a) a stationary shaft and (b) a rotating shaft, as obtained by LES.
Processes 09 02179 g016
Table 1. The geometrical parameters of the straight-through and stepped labyrinth seals.
Geometrical ParameterStraight-Through SealStepped Seal
Clearance (C)0.5 mm0.5 mm
Cavity width (CW)9 mm11.5 mm
Tooth width (W)2.5 mm2.5 mm
Tooth height (H)10.5 mm9 mm
Minimum radius (R)200 mm200 mm
Number of teeth (N)65
Step height (SH)-0.7 mm
Table 2. The boundary conditions for the computational domain.
SurfaceBoundary Conditions
InletAbsolute Total Pressure = 202,650 Pa
OutletAbsolute Total Pressure = 101,325 Pa
Shaft0 RPM, 20,000 RPM, Adiabatic wall
Casing0 RPM, Adiabatic wall
Publisher’s Note: MDPI stays neutral with regard to jurisdictional claims in published maps and institutional affiliations.