Article

A Data-Centric Approach to Design and Analysis of a Surface-Inspection System Based on Deep Learning in the Plastic Injection Molding Industry

1
Department of Smart Factory Convergence, Sungkyunkwan University, 2066 Seobu-ro, Jangan-gu, Suwon 16419, Korea
2
AI Reserach, iShango Corporate, 5, Gasan Digital 1-ro, Geumcheon-gu, Seoul 08594, Korea
3
PD CU, Telstar-Hommel Corporate, 89, Hyeongoksandan-ro 93beon-gil, Cheongbuk-myeon, Pyeongtaek-si 17812, Korea
*
Author to whom correspondence should be addressed.
Processes 2021, 9(11), 1895; https://doi.org/10.3390/pr9111895
Submission received: 11 September 2021 / Revised: 13 October 2021 / Accepted: 21 October 2021 / Published: 23 October 2021

Abstract

:
Manufacturers are eager to replace the human inspector with automatic inspection systems to improve the competitive advantage by means of quality. However, some manufacturers have failed to apply the traditional vision system because of constraints in data acquisition and feature extraction. In this paper, we propose an inspection system based on deep learning for a tampon applicator producer that uses the applicator’s structural characteristics for data acquisition and uses state-of-the-art models for object detection and instance segmentation, YOLOv4 and YOLACT for feature extraction, respectively. During the on-site trial test, we experienced some False-Positive (FP) cases and found a possible Type I error. We used a data-centric approach to solve the problem by using two different data pre-processing methods, the Background Removal (BR) and Contrast Limited Adaptive Histogram Equalization (CLAHE). We have experimented with analyzing the effect of the methods on the inspection with the self-created dataset. We found that CLAHE increased Recall by 0.1 at the image level, and both CLAHE and BR improved Precision by 0.04–0.06 at the bounding box level. These results support that the data-centric approach might improve the detection rate. However, the data pre-processing techniques deteriorated the metrics used to measure the overall performance, such as F1-score and Average Precision (AP), even though we empirically confirmed that the malfunctions improved. With the detailed analysis of the result, we have found some cases that revealed the ambiguity of the decisions caused by the inconsistency in data annotation. Our research alerts AI practitioners that validating the model based only on the metrics may lead to a wrong conclusion.

1. Introduction

Manufacturers have continuously tried to build competitive advantages by means of quality. Quality Control (QC) is essential for business because customer trust relies on it. The traditional method of manufacturers for managing quality is Optical Quality Control (OQC) by human inspectors. Human inspection has the advantage that the inspector does not require any equipment or manual setting. This characteristic of manual OQC guarantees manufacturers flexibility, which is one of the most critical competitive advantages in mass customization. Even though human inspection provides a competitive advantage by means of flexibility, many manufacturers are eager to replace the human inspector with automatic inspection systems. A major problem with manual OQC is its reliability. Human inspection risks differences in accuracy that depend on the worker’s proficiency and condition, leading to market leakage of defective products. Manufacturers also have the burden of continually training inspectors to maintain a consistent inspection quality and of monitoring workers’ performance. The risk that threatens manufacturers mostly is that the quality competitiveness of the company rests on the tacit knowledge of some skilled workers. A lack of such skilled inspectors directly weakens the competitiveness in quality. Many researchers have already addressed the problems of human inspection, and various studies have suggested alternative inspection methods [1,2,3,4]. OQC by machine and computer visual systems has already been the most common quality control technique in various industrial fields [5]. An automatic visual inspection system can now detect minor defects that human inspectors have not been able to control with the naked eye. Additionally, the visual system ensures quality reliability by conducting inspections stably without human error.
However, the traditional visual inspection system also has its limitations. Naturally, applying a visual inspection system is possible only if image data for the product can be generated. The visual inspection system is relatively easy to apply if the product’s shape, size, and orientation are homogeneous and straightforward. However, data acquisition for some products is challenging, for example, if the product is cylindrical with an ambiguous beginning and end. In addition, there is the hassle of having to set up new equipment for traditional visual inspection systems whenever the working environment and the reference figures change. The traditional visual inspection system also does not respond to defects with arbitrary shapes, sizes, and orientations, which people can see [6,7]. This limitation reduces the inspection accuracy for various atypical types of defects. For these reasons, many researchers have applied Deep Learning (DL) to the traditional visual inspection system [8].
Our research team has found a manufacturer who suffers from the problems of human inspection. The company produces the tampon applicator, a plastic case for protecting and helping to insert the cotton absorbent core comfortably, as shown in Figure 1.
The company uses plastic injection molding machines to produce more than 60,000 applicators a day. The tampon applicator is inserted into the body and must be hygienic. Thus, the quality inspection of the tampon applicator is essential, but research into developing an inspection system for applicators has been insufficient. The applicator manufacturer had tried to apply an automated visual inspection system to improve quality and productivity. However, they failed because of constraints such as (1) data acquisition for a cylindrical product that has an ambiguous beginning and end, and (2) arbitrary types, sizes, and orientations of defects. The defects of the injected plastic products occur for various reasons and are of different types, such as discoloration, burn marks, and short shots [9], as shown in Figure 2.
In this paper we propose a DL-based inspection system that can solve the problems mentioned above. The main contributions of this paper can be summarized as follows:
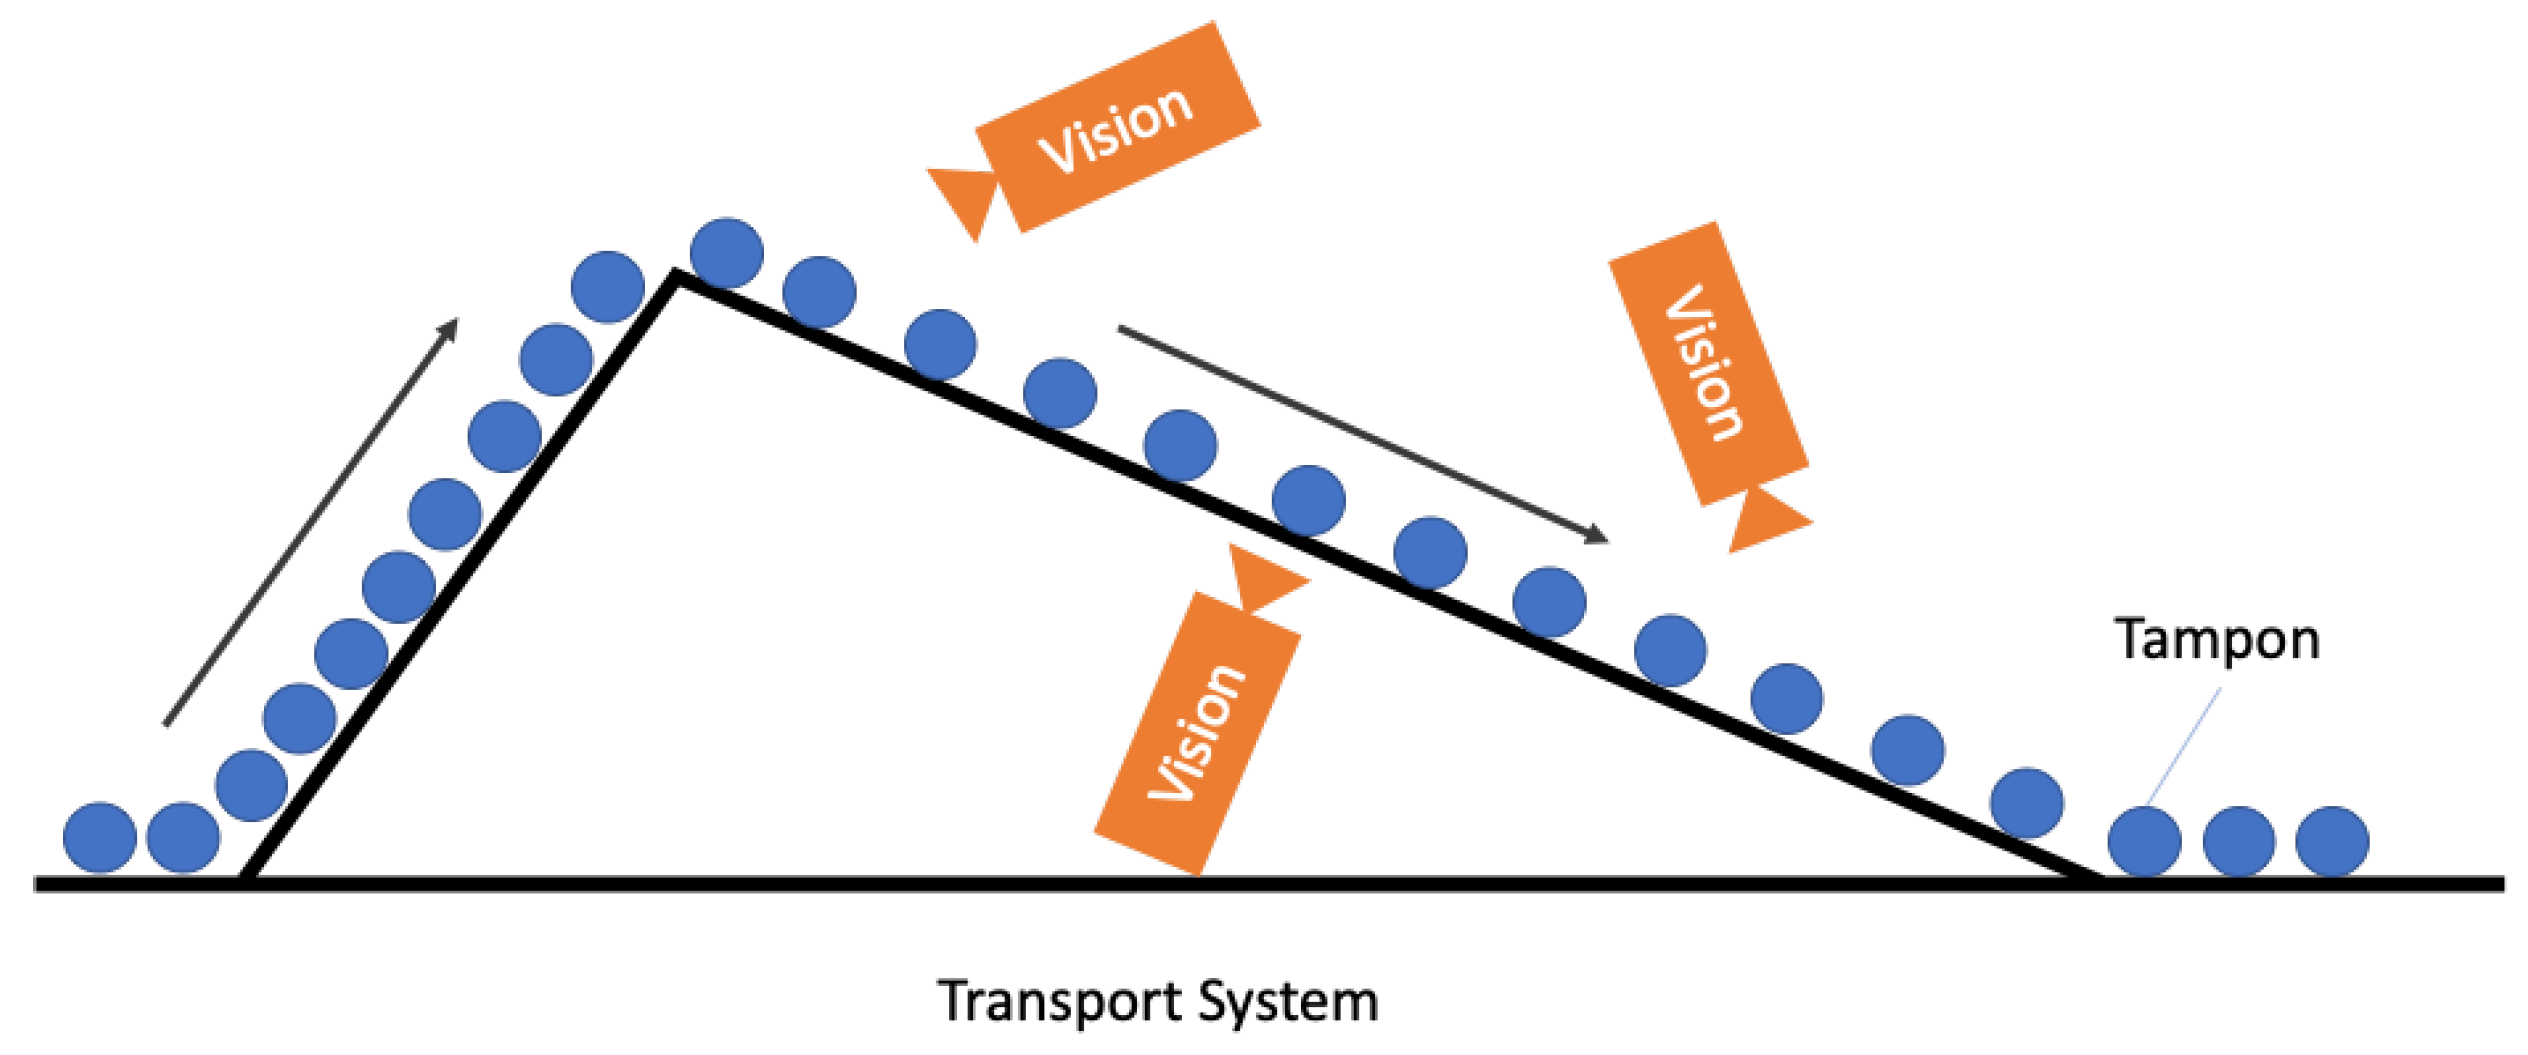
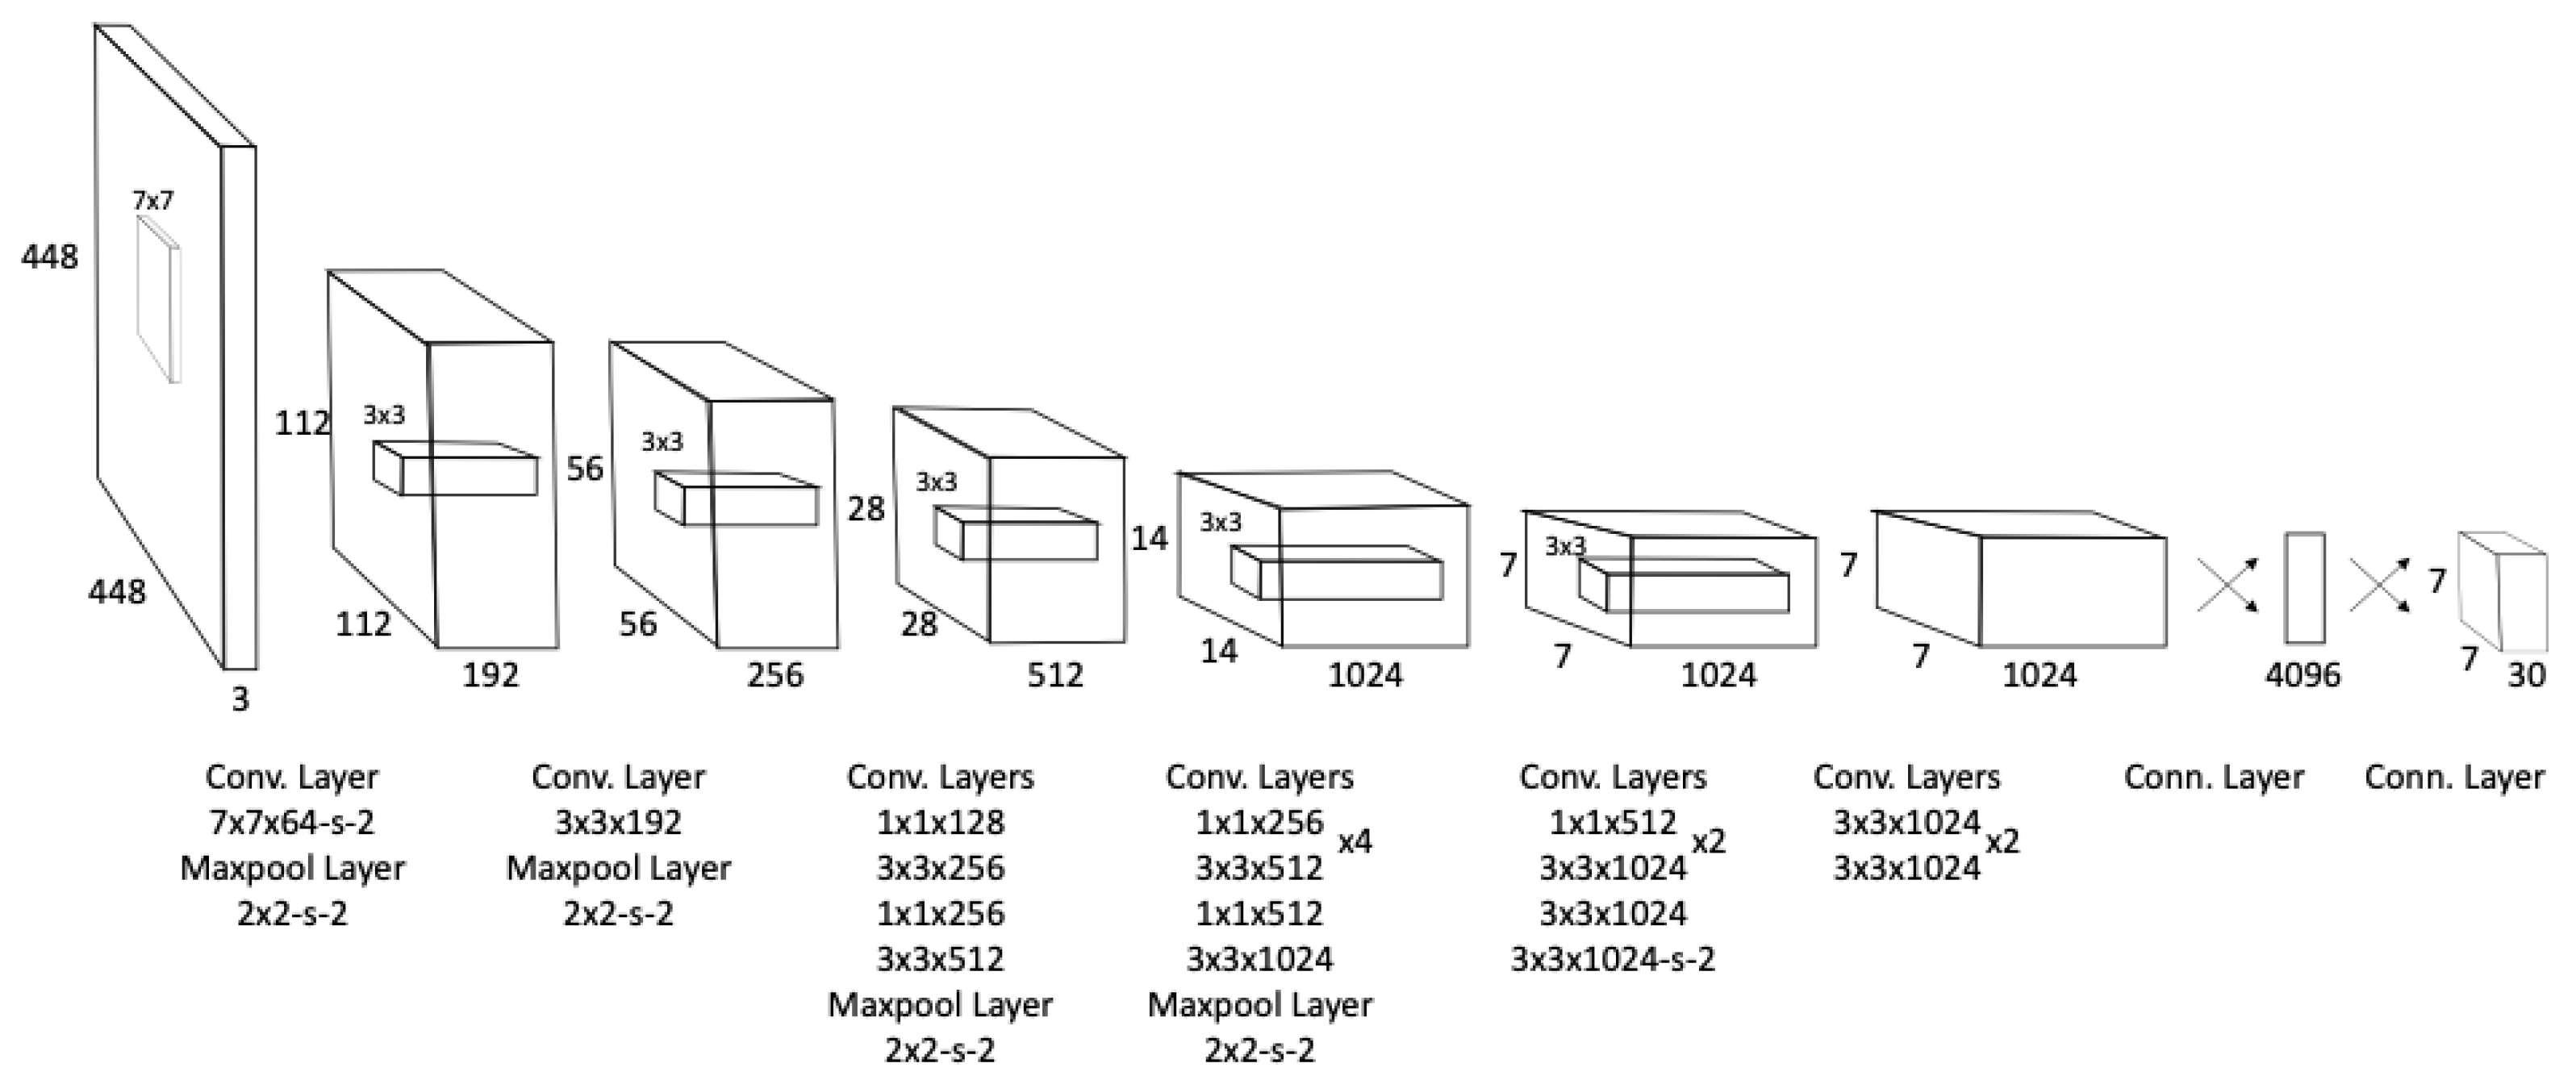
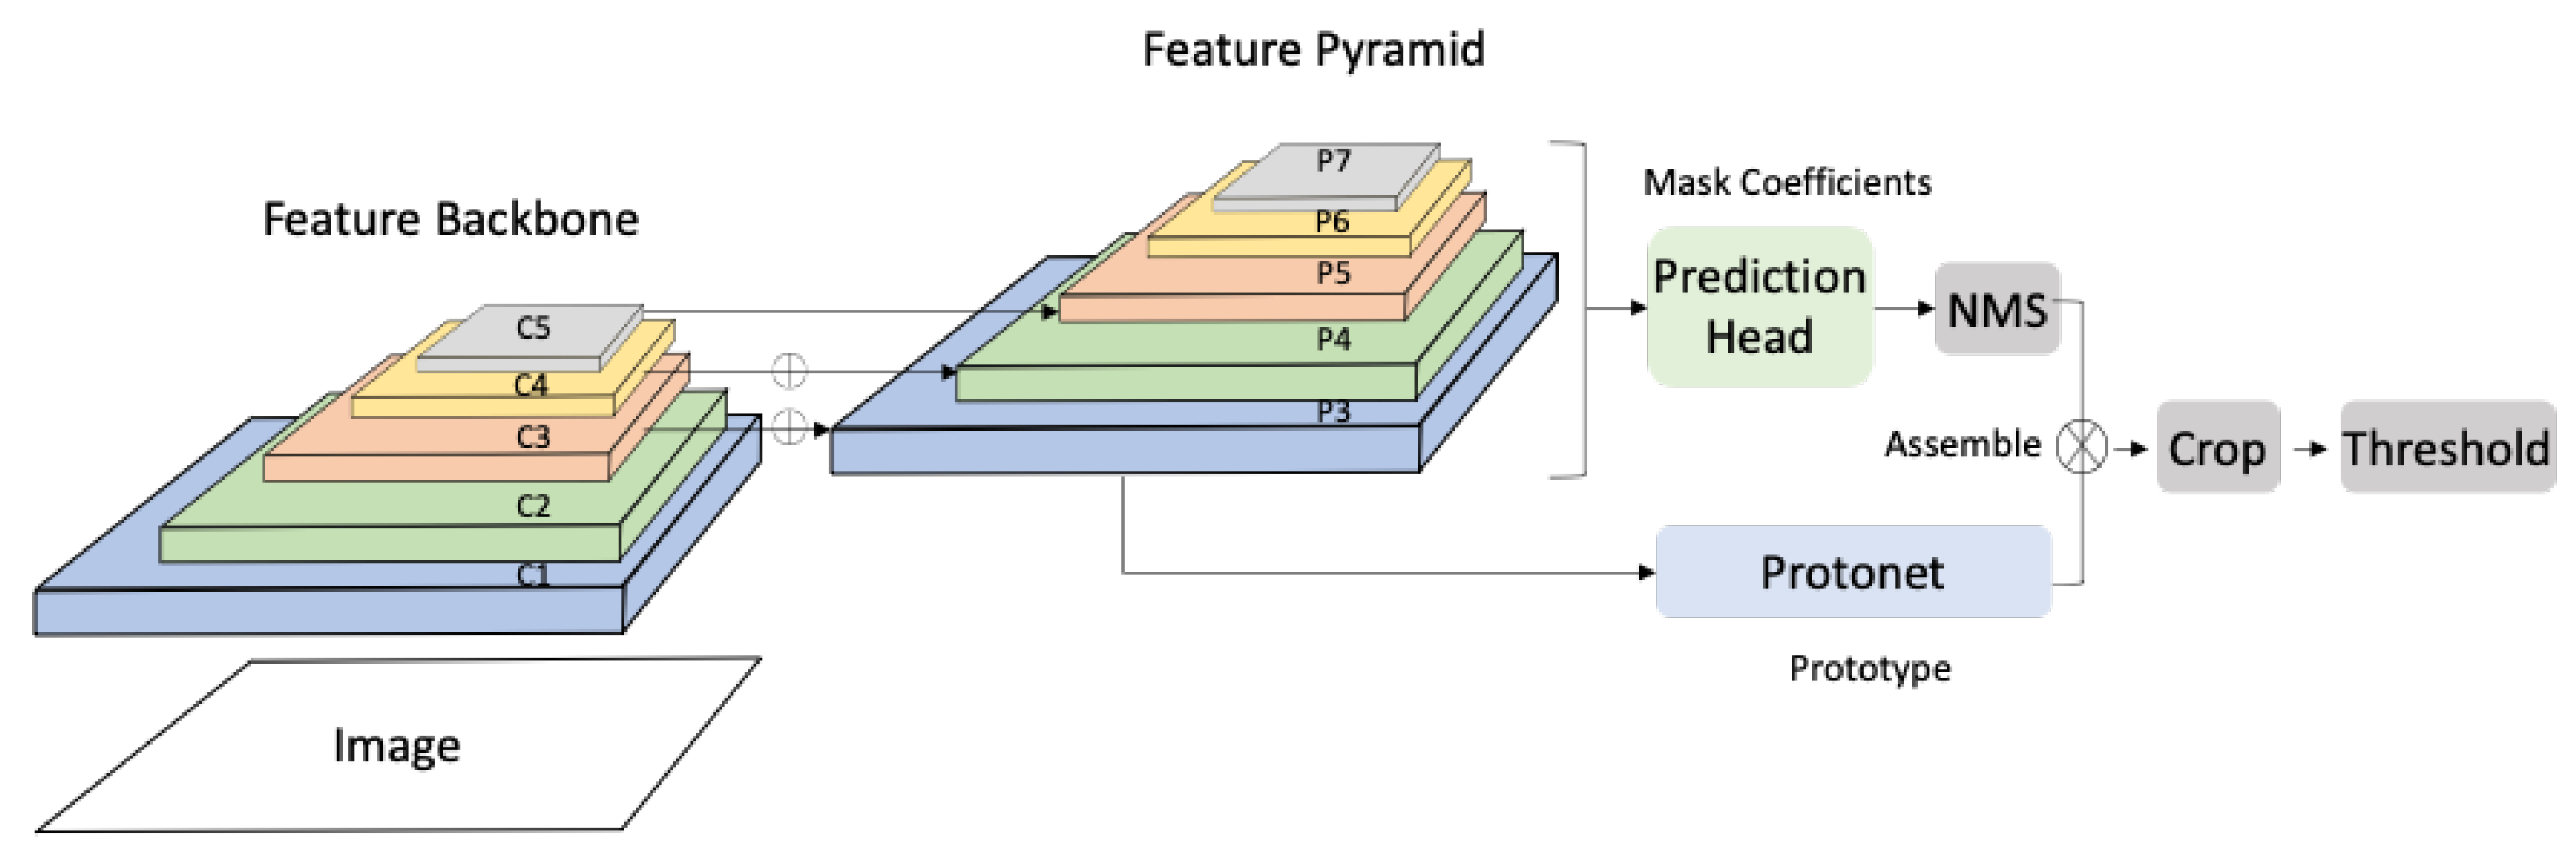
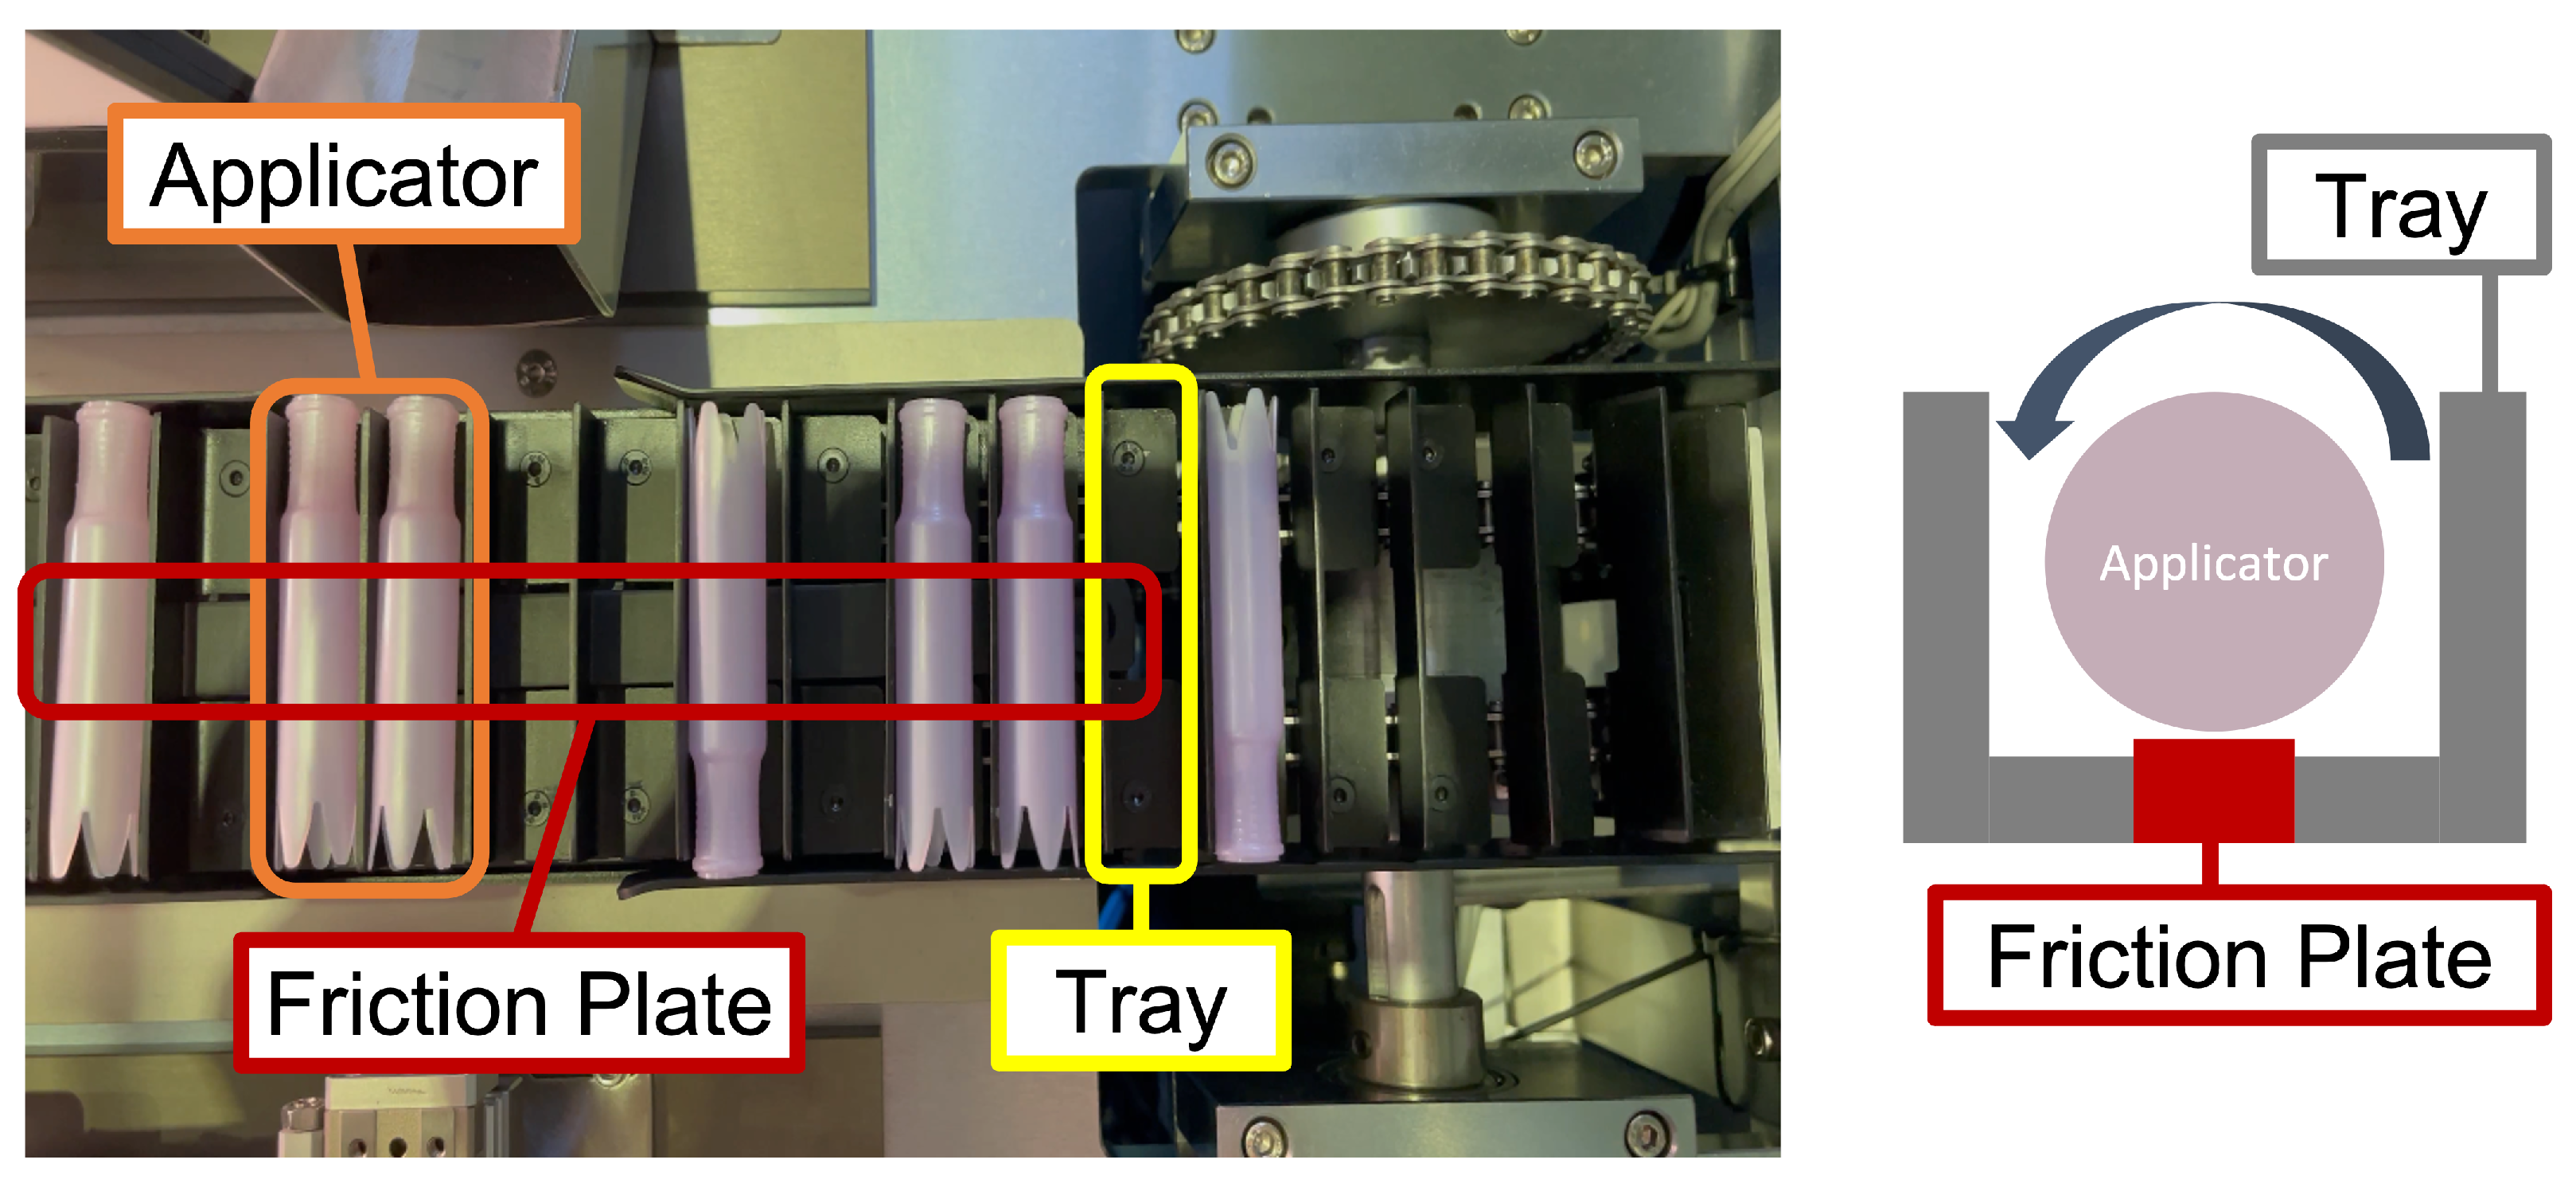
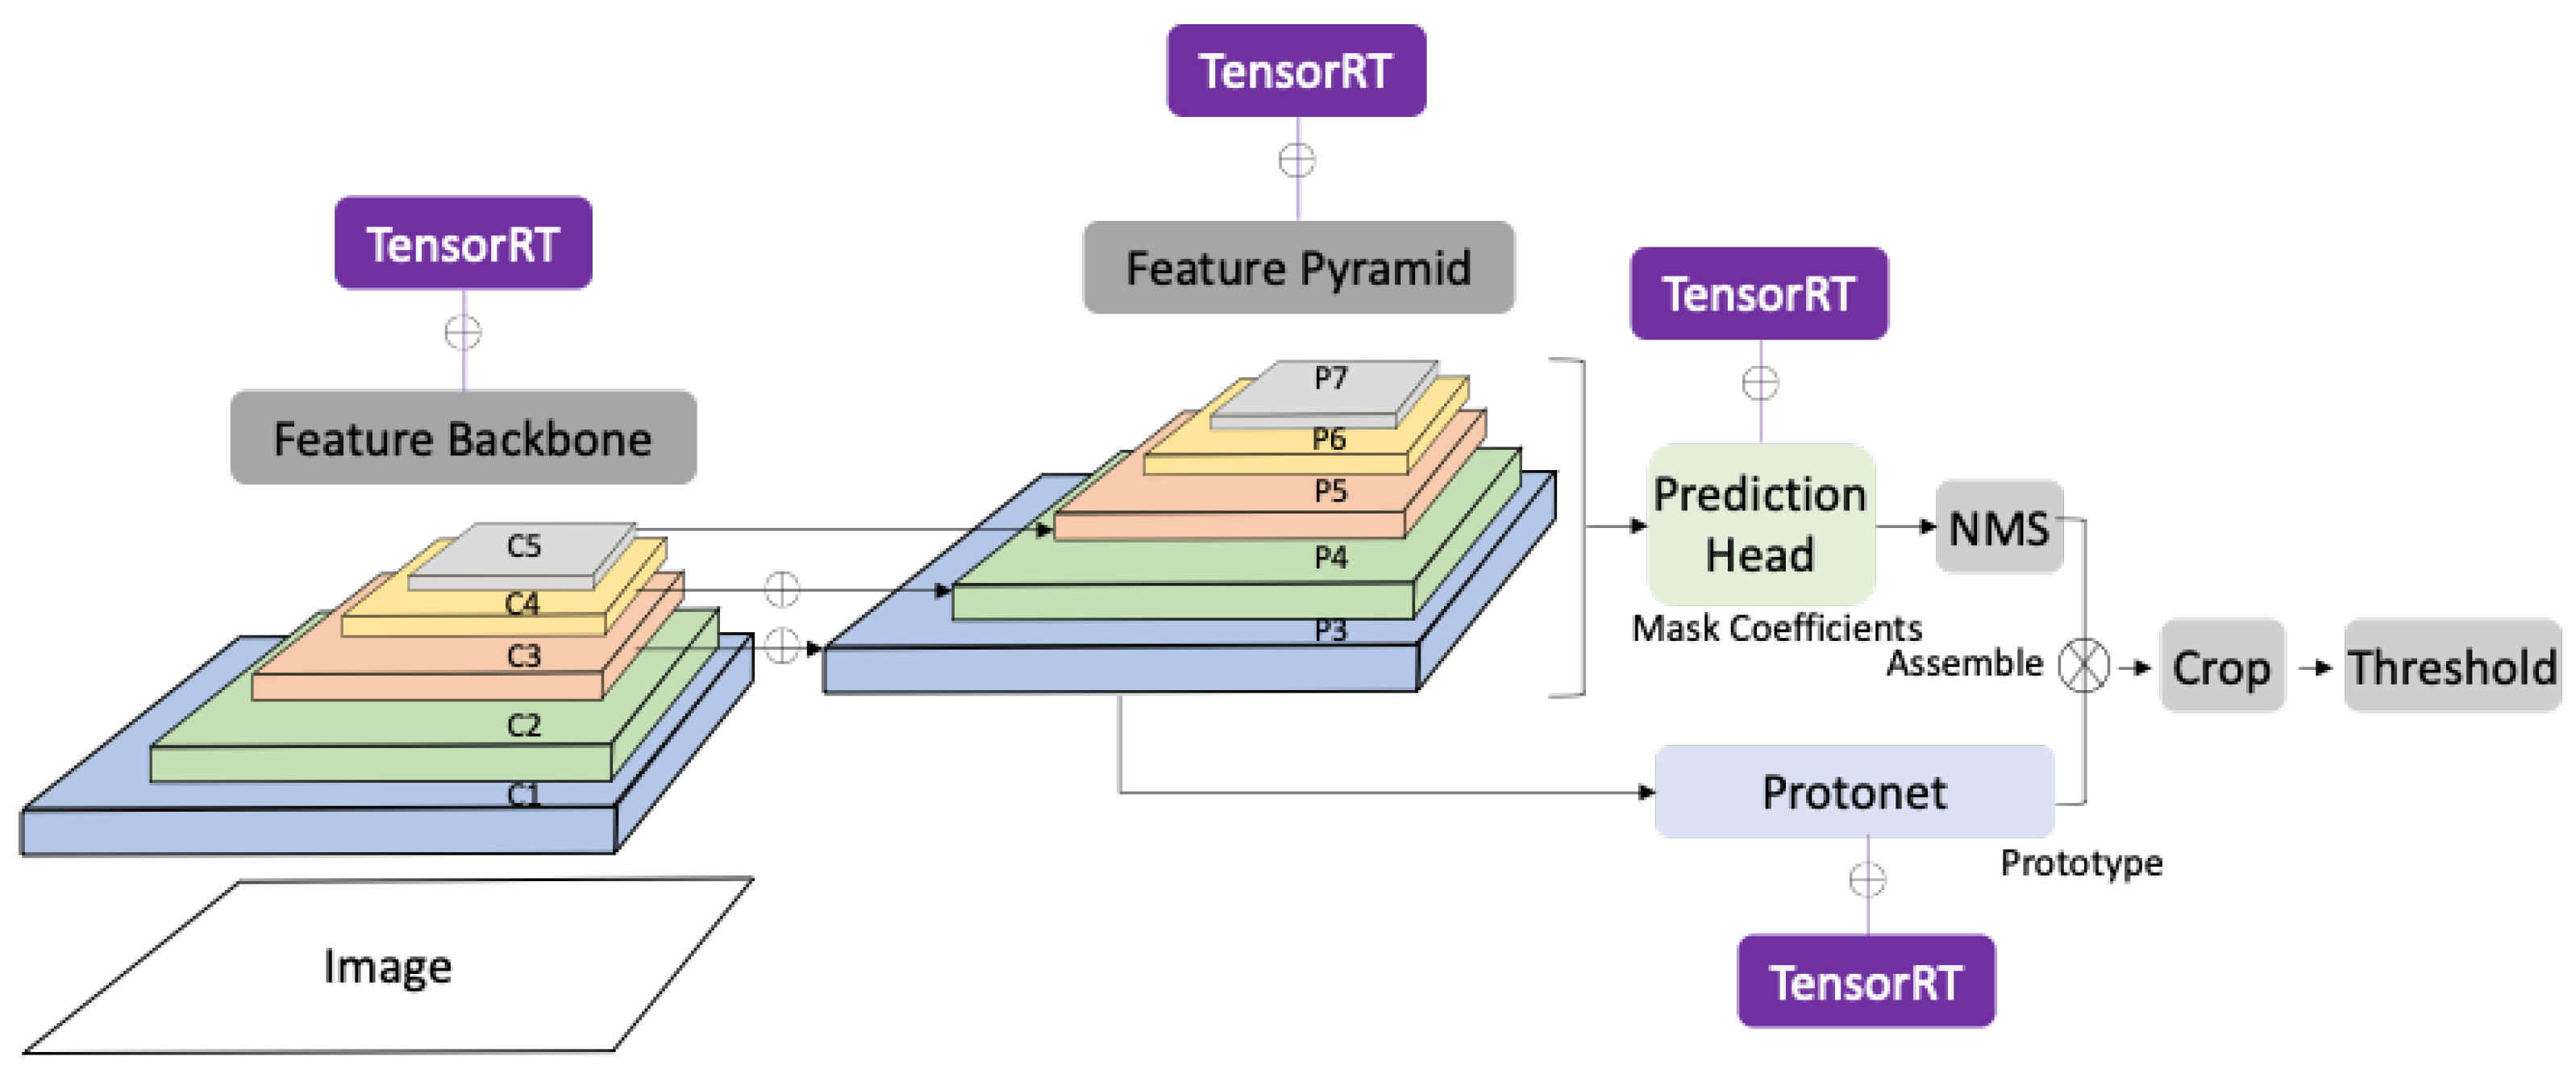
  • We propose a DL-based inspection system for moving applicators. Our inspection system uses the structural characteristics of the applicator, allowing it to roll during the inspection interval, which is critical for data acquisition. For defect inspection, we have tested the state-of-the-art object-detection and instance-segmentation models, You Only Look Once version 4 (YOLOv4) and You Only Look At CoefficienTs (YOLACT), respectively. We describe the system configuration, including hardware, network, software specifications, and inspection mechanisms.
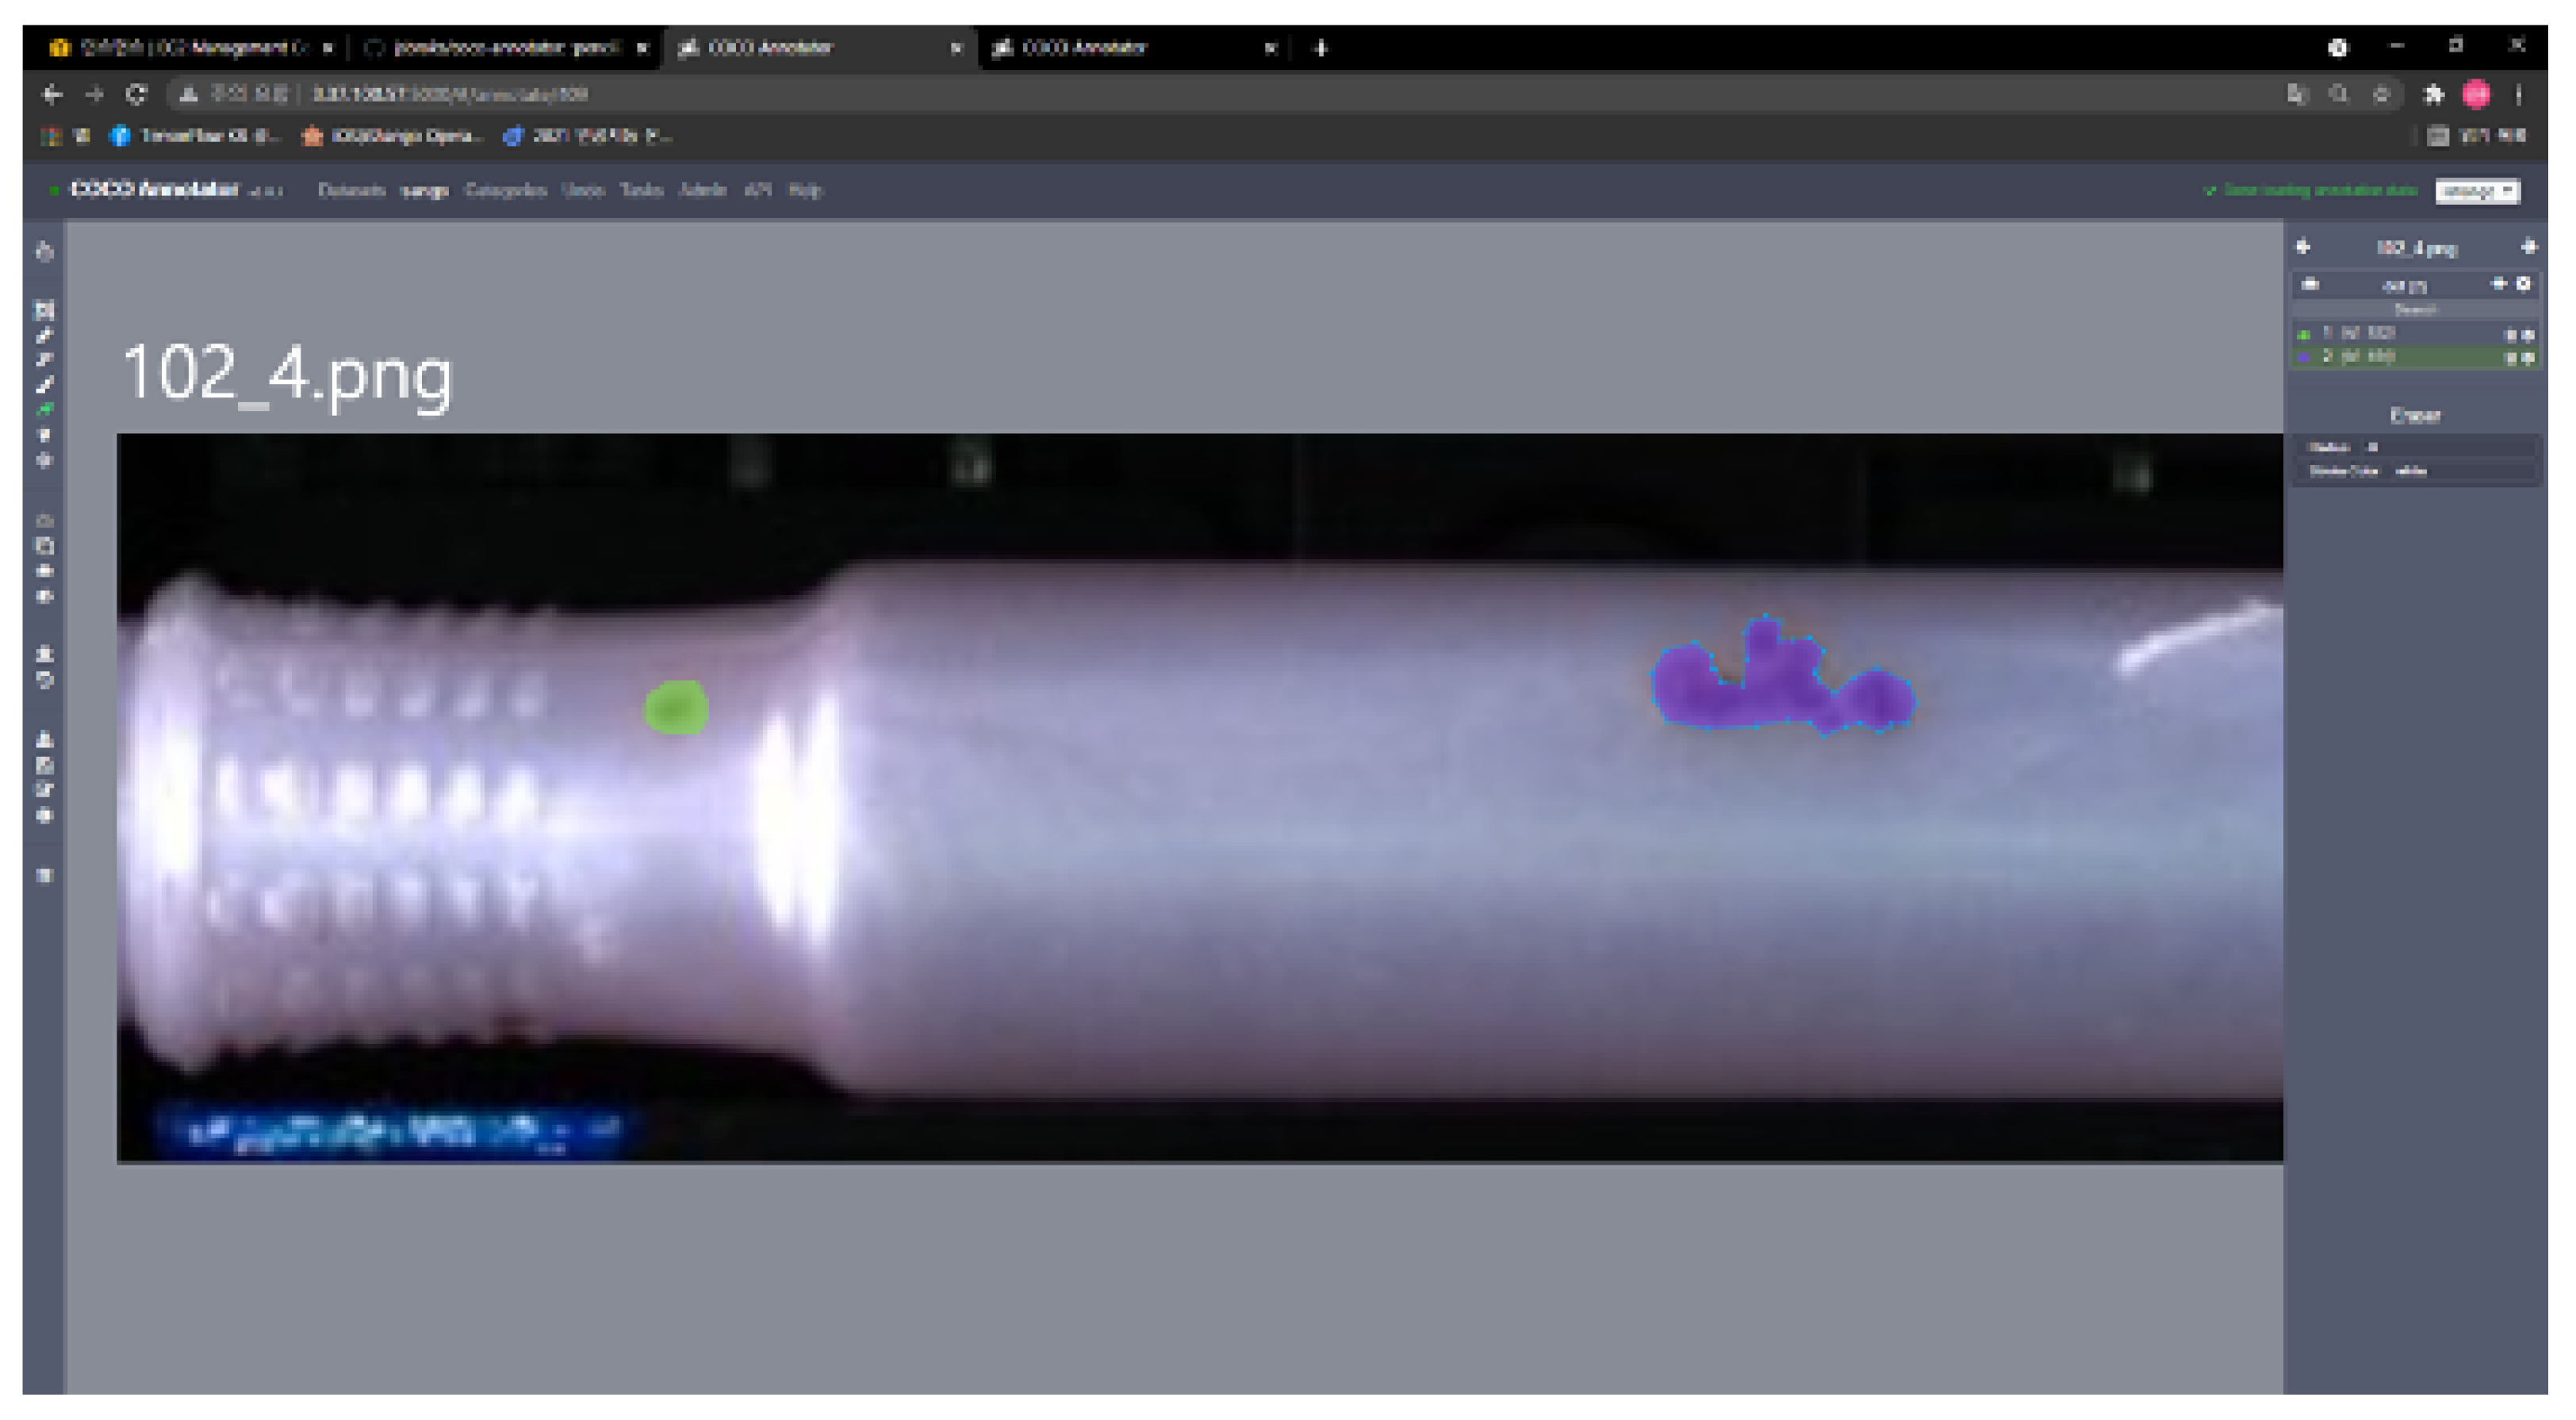
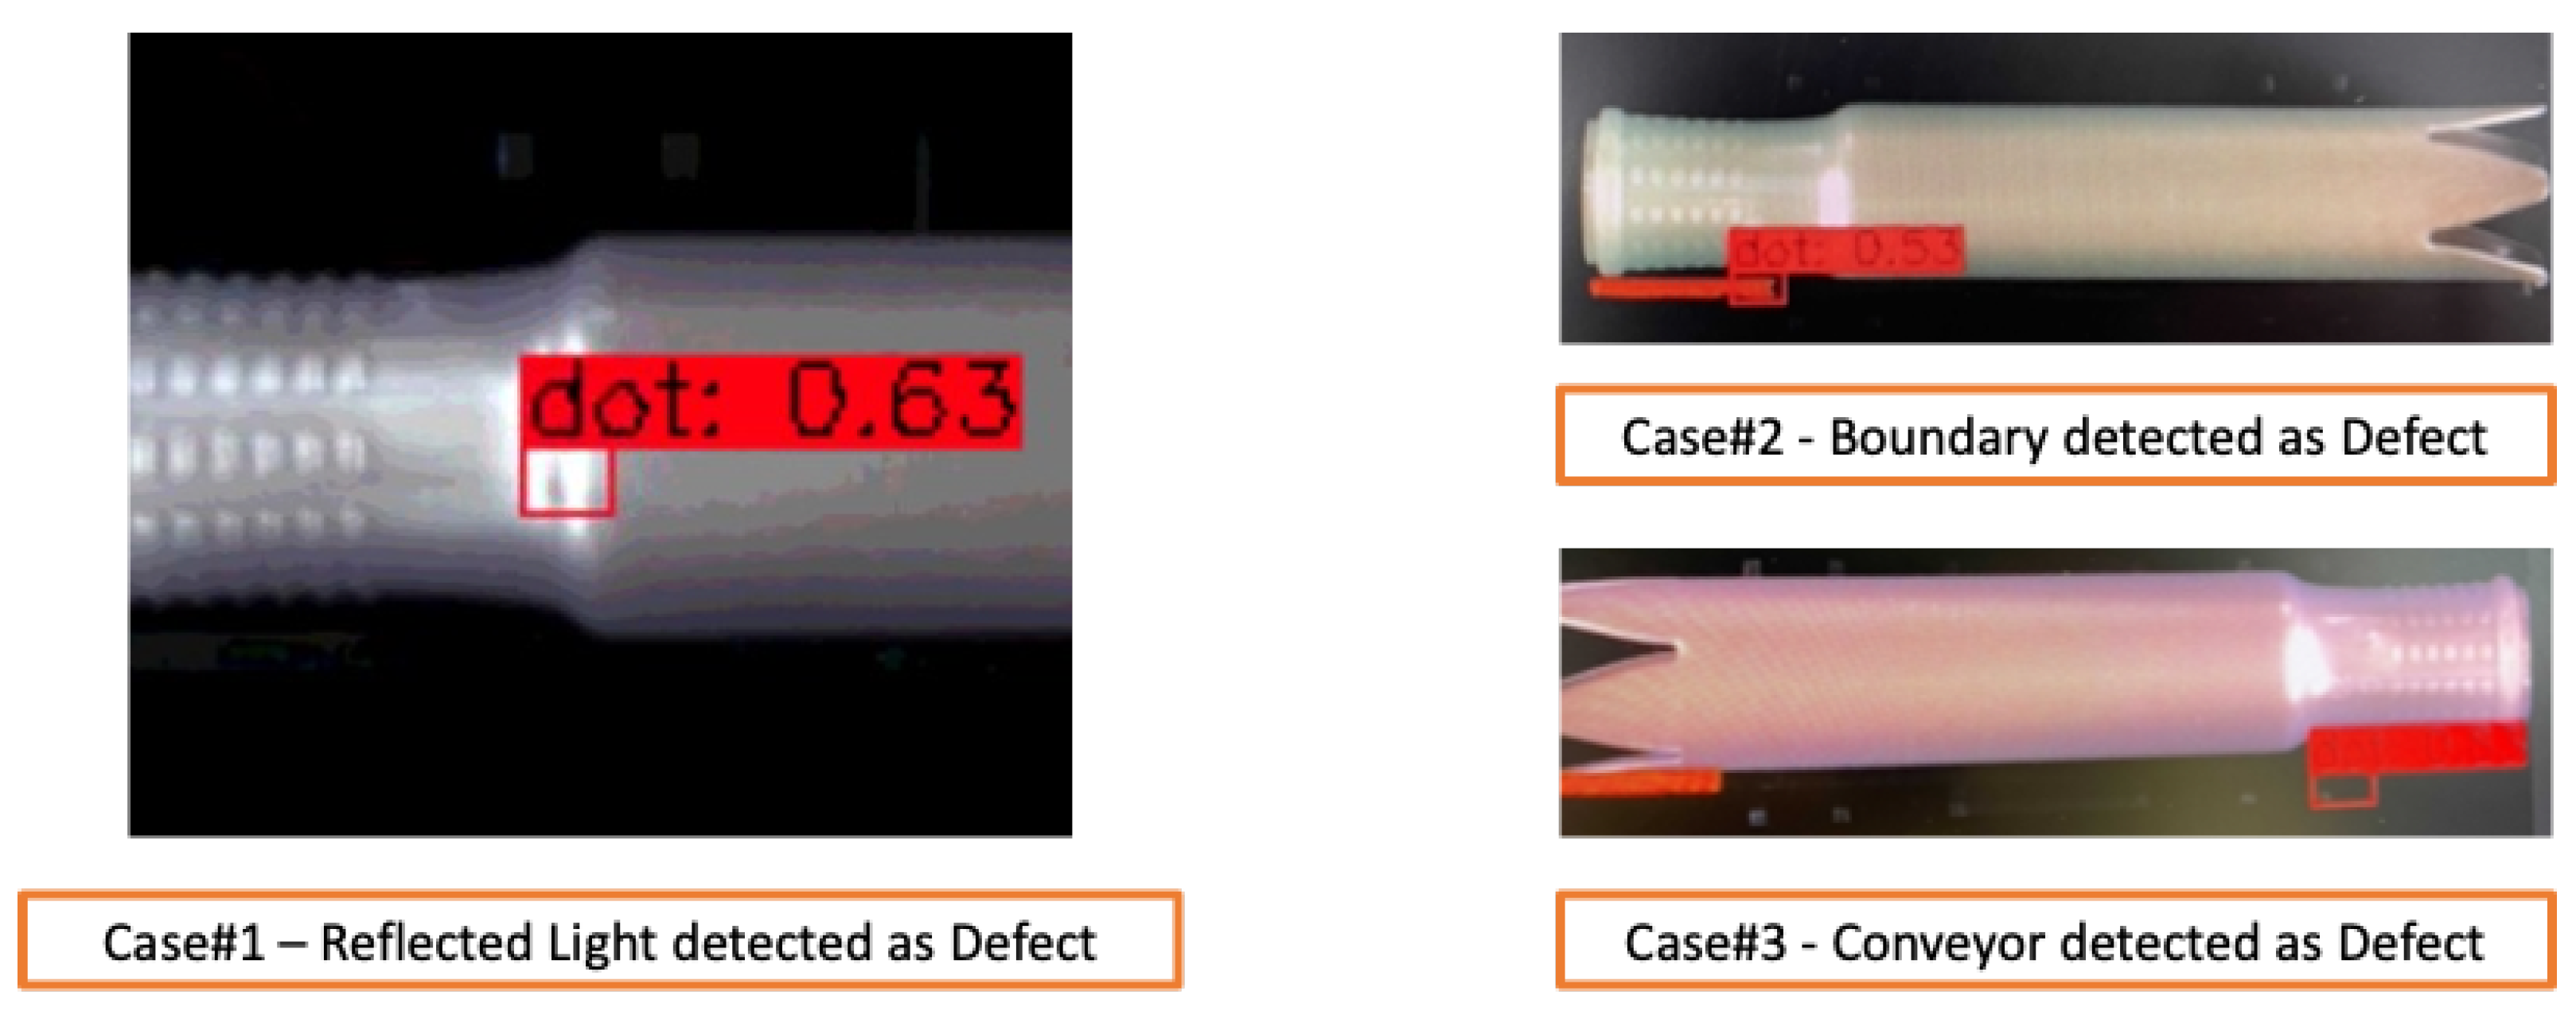
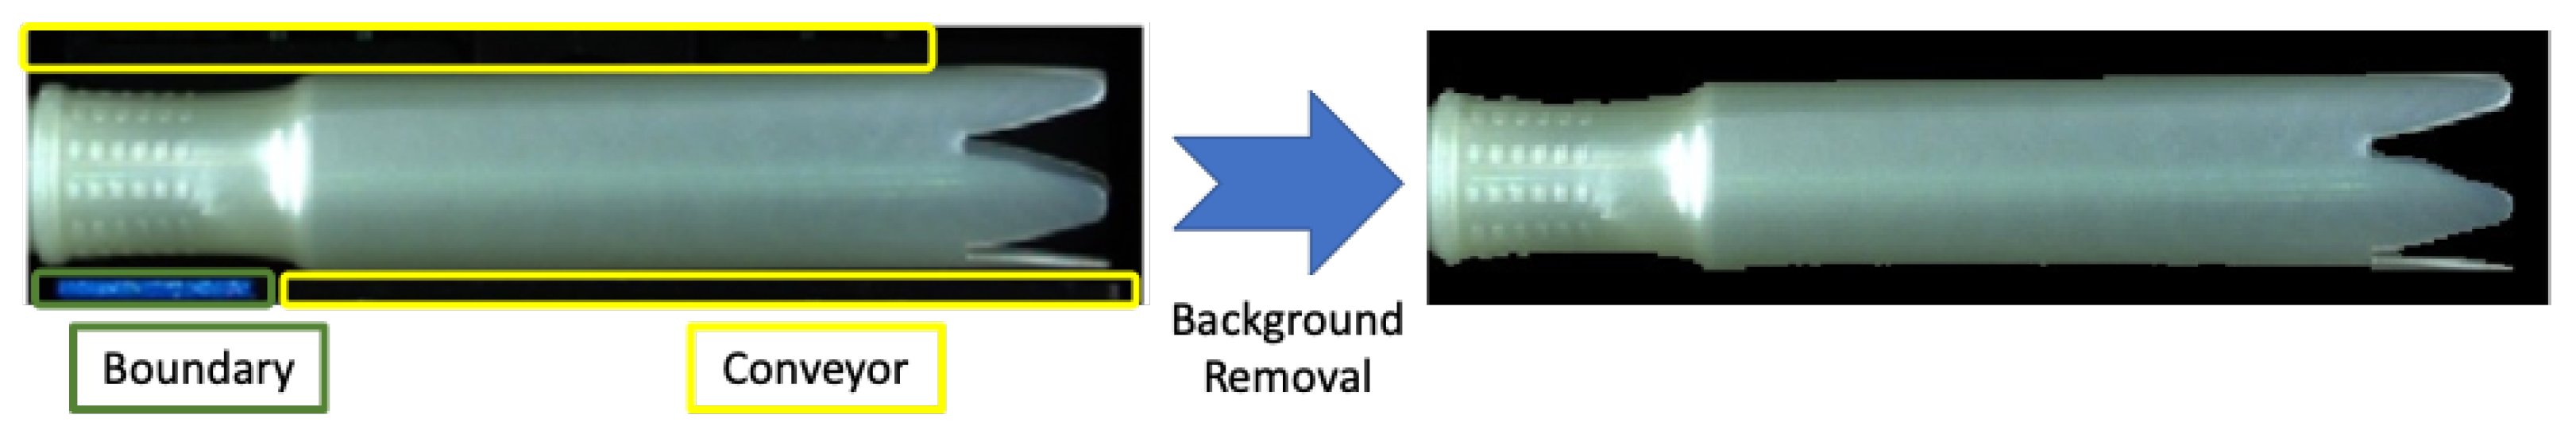
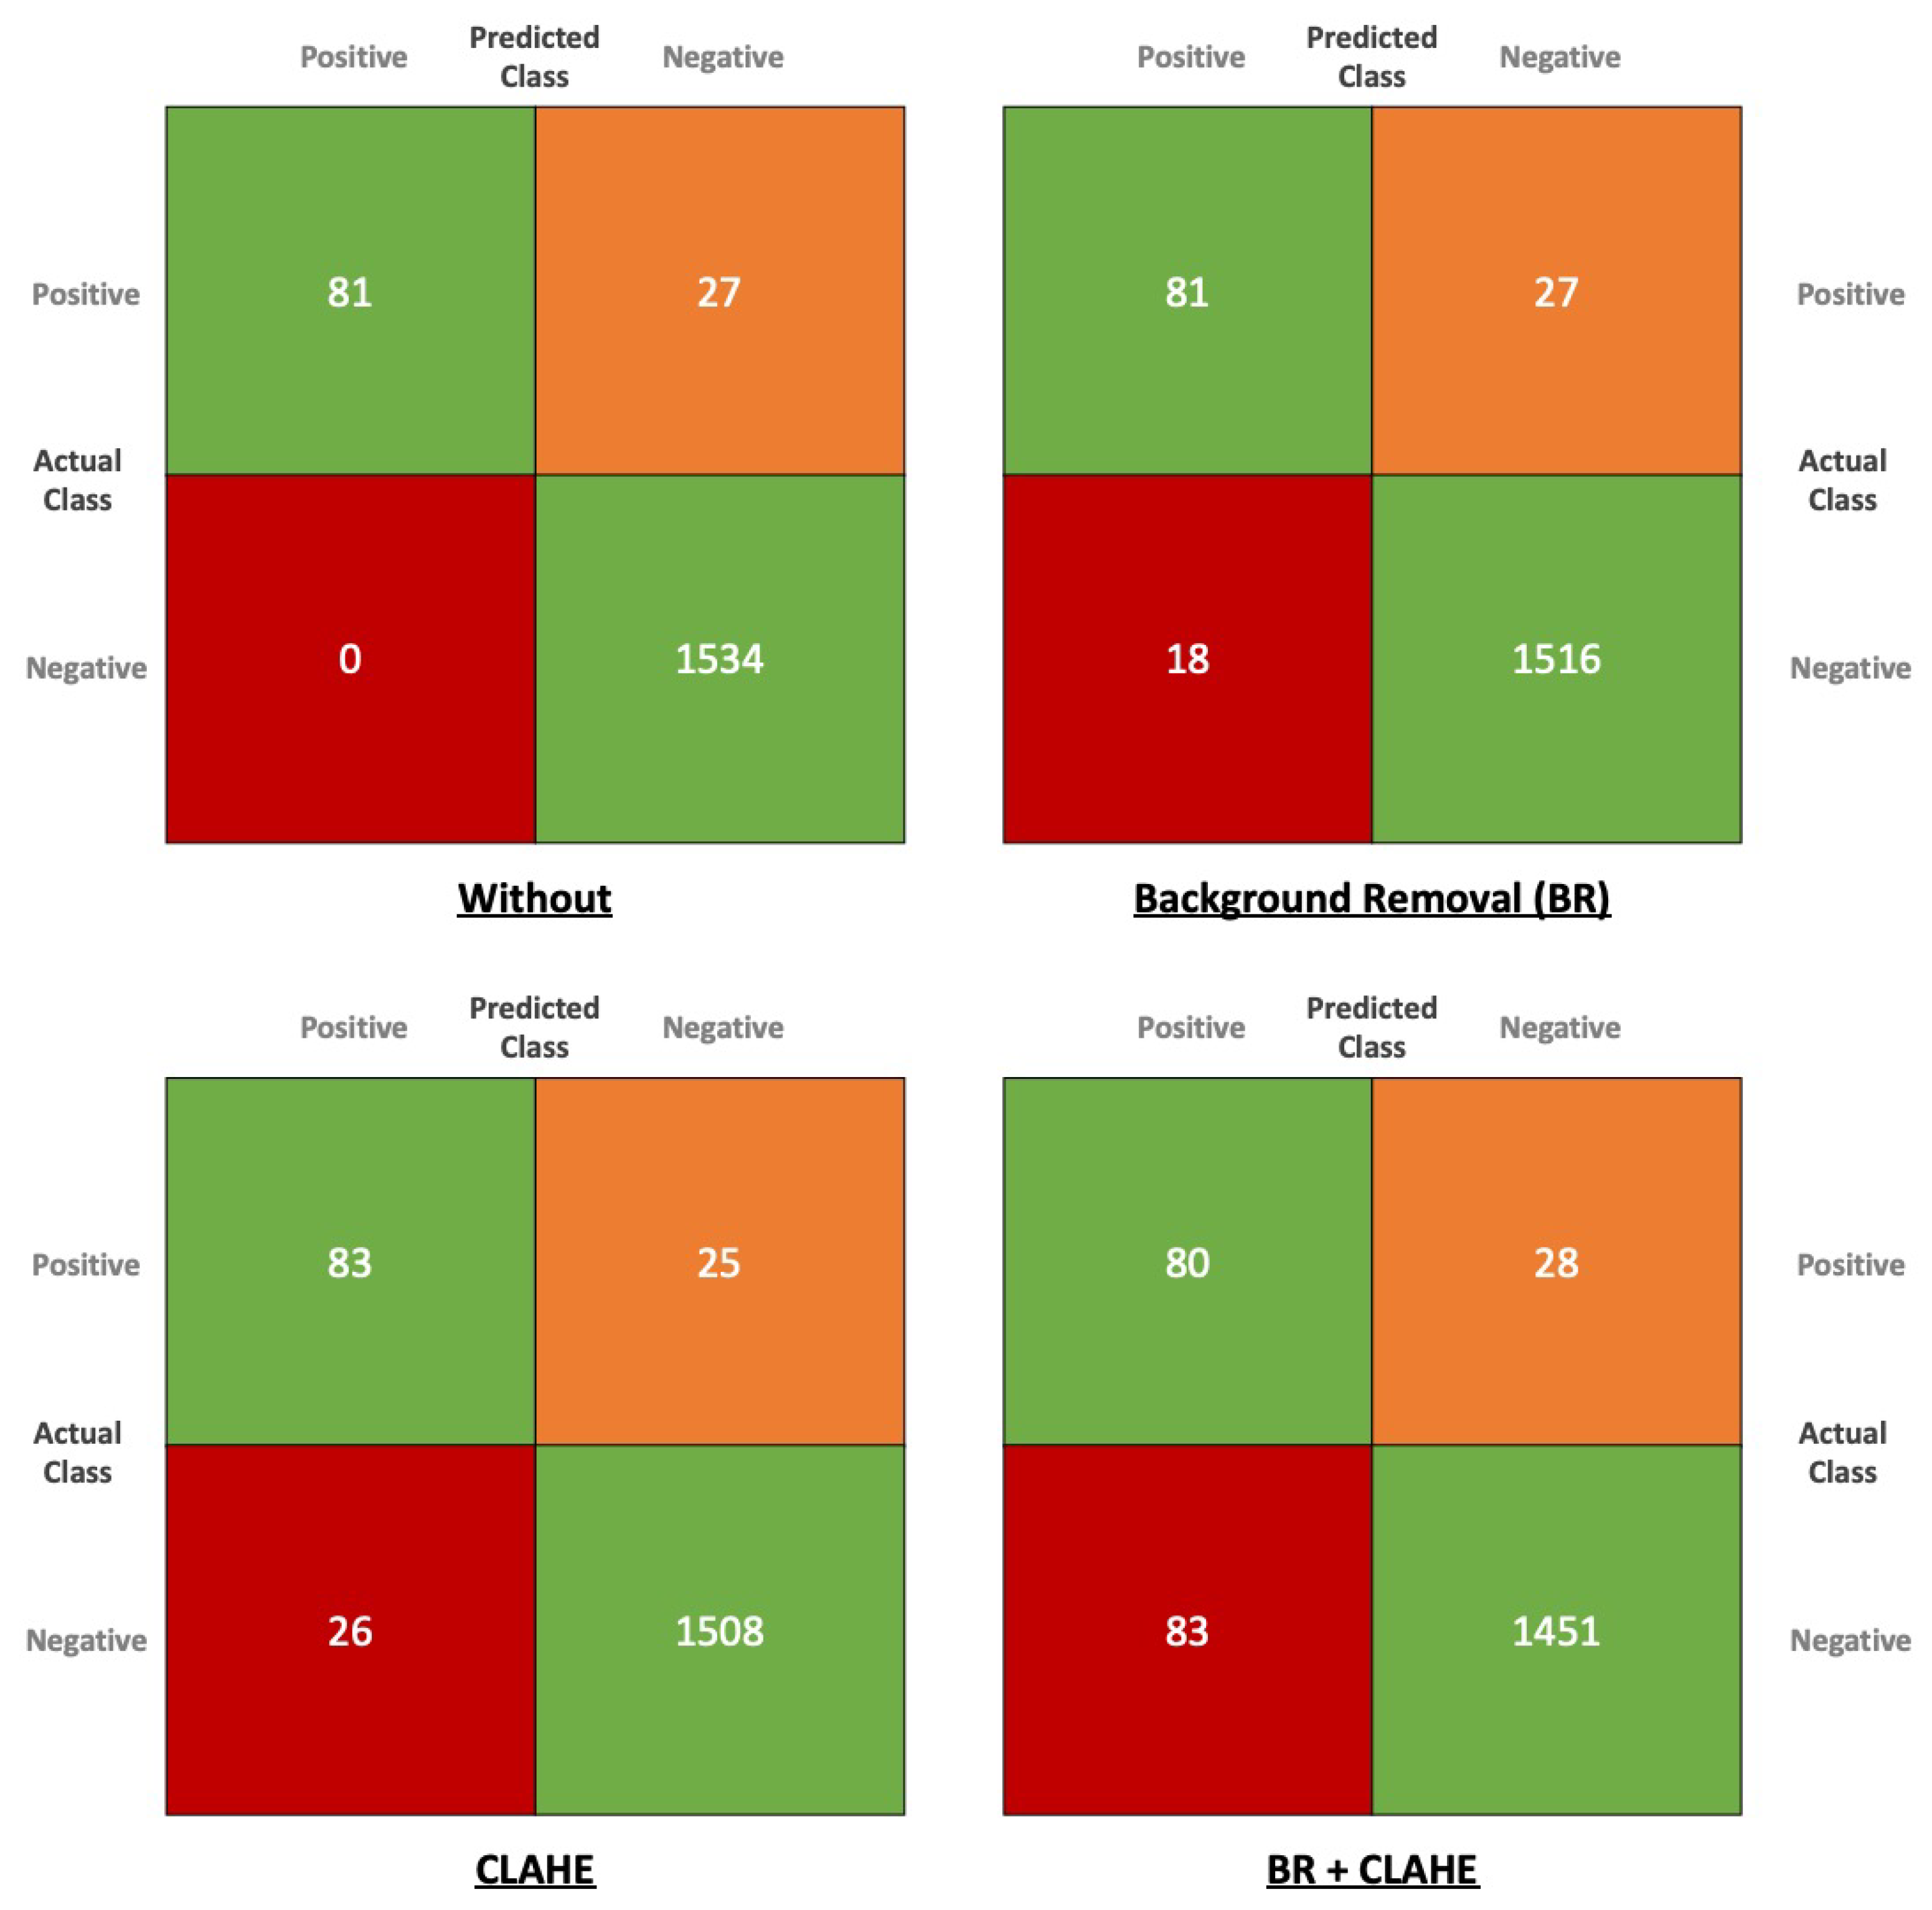
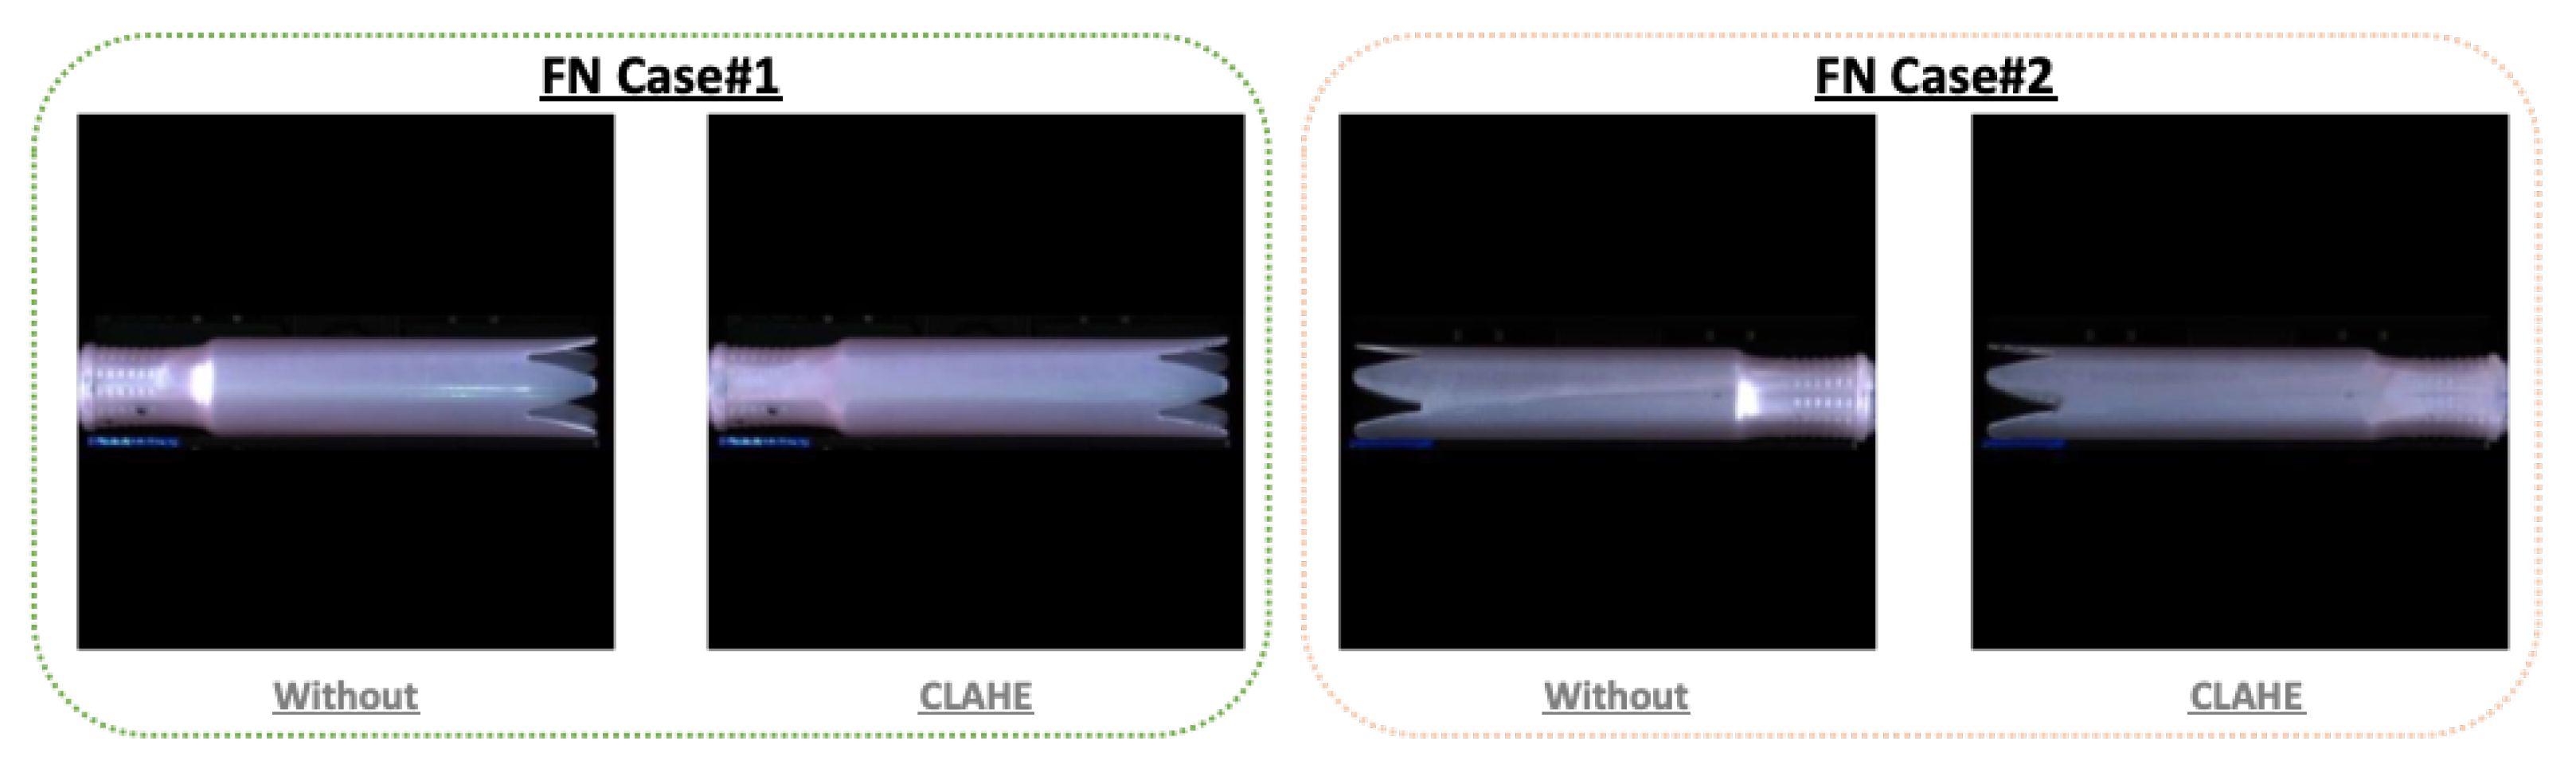
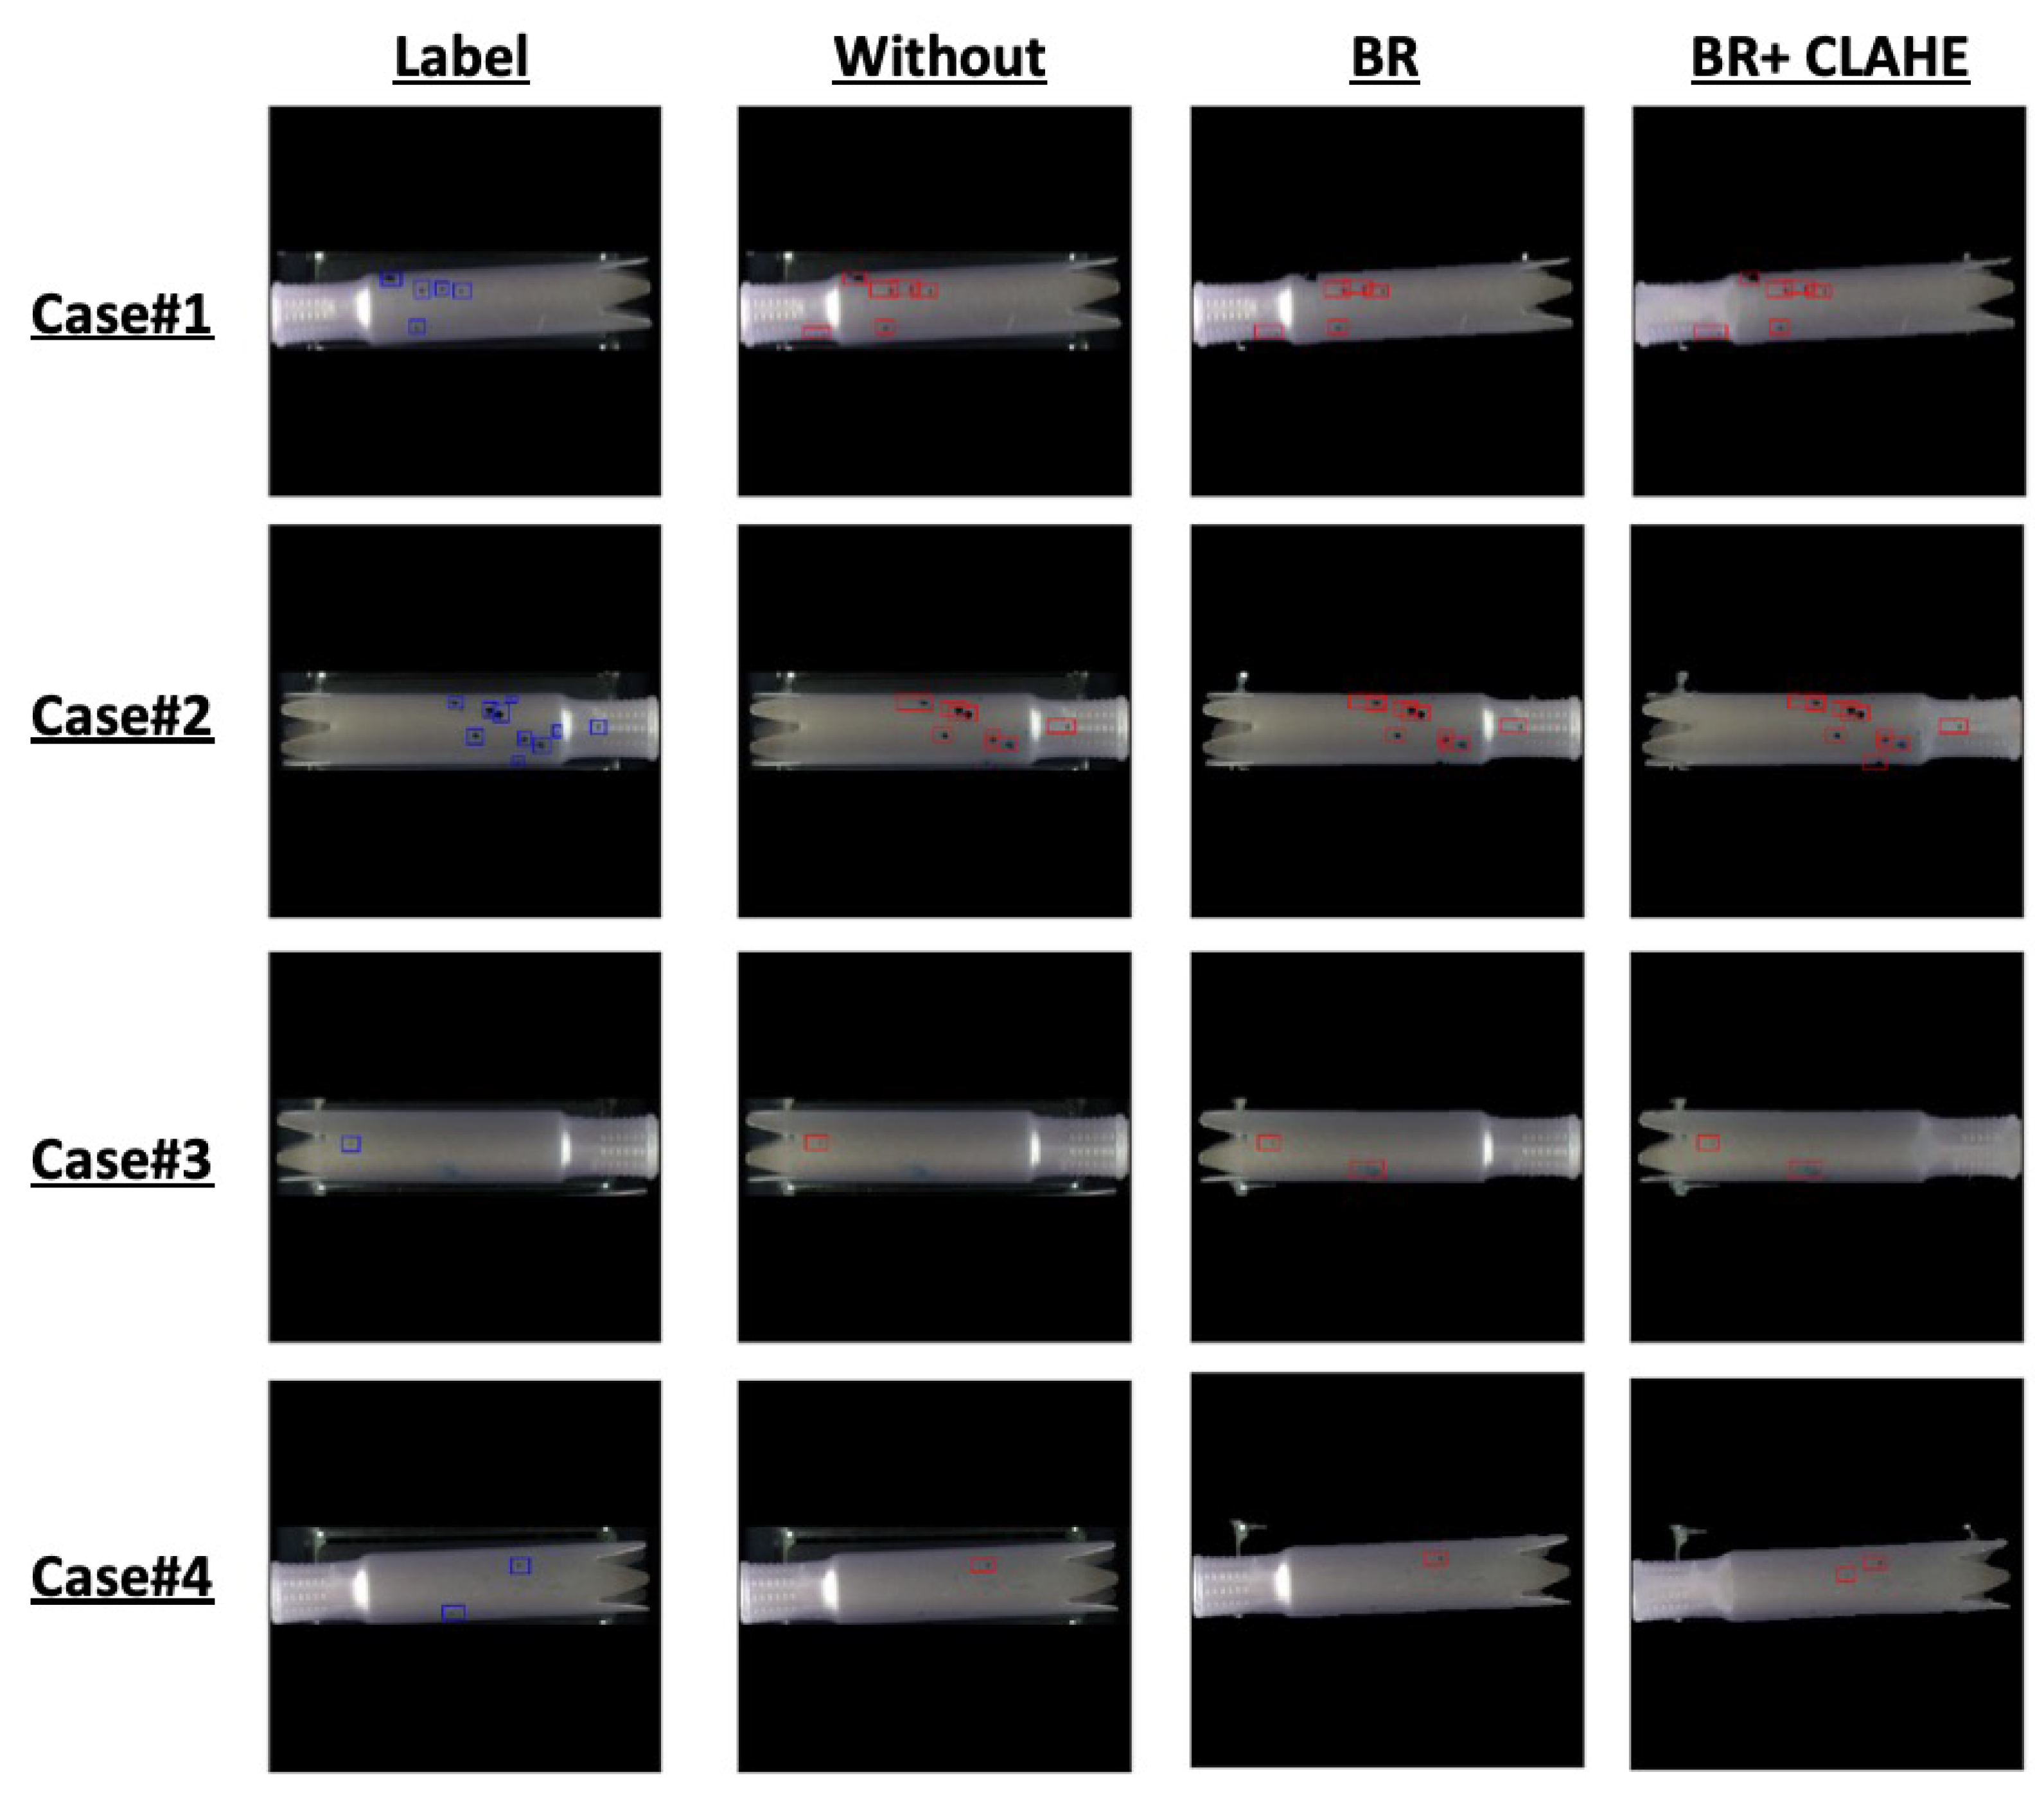
  • By applying the object-detection model (YOLOv4) on site, we have experienced some malfunctions that detected the conveyor and light as defects. We used a data-centric approach to solve the problem. Instead of the micro-adjusting the model, we have applied different data pre-processing techniques to overcome the malfunction. To validate the performance of the data pre-processing methods, we have conducted an experiment that compares the different combinations of data pre-processing techniques based on the validation metrics such as Accuracy, F1-score, Precision, Recall, and Average Precision. We generated a dataset of 1534 normal and 908 NG (No Good) images for the experiment, labeled with skilled inspectors’ help.
The rest of this paper is organized as follows. Section 2 focuses on the former studies that have inspired our system. In Section 3, we describe the configuration and inspection mechanism of the proposed system. Section 4 presents the experimental setup for comparing various models with different data pre-processing methods. The metrics, hypotheses, dataset, parameter setting, and the performance analysis based on the data-centric approach are delivered as well. Section 5 provides our conclusions.

2. Related Work

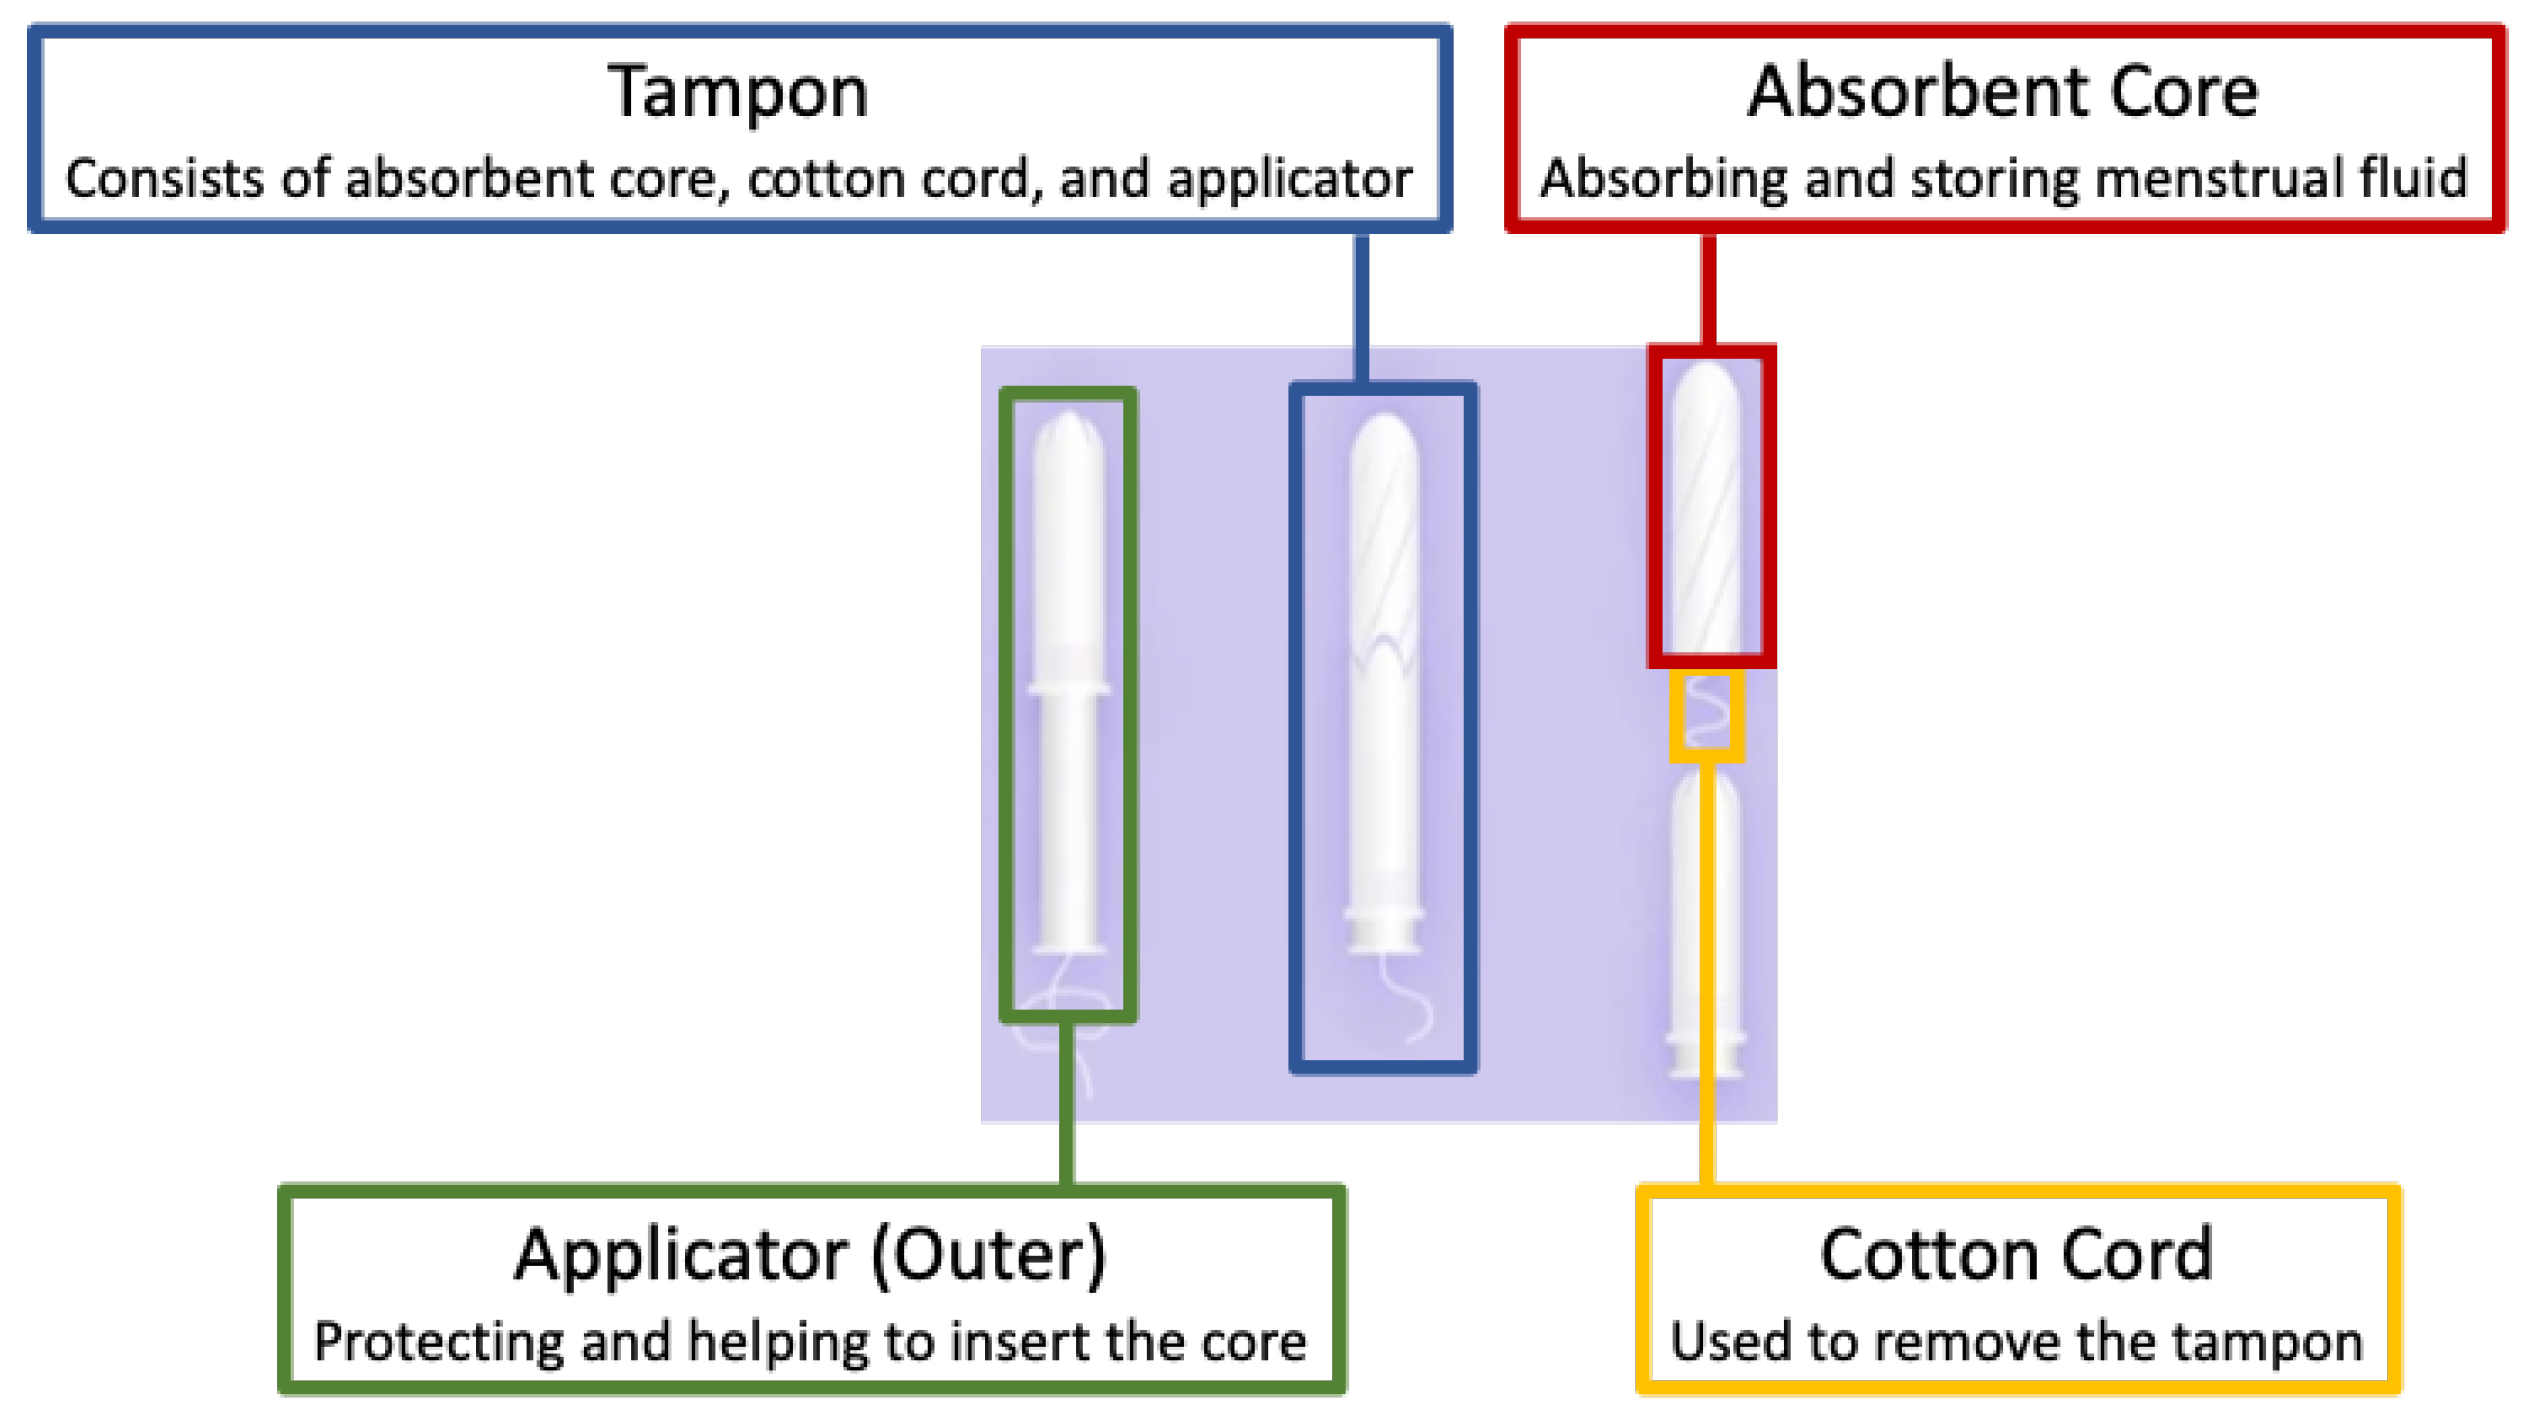
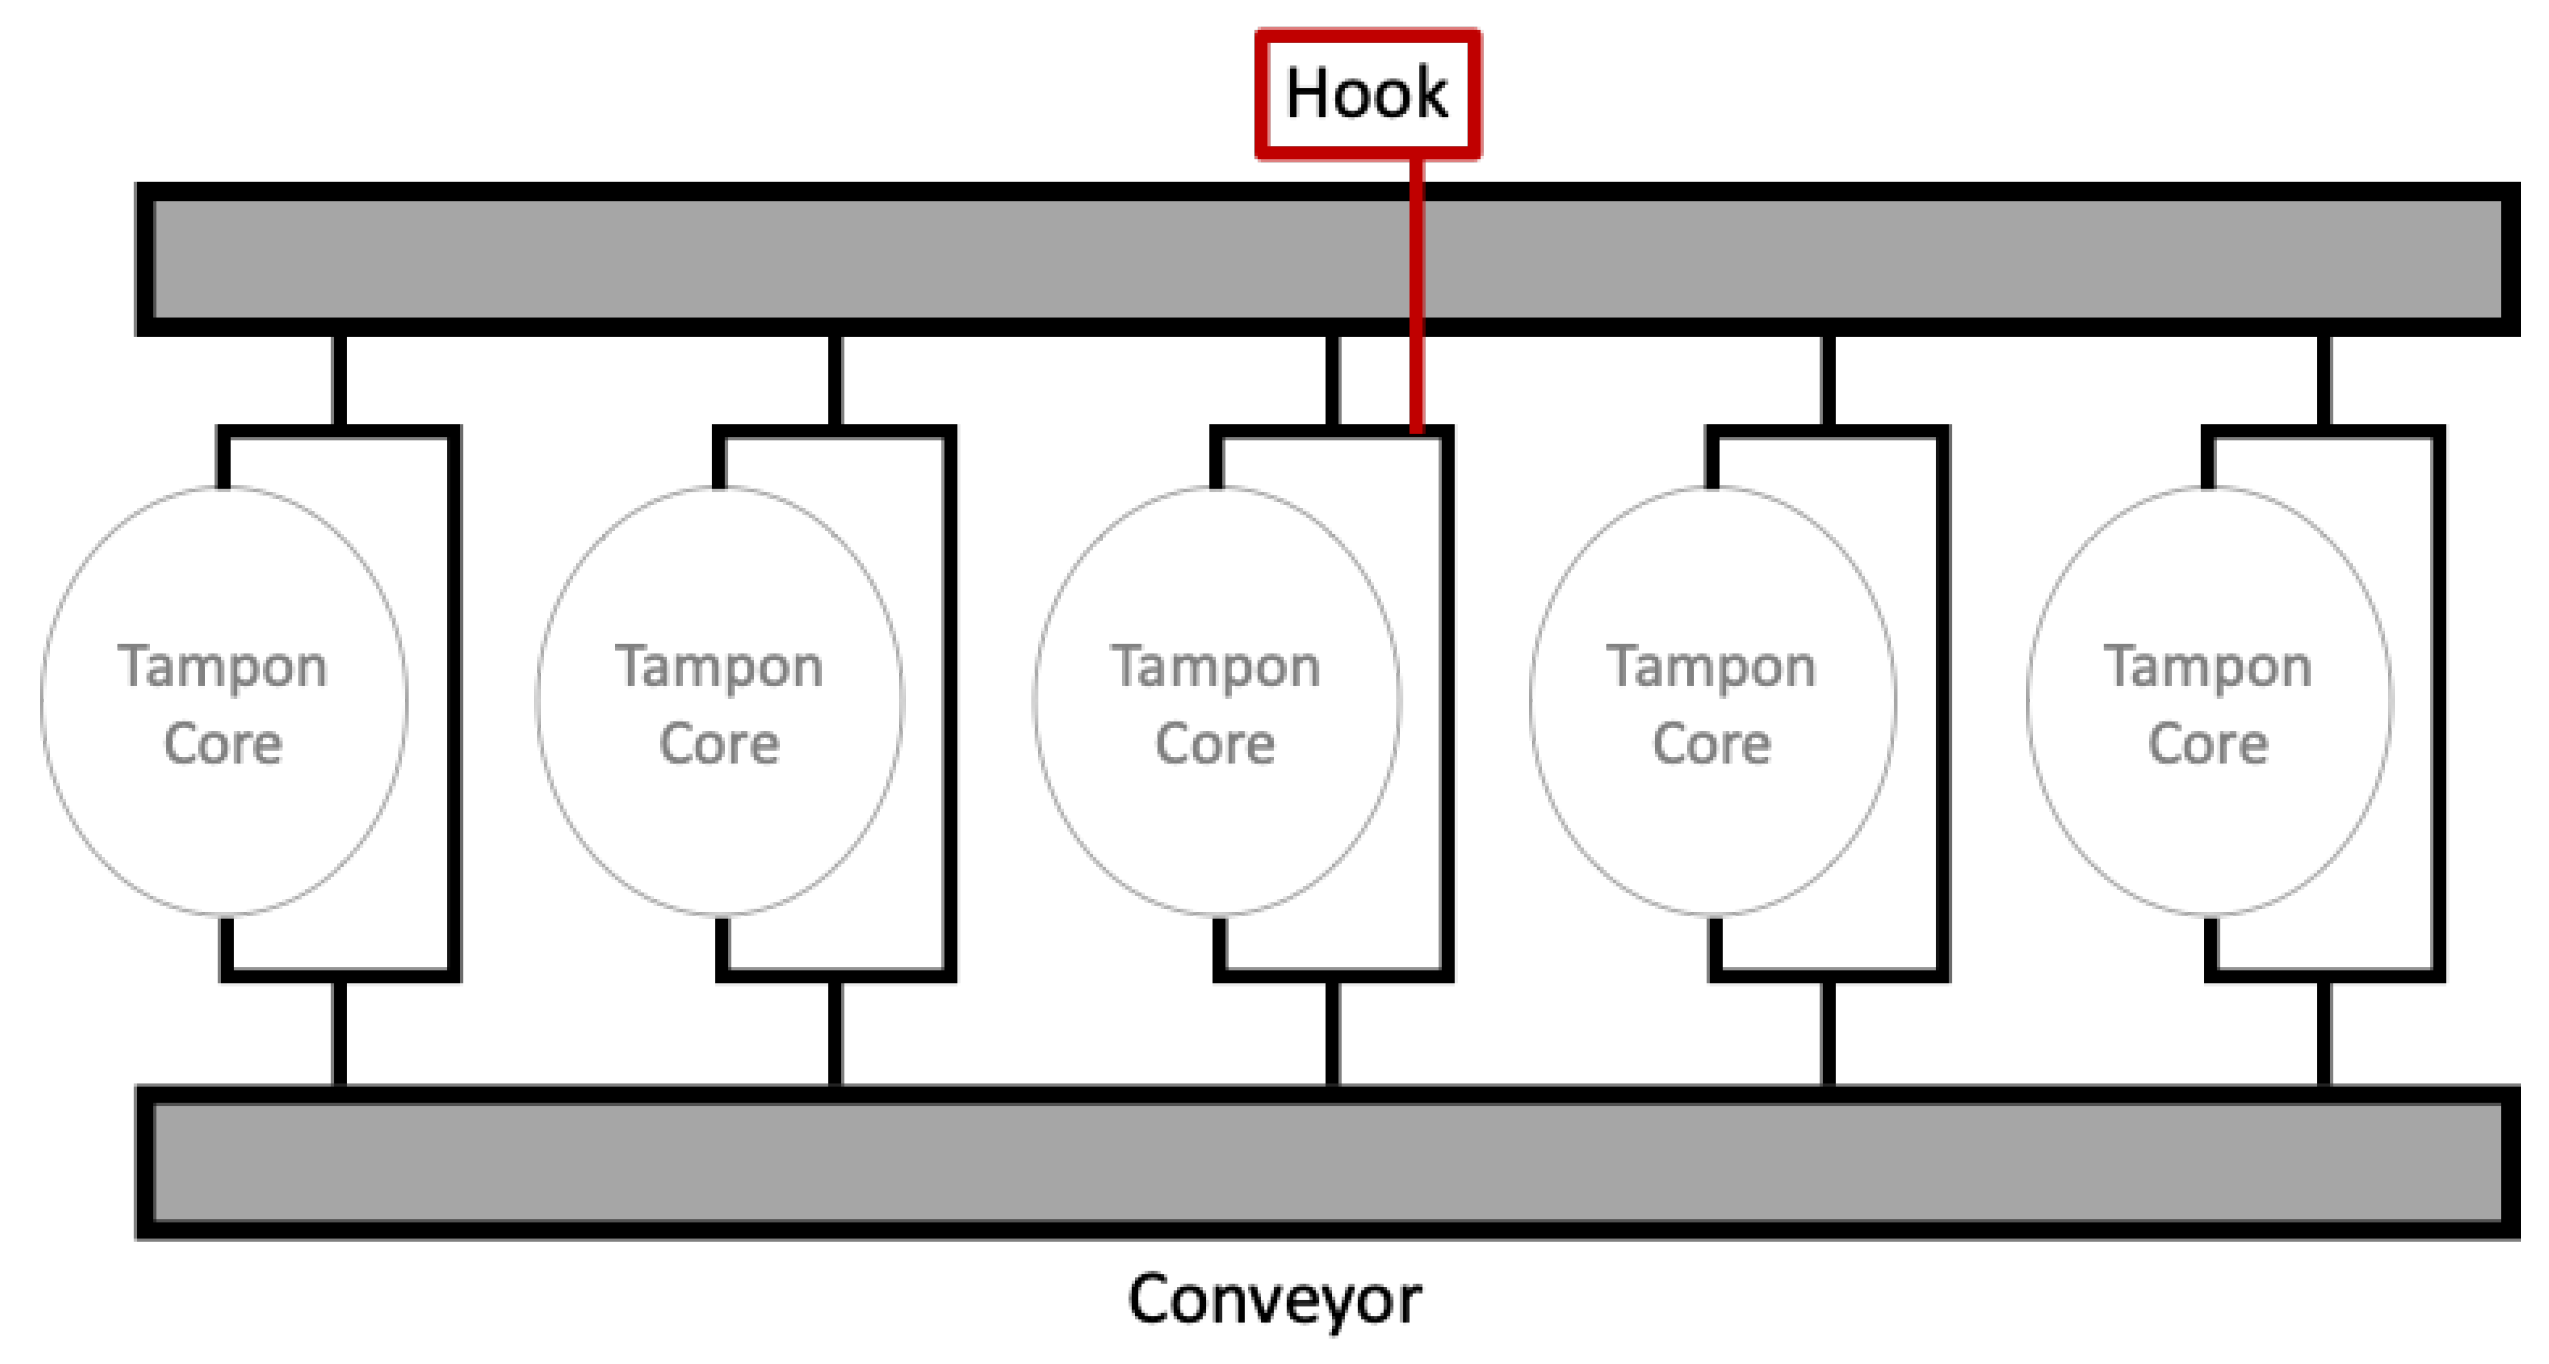
2.1. Tampon Inspection Unit

An automated inspection system for half-finished tampons with absorbent core and cotton cord without applicators was proposed in 2004 [10]. The proposed inspection system consisted of a visual inspection system equipped with three cameras mounted at angles of 120°, as shown in Figure 3.
The main reason for applying three vision cameras was the transport system that handled the tampons with wire-hooks made of spring steel, as shown in Figure 4.
The hook-based transport system guaranteed stability for image processing by positioning the tampons at the correct distance from the cameras. However, since one camera can observe only a third of the body, three cameras are required for successful 360° inspection, which leads to higher inspection costs. Furthermore, the hook-based transport was designed based on the material characteristics of the cotton absorbent core, hence it cannot be applied for slippery plastic applicators.
For the inspection system, traditional rule-based vision inspection techniques were used. Tatzer et al. [10] made the best use of the heuristic assumption for object detection. They assumed that the object is the tampon if the length and width of the white pixels are within the measurement tolerances because the tampon is light, and the background is dark. For inspecting the tampon body, they developed an algorithm based on the automatic white balance correction. The algorithm assumes that a significant part of the detected object is white, and that only a small part should be colored. Given this characteristic, the white balance correction values were calculated. The proposed rule-based algorithm using the heuristic assumption should work robustly for absorbent-core inspection. However, the automatic white balance correction method is hard to implement for plastic products that reflect light. In addition, it does not guarantee the accuracy for various atypical types of defects caused by any working environment or reference figures that change because engineers extract the features manually.

2.2. AI Technologies Applied for Industrial Applications

The inspection process using machine vision is divided into (1) image acquisition, (2) digitalization, (3) processing, (4) analysis, and (5) interpretation. For the traditional visual inspection system, experts teach the features and the inspection rules manually. Studies for surface-defect detection based on traditional machine vision have been conducted actively. The textural defect detection methods can be categorized into (1) statistical, (2) structural, (3) filter-based, and (4) model-based [11]. The statistical and filter-based methods are commonly used in industrial applications [5]. However, they have limitations in that they cannot generate discriminative features [12], and often must be applied as an ensemble in order to work well [13,14,15]. For this reason, the model-based defect detection method has been actively researched, and has become more popular thanks to the development of high-performance computers and Artificial Intelligence (AI).
A Convolutional Neural Network (CNN) is based on the structure of ImageNet developed by LeCun [16] in 1989. In this research, LeCun proposed data augmentation and dropout to solve the overfitting problems. Since AlexNet was presented in 2012, which dominated other algorithms in image classification [17], CNN has gained tremendous popularity in academia. Using locality, shared weight, and multiple layers with pooling operations, CNN can automatically learn features from the data and classify images without separate manual feature-extraction tasks. Given this advantage, many researchers have applied CNN in quality inspection to overcome the limitations of the traditional visual inspection system. Wen et al. [12] used CNN for inspecting wafer semiconductors, and Yang et al. [18] suggested a USB defect inspection system based on CNN. Zhong et al. [19] proposed a CNN-based algorithm for detecting catenary split pins in high-speed railways.
CNN can classify objects well but has trouble in locating objects. R-CNN is a model with the addition of a box-offset regressor that improves the accuracy and localization [20]. Fast R-CNN is a model derived from R-CNN that applies Region of Interest (RoI) pooling and softmax classification to compensate for R-CNN’s shortcomings. Fast R-CNN enables Single Stage Training and Backpropagation to improve object-detection performance [21]. Faster R-CNN uses a Region Proposal Network (RPN) to diversify the anchor-box size by using a feature map to detect objects independently. Furthermore, Faster R-CNN leverages a Feature Pyramid Network (FPN) to detect small objects by rescaling feature maps to different sizes. The algorithm proposed by Ren et al. [22] has been tested on COCO and PASCAL VOC datasets and requires complements to be used for manufacturing inspection. The Mask R-CNN proposed by He et al. [23] added a Fully Convolutional Network (FCN) to Faster R-CNN, offsetting the shortcomings of having location information disappear from the Fully Connected layers (FC). Mask R-CNN also applies RoI-alignment to improve the problem with the discrepancy that Faster R-CNN with RoI pooling forces objects of different sizes to specific values. The mask prediction and class prediction work separately.
The object-detection algorithm is actively being studied for inspecting defects. Faster R-CNN is a model with high accuracy among object-detection algorithms and is being studied in the industrial field. For example, Liyun et al. [24] conducted a study to detect defects in automobile engine blocks and heads using Faster R-CNN and detected surface defects with a 92.15% probability. Wang et al. [25] also tested 175 defects in turbo blades entering automobile engines by using Faster R-CNN. Oh et al. [26] used Faster R-CNN to detect welding defects automatically. On the other hand, Mask R-CNN is also actively researched in the fields that require object segmentation. Attard et al. [27] studied a method for automatically inspecting cracks in buildings using Mask R-CNN. Zhao et al. [28] conducted a study to examine the cable bracket of an aircraft using Mask R-CNN.
The above-mentioned R-CNN-based models extract sub-images by generating thousands of regions by means of selective search algorithms. Then, the features are extracted while these sub-images pass through CNN. This complex image processing method may guarantee accuracy, but it is slow. To overcome the shortcoming in speed, Redmon et al. [29] presented a new object-detection algorithm called YOLO, which is a one-stage detector that executes regional proposal and classification at once, which means that the single neural network predicts bounding boxes and class probabilities directly from the image. YOLO uses non-max suppression to decide regions. The architecture of YOLO is shown in Figure 5.
Since YOLO was presented in 2016, it has been improved continuously. In 2017, YOLOv2 was introduced by Redmon et al. [30] with image classification significantly improved by applying batch normalization, direct location prediction, and multiscale training. As a result, YOLOv2 can detect more than 9000 object categories, which exceeds YOLO with the capability of detecting 20 objects. In 2018, Redmon et al. [31] improved the algorithm by increasing the network up to 106 layers. Bochkovskiy et al. [32] presented YOLOv4, which was improved in accuracy by increasing the training and inference cost with the help of the Bag-of-Freebies and Bag-of-Specials methods of object detection during the detector training. As a result, YOLOv4 outperforms YOLOv3 by approximately 10%, and allows one to train, test, and deploy the model with a single GPU.
YOLO has the strength of detecting objects in real-time, so it is being studied actively to apply it to quality inspection. Qiu et al. [33] developed object-detection models optimized for small-sized defects of wind turbine blades by modifying YOLO. They made a dataset of 23,807 images for the research, including labeling with three different types of defects. According to their performance analysis, the YOLO-based model achieved an average accuracy of 91.3%, which is better than that of traditional CNN-based and Machine Learning (ML)-based methods. Adibhatla et al. [34] applied YOLO for quality inspection of Printed Circuit Boards (PCB). They also generated a dataset with 11,000 images, including the defects images labeled by skilled inspectors. The suggested YOLO-based inspection model achieved an accuracy of 98.79%. Wu and Li [35] improved YOLOv3 by applying anchor boxes cluster analysis to detect electrical connectors’ defects. According to their performance analysis, the presented algorithm works better than does Faster R-CNN by achieving an accuracy of 93.5%. In addition to the quality inspection in manufacturing, YOLO is also being studied in various fields such as infrastructure management [36,37].
YOLACT is the real-time instance-segmentation model presented by Bolya et al. [38], inspired by YOLO’s real-time object-detection capabilities. Instance segmentation is the task of detecting and explaining each object of interest that appears in the image. The former instance-segmentation models are the two-stage detectors that do instance segmentation by feature localization and masking prediction. YOLACT skips the feature localization stage, and instead, it generates the prototype mask dictionary for the whole image and predicts per-instance linear combination coefficients. Finally, the model creates the instance masks by linearly combining the prototype with the mask coefficients. The architecture of YOLACT is based on RetinaNet using ResNet101 and FPN, as shown in Figure 6. YOLACT is the first real-time instance-segmentation algorithm and achieved a 29.8 mean Average Precision (mAP) on the MS COCO dataset at over 30 fps.
Research on applying YOLACT to industrial uses is still insufficient. Guo et al. [39] suggested an instance-segmentation model with new backbone architecture such as YOLACT-Res2Net-50 and YOLACT-Res2Net-101 to inspect the track components of the railroad. Their performance analysis showed that their algorithm exceeds both original YOLACT and Mask R-CNN models by achieving 59.9 bounding box mAP and 63.6 masking mAP. Pan et al. [40] used Mask R-CNN, and YOLACT combined to detect surface scratches for architectural glass panels.
The abovementioned state-of-the-art models such as YOLO and YOLACT have proved their performance and robustness based on many experiments. However, more and more AI practitioners emphasize that the key success factor for real-world AI applications is data quality. The survey conducted by Google Research reveals that data is an under-estimated and de-glamorized aspect of AI [41]. Andrew Ng, the cofounder of DeepLearning.AI, Coursera, and LandingAI, launched a campaign for data-centric AI [42]. A data-centric based approach stresses that the consistency of data is needed for successful AI development. Reflecting this trend, more and more AI studies, especially in the industrial field, are focusing on data acquisition. Tang et al. [43] use X-ray images to detect defects for castings. By means of the casting defect detection system, the authors enable the generation of high-quality data. Zhou et al. [44] proposed a machine vision apparatus to inspect the glass-bottle bottom and successfully created high-quality data. The contribution of both teams in developing new AI methodology to outperform the prevalent methods should be praised. However, the fact that the experimental results of the prevalent methods already deliver adequate performances may support the effectiveness of the data-centric approach in AI development.

3. A Surface-Inspection System Based on Deep Learning

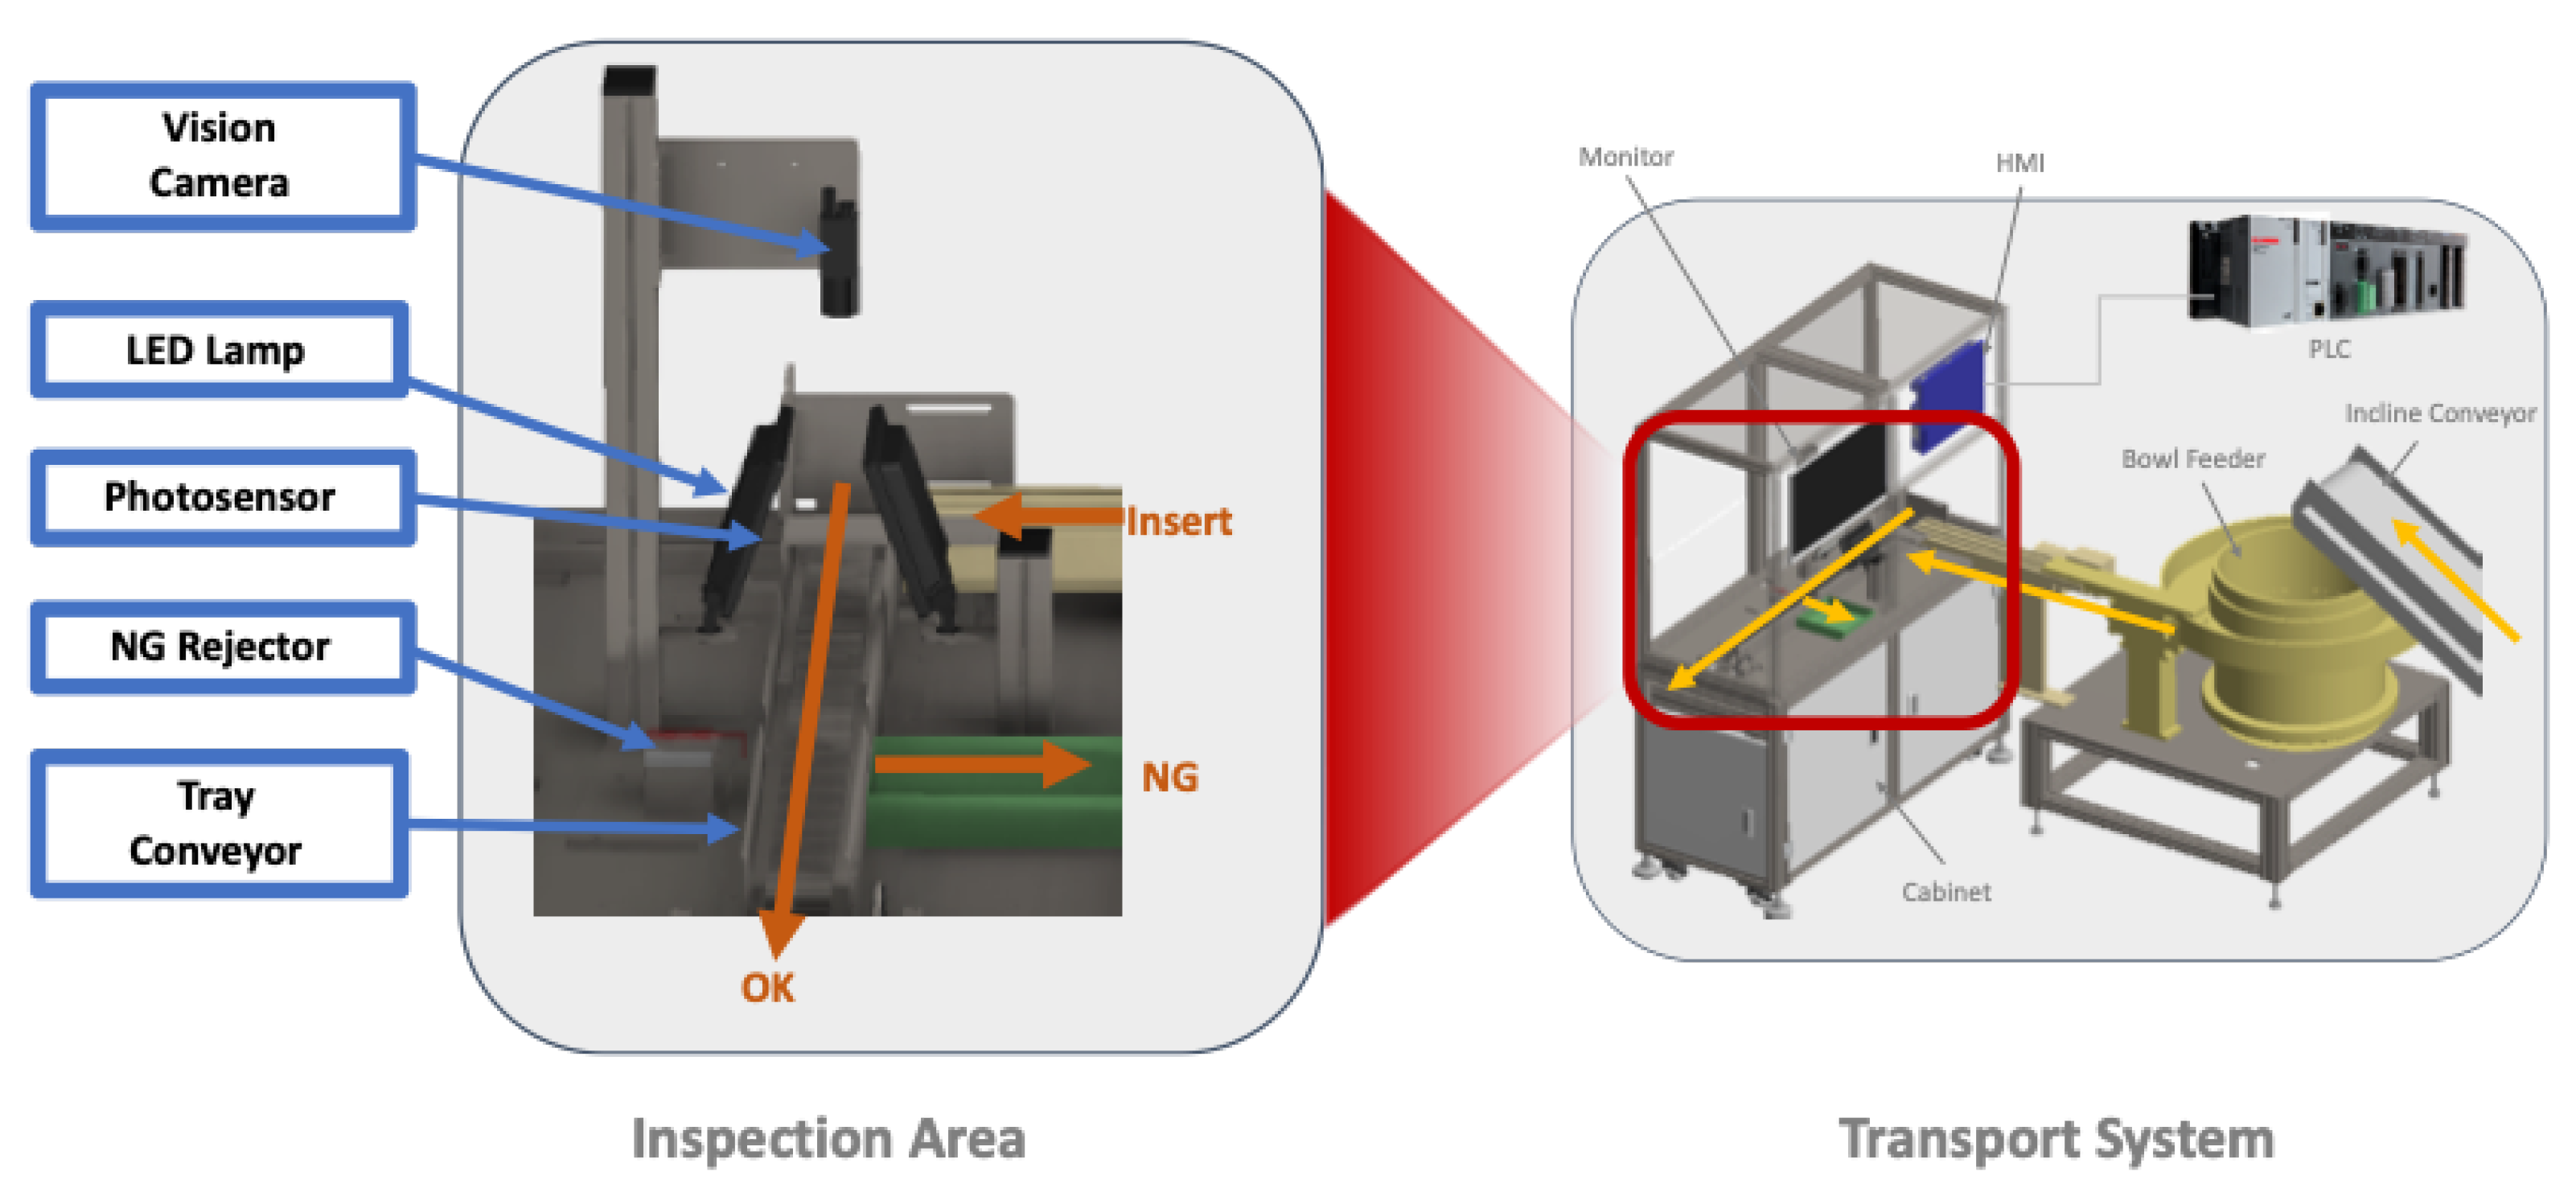
3.1. System Architecture

In this paper we propose a surface-inspection system based on deep learning that automatically transports, inspects, and stores tampon applicators produced by plastic injection molding machines. It consists of a fully automated transport system and a visual inspection system. The components of the automated transport system are a steel container, incline conveyor, bowl feeder, supply belt, photosensors, and Programmable Logic Controller (PLC). The visual inspection system consists of a camera, lens, and an Edge Computing Device (ECD) for operating both the visual system and AI inference. The layout of the whole system, and the closer view of the inspection station are shown in Figure 7 and Figure 8, respectively.
The inspection workflow of the system is as follows:
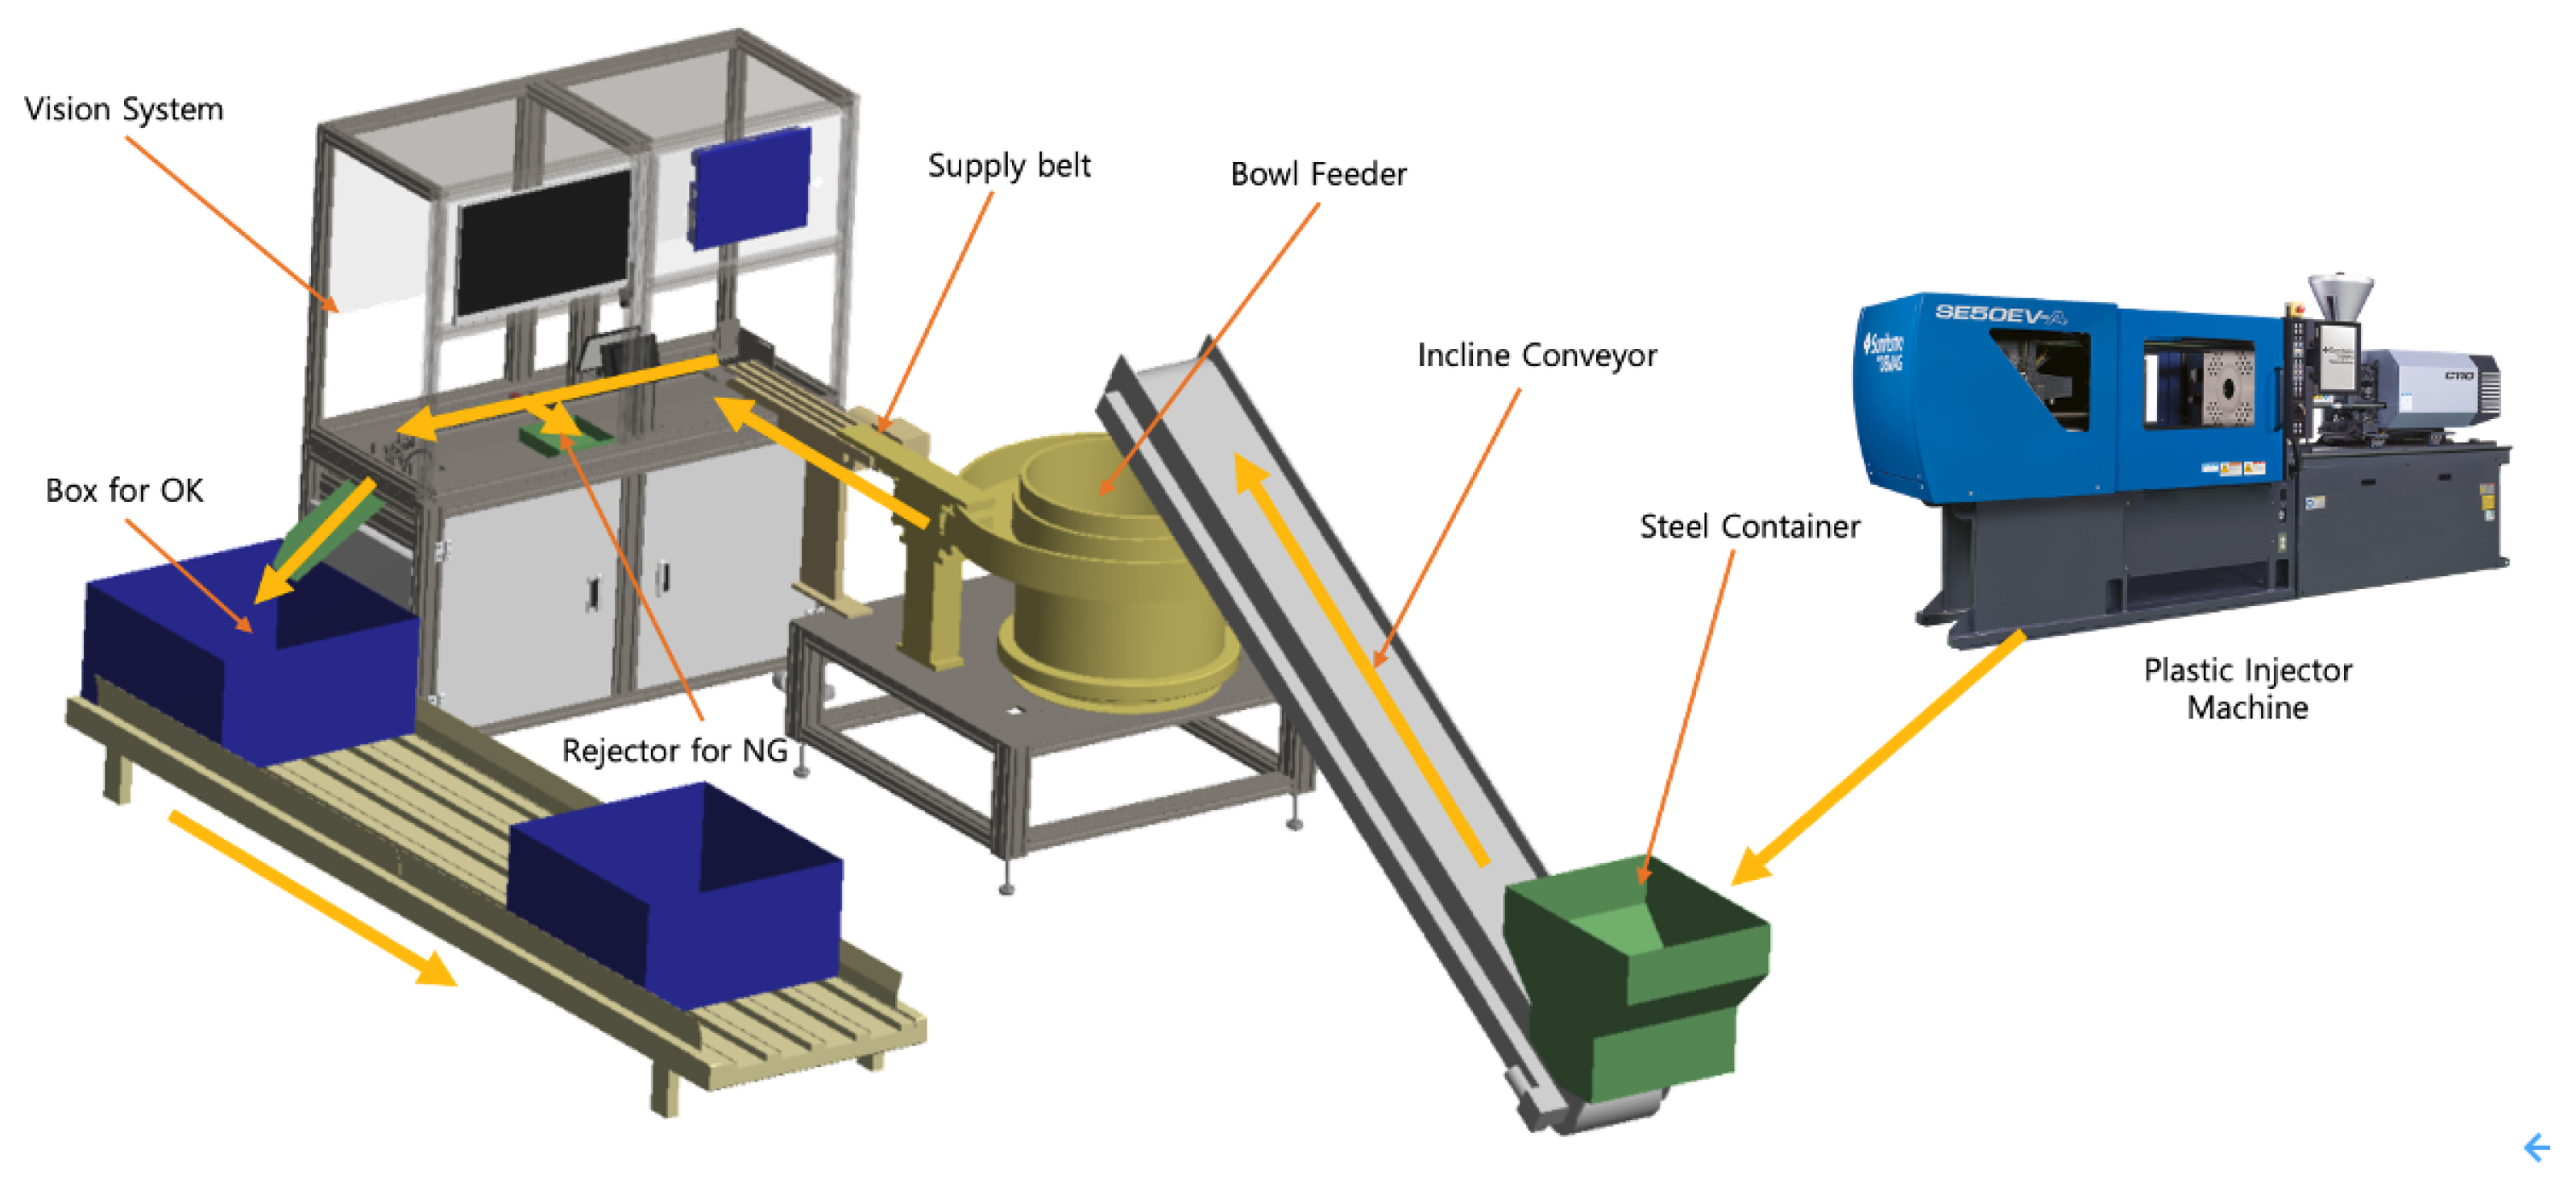
  • Drop of the applicators from the plastic injection molding machine to the steel container.
  • Transport of the applicators from the steel container to the bowl feeder with the incline conveyor.
  • Transport of the products from the bowl feeder to the supply belt.
  • The supply belt shoots each applicator to the inspection conveyor.
  • The tray-based conveyor transports the applicators to the inspection station.
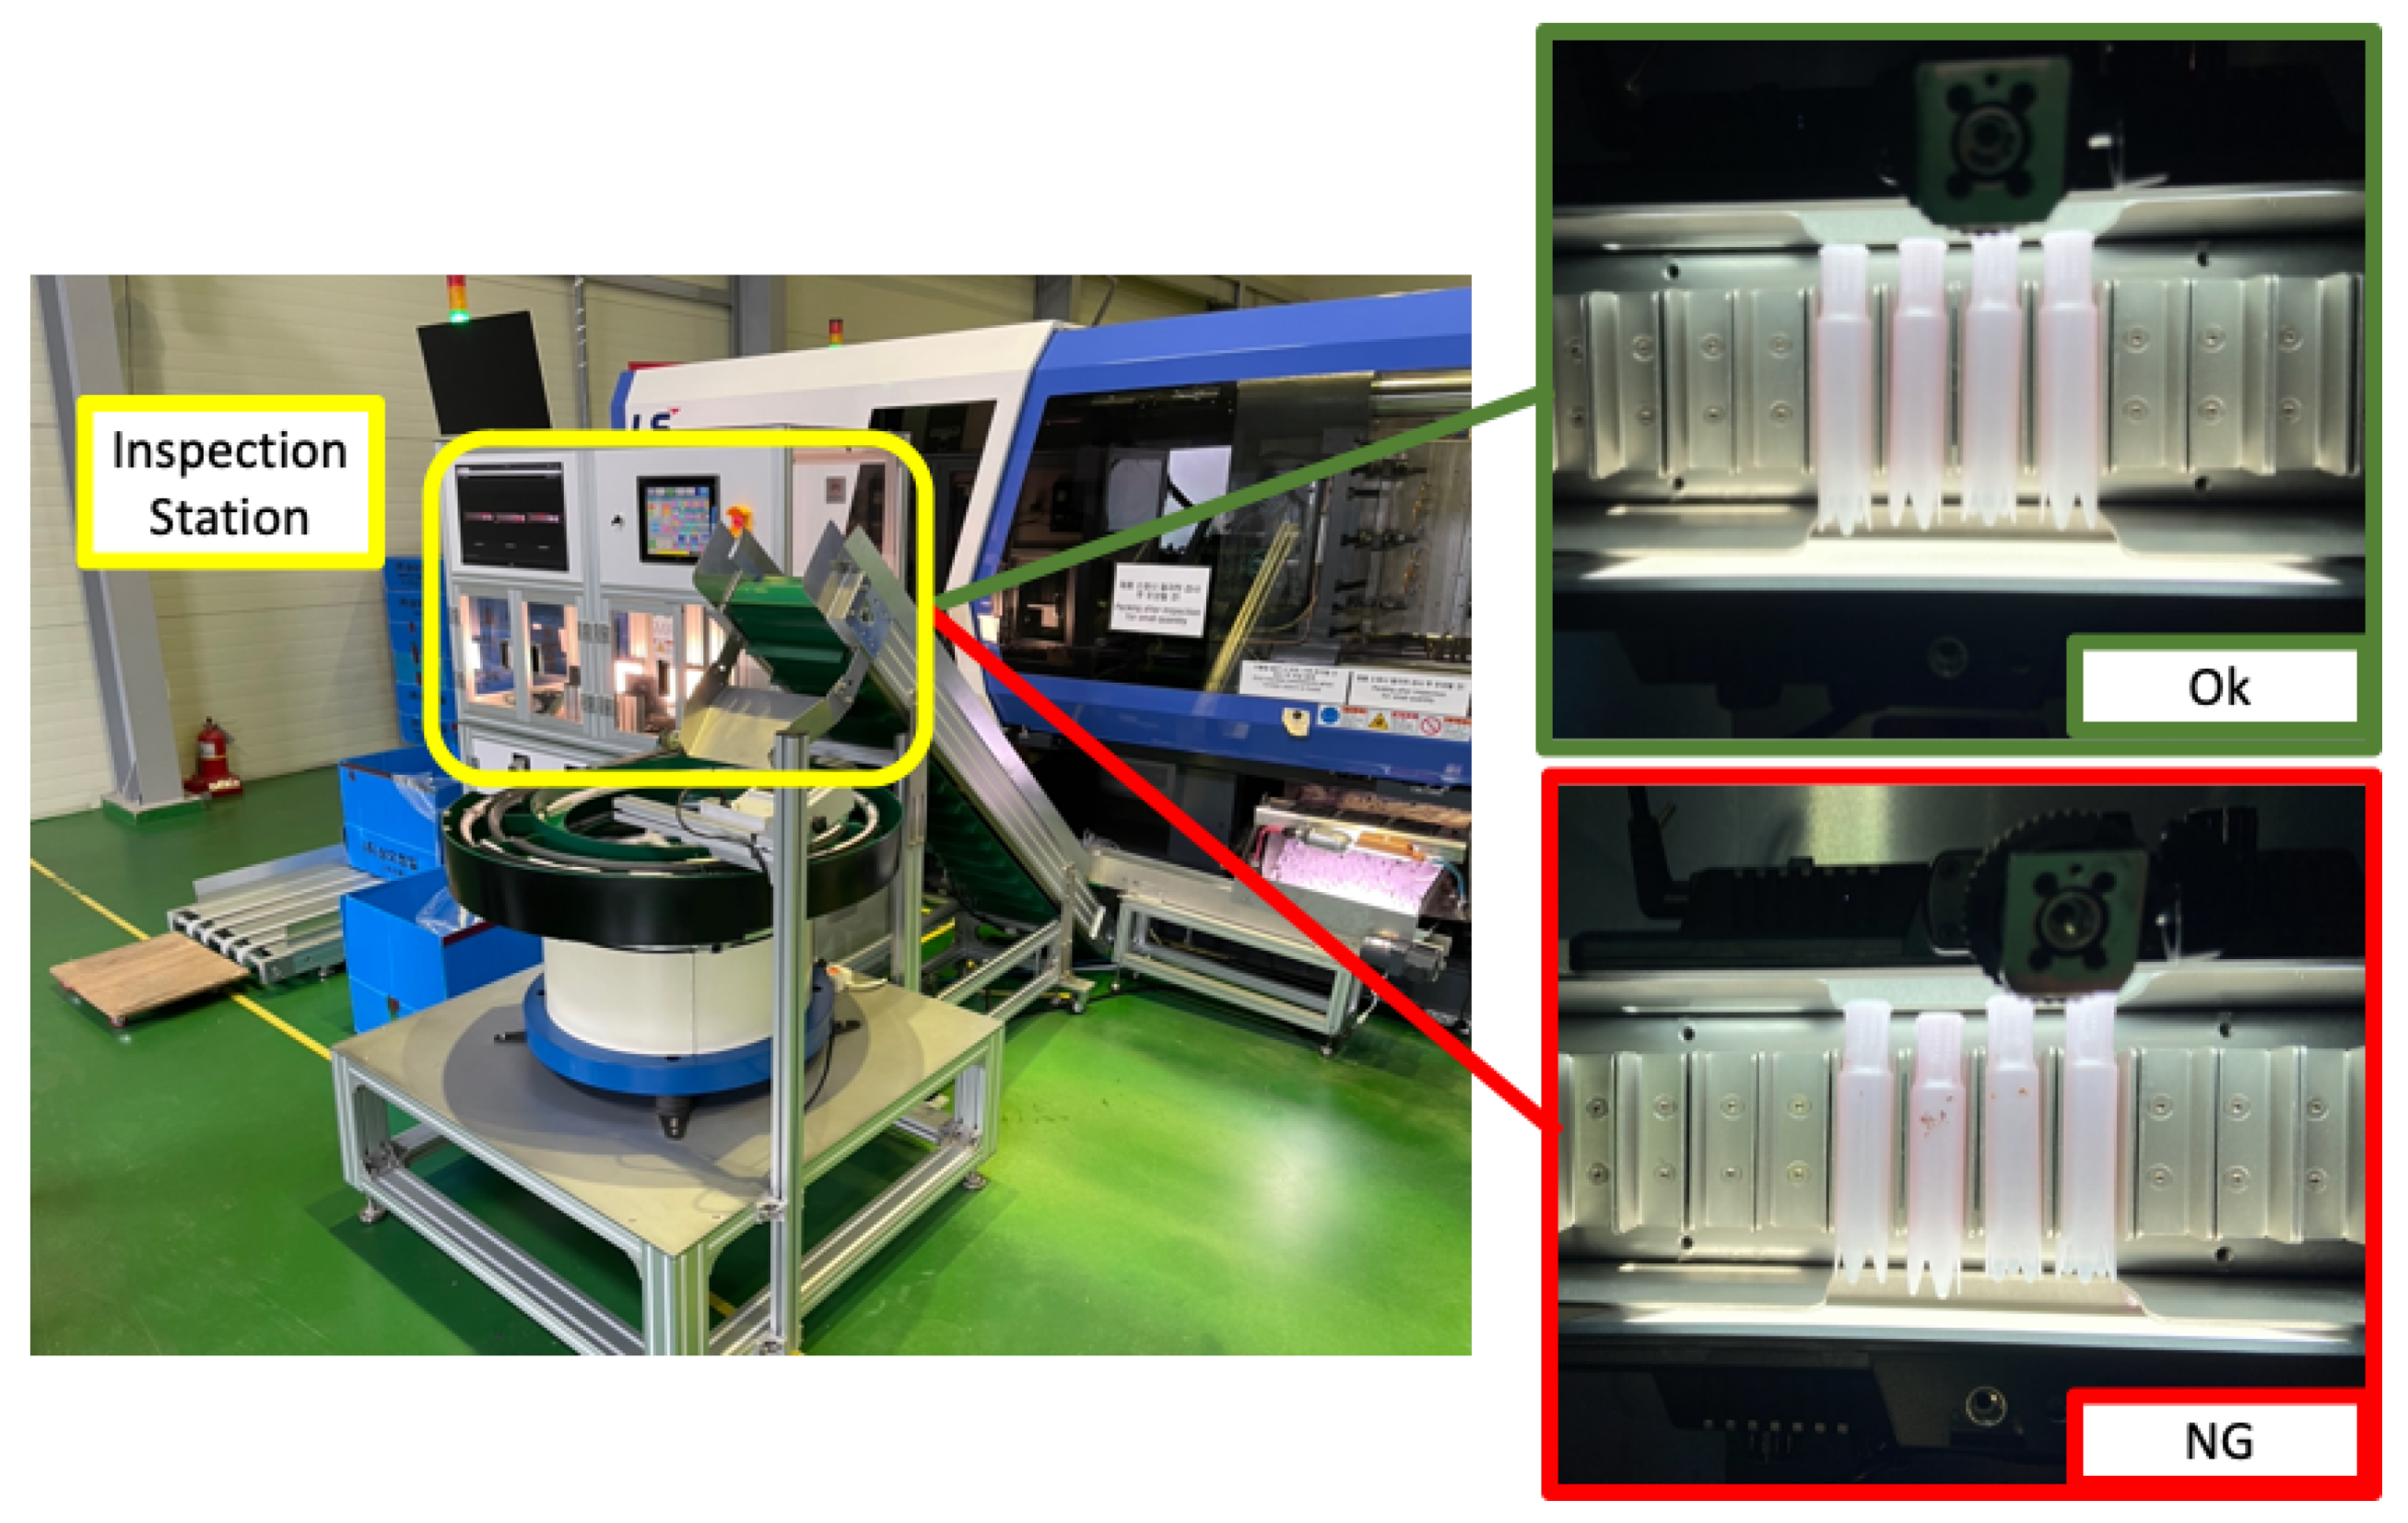
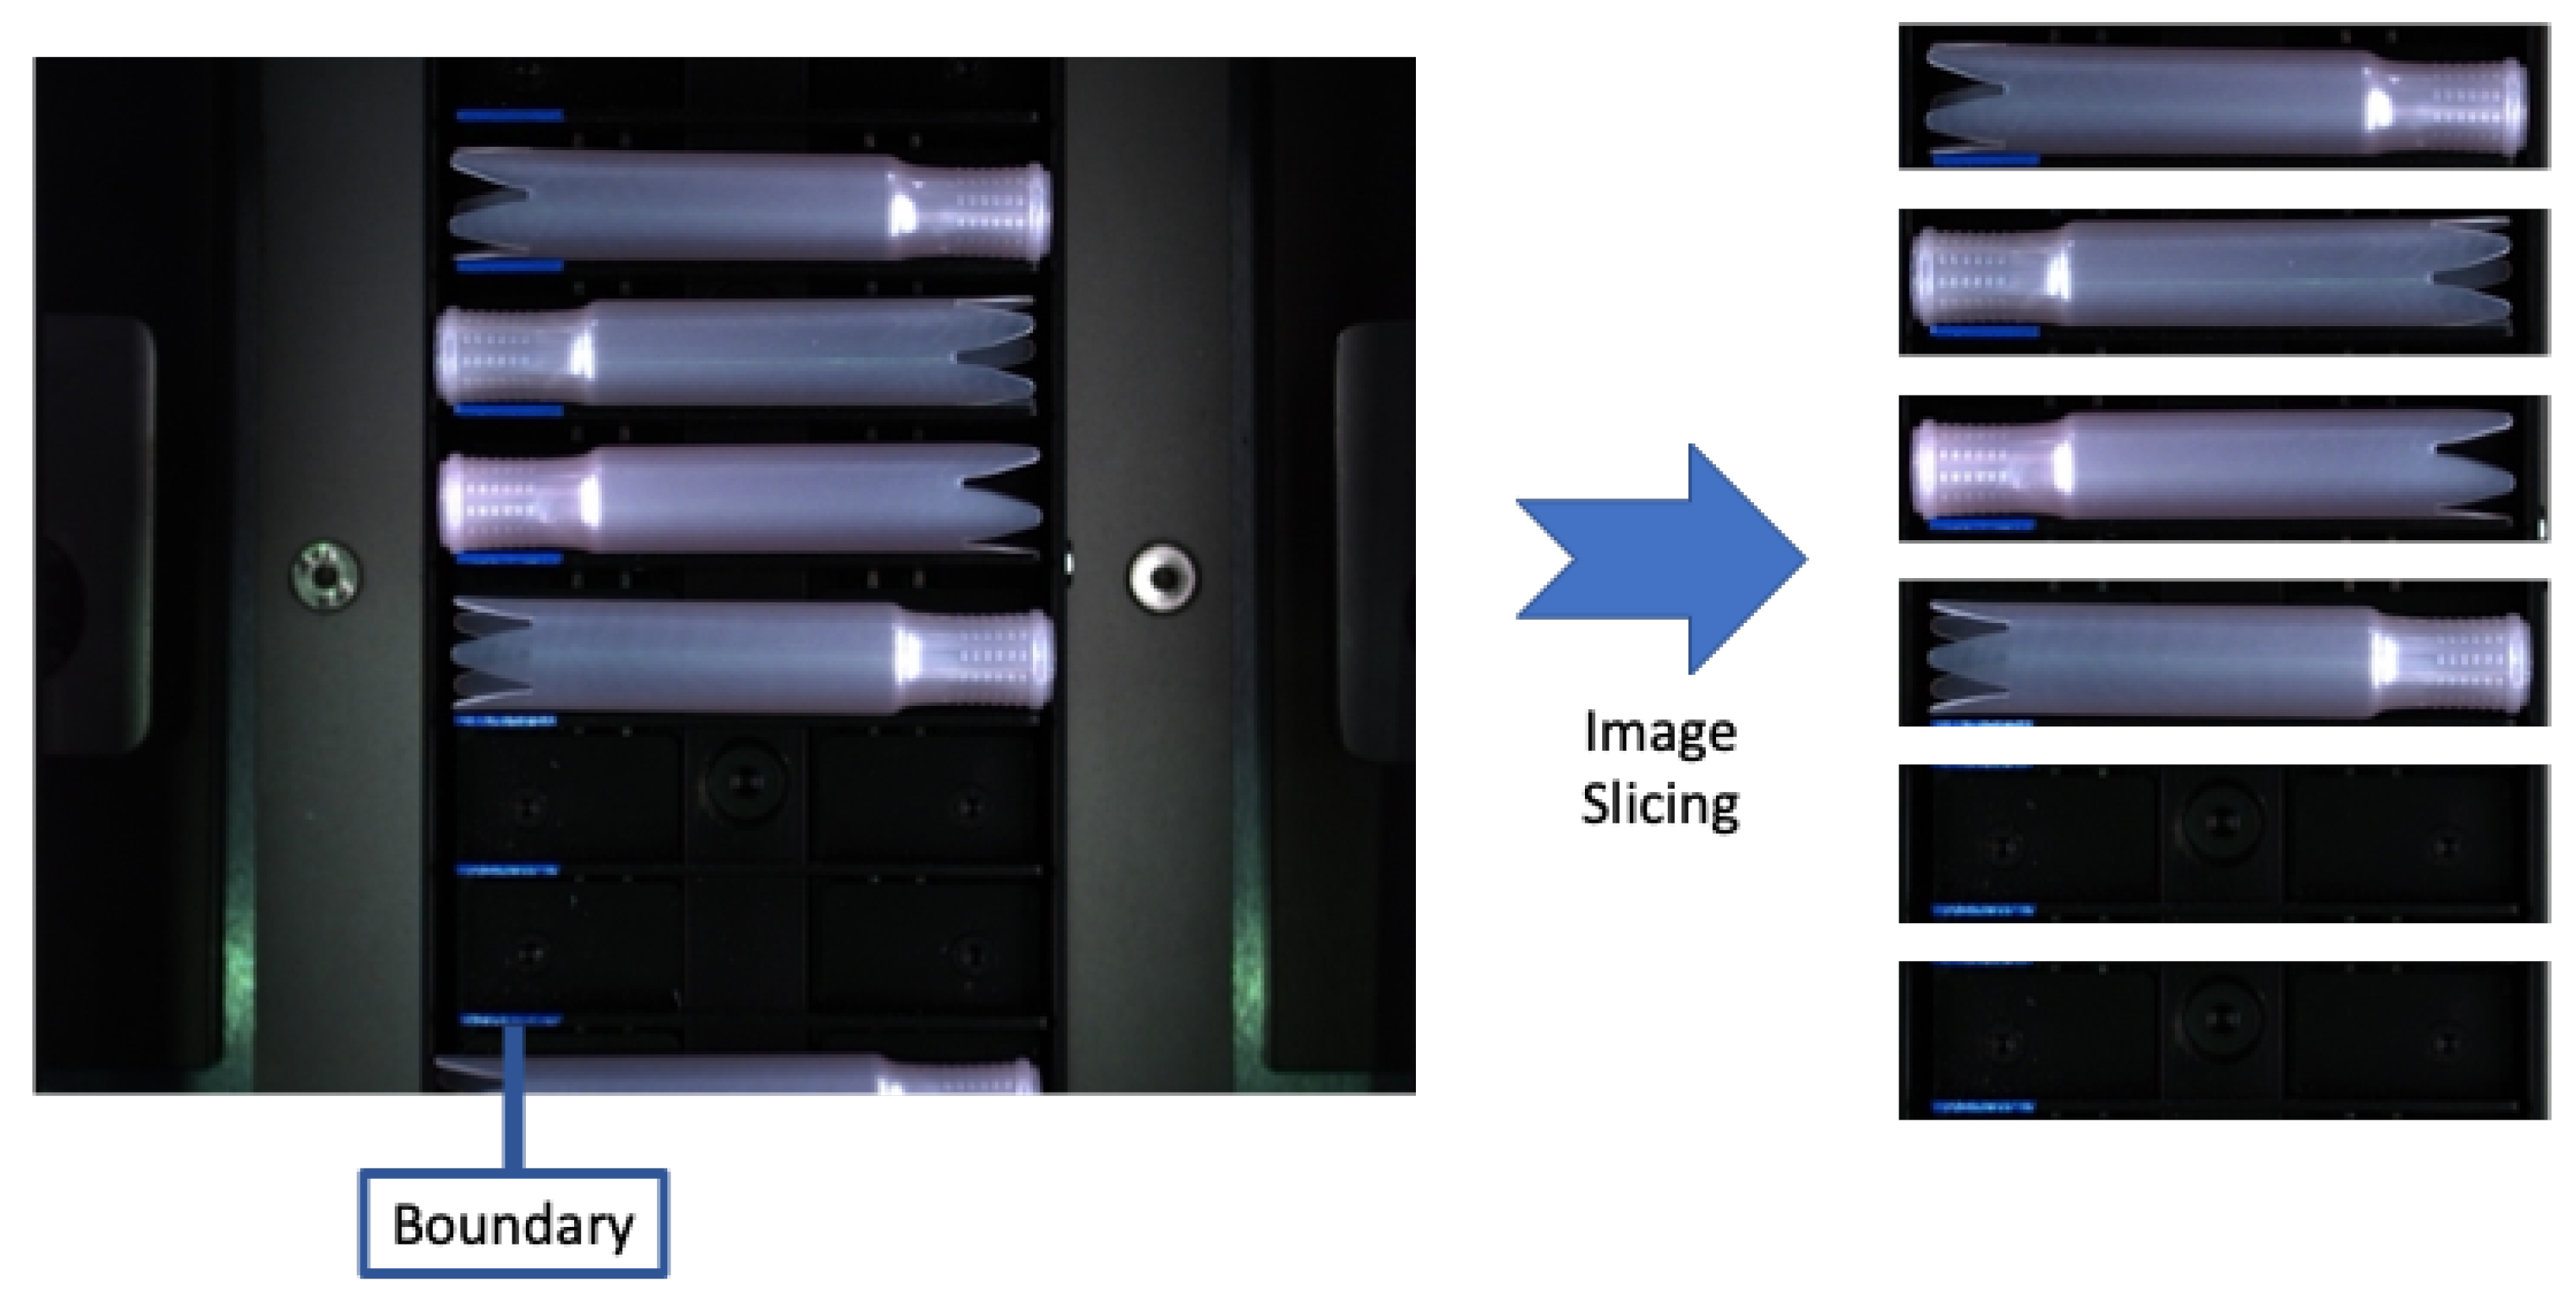
  • Data acquisition of the rolling applicators by the vision camera.
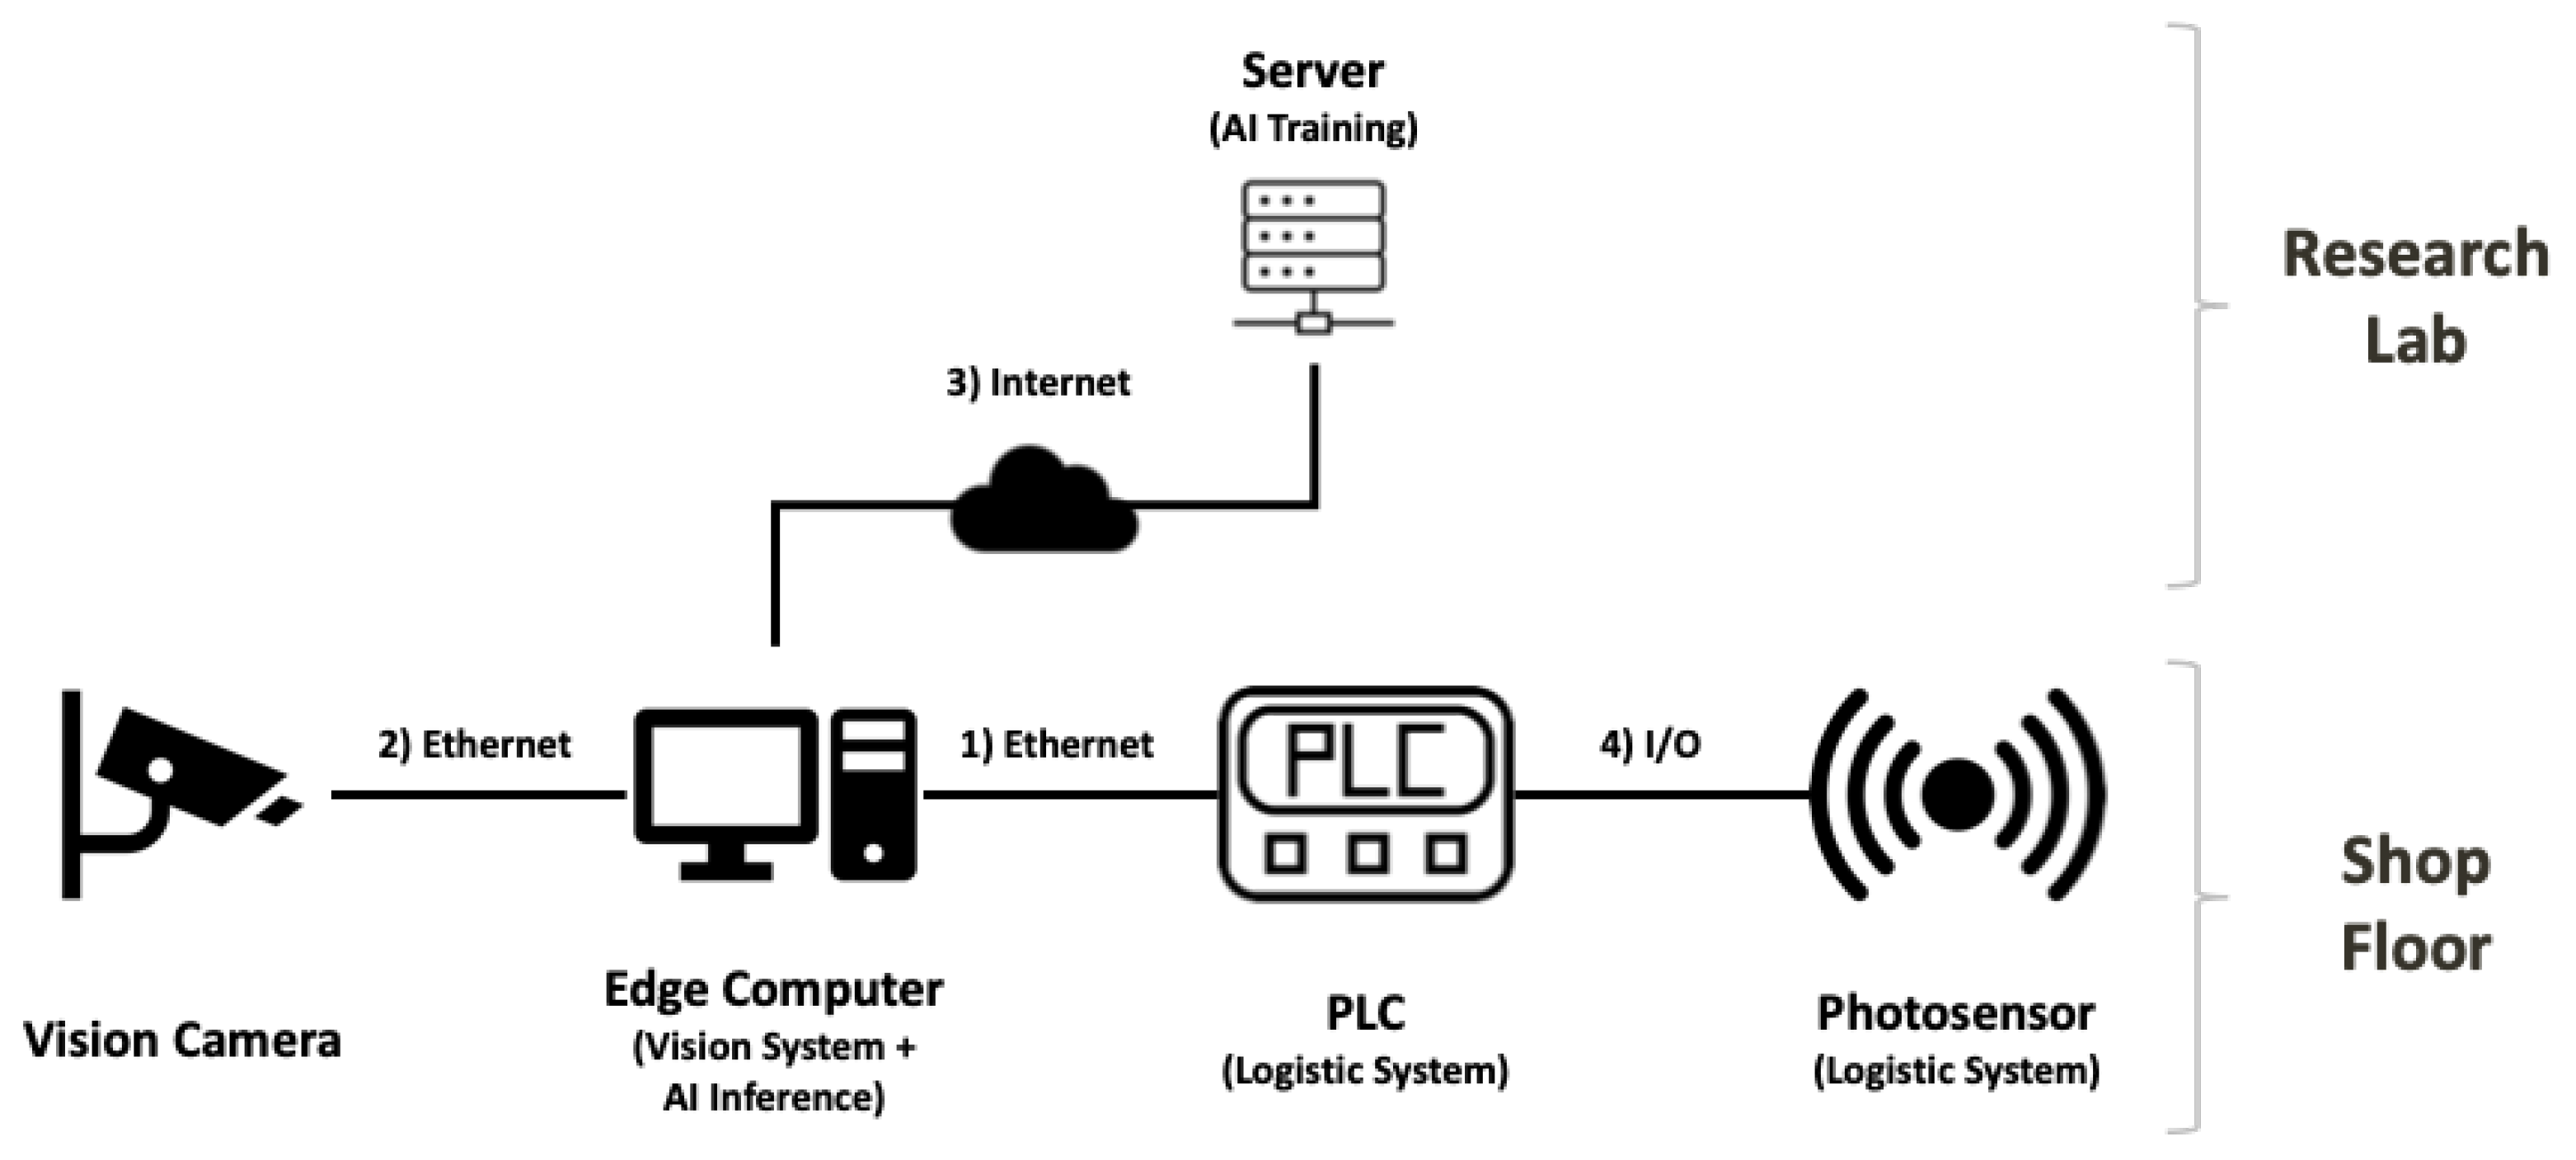
  • Data transfer from the vision camera to the ECD for AI inference.
  • Data pre-processing and defect inspection by AI.
  • Position values of the trays captured by the photosensors are sent to the PLC.
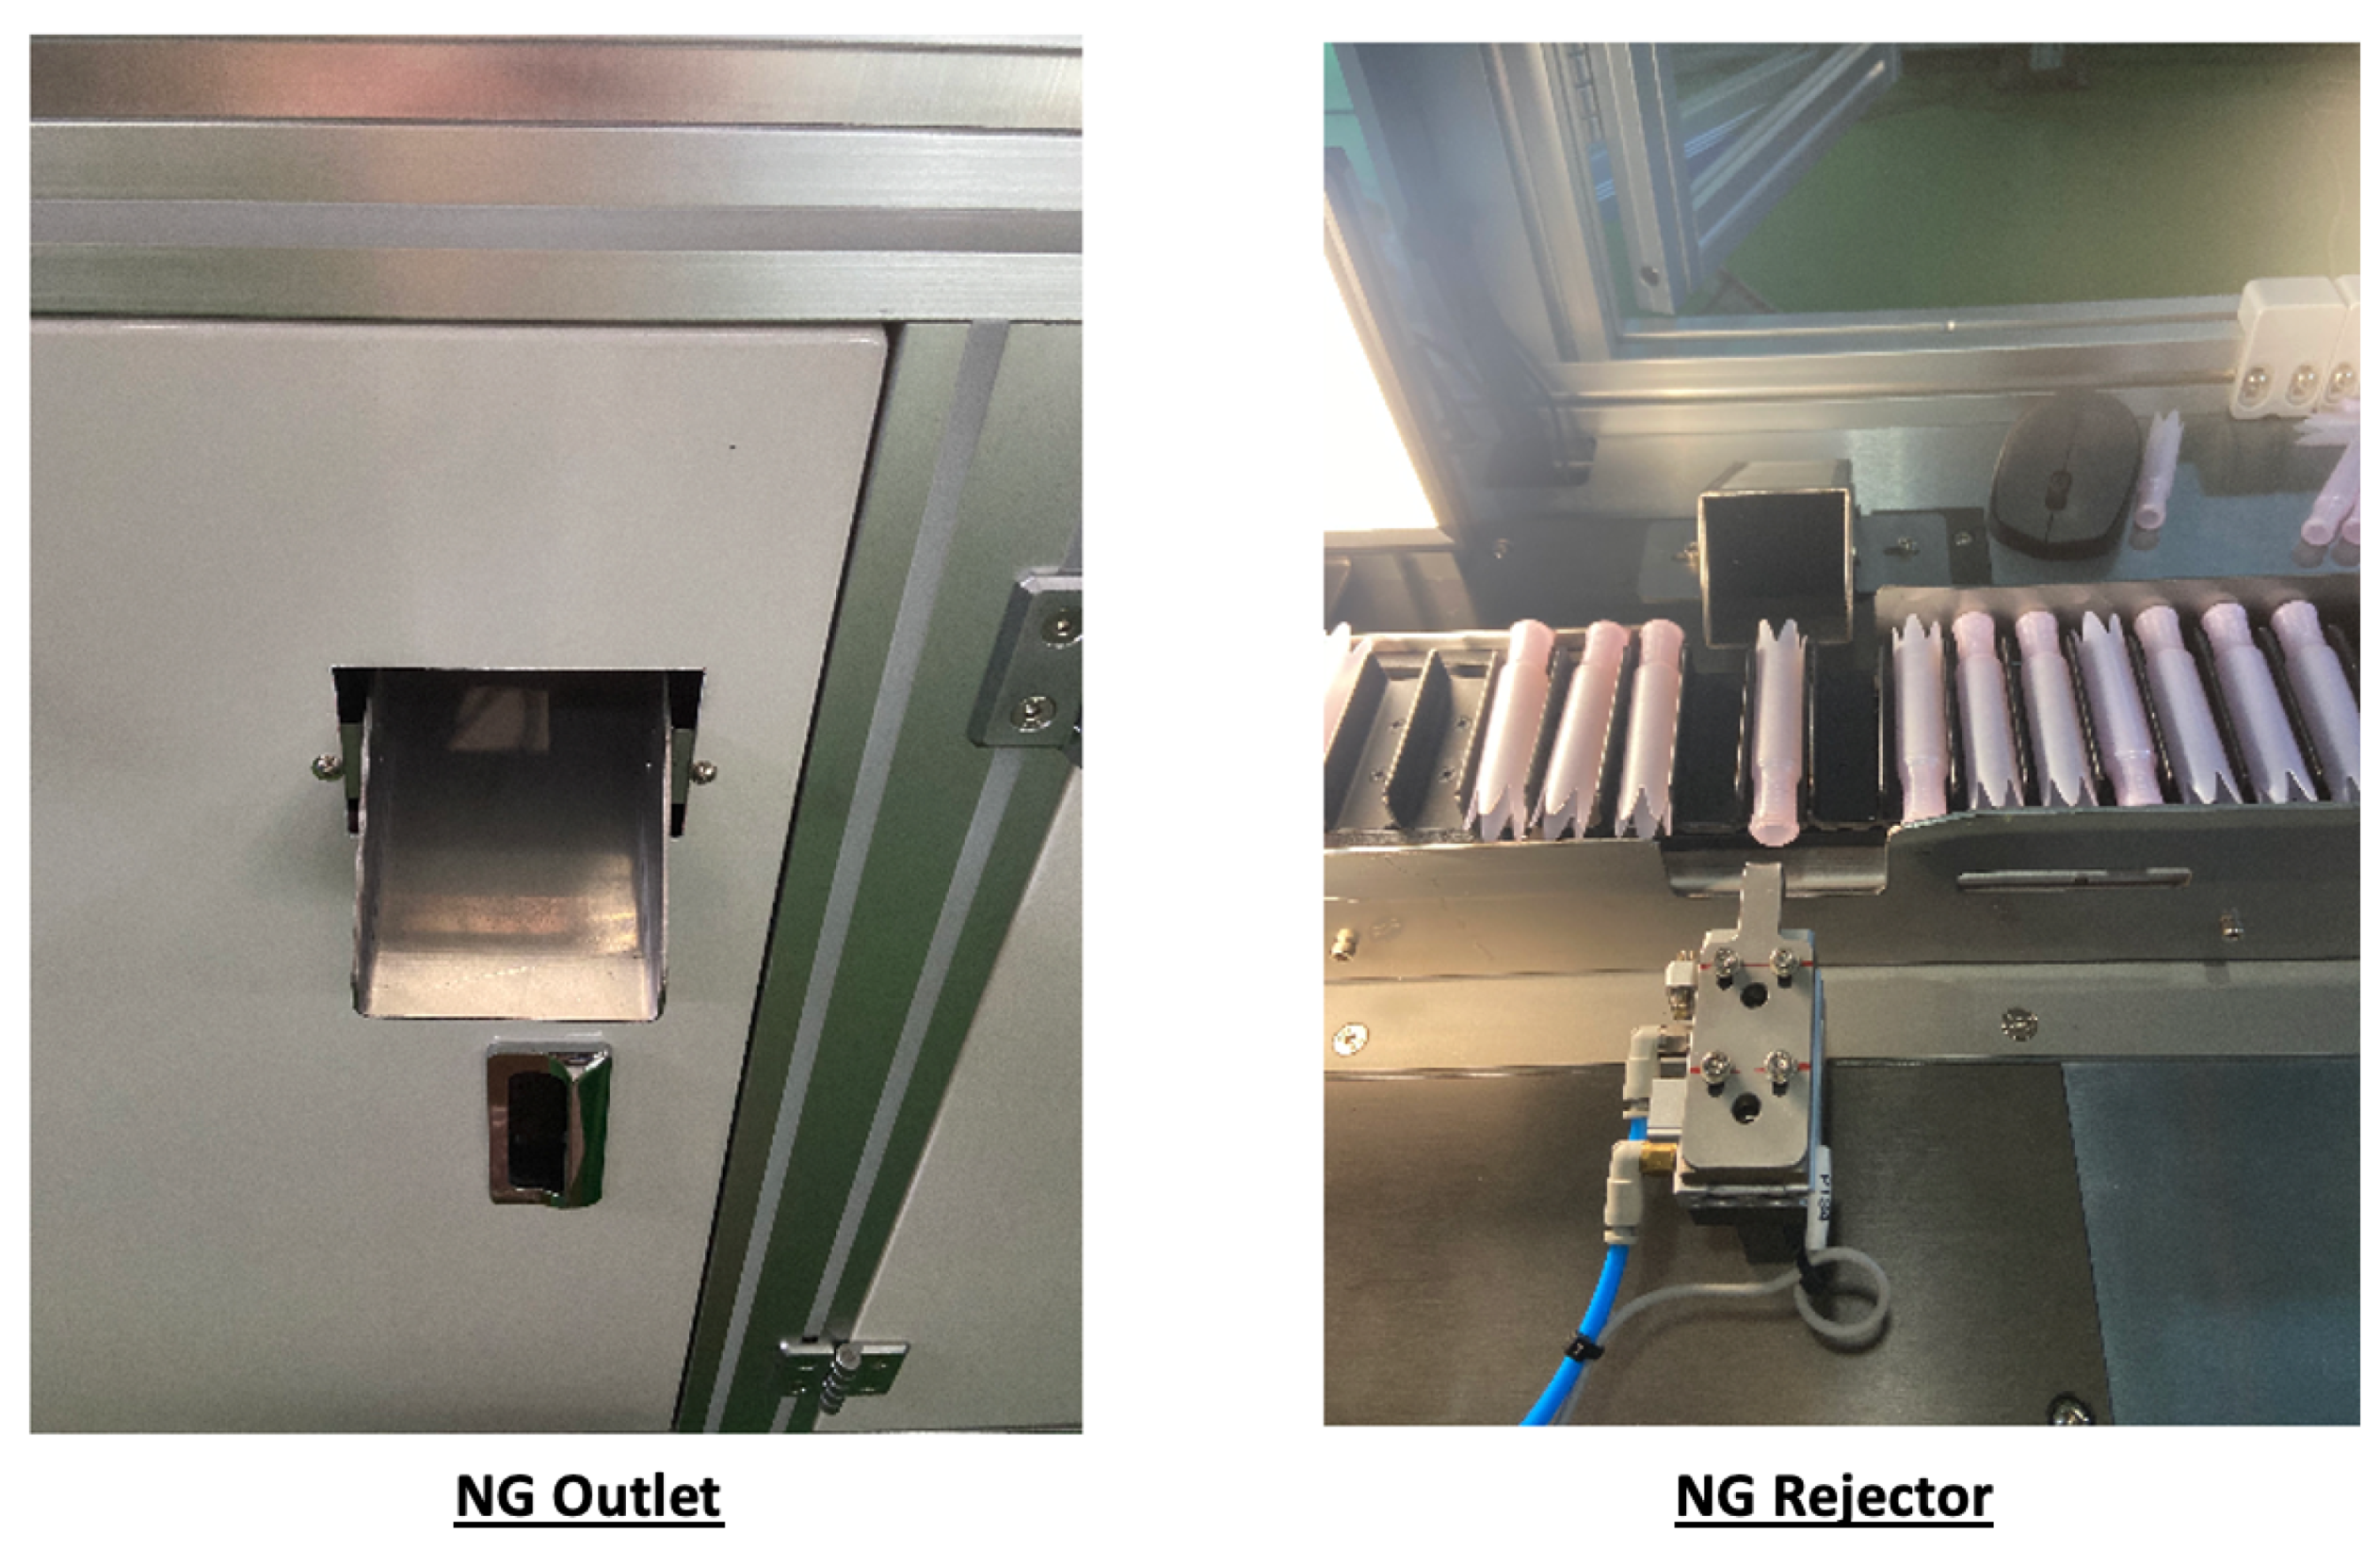
  • Discharge of the defective products by the NG rejector.
The network configuration of the system is presented in Figure 9. It consists of four networks for the communication between (1) PLC and ECD, (2) ECD and the vision camera, (3) ECD and the server, and (4) PLC and the photosensors. Since the maker of the applied PLC, LS Electric, does not provide the protocol for Python language, we created a new protocol called pylsprotocol, which can be downloaded with a single command, and it provides read and write functions for both discrete and continuous data. The protocol is publicly accessible online (at https://pypi.org/project/pylsprotocol, accessed on 20 October 2021). For the connection between the ECD and the vision system, we used the Software Development Kit (SDK) and Python Package (PP) provided by the vision maker, Lucid. The ECD is connected with the server for AI training via the internet. The photosensors for perceiving the tray’s position value are connected to PLC with Input/Output (I/O) communication.
The hardware and software specifications of the ECD for AI inference and the server for AI training are as described in Table 1.

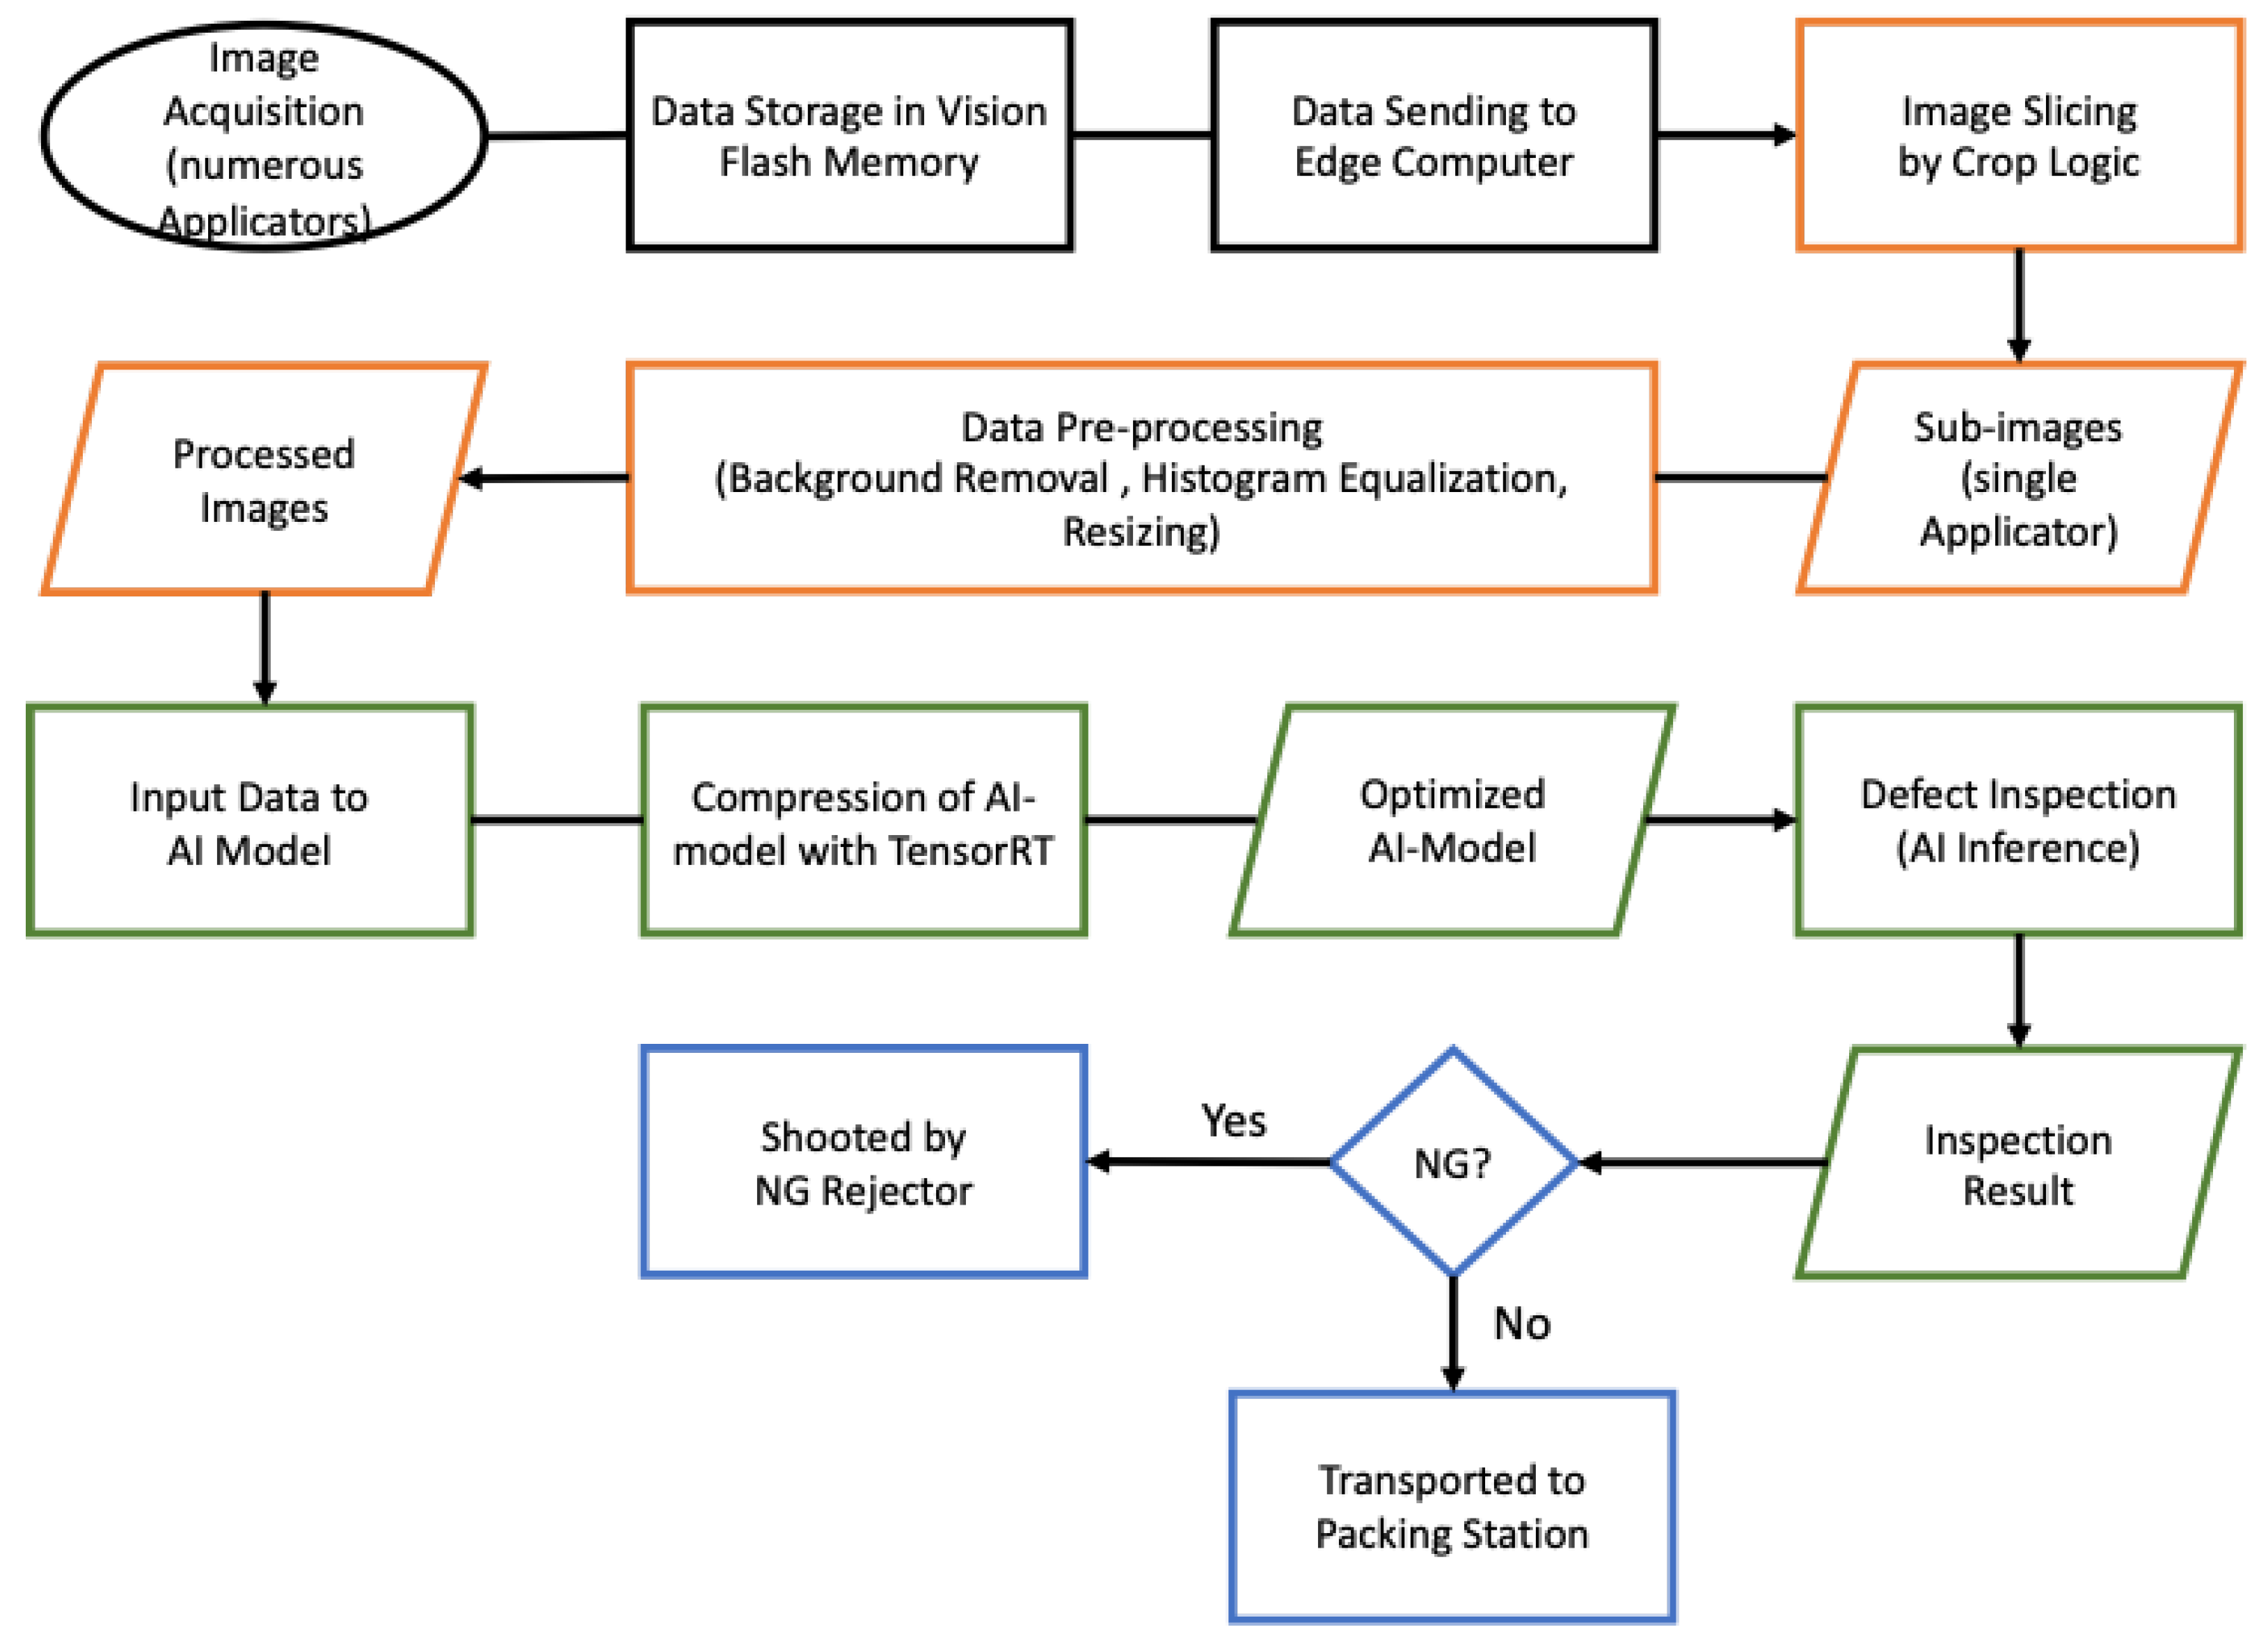
3.2. Inspection Mechanism

The inspection algorithm of the system is presented in Figure 10. The whole inspection process can be divided into four steps as follows:
  • Data Acquisition (in black)
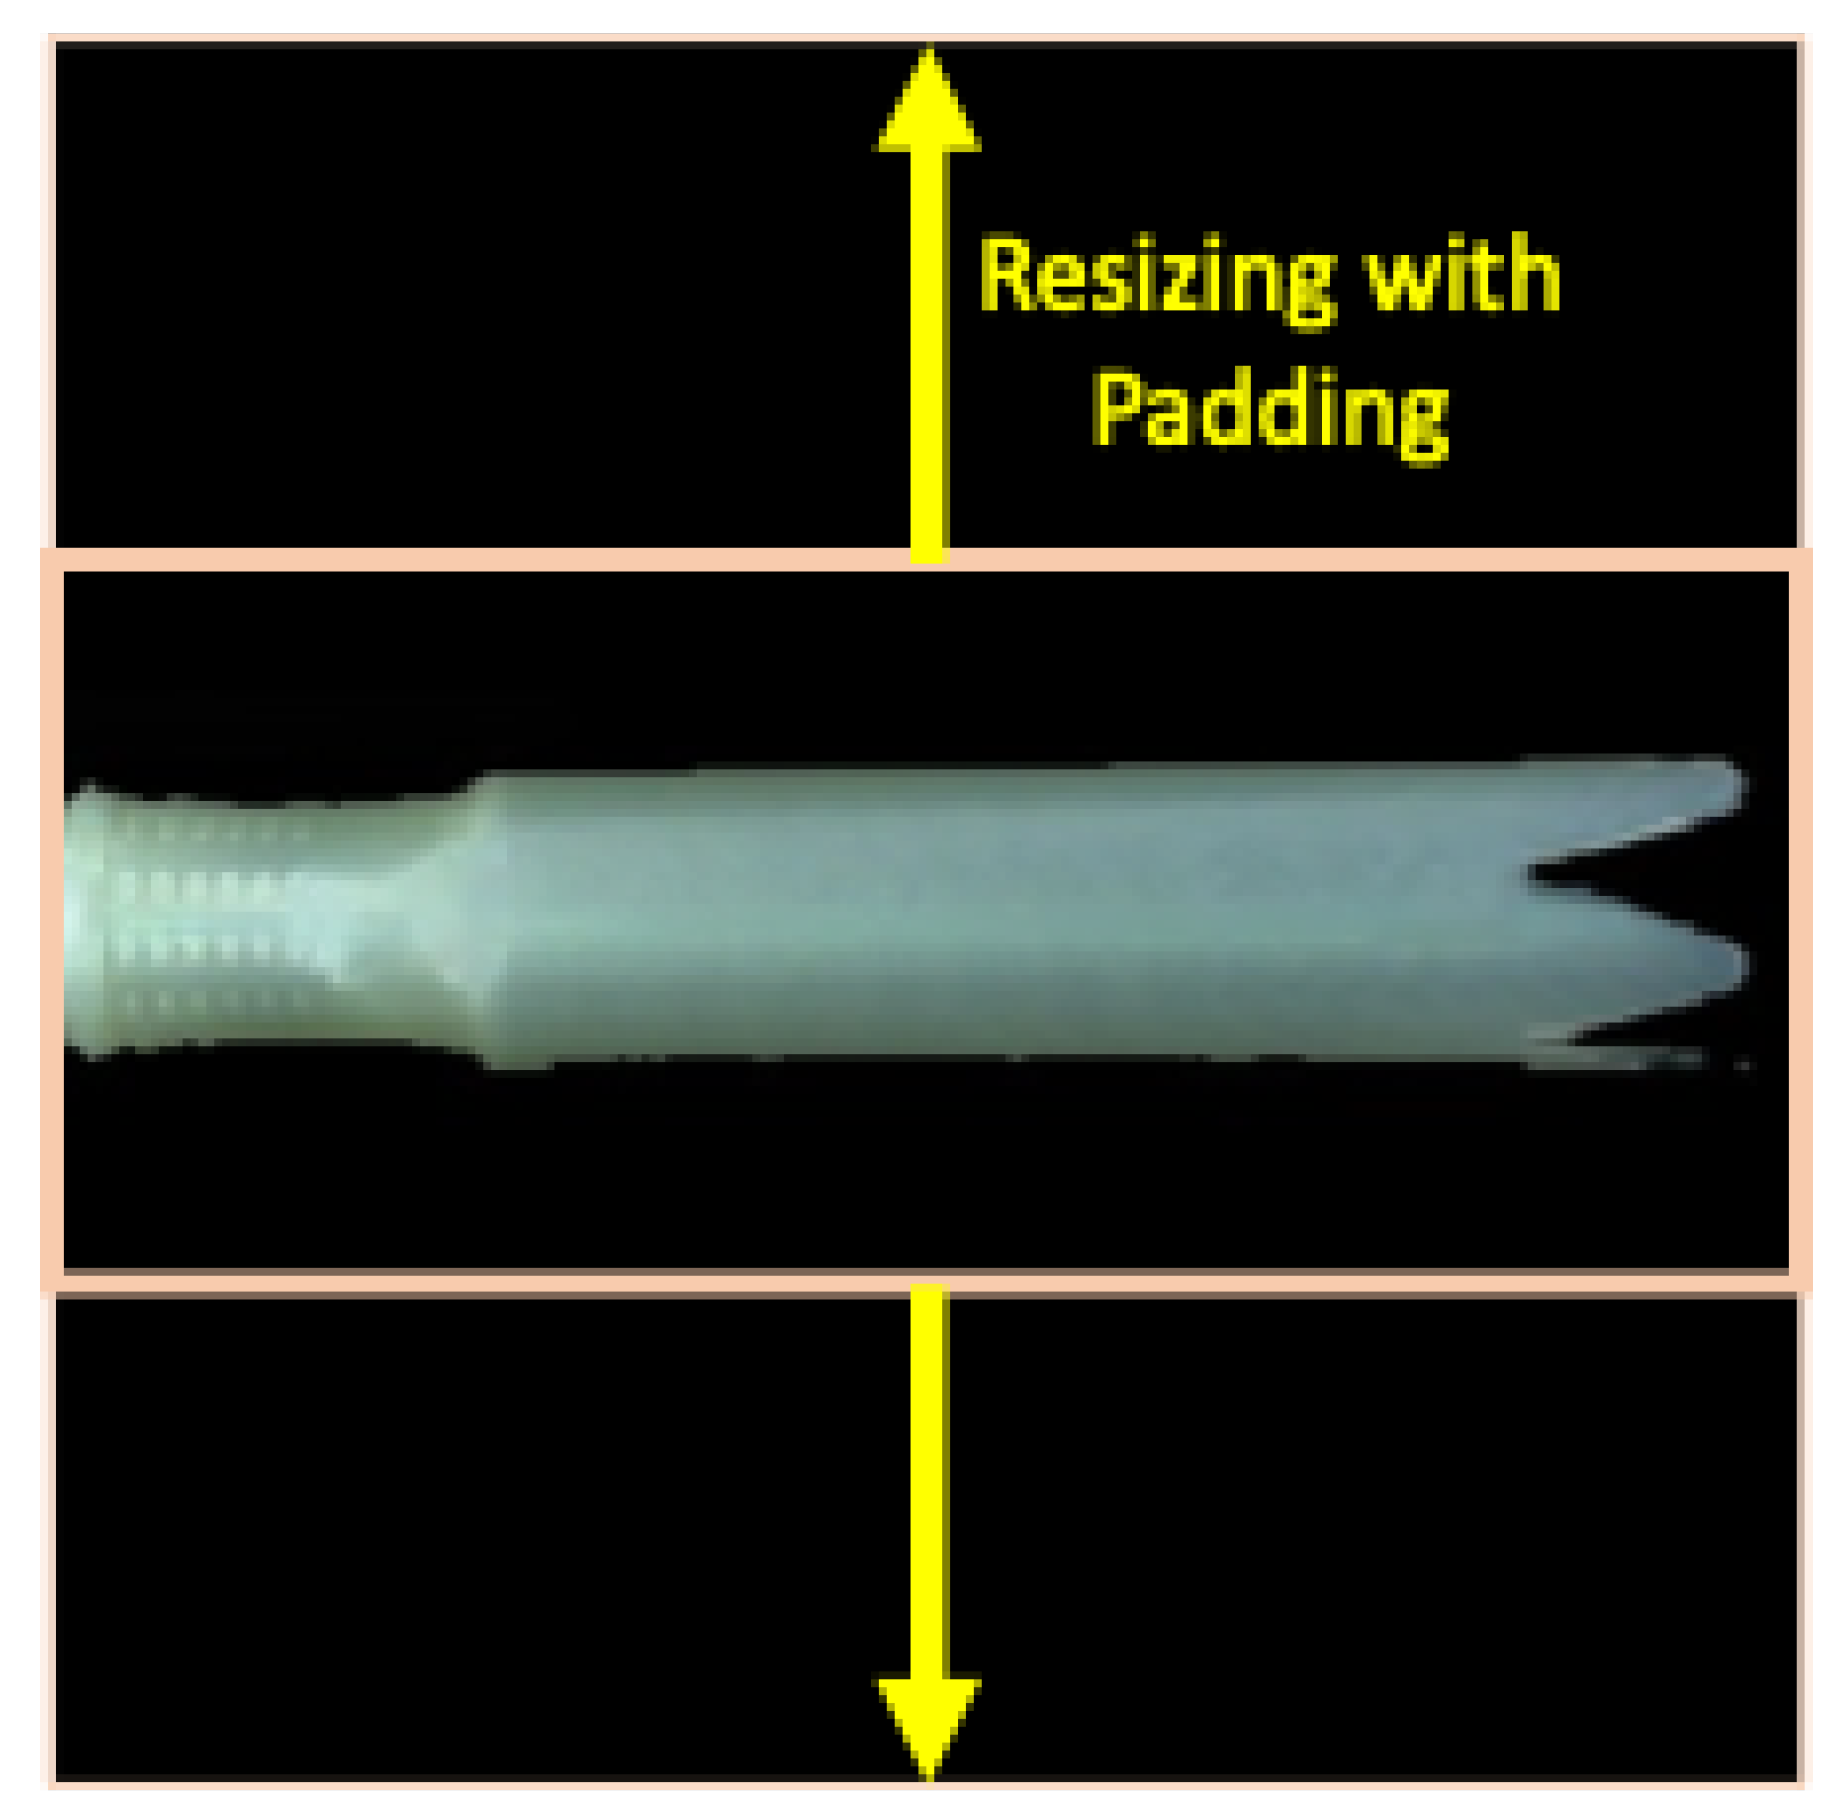
  • Data Pre-Processing (orange)
  • Model Optimization and Inference (green)
  • Machine Control (blue)
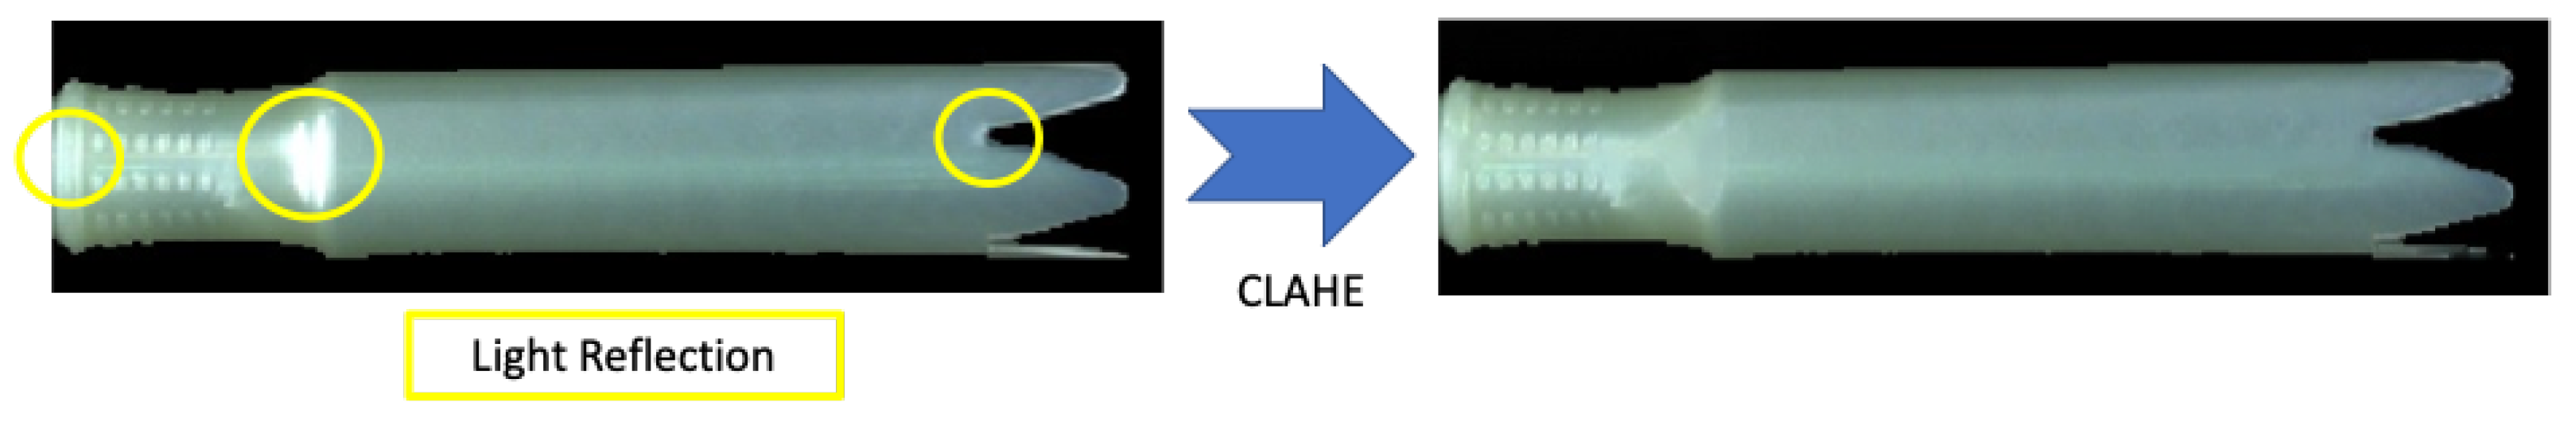
Data Acquisition. To create the dataset for training and validating the AI models, we installed and operated the system on site, as shown in Figure 11.
Unlike the inspection system that Tatzer et al. [10] proposed that conveys the product with the wire hook, as explained in Section 2, our system carries the tampon applicator in trays. As shown in Figure 12, a friction plate is installed in the middle of the rail to enable the applicator to roll with the friction force. The camera takes six images of the rolling applicator. The conveyor was designed to have each applicator roll twice during the inspection interval.
We used a web-based image annotation tool, COCO annotator, to create the annotation data in COCO format. The defects are labeled with both the bounding boxes and masks with the support of the skilled inspectors. Figure 13 presents an example of data annotation with the image segmentation masks.
Data Pre-Processing. For AI model training, we augmented data with Random Crop, and Flip Rotate methods. We did not consider adjusting the brightness, as is commonly used for data augmentation, because the factory has constant illumination by blocking light from outside. In addition, we divided the acquired images into several sub-images for inspecting a single applicator, because the height of the vision camera was set to a photography maximum of six applicators simultaneously. For this purpose, we marked a blue boundary line on the tray conveyor and developed a crop logic for image slicing, as shown in Figure 14. The crop logic finds a slicing boundary by calculating the difference between blue and red values of RGB from each pixel.
During the trial test on site, we have experienced some malfunctions of the object-detection model. For example, the boundary for image slicing, the conveyor in the background, and the reflected light on the product were detected as defects, as shown in Figure 15.
To solve the Type II error (False-Negative: FN), we used the data-centric approach, which stresses the significance of data quality over model architecture and tuning. We have applied three different data pre-processing techniques to improve data quality.
For the light reflection problem, we used Contrast Limited Adaptive Histogram Equalization (CLAHE), a derivative of Adaptive Histogram Equalization (AHE), that uses a contrast limit to resolve the noise amplification. The light reflection can cause Type I errors as well because the model cannot detect the defects in the reflected area. The Type I error, also known as the producer’s risk, is critical for the manufacturer, because the False-Positive (FP) means that the consumers are exposed to the danger of using defective products. By modifying the tile grid size, we adjusted the intensity of histogram equalization. The pseudo-code of CLAHE is described in Algorithm 1, and the result after reflection removal is shown in Figure 16.
Algorithm 1: CLAHE.
Input: Original Image I;
 1. Resizing I to M x M; Decompose I→ (n) tiles; (n) ← M x M m x m ;
 2.  H n ← histogram(n); // histogram of a m x m tile;
 3. Clip limit: C L N C L x N a v g ; // N a v g N x x N y N g r a y ; // N g r a y → number of gray levels in the tile; // N x , N y → number of pixels in the x, y dimensions of a tile; // N c l ← 0.002 // normalized contrast limit;
 4. Clipping of H n using C L ; // For gray levels greater than C L ; let N c l pixels are clipped;
 5.  N c l N g r a y N c p pixels → distribution over the remaining pixels; // contrast limited histogram of each tile after pixel distribution;
 6. CLAHE(n) ← Equalization of contrast limited tile histogram using (1);
 7.  I c ← bilinear interpolation of CLAHE processed n tiles; // combining neighborhood tiles
return CLAHE processed Image I c ;
The background, such as the conveyor and blue boundary for image slicing, were occasionally detected as defects, which harms the accuracy of the inspection model. To improve the precision of the model, we removed the background by extracting the object’s outline using the contour technique. The result of the Background Removal (BR) is presented in Figure 17.
After image slicing, the image was reduced to 80 × 320 pixels, which is small enough to deform the feature, deteriorating the accuracy and sensitivity. Additionally, the applied object-detection model, YOLOv4, requires a square image. To reduce the possible feature deformation and for applying YOLOv4 we resized the image to 320 × 320 pixels with padding. The result of resizing is presented in Figure 18.
Model Optimization and AI Inference. For defect inspection, we used YOLOv4 and YOLACT, the state-of-the-art algorithms for object detection and instance segmentation, respectively. For YOLACT, we considered two different backbone networks, ResNet-50, and ResNet-101. The feature extractor was fixed for FPN. To accelerate the inference time of instance segmentation, which is a critical success factor for industrial applications that demand an inspection cycle time of 0.5 s per product, we used TensorRT, the SDK for high-performance DL inference. By applying the optimizers and runtime engines of TensorRT, we optimized the feature backbone, FPN, Protonet, and prediction head separately, as shown in Figure 19.
With the image segmentation model (YOLACT), we did not experience any unusual inspection errors as in the object-detection model (YOLOv4). However, the instance-segmentation model did now work well enough to meet the industrial requirement. The manufacturer wanted to detect defects whose diameter was bigger than 0.5 mm. To meet the quality standard, the inspection model needed to predict the defect size more precisely than in the trial test, whose results are presented in Figure 20.
Machine Control. The inspection result is sent to PLC, which stores the position value of the tray captured by the photosensor in the queue. An NG rejector discharges the defective products as soon as it receives the signal from PLC. The NG rejector, a pneumatic piston, is presented in Figure 21.

4. Experimental Setup

We have conducted the experiments to analyze the effects of the data pre-processing on the inspection errors of the object-detection model.

4.1. Metrics and Hypotheses

Metrics. We evaluated the image at two different levels. Defect inspection is a typical classification task; hence the model had to be tested at the image level. The object detection based on the bounding box also had to be analyzed to evaluate the model.
Accuracy, the common metric for evaluating classification models, is the ratio of correct predictions of the model to the total number of predictions. However, Accuracy had to be interpreted very carefully, because we had a class-imbalanced dataset. The equation of Accuracy is as follows:
A c c u r a c y = T P + T N T P + T N + F P + F N
To analyze the performance of different approaches, we calculated Average Precision (AP) for the bounding box. The AP is one of the most powerful evaluation metrics for object detection. It is calculated from the area under the Precision-Recall (PR) curve. The equation of AP is as follows:
A P = 0 1 p ( r ) d r
AP is often used with Intersection over Union (IoU), which measures the overlap between the predicted area and the ground truth, depicted as follows:
I o U = Area of Overlap Area of Union
Generally, IoU has a number that indicates the threshold for validation. If IoU has a threshold of 0.5, it means that the model’s prediction is validated as correct if the overlap between the predicted area and the ground truth is over 50%.
Precision is the ratio of the number of correct decisions of the classifier to the number of all detections. The equation of Precision is as follows:
P r e c i s i o n = T P T P + F P
Recall is the ratio of the correct decisions of the model to all ground truths. The metric, also known as Sensitivity, can be expressed as follows:
R e c a l l ( S e n s i t i v i t y ) = T P T P + F N
The F1-score is the harmonic mean of Precision and Recall, and can be expressed as follows:
F 1 s c o r e = 2 P r e c i s i o n R e c a l l P r e c i s i o n + R e c a l l
Hypotheses. We examined mainly three hypotheses about the correlation between the data pre-processing methods and the model performance. The hypotheses are as follows:
Hypothesis 1.
CLAHE will increase Recall at the image level.
After applying CLAHE, the model should detect the hidden defects covered by reflected light better and so decrease FN.
Hypothesis 2.
Background removal will increase Precision at the bounding box level.
The misdetection of the conveyor and boundary line as a defect should be prevented by background removal, which then decreases FP.
Hypothesis 3.
CLAHE will increase Precision at the bounding box level.
The misdetection of reflected light as a defect should be prevented by removing light reflection, which decreases FP.

4.2. Dataset and Parameters
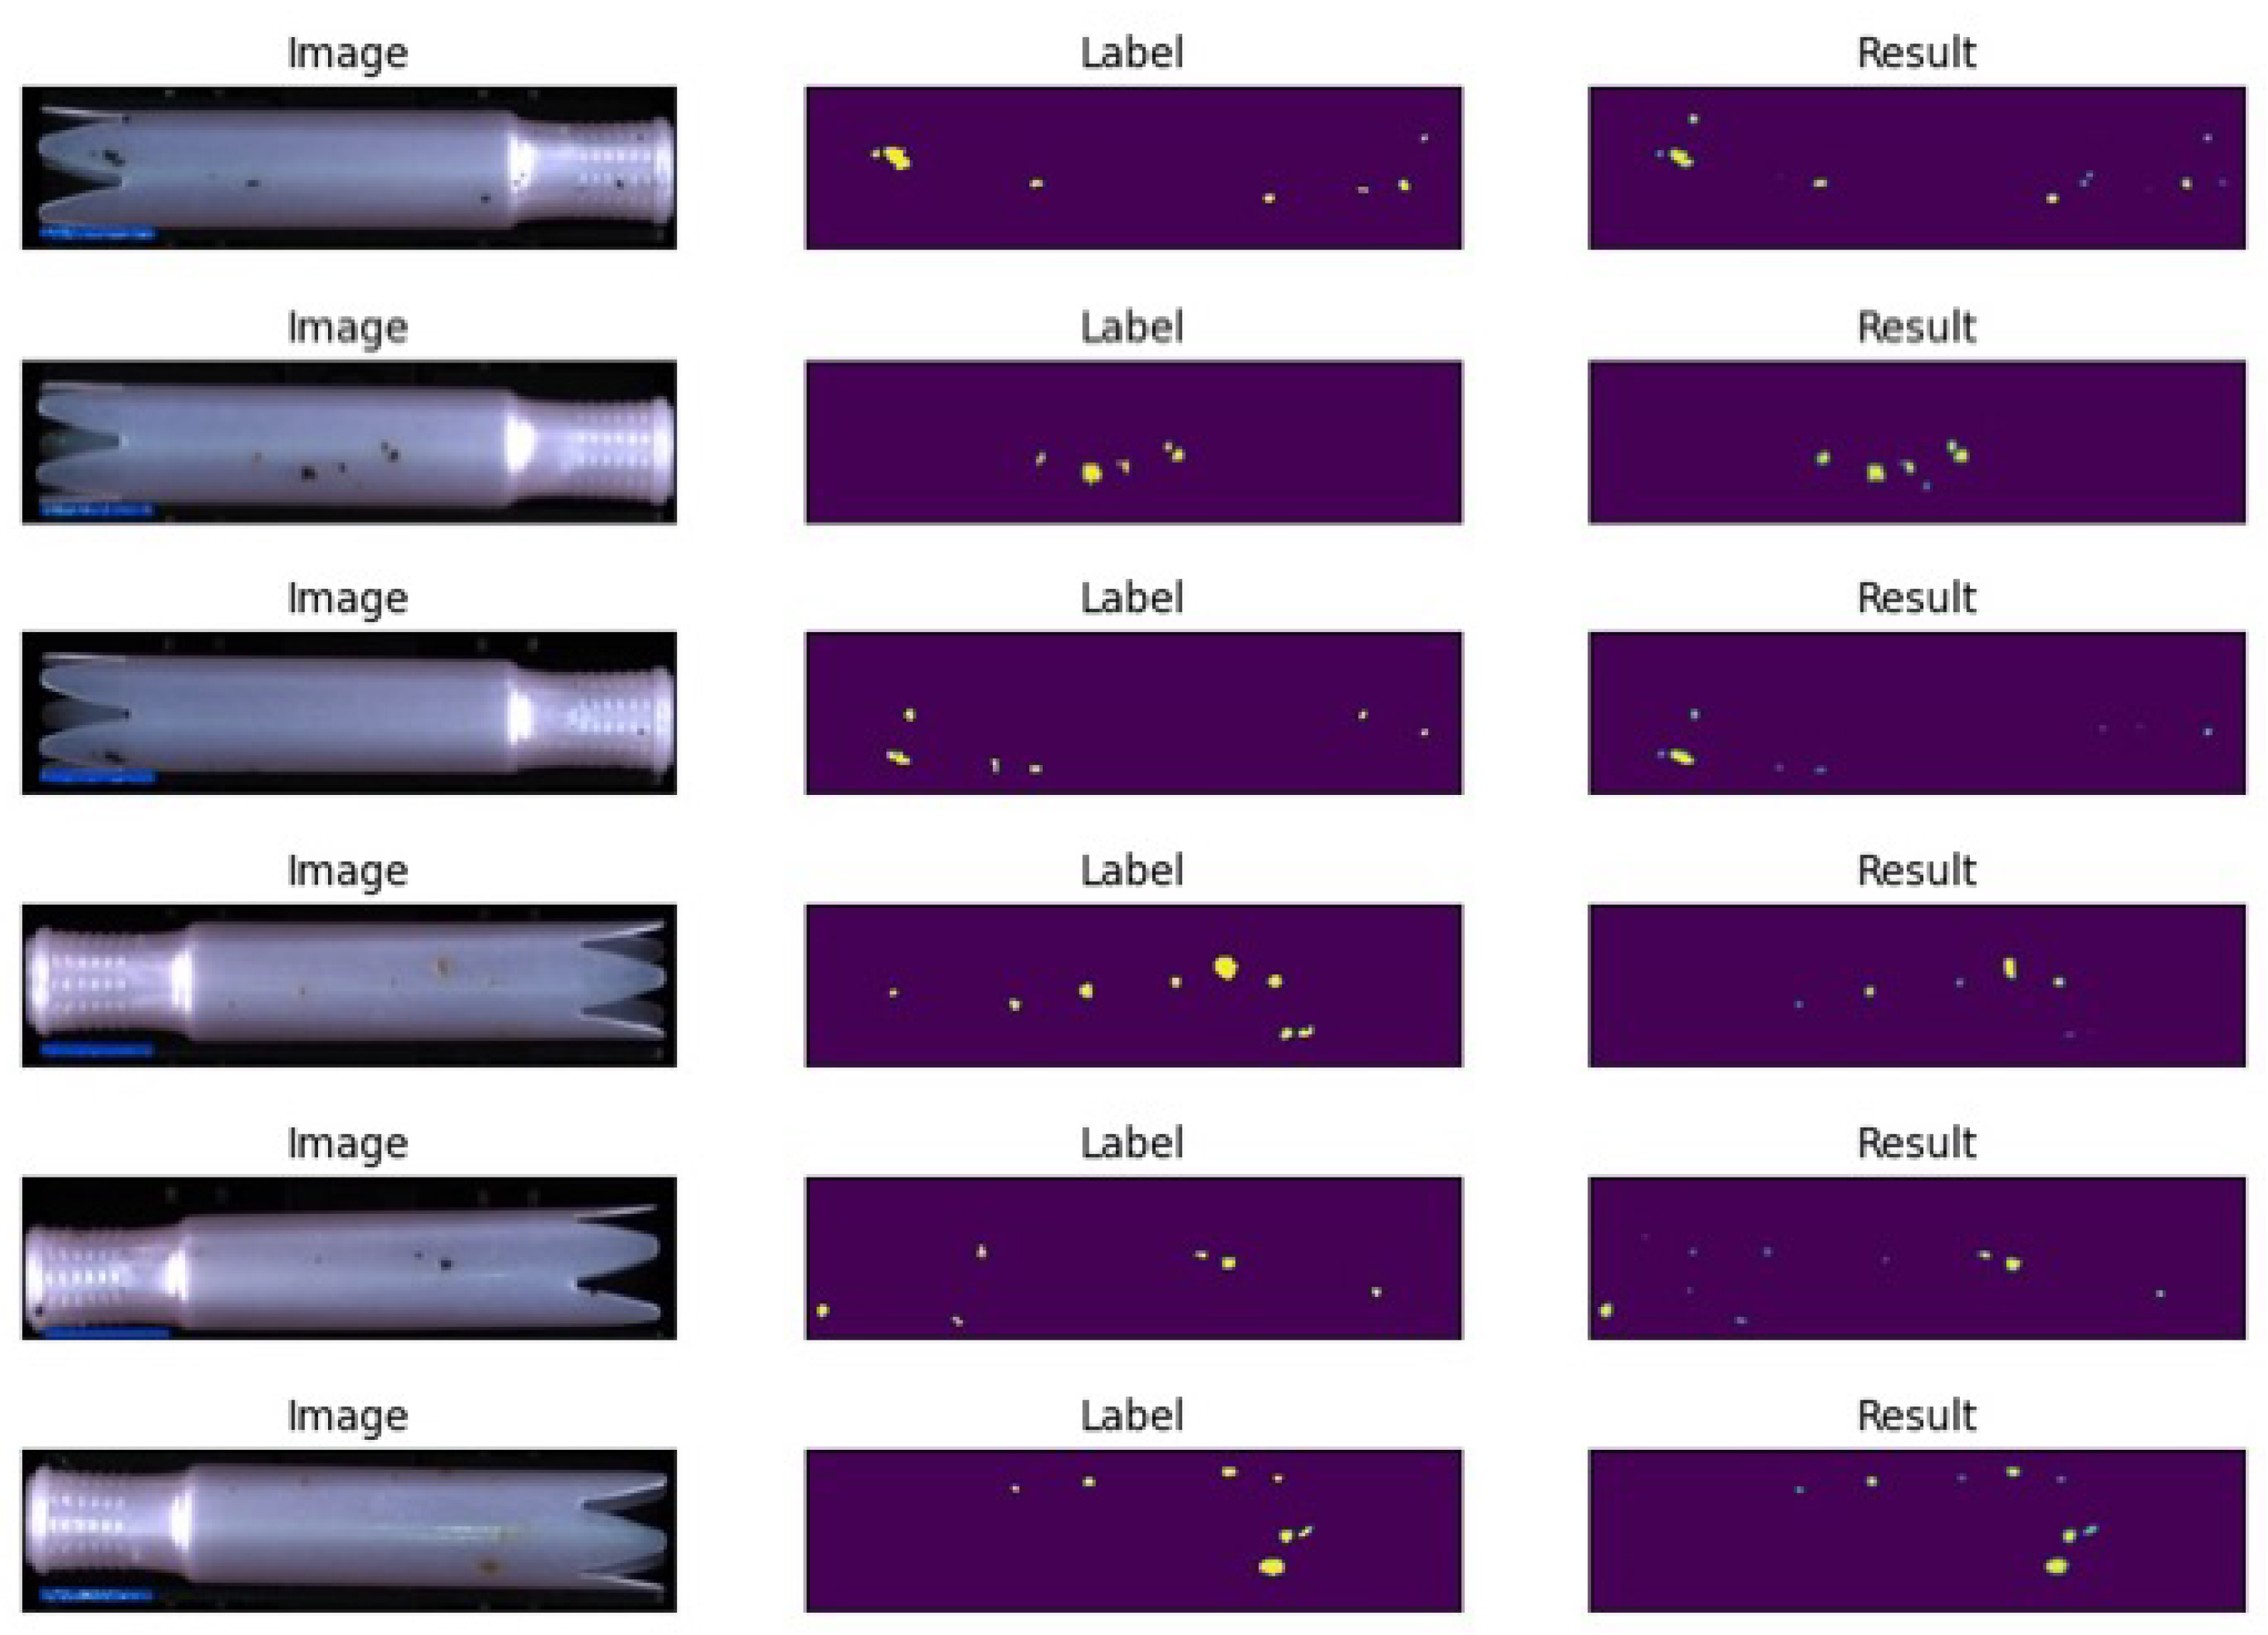
Dataset. Like other manufacturers, the applicator producer also has the class-imbalance problem and suffered from a relatively high defect rate (3–6%), not because of the frequent production of defectives, but because of massive production of defectives once they occurred. We received 150 defective products with burn marks and discoloration, which the manufacturer had gathered in two weeks. By operating the system, we have generated 908 sub-images that skilled inspectors have labeled. We used 800 and 108 images of the defective products for the training, and the test dataset, respectively. We adjusted the quantity of normal images intending to keep the ratio of defectives to OK at (6.5%) for the test. Table 2 depicts the distribution of data for the training and test.
We used NG images only for model training, because we defined the inspection as object-detection and instance-segmentation tasks. The models are supposed to learn the labeled defect as an object; so the images of regular applicators without labels did not play a role in the model training. The normal dataset was used only for analyzing the model at the image level.
Parameters. To find the effective combination of the data pre-processing techniques that effectively resolved the malfunction, we have trained YOLOv4. The network was trained and tested on the dataset. The training parameters are presented in Table 3.
We trained the network on CSPDarknet53, which partitions the feature map of the base layer into two parts and then combines them by means of a cross-stage hierarchy. We applied the Adaptive Moment Estimation (Adam) optimizer, and set the learning rate and beta values to the default as proposed by Kingma and Ba [45].

4.3. Results

We first analyzed the effect of the data pre-processing techniques at the image level, in which the model carries out the image classification task. The effects of the data pre-processing methods are presented in Table 4 and in Figure 22.
At the first look, it seems as if the data pre-processing techniques deteriorated the model’s performance, because both F1-score and Accuracy have fallen. However, the inclined metrics are driven by the sharp decrease of Precision caused by the increasing FP. The rise of FP indicates that the model tends to predict the image as defective even though it is OK in the ground truth class. The intriguing point is that CLAHE has slightly increased Recall by 0.1. At a closer look, we could find that the two false-negative cases, which are presented in Figure 23, were detected after we used CLAHE. These cases may support our Hypothesis 1, that CLAHE may improve the sensitivity of the inspection model.
The combination of BR and CLAHE worsened not only Precision but also Recall at the image level, perhaps because the data pre-processing methods distorted the images excessively.
The effects of the data pre-processing methods on the inspection model at the bounding box level are presented in Table 5.
The decrease of AP50 shows that the use of data pre-processing worsened the model’s overall performance. However, both BR and CLAHE have improved Precision by 0.06 and 0.04, respectively. The results may support our Hypotheses 2 and 3 that the data pre-processing methods may improve Precision by preventing misinspection. The point that BR has more effect on Precision than does CLAHE may reflect that there are more cases in which the model detects the conveyor and boundary line as defects than there are cases in which the model detects the reflected light. Figure 24 depicts some intriguing cases.
In the first case, the model detected one tiny fleck as a defect even though it was not labeled. Whether the fleck is a defect or not will vary depends on the inspectors. This case may alarm us that we should interpret the FP and Precision very carefully, and find out whether it relies on a model or ambiguous human decision in data annotation. The second case shows an example in which the combination of BR and CLAHE detects one burn mark that was neglected without the data pre-processing and BR. The third and last case also reveals the ambiguity of the human decision in data annotation. In both cases, the model interprets the fleck that were not labeled as defects, from which it is hard to tell that the model predicted incorrectly.

5. Discussion and Conclusions

After applying the inspection model with BR and CLAHE on site, we empirically confirmed that the malfunctions described in Section 3 were solved. Furthermore, we did not experience any degradation of inspection quality, even though there was a dramatic decrease in F1-score and Accuracy in the experiment, perhaps because the inspection of each applicator consists of the six sub-inspections. That is, six images are taken for each applicator, and if one of the six images is detected as NG, the whole applicator is rated as defective; even if the other five images are OK. Thus, the false inspection of the applicator is possible only if the model made mistakes for all six sub-inspections. Therefore, the probability of the wrong inspection is very low. Another explanation is that there is no actual degradation of the inspection, unlike the experimental results. The metrics are also exposed to human error, and it seems that the model even corrects the wrong decisions of people in some cases. This situation alerts AI practitioners that validating the model by using only the metrics may lead to a wrong conclusion. We will focus on the validation methods of the AI model for industrial applications in future research.
In this paper, we propose a DL-based inspection system for moving applicators with details about the system configuration and inspection mechanisms. During the trial test of the system on site, we have experienced some malfunctions in which the model detected the conveyor and light as defects. We used a data-centric approach to analyze the problem and to find solutions. Instead of improving the model network, we applied different data pre-processing techniques to overcome the malfunction. Based on the experiment with the generated dataset, we could find some experimental results that support the positive effect of the data pre-processing on inspection quality. However, we found some cases that revealed the limitation of metrics and that enlighten us on the importance of data consistency and the detailed analysis for the AI validation. In order to accurately assess the size of the defects, we are studying not only instance-segmentation models, such as YOLACT, but also semantic-segmentation models such as UNet++. Furthermore, we will also continue to study unsupervised learning models, which can solve the class-imbalance problem.

Author Contributions

Conceptualization, D.I., S.L. and F.S.; methodology, D.I., S.L. and H.L.; software, S.L.; validation, D.I. and S.L.; formal analysis, D.I.; investigation, D.I. and B.Y.; resources, D.I.; data curation, B.Y. and H.L.; writing—original draft preparation, D.I.; writing—review and editing, J.J.; visualization, D.I.; supervision, J.J.; project administration, D.I.; funding acquisition, J.J. All authors have read and agreed to the published version of the manuscript.

Funding

This research was funded by the MSIT (Ministry of Science and ICT), Korea, under the R&BD for Solving Regional Problems Program (2020-DD-RD-0323) supervised by the Innopolis.

Institutional Review Board Statement

Not applicable.

Informed Consent Statement

Not applicable.

Data Availability Statement

Data sharing not applicable.

Acknowledgments

This research was supported by the SungKyunKwan University and the BK21 FOUR (Graduate School Innovation) funded by the Ministry of Education (MOE, Korea) and National Research Foundation of Korea (NRF).

Conflicts of Interest

The authors declare no conflict of interest.

References

  1. Villalba-Diez, J.; Wellbrock, W.; Schmidt, D.; Gevers, R.; Ordieres-Meré, J.; Buchwitz, M. Deep learning for industrial computer vision quality control in the printing industry 4.0. Sensors 2019, 19, 3987. [Google Scholar] [CrossRef] [Green Version]
  2. Weimer, D.; Scholz-Reiter, B.; Shpitalni, M. Design of deep convolutional neural network architectures for automated feature extraction in industrial inspection. Manuf. Technol. 2016, 65, 417–420. [Google Scholar] [CrossRef]
  3. Liau, Y.; Ryu, K. Framework of Automated Inspection System for Real-time Injection Molding. In Proceedings of the 2017 Journal of Academic Conference of the Korean Society of Business Administration and Sciences, Yeosu, Korea, 26–29 April 2017. [Google Scholar]
  4. Liu, B.; Wu, S.; Zou, S. Automatic detection technology of surface defects on plastic products based on machine vision. In Proceedings of the 2010 International Conference on Mechanic Automation and Control Engineering (MACE2010), Wuhan, China, 26–28 June 2010. [Google Scholar]
  5. Czimmermann, T.; Ciuti, G.; Milazzo, M.; Chiurazzi, M.; Roccella, S.; Oddo, C.M. Visual-Based Defect Detection and Classification Approaches for Industrial Applications—A Survey. Sensors 2020, 20, 1459. [Google Scholar] [CrossRef] [PubMed] [Green Version]
  6. Scholz-Reiter, B.; Weimer, D.; Thamer, H. Automated surface inspection of cold-formed micro-parts. Cirp Ann.-Manuf. Technol. 2012, 61, 531–534. [Google Scholar] [CrossRef]
  7. Kumar, A. Computer-Vision-Based Fabric Defect Detection: A Survey. IEEE Trans. Ind. Electron. 2008, 55, 348–363. [Google Scholar] [CrossRef]
  8. Voulodimos, A.; Doulamis, N.; Doulamis, A.; Protopapadakis, E. Deep Learning for Computer Vision: A Brief Review. Comput. Intell. Neurosci. 2018, 2018, 7068349. [Google Scholar] [CrossRef]
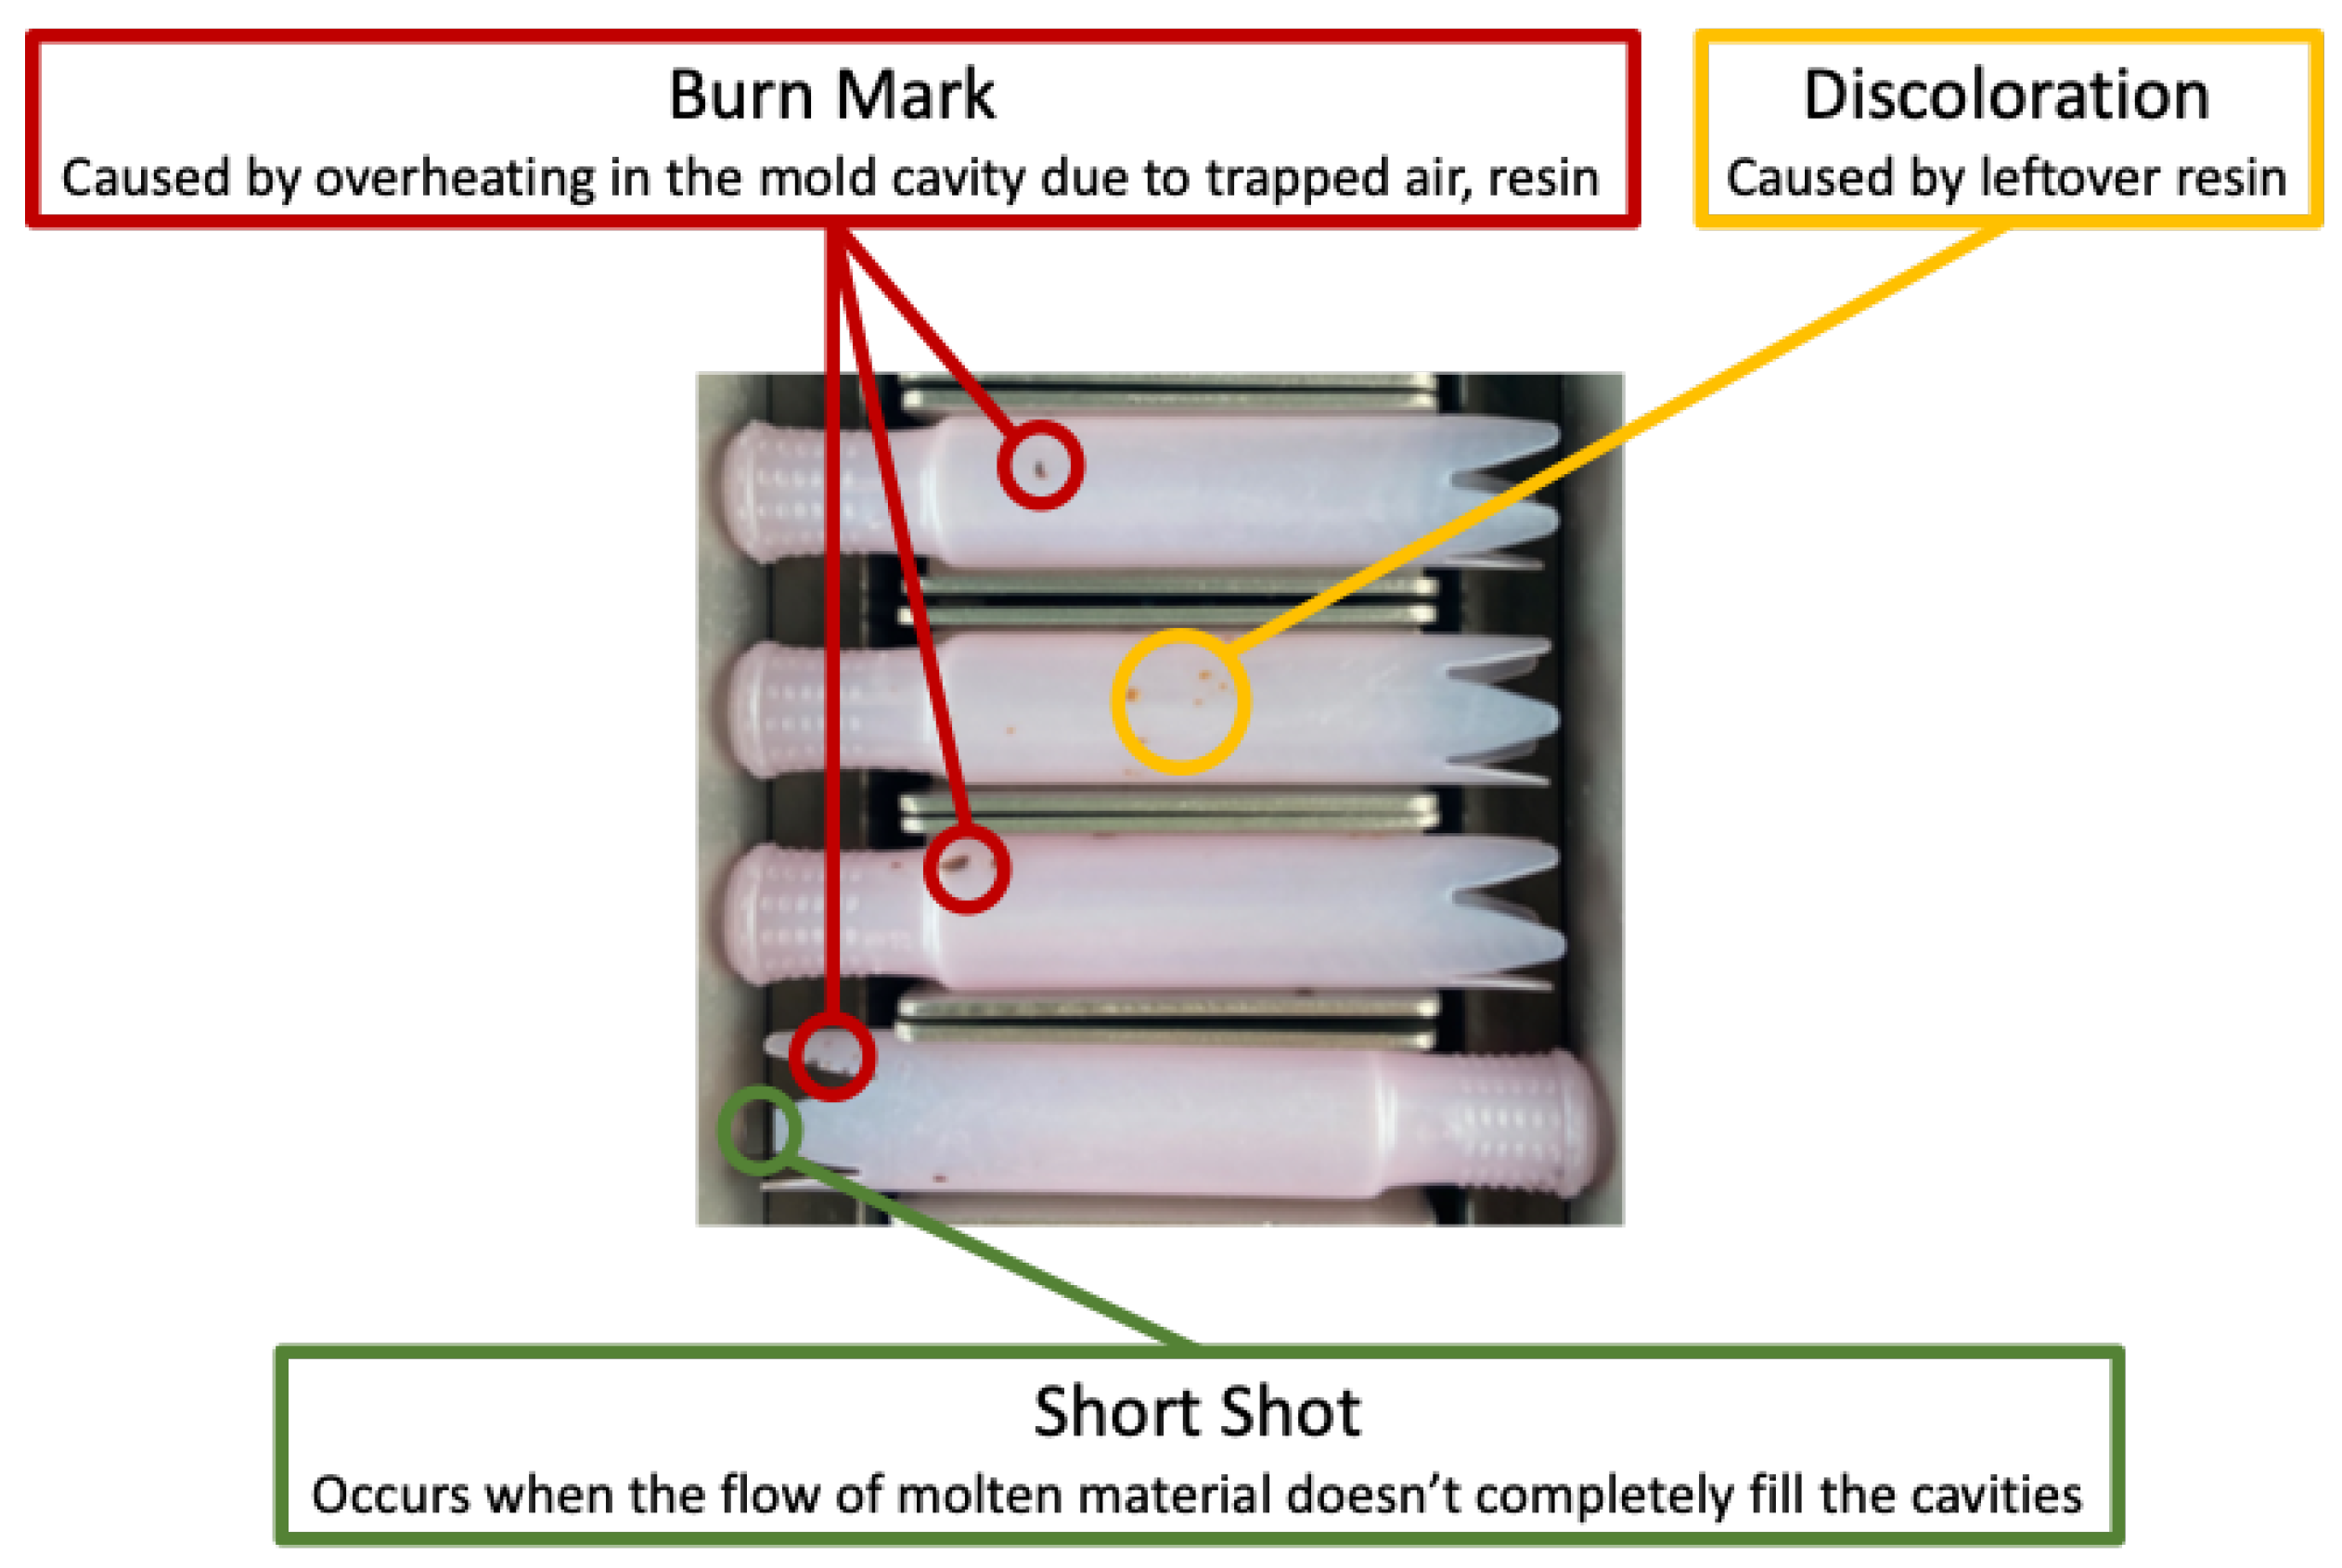
  9. 11 Injection Molding Defects and How to Prevent Them. Available online: https://www.intouch-quality.com/blog/injection-molding-defects-and-how-to-prevent (accessed on 22 August 2021).
  10. Tatzer, P.; Wögerer, C.; Panner, T.; Nittmann, G. Tampon Inspection Unit—Automation and Image Processing Application in an Industrial Production Process. IFAC Proc. 2004, 37, 395–400. [Google Scholar] [CrossRef]
  11. Xie, X. A review of recent advances in surface defect detection using texture analysis techniques. Electron. Lett. Comput. Vis. Image Anal 2008, 7, 1–22. [Google Scholar] [CrossRef] [Green Version]
  12. Wen, G.; Gao, Z.; Cai, Q.; Wang, Y.; Mei, S. A Novel Method Based on Deep Convolutional Neural Networks for Wafer Semiconductor Surface Defect Inspection. IEEE Trans. Instrum. Meas. 2020, 69, 9668–9680. [Google Scholar] [CrossRef]
  13. Scharcanski, J. Stochastic Texture Analysis for Measuring Sheet Formation Variability in the Industry. IEEE Trans. Instrum. Meas. 2006, 55, 1778–1785. [Google Scholar] [CrossRef]
  14. Schneider, D.; Merhof, D. Blind weave detection for woven fabrics. Pattern Anal. Appl. 2015, 18, 725–737. [Google Scholar] [CrossRef]
  15. Basile, T.M.A.; Caponetti, L.; Castellano, G.; Sforza, G. A texture-based image processing approach for the description of human oocyte cytoplasm. IEEE Trans. Instrum. Meas. 2010, 59, 2591–2601. [Google Scholar] [CrossRef]
  16. Lecun, Y.; Boxer, B.; Denker, J.S.; Henderson, D.; Howard, R.E.; Hubbard, W.; Jackel, L.D. Backpropagation Applied to Handwritten Zip Code Recognition. Neural Comput. 1989, 1, 541–551. [Google Scholar] [CrossRef]
  17. Krizhevsky, A.; Sutskever, I.; Hinton, G. ImageNet Classification with Deep Convolutional Neural Networks. Commun. ACM 2017, 60, 84–90. [Google Scholar] [CrossRef]
  18. Yang, J.; Fu, G.; Zhu, W.; Cao, Y.; Yang, M.Y. A Deep Learning-Based Surface Defect Inspection System Using Multiscale and Channel-Compressed Features. IEEE Trans. Instrum. Meas. 2020, 69, 8032–8042. [Google Scholar]
  19. Zhong, J.; Liu, Z.; Han, Z.; Han, Y.; Zhang, W. A CNN-Based Defect Inspection Method for Catenary Split Pins in High-Speed Railway. IEEE Trans. Instrum. Meas. 2019, 68, 2849–2860. [Google Scholar] [CrossRef]
  20. Girshick, R.; Donahue, J.; Darrell, T.; Malik, J. Region-Based Convolutional Networks for Accurate Object Detection and Segmentation. IEEE Trans. Pattern Anal. Mach. Intell. 2016, 38, 142–158. [Google Scholar] [CrossRef] [PubMed]
  21. Girshick, R. Fast R-CNN. In Proceedings of the IEEE International Conference on Computer Vision (ICCV), Santiago, Chile, 7–13 December 2015; pp. 1440–1448. [Google Scholar]
  22. Ren, S.; He, K.; Girshick, R.; Sun, J. Faster R-CNN: Towards Real-Time Object Detection with Region Proposal Networks. IEEE Trans. Pattern Anal. Mach. Intell. 2017, 39, 1137–1149. [Google Scholar] [CrossRef] [Green Version]
  23. He, K.; Gkioxari, G.; Dollar, P.; Girshick, R. Mask R-CNN. IEEE Trans. Pattern Anal. Mach. Intell. 2020, 42, 386–397. [Google Scholar] [CrossRef]
  24. Liyun, X.; Boyu, L.; Hong, M.; Xingzhong, L. Improved Faster R-CNN algorithm for defect detection in powertrain assembly line. Procedia CIRP 2020, 93, 479–484. [Google Scholar] [CrossRef]
  25. Wang, Y.; Liu, M.; Zheng, P.; Yang, H.; Zou, J. A smart surface inspection system using faster R-CNN in cloud-edge computing environment. Adv. Eng. Inform. 2020, 43, 101037. [Google Scholar] [CrossRef]
  26. Oh, S.; Jung, M.; Lim, C.; Shin, S. Automatic Detection of Welding Defects Using Faster R-CNN. Appl. Sci. 2020, 10, 8629. [Google Scholar] [CrossRef]
  27. Attard, L.; Debono, C.J.; Valentino, G.; Di Castro, M.; Masi, A.; Scibile, L. Automatic Crack Detection using Mask R-CNN. In Proceedings of the 11th International Symposium on Image and Signal Processing and Analysis (ISPA), Dubrovnik, Croatia, 23–25 September 2019; pp. 152–157. [Google Scholar]
  28. Zhao, G.; Hu, J.; Xiao, W.; Zou, J. A mask R-CNN based method for inspecting cable brackets in aircraft. Chin. J. Aeronaut. 2020. [Google Scholar] [CrossRef]
  29. Redmon, J.; Divvala, S.; Girshick, R.; Farhadi, A. You Only Look Once: Unified, Real-Time Object Detection. In Proceedings of the 2016 IEEE Conference on Computer Vision and Pattern Recognition (CVPR), Las Vegas, CA, USA, 27–30 June 2016; pp. 779–788. [Google Scholar]
  30. Redmon, J.; Farhadi, A. YOLO9000: Better, Faster, Stronger. In Proceedings of the 2017 IEEE Conference on Computer Vision and Pattern Recognition (CVPR), Honolulu, HI, USA, 21–26 July 2017; pp. 6517–6525. [Google Scholar]
  31. Redmon, J.; Farhadi, A. Yolov3: An incremental improvement. arXiv 2018, arXiv:1804.02767. [Google Scholar]
  32. Bochkovskiy, A.; Wang, C.; Liao, H.M. YOLOv4: Optimal Speed and Accuracy of Object Detection. arXiv 2020, arXiv:2004.10934. [Google Scholar]
  33. Qiu, Z.; Wang, S.; Zeng, Z.; Yu, D. Automatic visual defects inspection of wind turbine blades via YOLO-based small object detection approach. J. Electron. Imaging 2019, 28, 043023. [Google Scholar] [CrossRef]
  34. Adibhatla, V.A.; Chih, H.; Hsu, C.; Cheng, J.; Abbod, M.F.; Shieh, J. Defect Detection in Printed Circuit Boards Using You-Only-Look-Once Convolutional Neural Networks. Electronics 2020, 9, 1547. [Google Scholar] [CrossRef]
  35. Wu, W.; Li, Q. Machine Vision Inspection of Electrical Connectors Based on Improved Yolo v3. IEEE Access 2020, 8, 166184–166196. [Google Scholar] [CrossRef]
  36. Shi, Q.; Li, C.; Guo, B.; Wang, Y.; Tian, H.; Wen, H.; Meng, F.; Duan, X. Manipulator-based autonomous inspections at road checkpoints: Application of faster YOLO for detecting large objects. Def. Technol. 2020, in press. [Google Scholar] [CrossRef]
  37. Hsieh, C.; Lin, Y.; Tsai, L.; Huang, W.; Hsieh, S.; Hung, W. Offline Deep-learning-based Defective Track Fastener Detection and Inspection System. Sens. Mater. 2020, 32, 3429–3442. [Google Scholar] [CrossRef]
  38. Bolya, D.; Zhou, C.; Xiao, F.; Lee, Y.J. YOLACT: Real-time instance segmentation. In Proceedings of the 2019 IEEE International Conference on Computer Vision, Seoul, Korea, 27 October–2 November 2019; pp. 9156–9165. [Google Scholar]
  39. Guo, F.; Qian, Y.; Wu, Y.; Leng, Z.; Yu, H. Automatic railroad track components inspection using real-time instance segmentation. Comput.-Aided Civ. Infrastruct. Eng. 2021, 36, 362–377. [Google Scholar] [CrossRef]
  40. Pan, Z.; Yang, J.; Wang, X.; Wang, F.; Azim, I.; Wang, C. Image-based surface scratch detection on architectural glass panels using deep learning approach. Constr. Build. Mater. 2021, 282, 122717. [Google Scholar] [CrossRef]
  41. Sambasivan, N.; Kapania, S.; Highfill, H.; Akrong, D.; Kumar, P.P.; Aroyo, L.M. “Everyone wants to do the model work, not the data work”: Data Cascades in High-Stakes AI. In Proceedings of the 2021 CHI Conference on Human Factors in Computing Systems, Yokohama, Japan, 8–13 May 2021. [Google Scholar]
  42. Andrew Ng Launches A Campaign For Data-Centric, AI. Available online: https://www.forbes.com/sites/gilpress/2021/06/16/andrew-ng-launches-a-campaign-for-data-centric-ai/ (accessed on 22 August 2021).
  43. Tang, Z.; Tian, E.; Wang, Y.; Wang, L.; Yang, T. Nondestructive Defect Detection in Castings by Using Spatial Attention Bilinear Convolutional Neural Network. IEEE Trans. Ind. Inform. 2021, 17, 82–89. [Google Scholar] [CrossRef]
  44. Zhou, X.; Wang, Y.; Zhu, Q.; Mao, J.; Xiao, C.; Lu, X.; Zhang, H. A Surface Defect Detection Framework for Glass Bottle Bottom Using Visual Attention Model and Wavelet Transform. IEEE Trans. Ind. Inform. 2020, 16, 2189–2201. [Google Scholar] [CrossRef]
  45. Kingma, D.P.; Ba, J. Adam: A Method for Stochastic Optimization. arXiv 2014, arXiv:1412.6980. [Google Scholar]
Figure 1. Components of tampons—absorbent core, cotton cord, and applicator.
Processes 09 01895 g001
Figure 2. Common defect types of tampon applicators.
Processes 09 01895 g002
Figure 3. Schematic of the inspection unit.
Processes 09 01895 g003
Figure 4. Hook-based transport system for tampons.
Processes 09 01895 g004
Figure 5. Architecture of YOLO.
Processes 09 01895 g005
Figure 6. Architecture of YOLACT.
Processes 09 01895 g006
Figure 7. Layout of the surface-inspection system based on deep learning.
Processes 09 01895 g007
Figure 8. Closer view of inspection station.
Processes 09 01895 g008
Figure 9. Network configuration of the proposed system.
Processes 09 01895 g009
Figure 10. Inspection algorithm of the proposed system.
Processes 09 01895 g010
Figure 11. Acquisition of normal and abnormal data by operating the system on site.
Processes 09 01895 g011
Figure 12. Design of tray conveyor with friction plate for data acquisition.
Processes 09 01895 g012
Figure 13. Example of data annotation with image segmentation masks.
Processes 09 01895 g013
Figure 14. Image slicing by crop logic.
Processes 09 01895 g014
Figure 15. Error cases found in the trial test.
Processes 09 01895 g015
Figure 16. Diluting light reflection by Contrast Limited Adaptive Histogram Equalization.
Processes 09 01895 g016
Figure 17. Background removal by contouring.
Processes 09 01895 g017
Figure 18. Image resizing by padding.
Processes 09 01895 g018
Figure 19. Optimization of instance-segmentation model with TensorRT.
Processes 09 01895 g019
Figure 20. The examples of instance segmentation.
Processes 09 01895 g020
Figure 21. NG outlet and rejector.
Processes 09 01895 g021
Figure 22. The confusion matrix at the image level.
Processes 09 01895 g022
Figure 23. Two FN cases detected by CLAHE.
Processes 09 01895 g023
Figure 24. Analysis of object-detection cases.
Processes 09 01895 g024
Table 1. Hardware and Software Specification.
Edge Computing DeviceServer
H/WIntel® Core™ i9-10900 @ 2.80 GHzIntel® Core™ i9-10900X @ 3.70 GHz
32 GB RAM128 GB RAM
1/Nvidia Geforce RTX2080(Ti) GPU4/Nvidia Geforce RTX2080(Ti) GPU
S/WUbuntu LTS 18.04.1Ubuntu LTS 18.04.1
Python 3.6.9Python 3.6.9
Tensorflow 2.3.1Tensorflow 2.3.1
Docker 19.03.12Docker 19.03.12
Table 2. Dataset for training and test.
NormalDefectTotal
Total Data1534 (62.8%)908 (37.2%)2442 (100%)
Training Data0 (0%)800 (100%)800 (100%)
Test Data1534 (93.5%)108 (6.5%)1642 (100%)
Table 3. Hyperparameters for model training.
BackboneBatchInputOptimizerLearning RateBeta1Beta2
CSPDarknet538320 × 320Adam0.0010.90.999
Table 4. Experimental results at the image level.
Data Pre-ProcessingPrecisionRecallF1-ScoreAccuracy
Without10.750.860.98
BR0.820.750.780.97
CLAHE0.760.760.760.97
BR + CLAHE0.490.740.590.93
Table 5. Experimental results at the bounding box level.
Data Pre-ProcessingPrecisionRecallAP50
Without0.490.5640.39
BR0.550.5338.75
CLAHE0.530.5036.16
BR + CLAHE0.530.5237.43
Publisher’s Note: MDPI stays neutral with regard to jurisdictional claims in published maps and institutional affiliations.

