1. Introduction
Traditional coal-fired boilers use air for combustion, in which N
2 in the air (approximately 79% by volume) dilutes CO
2 in the flue gas. The resulting low concentration of CO
2 in the flue gas makes it extremely difficult to capture and recover CO
2. Oxy-combustion technology is considered an effective technology that can solve this problem, by enhancing the oxygen concentration and using recycled flue gas (RFG) [
1,
2,
3,
4]. Oxy-combustion technology can be used to obtain a high concentration of CO
2 in the products of the combustion system, which is beneficial to the storage and utilization of CO
2. With the development of gas recirculation technology, many concepts of oxy-combustion based on RFG have been proposed. RFG (mainly CO
2) is used as a dilution gas to control the structure, temperature, and heat flux of the flame, and has been widely used in gas turbines and coal-fired power plants [
5].
Through the transformation of the combustion system, RFG emissions can be significantly reduced, combustion efficiency can be improved, and pollutants emission costs can be reduced [
6,
7]. However, the increase of oxygen concentration and the decrease of fuel dilution in the diffusion flame will lead to the increase of flame temperature and soot concentration, and soot particles are emitted [
8,
9]. As soot particles are harmful to the environment and the human body, it is very important to understand the effects of RFG on soot formation and oxidation in the oxy-combustion system and also to further control the radiation from soot particles in flames [
10]. Due to the necessity for soot research, many studies have measured the soot volume fraction in flames through experiments [
11,
12], and studied the effects of oxygen concentration and CO
2 on soot formation characteristics in flames [
13,
14,
15,
16,
17]. In addition, changing the structure of the flame (changing the concentration of the inert gas in the oxidant and fuel) can significantly change the soot formation and oxidant characteristics of the flame, and the bright yellow flame, which is full of soot particles, can be changed to a blue flame with radical chemiluminescence, even in the case of adiabatic flame temperature (T
ad) constant. This phenomenon has been observed in many types of non-premixed flames, such as counterflow flames [
13,
14,
15] and laminar coflow diffusion flames [
16,
17]. The stoichiometric mixture fraction (Z
st) to describe the flame structure and the degree of dilution of the fuel and oxidant can be introduced as:
where
Y0 is the mass fraction at the system boundary,
W is the molecular mass, and
ν is the stoichiometric coefficient. The subscripts
F and
O are fuel flow and oxidant flow, respectively. Changing Z
st can influence the temperature, composition distribution, and soot yield, which ultimately affect the heat flow distribution.
Atreya et al. studied thermal radiation and soot particulate emission in partially premixed counterflow flames [
18]. Experimental results have found that the configuration of the soot zone spatially entrained between the premixed and non-premixed reaction zones may enhance radiative heat transfer while reducing soot emissions. Liu et al. studied the effects of gas and soot radiation in a counterflow ethylene diffusion flame by using the semiempirical two-equation soot model and the radiation heat transfer model calculated by the DOM/SNBCK method and found that gas radiation is more important than soot radiation in influencing the flame temperature and soot volume fraction (SVF) [
19]. Based on the soot volume fraction per unit, soot radiation in a counterflow diffusion flame is less important than that in a coflow flame. Due to the gas radiation in the peak flame temperature region and the soot radiation at a much lower temperature, the distribution of the radiation source term presents a double valley structure. In O
2/N
2 and O
2/CO
2 atmospheres, Guo et al. studied the influence of the Z
st flame structure on the combustion characteristics of different ethylene counterflow diffusion flames, through a variety of designed flames [
14], which isolated the temperature and dilution degree effects. They found that with the increase in Z
st, using N
2 or CO
2 as a diluent can inhibit the formation of soot, and that compared to N
2, the effect of CO
2 on the inhibition of soot formation is more obvious.
In summary, the flame temperature distribution and flame structure changes could affect the formation of soot and the spatial distribution of the radiation medium, and then ultimately affect the overall thermal radiation of the flame. We will use pure CO2 here instead of a more complex RFG for diluting fuel and oxidant to obtain different Tad and flame structures. The spatial distribution of radiation medium, including gases and soot particles, and the overall radiation of the flame in oxygen-enriched counterflow diffusion flame is studied by numerical calculations coupled with a detailed chemical reaction mechanism, soot particle dynamics model, and radiation model. These fundamental oxy-combustion studies shed light on how best to utilize RFG to control the flame temperature, SVF, and heat flux, to achieve savings in fuel and oxygen resources and obtain the best working conditions.
3. Model Verification and Flame Design
Before conducting the oxy-fuel flame calculations, the correctness of the numerical model was first verified. Based on the location of the stagnation plane, the counterflow flames can be divided into soot-formation (SF) flames and soot-formation–oxidation (SFO) flames [
29]. SF flames usually mean that the flame sheet is located on the oxidant side of the stagnation plane, and it is usually a counterflow flame with pure fuel and low oxygen concentration. The flame sheet of SFO is on the fuel side of the stagnation plane, which is achieved by setting high fuel dilution and high oxygen concentration. As a result, we conducted model verifications on the two types of counterflow flames. For SF, we set the same conditions as in [
30] for the C
2H
4 counterflow diffusion flames. The separation distance between the nozzles was 1.42 cm, the fuel stream was pure C
2H
4 for the non-diluted flame and the oxidant stream consisted of 24% O
2 and 76% N
2 by volume. To keep the overall strain rate constant, the nozzle exit velocities of the fuel and oxidant streams were maintained at 19.5 cm/s. At the same time, N
2 in oxidant streams was replaced with CO
2 under the same conditions to initially explore the difference between N
2 and CO
2 on the impact of temperature field, soot particle distribution, heat release or transmission, and so on.
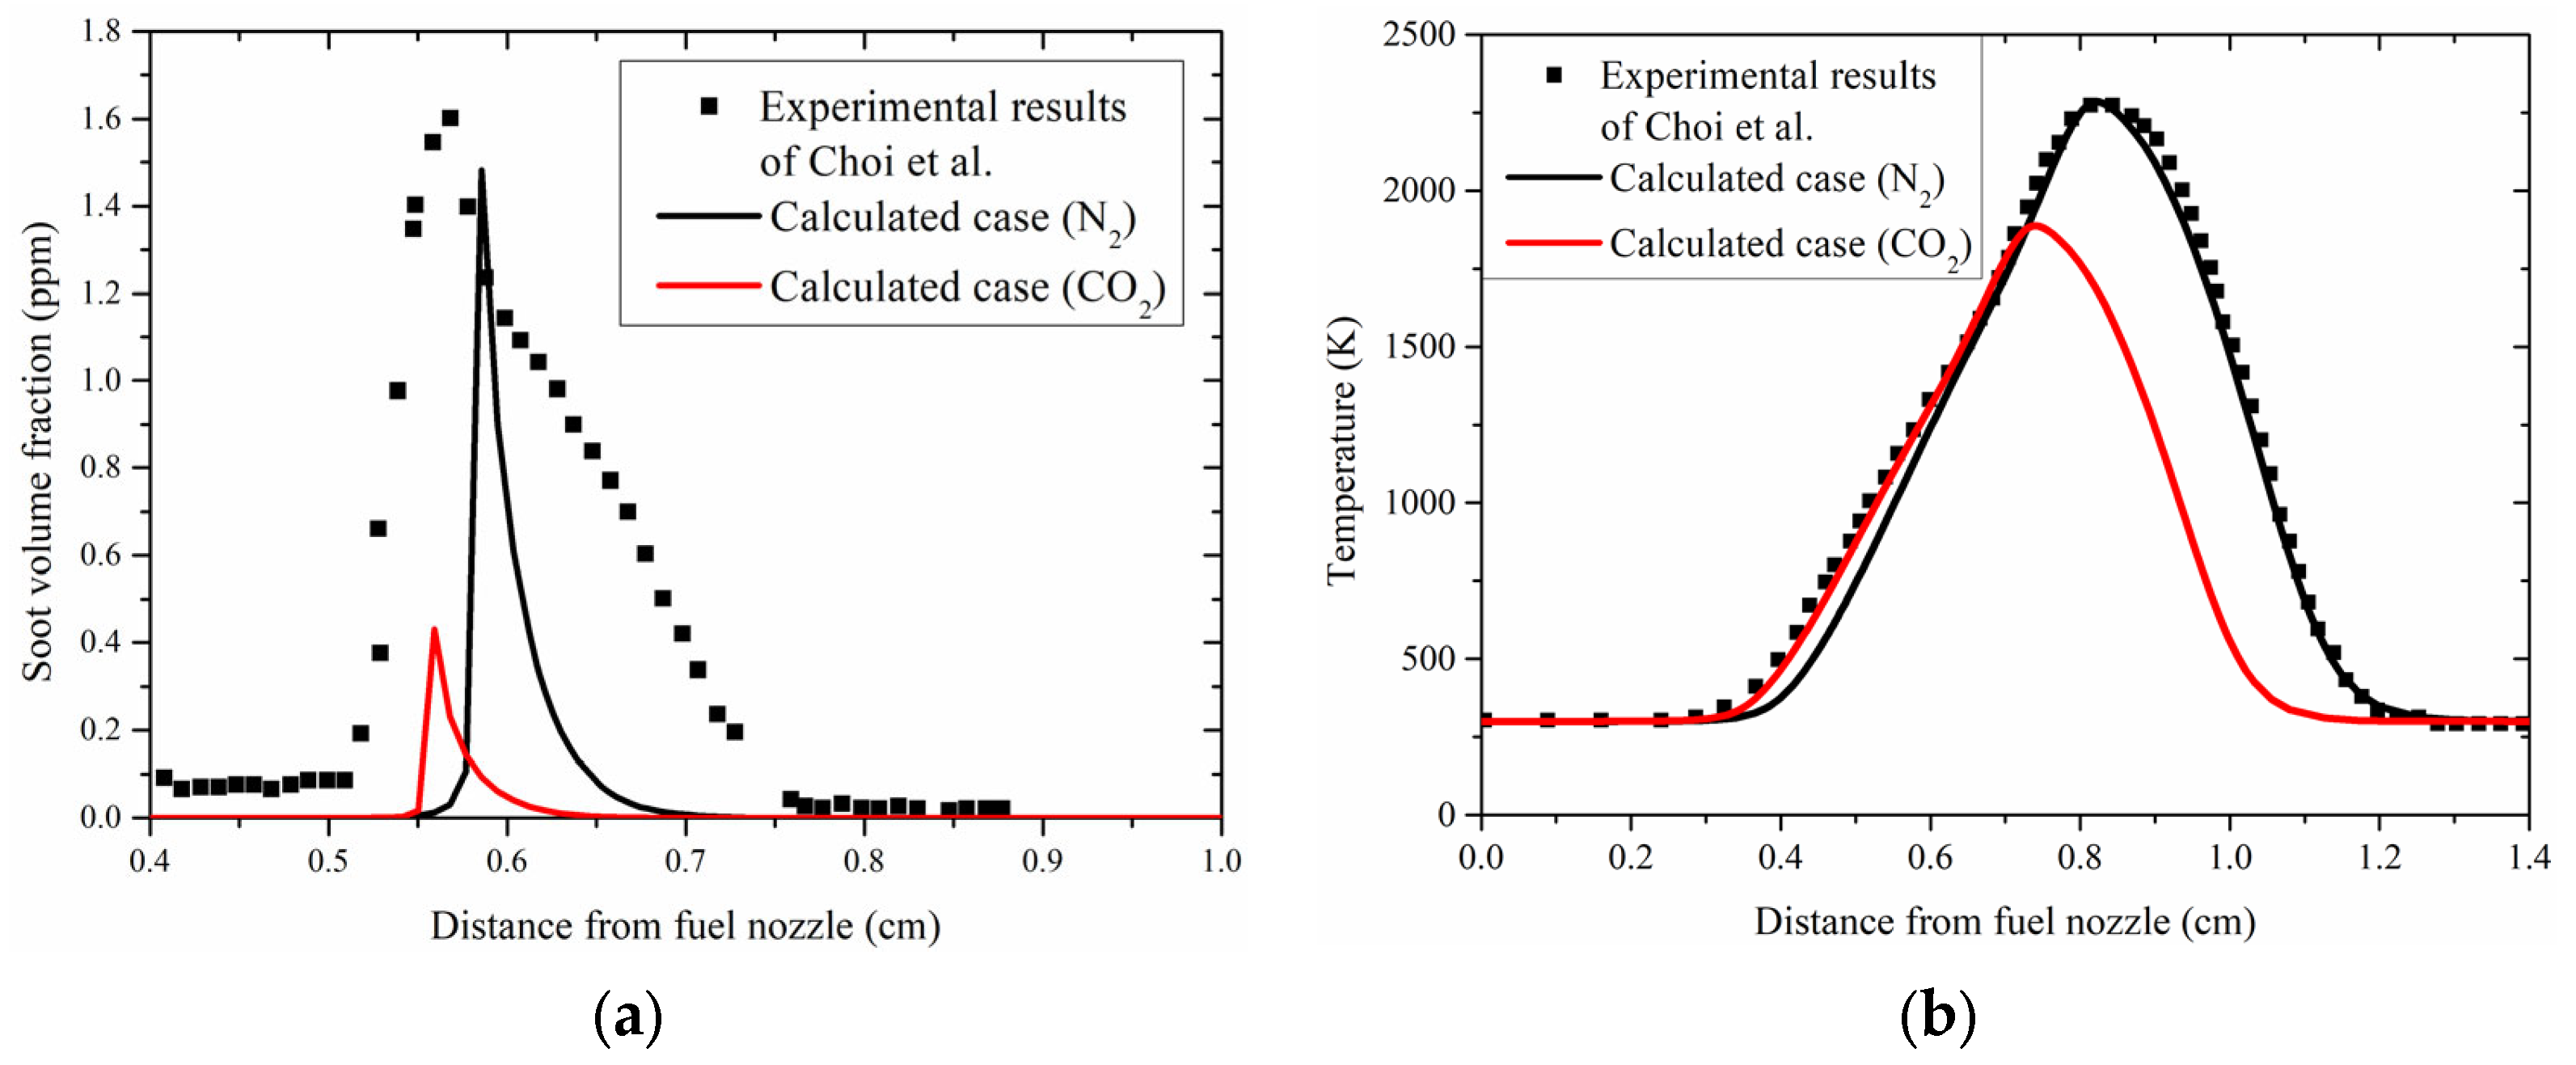
Figure 1 shows the computed and experimental SVFs and temperature profiles. Experimental and calculated peak values of SVF are 1.67 ppm and 1.48 ppm, respectively. The locations of peak SVF of the two differ by about 0.3 cm, and the calculated sooting zone is narrower than the experimental one, which may be because the numerical model of this manuscript does not have a good prediction of the thermophoresis and diffusion of soot particles, which are exactly responsible for the wide range of soot volume fraction in the experimental flame. The peak temperatures and distributions are consistent.
CO
2 replaces N
2 as dilution progresses, showing significant impacts on the temperature field, soot particle formation or distribution, heat release, and heat radiation. In
Figure 1a, the peak value of SVF in the CO
2/O
2 atmosphere is about 0.43 ppm, only a quarter of the value in the N
2/O
2 atmosphere.
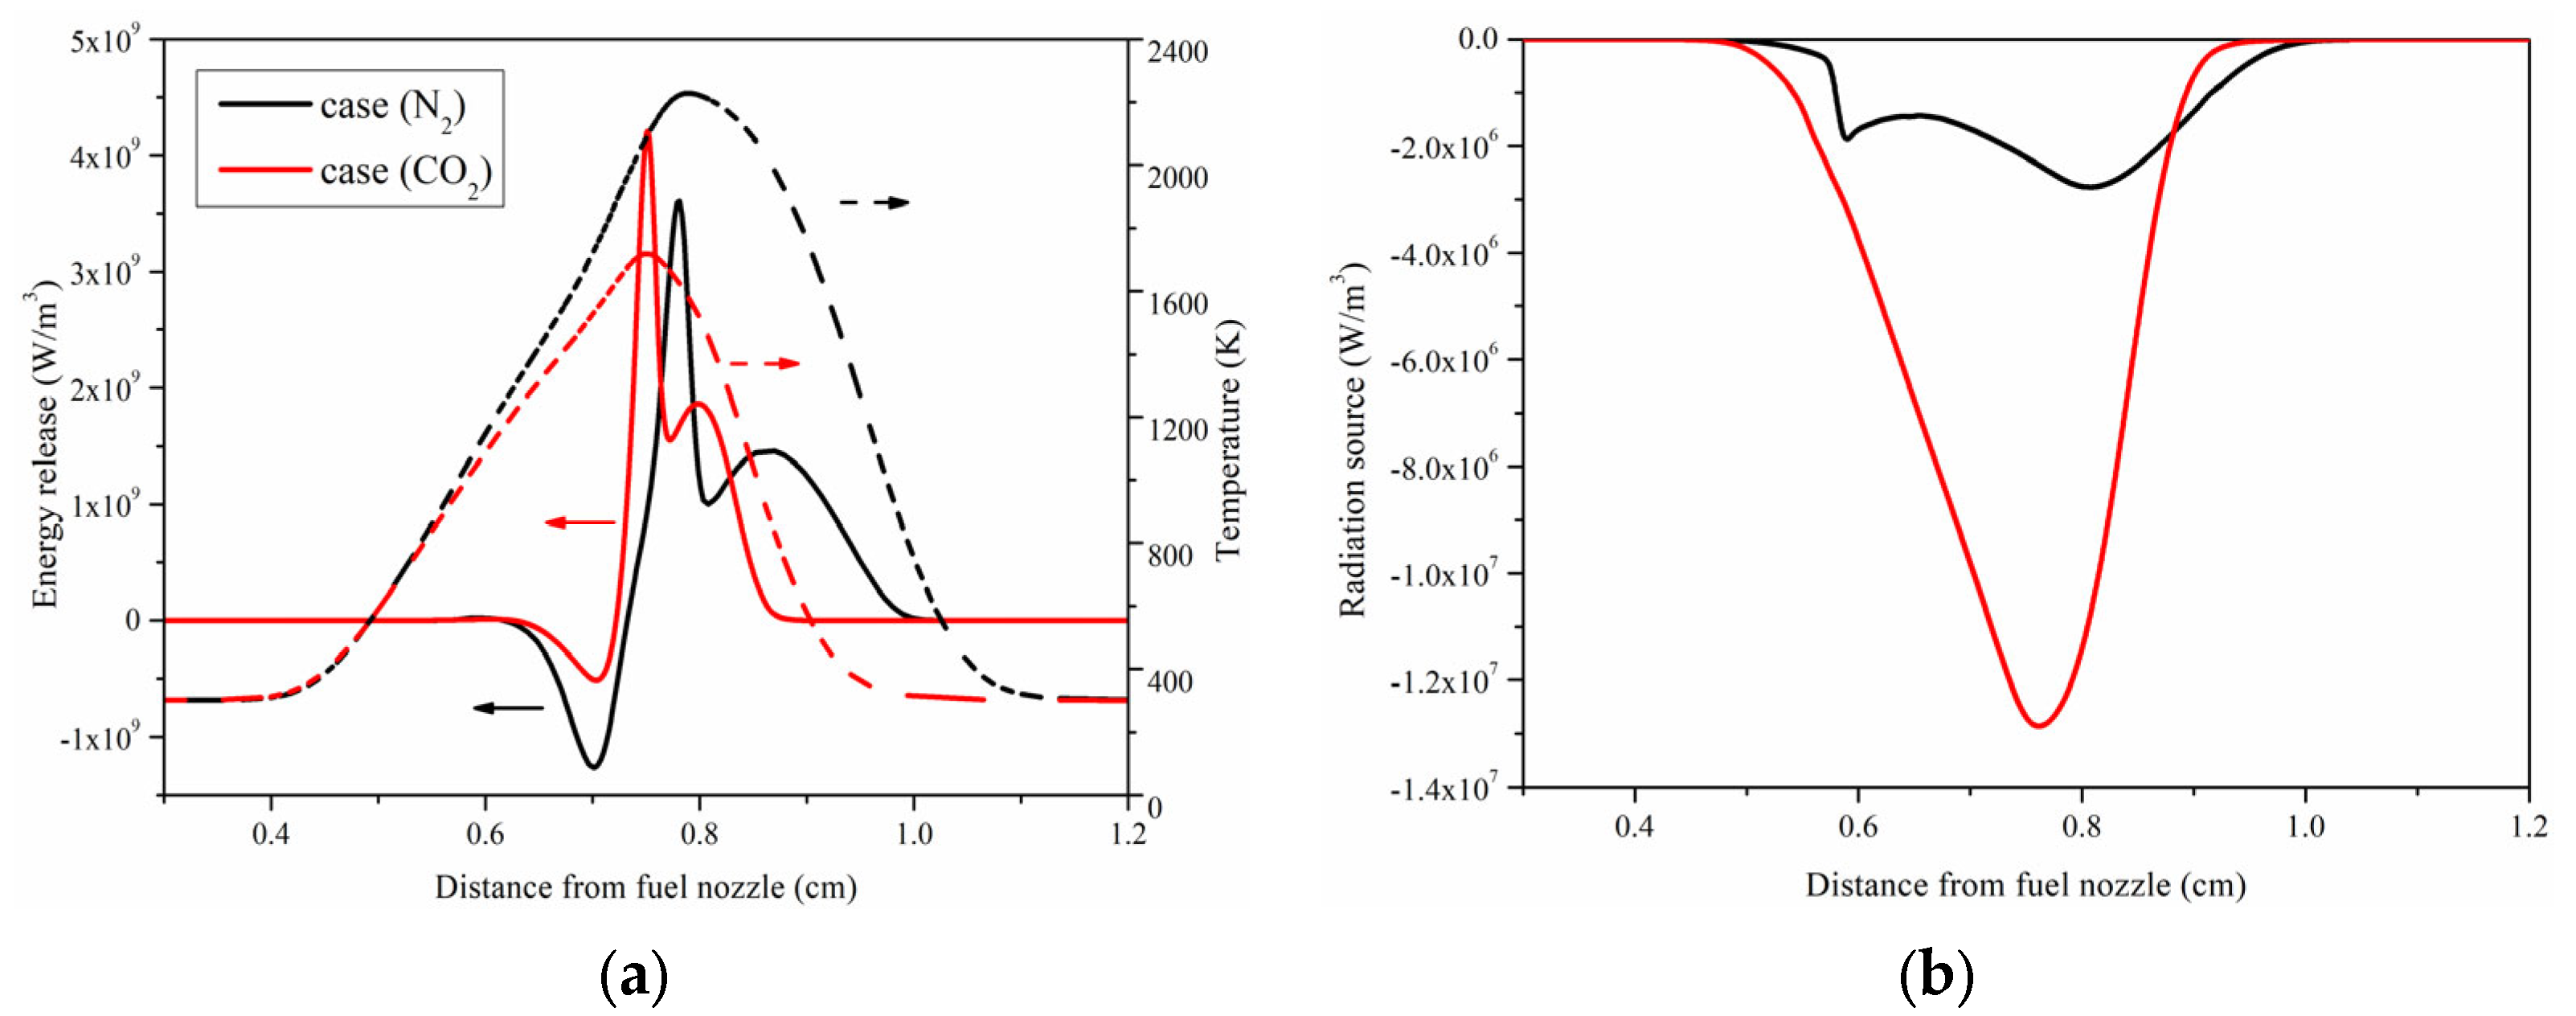
Figure 2a shows the net heat generated by the reaction and the temperature distribution in N
2/O
2 and CO
2/O
2 atmospheres; the C
2H
4/O
2 + CO
2 counterflow diffusion flame has more net heat production from gas-phase reactions than the C
2H
4/O
2 + N
2 flame, because CO
2 is not an absolutely inert gas, it participated in some chemical reactions, especially in some exothermic reactions [
3].
Figure 2b is the radiation source from soot particles and gases (CO
2, H
2O, CO, and CH
4). The radiation source of the N
2/O
2 atmosphere generates two valleys. The valley at a distance of 0.6 cm from the fuel nozzle is caused by the radiation of soot, which corresponds to the peak soot position in
Figure 1a. The valley at 0.8 cm is due to the peak temperature, which greatly enhances the gas radiation. However, due to low-yield soot particles and high concentration of CO
2, the radiation from the particles can be ignored compared to gas radiation in the CO
2/O
2 atmosphere. The sudden increase in CO
2 concentration leads gas radiation to become the most important radiation source.
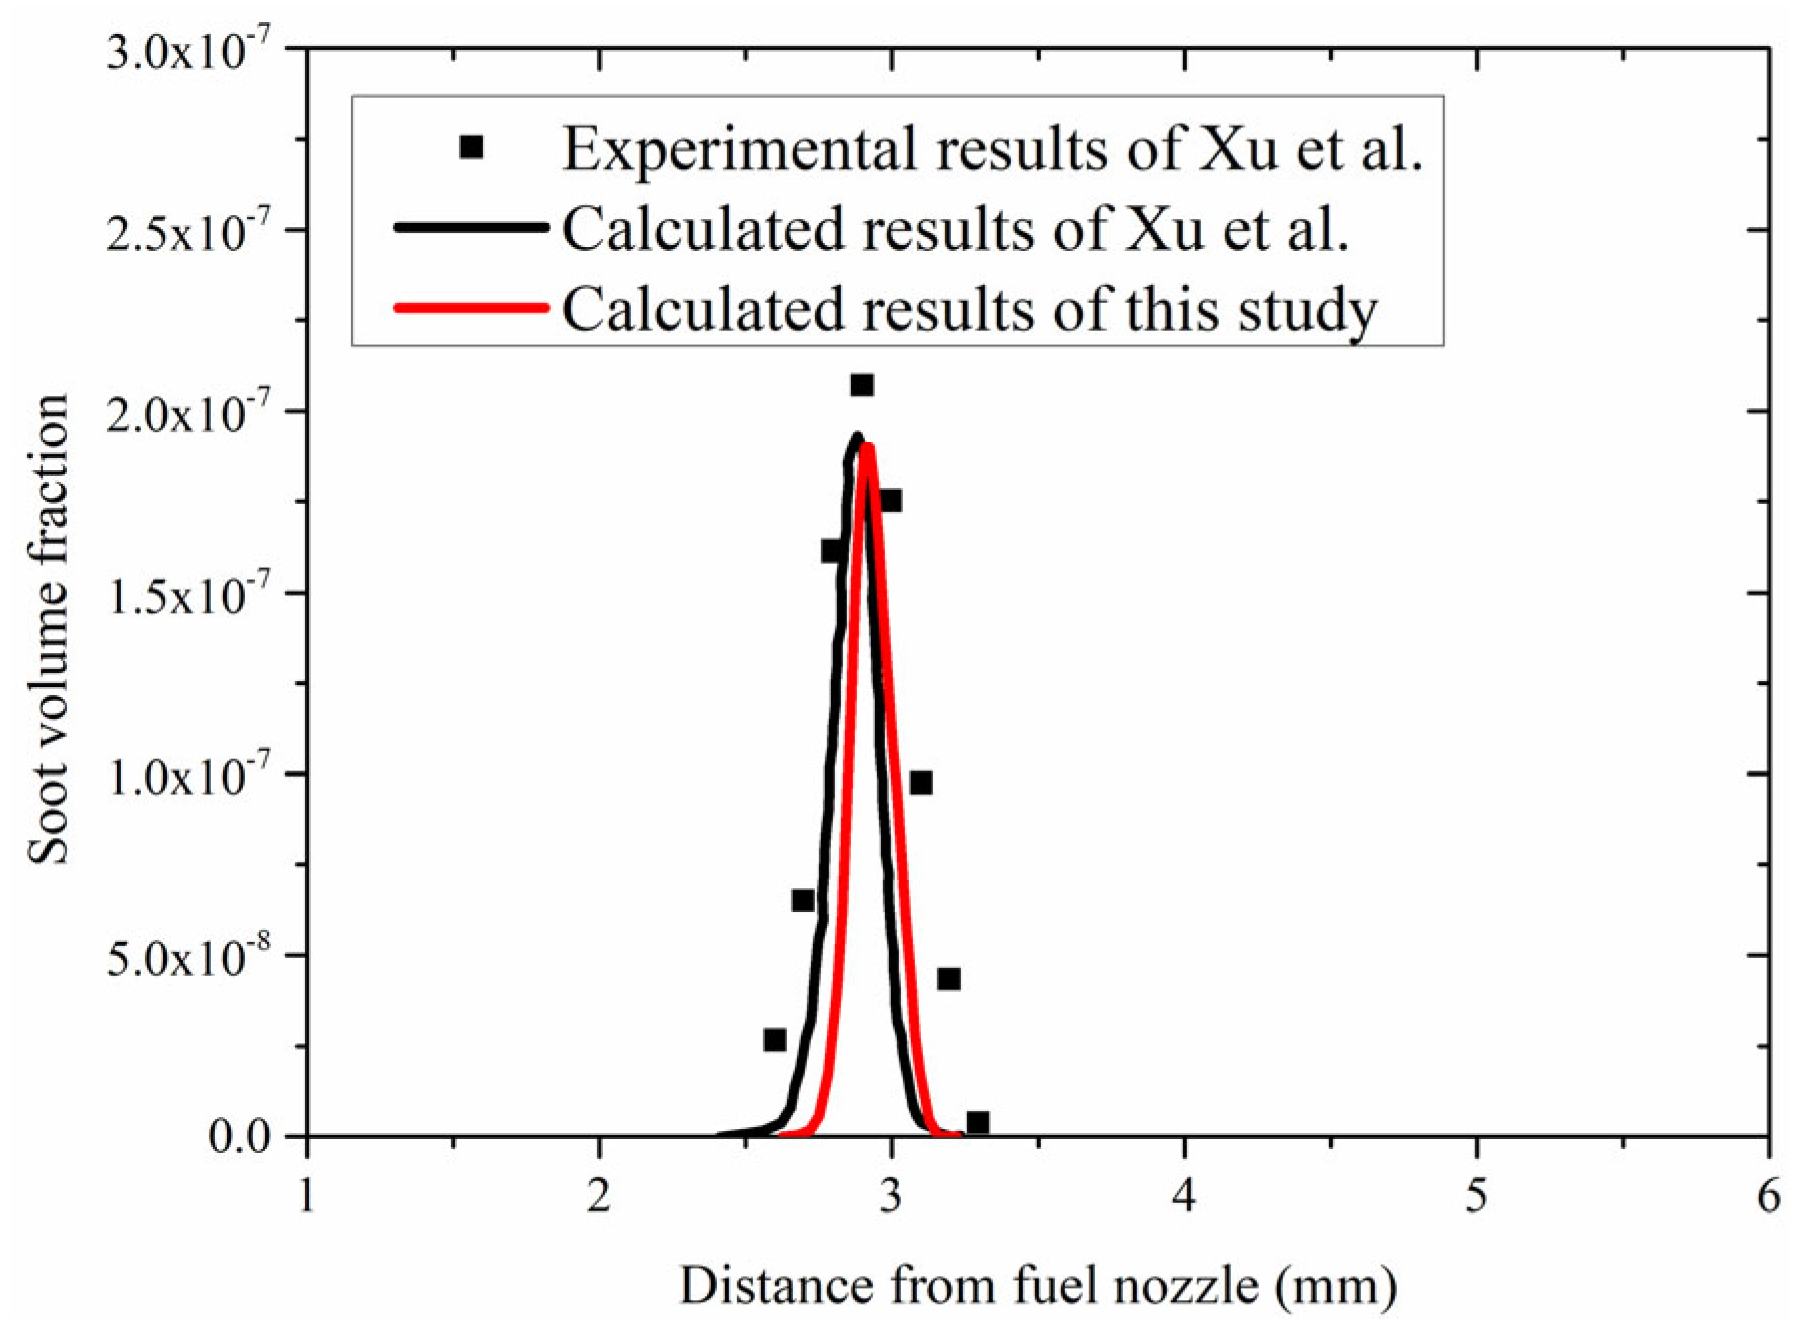
For the SFO flames, the separation distance between the nozzles was 8 mm, the oxidant stream was composed of 90% O
2 and 10% N
2 by volume, and the fuel stream was composed of 28% C
2H
4 and 72% N
2. The nozzle exit velocities of the fuel and oxidant streams were maintained at 20 cm/s [
31]. The comparison between the experimental and calculated SVF of the SFO flame is shown in
Figure 3. The experimental and calculated peak values by Xu et al. were 0.21 ppm and 0.19 ppm, respectively, while the calculated peak SVF of this study was 0.189 ppm, and the peak position was relatively close. The results show that for the SFO flame with a high oxygen concentration and a high fuel dilution, this numerical model can accurately predict experimental results.
Overall, even if there is a difference in the sooting zone for SF flames, the peak values and positions are worthy of attention in the discussion of the results. In addition, SFO can be accurately simulated, so the model verification shows that this numerical model can be better used to predict and characterize the counterflow diffusion flame, especially in the conditions of fuel dilution and oxygen enhancement.
Here, three groups of flame were designed after comprehensive consideration, in which CO
2 was used as a diluent, to research the effects of flame structure and T
ad on soot formation and on radiation from gases and soot. Each group maintained a constant T
ad with Z
st increasing, but the T
ad of each group was different. The flame cases were designed to simultaneously dilute both sides of the fuel stream and oxidant stream with a diluent gas, while ensuring that the total stoichiometric amount of CO
2 per group was unchanged, so T
ad was unaffected. The two nozzles of the burner were coaxial and flowed in opposite directions, with a diameter of 10 mm and a separation distance of 8 mm. The initial velocity of the reactant from the nozzle was maintained at 20 cm/s to ensure that the global strain rate remained nearly constant (50 s
−1). The initial temperatures of the fuel stream, the oxidant stream, and the ambient temperature all were maintained at 300 K, and the pressure was 1 atm.
Table 1 displays the details of the designed flames.
4. Results and Analysis
As a general rule, a permanent blue flame can be obtained when there is no soot present (which leads to visible radiation) in the flames. With the increase of soot, the flames gradually change from pure blue to yellow (soot radiation), or even bright white. Therefore, the incipient soot formation was studied by varying the mole fraction of oxygen in the oxidant stream for a given mole fraction of fuel in the fuel stream, similar to the definition of Z
st. Incipient soot formation is generally referred to as the sooting limit, which has been studied by many scholars, especially in diffusion flames [
32,
33,
34].
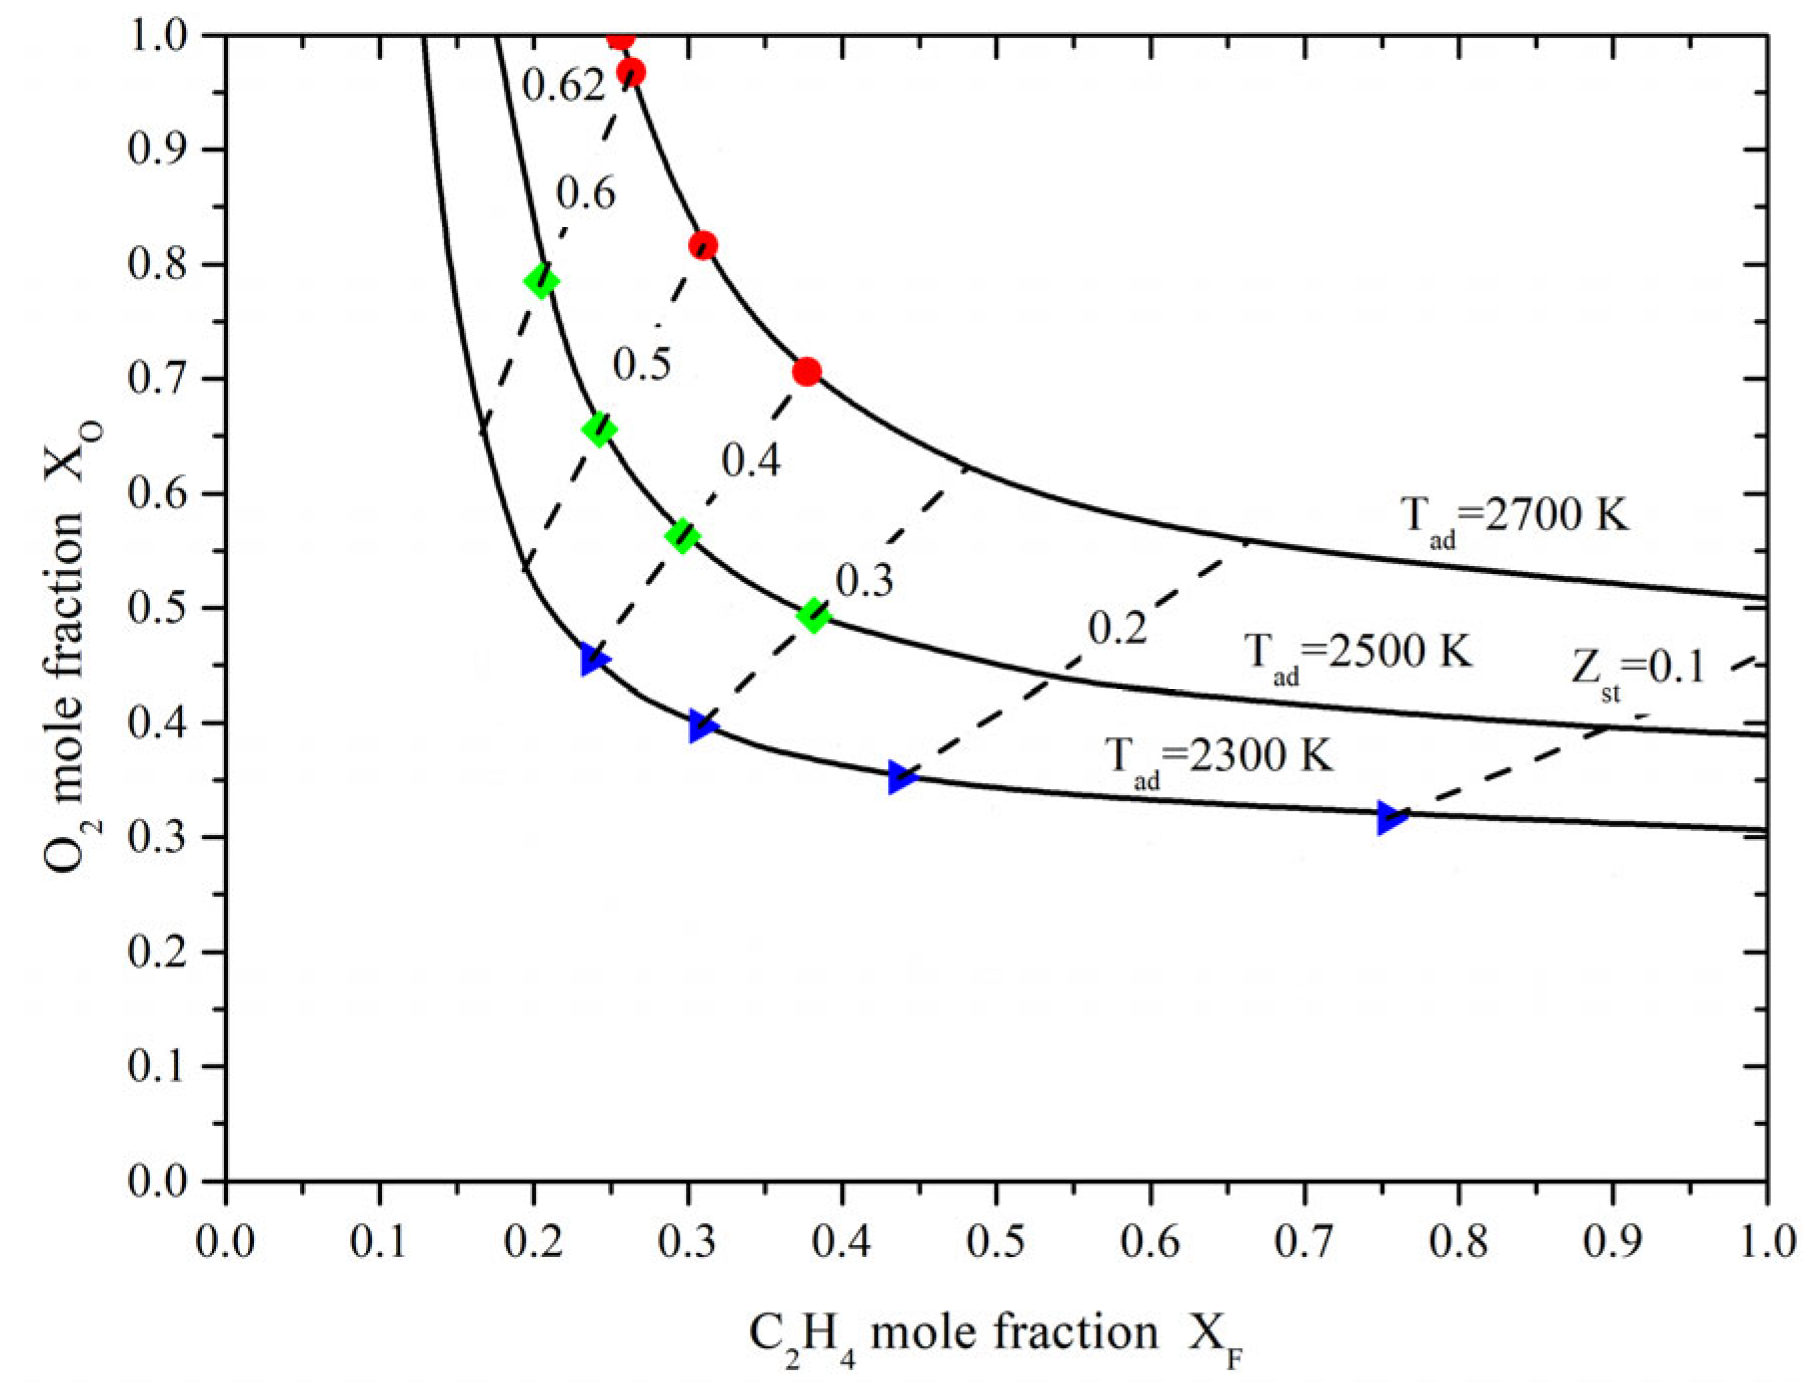
Figure 4 shows the three calculated iso-T
ad (solid lines) and six calculated iso-Z
st (dotted lines) curves in the O
2/CO
2 atmosphere, highlighting that flames with a lower T
ad have larger ranges of Z
st, corresponding to more varied flame structures. For instance, Z
st ranges from 0.0662 to 0.7732 in the first group (T
ad = 2300 K), whereas the range of variation of Z
st is reduced from 0.0846 to 0.7098 in the second group (T
ad = 2500 K), and further narrowed from 0.1113 to 0.6184 in the last group (T
ad = 2700 K). In other words, the iso-Z
st is getting denser as T
ad gradually decreases.
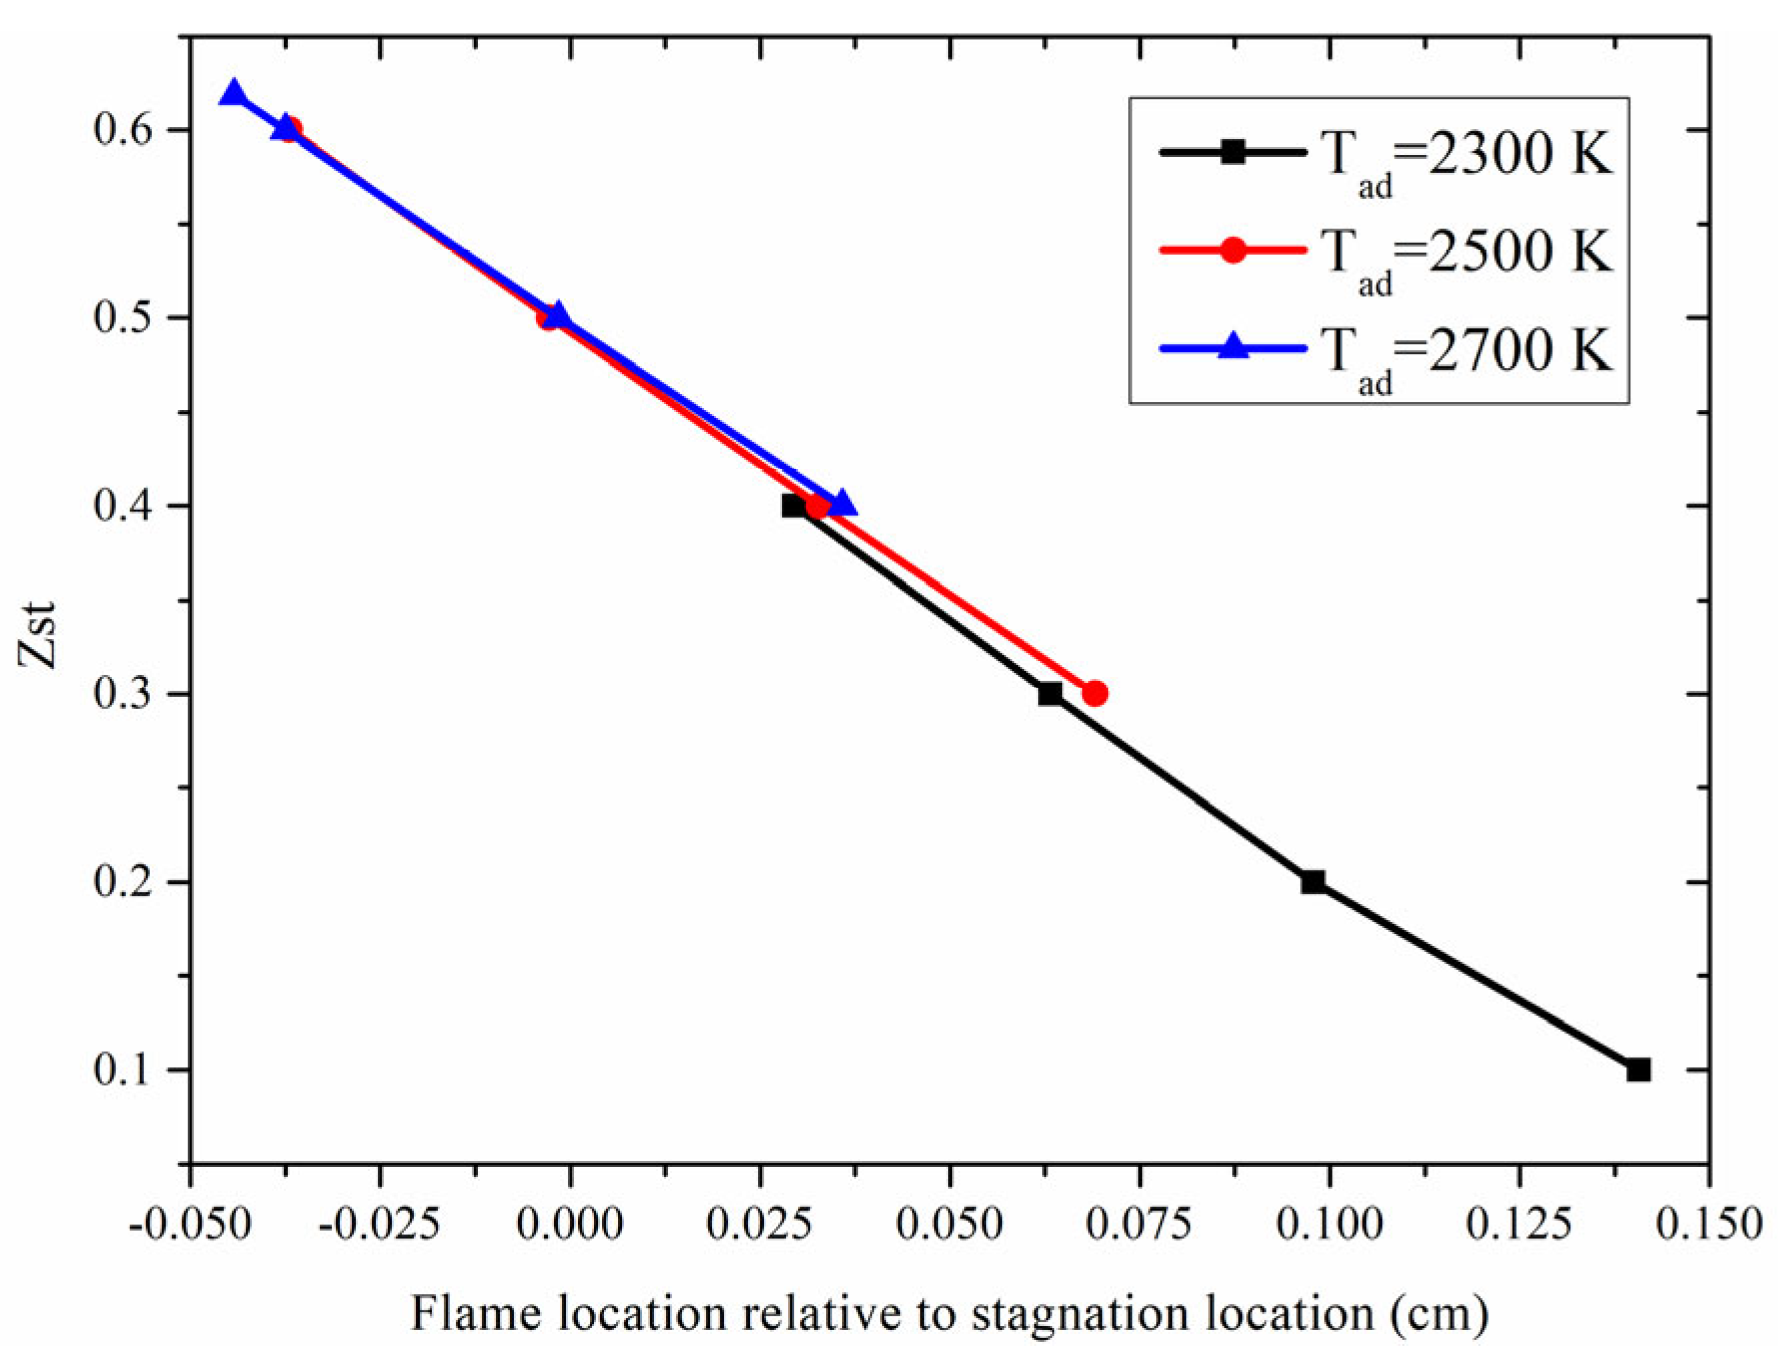
4.1. Position Changes of Flame Sheet and Stagnation Plane
It is generally believed that the change in Z
st is mainly due to the change of position of the flame sheet and stagnation plane [
29,
31], which in turn affects the formation process of soot particles.
Figure 5 shows the variation of the flame sheet position relative to the stagnation plane location in the conditions from
Table 1. The abscissa is the difference between the flame sheet position and the stagnation plane location (from the fuel side), the ordinate is the stoichiometric mixed fraction Z
st.
When Zst is small (Zst = 0.1–0.4), the flame sheet is located on the oxidant side of the stagnation plane. At that time, the fuel flowing out of the fuel side nozzle is continuously pyrolyzed in the process of approaching the stagnation plane. After reaching the stagnation plane, a portion of the species appearing across the stagnation plane through a diffusion mechanism then participate in the reaction with the oxidant. At the same time, the small molecular substances produced by the pyrolysis of the fuel react with each other while moving toward the stagnation plane to produce C2H2, C3H3, n-C4Hi, etc. A1 appears and grows up to A4, and then the soot particles are born and grown; eventually, the soot particles are pushed toward the stagnation plane by the gas flow. In this situation, the entire evolution of the soot particles is carried out on the fuel side of the flame sheet and does not pass through the highly oxidizing flame sheet, so the soot particle only grows and is not being consumed by oxidation.
As the Zst increases, the oxygen concentration in the oxidant gradually increases; the stagnation plane and flame sheet, which are relatively distant from each other at first, become close to each other and then gradually separate. In other words, the stagnation plane moves toward the oxidant side and the flame sheet moves continuously toward the fuel side. When the flame sheet moves to the fuel side of the stagnation plane (e.g., Zst = 0.6), the fuel flowing out of the fuel side nozzle has to pass through the flame sheet first in the process of approaching the stagnation plane, and so a large number of OH radicals with strong oxidation are found near the flame sheet, due to the increase in oxygen concentration. All of these inhibit the production of C2H2, PAHs, and other substances, as well as the inception and growth of soot particles, and other processes, resulting in a significant reduction in the number of soot particles reaching the stagnation plane.
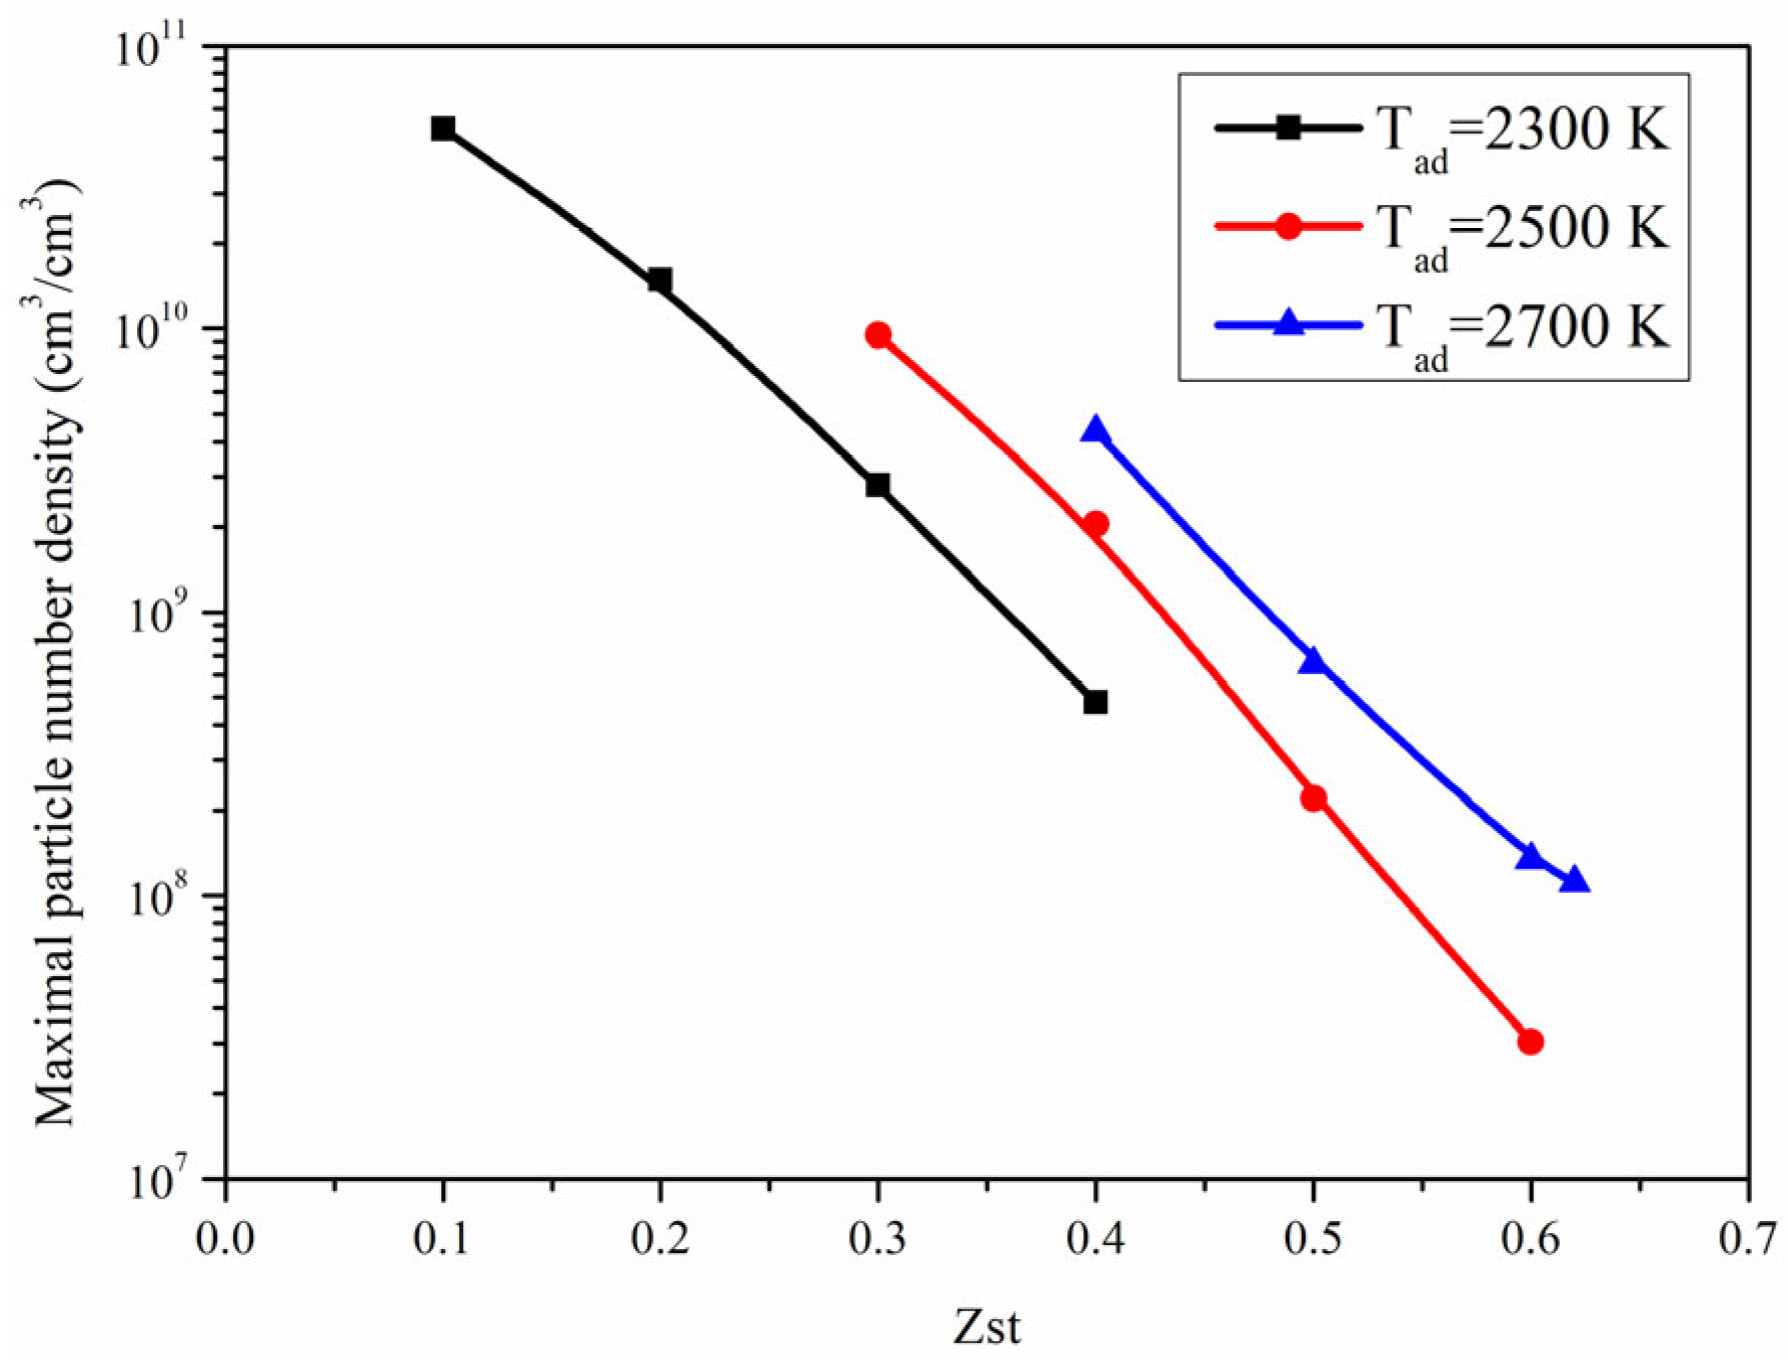
4.2. Effects of Flame Structure on Radiation
First, the maximal soot particle number density is showed in
Figure 6. All groups show the same pattern of soot with increasing Z
st, so the second group (T
ad = 2500 K) was selected for a more detailed analysis.
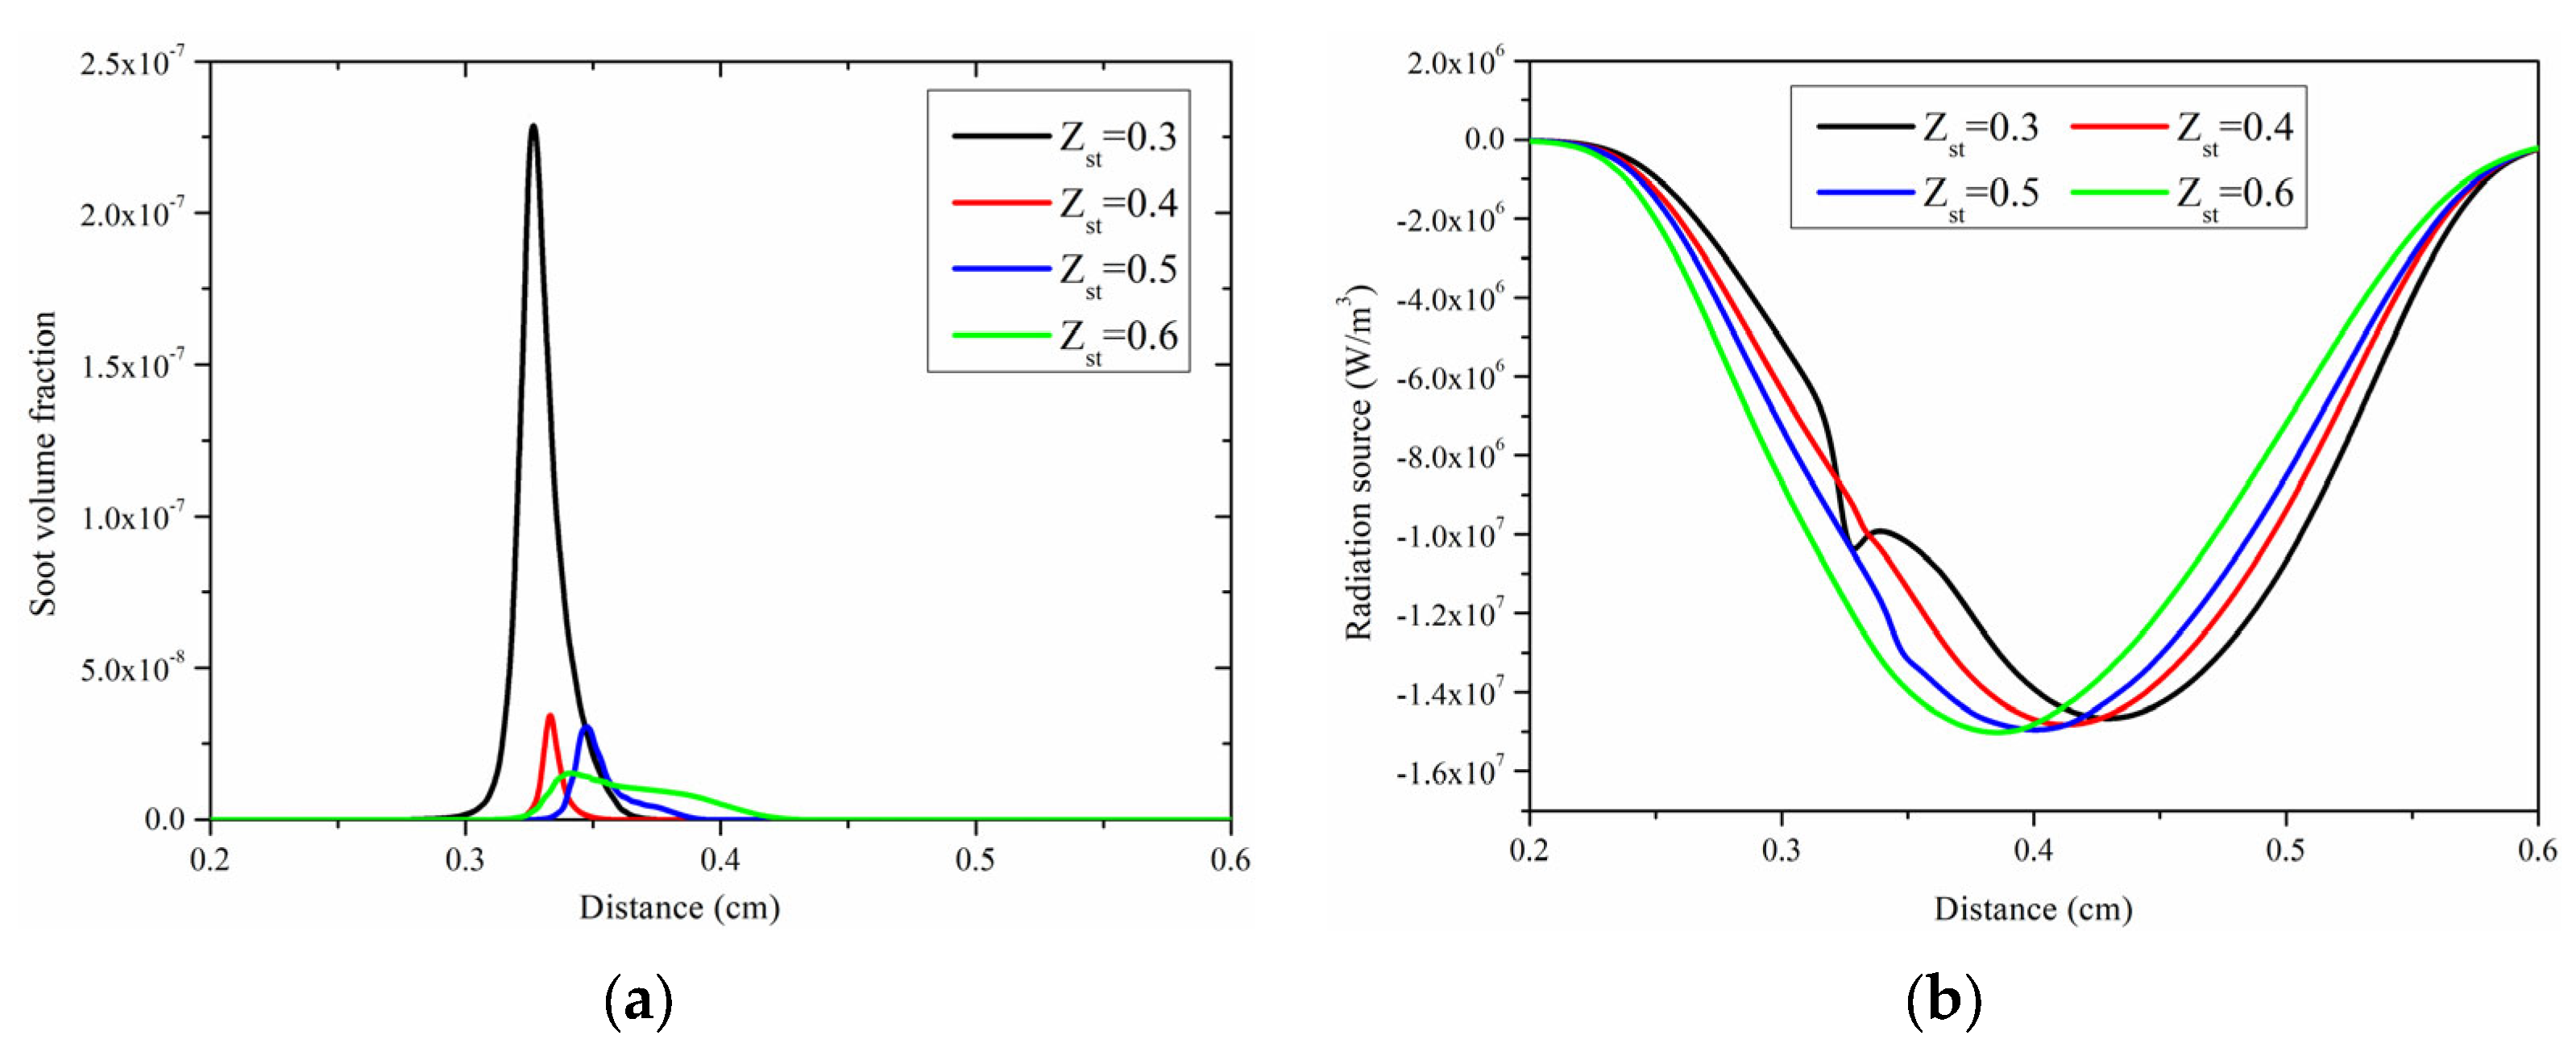
Figure 7 shows the distributions of SVF and radiation source caused by soot and gases in cases 2.1–2.4. The peak of SVF in case 2.1 is about 0.23 ppm, while SVF is magnified by a factor of 100 in case 2.4 and almost no soot formation is predicted. With Z
st increasing (ranging from 0.3 to 0.6), the peak value of the radiation source increases gradually, but not obviously, and the overall position progressively approaches the fuel side (from 0.43 to 0.39 cm). There is also a lower peak in the radiation source curve of case 2.1, which is the contribution of radiation from the soot particles. However, compared to gas radiation, soot particle radiation is very weak. With Z
st increasing, soot formation is reduced and the contribution of radiation is almost negligible.
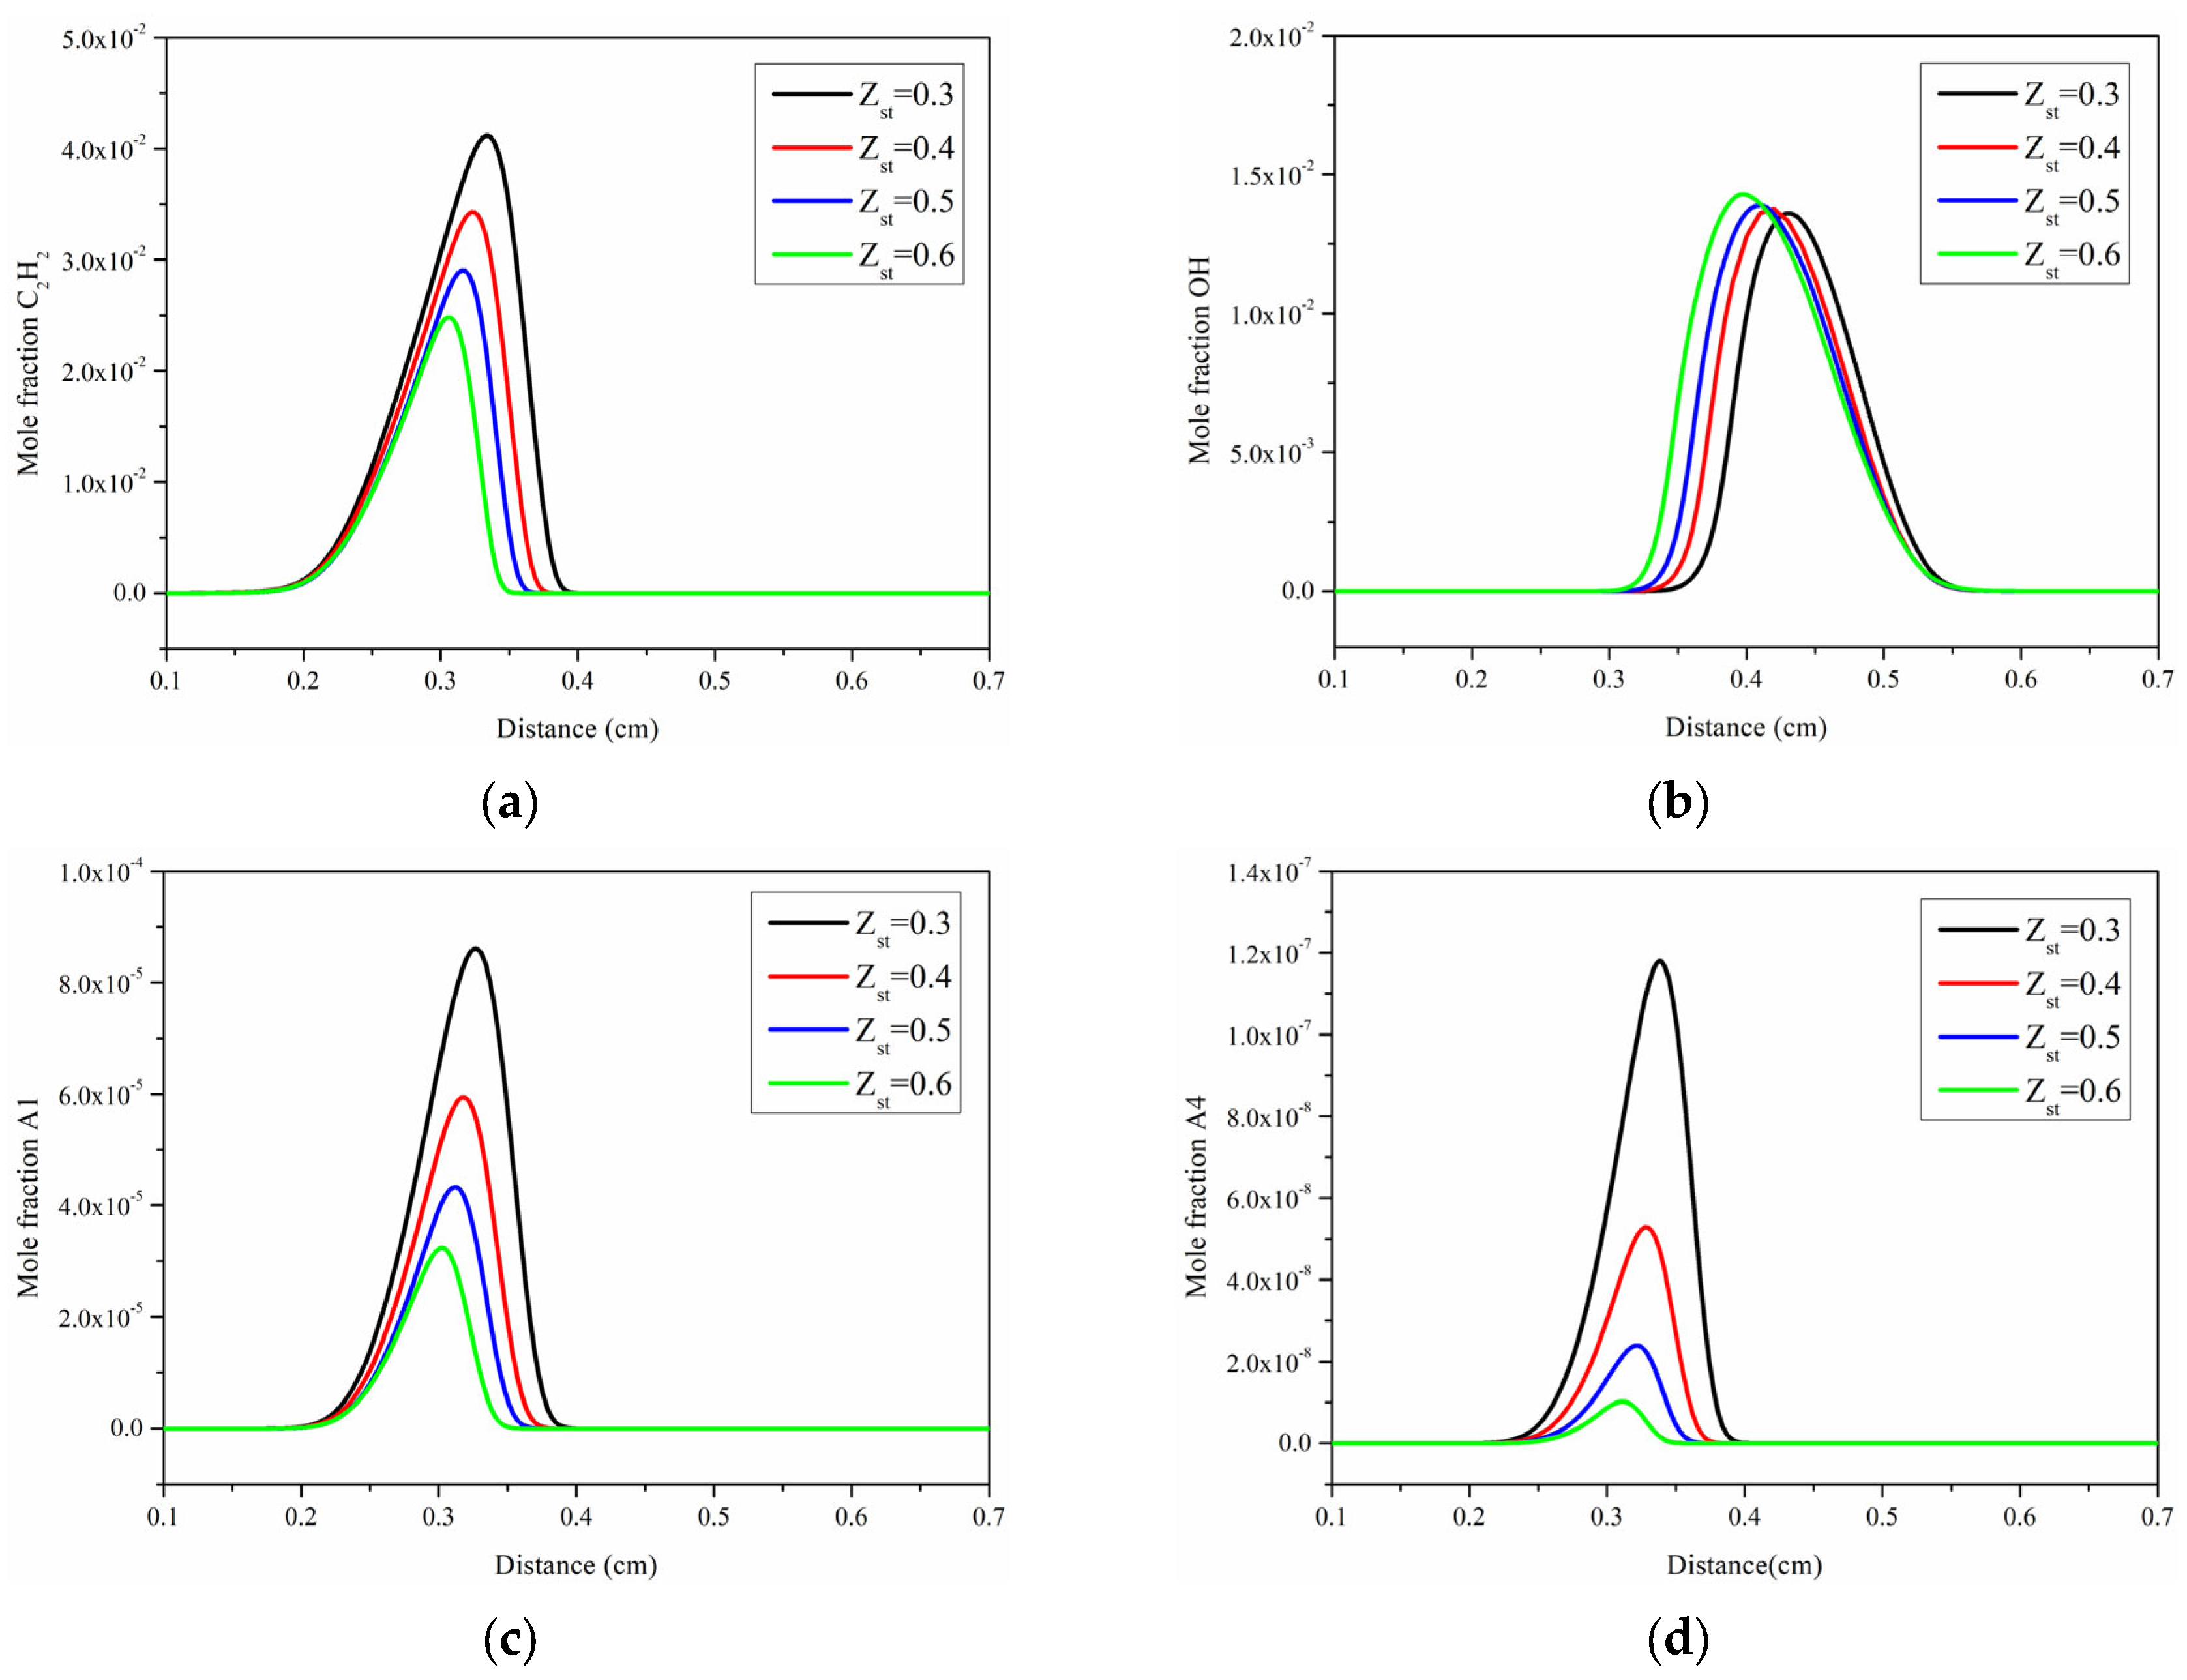
As mentioned earlier in this article, the soot particle growth mechanism mainly involves the HACA process and PAH condensation; soot particles are created by the dimerization of pyrene (A4) molecules, hydroxyl (OH) is mainly responsible for the oxidation and consumption of soot particles. We show the concentration distribution of several components, including C
2H
2, OH, A1 and A4 in
Figure 8. An increase in the stoichiometric mixing fraction causes the concentration of fuel to be diluted and increases the oxygen concentration of oxidants.
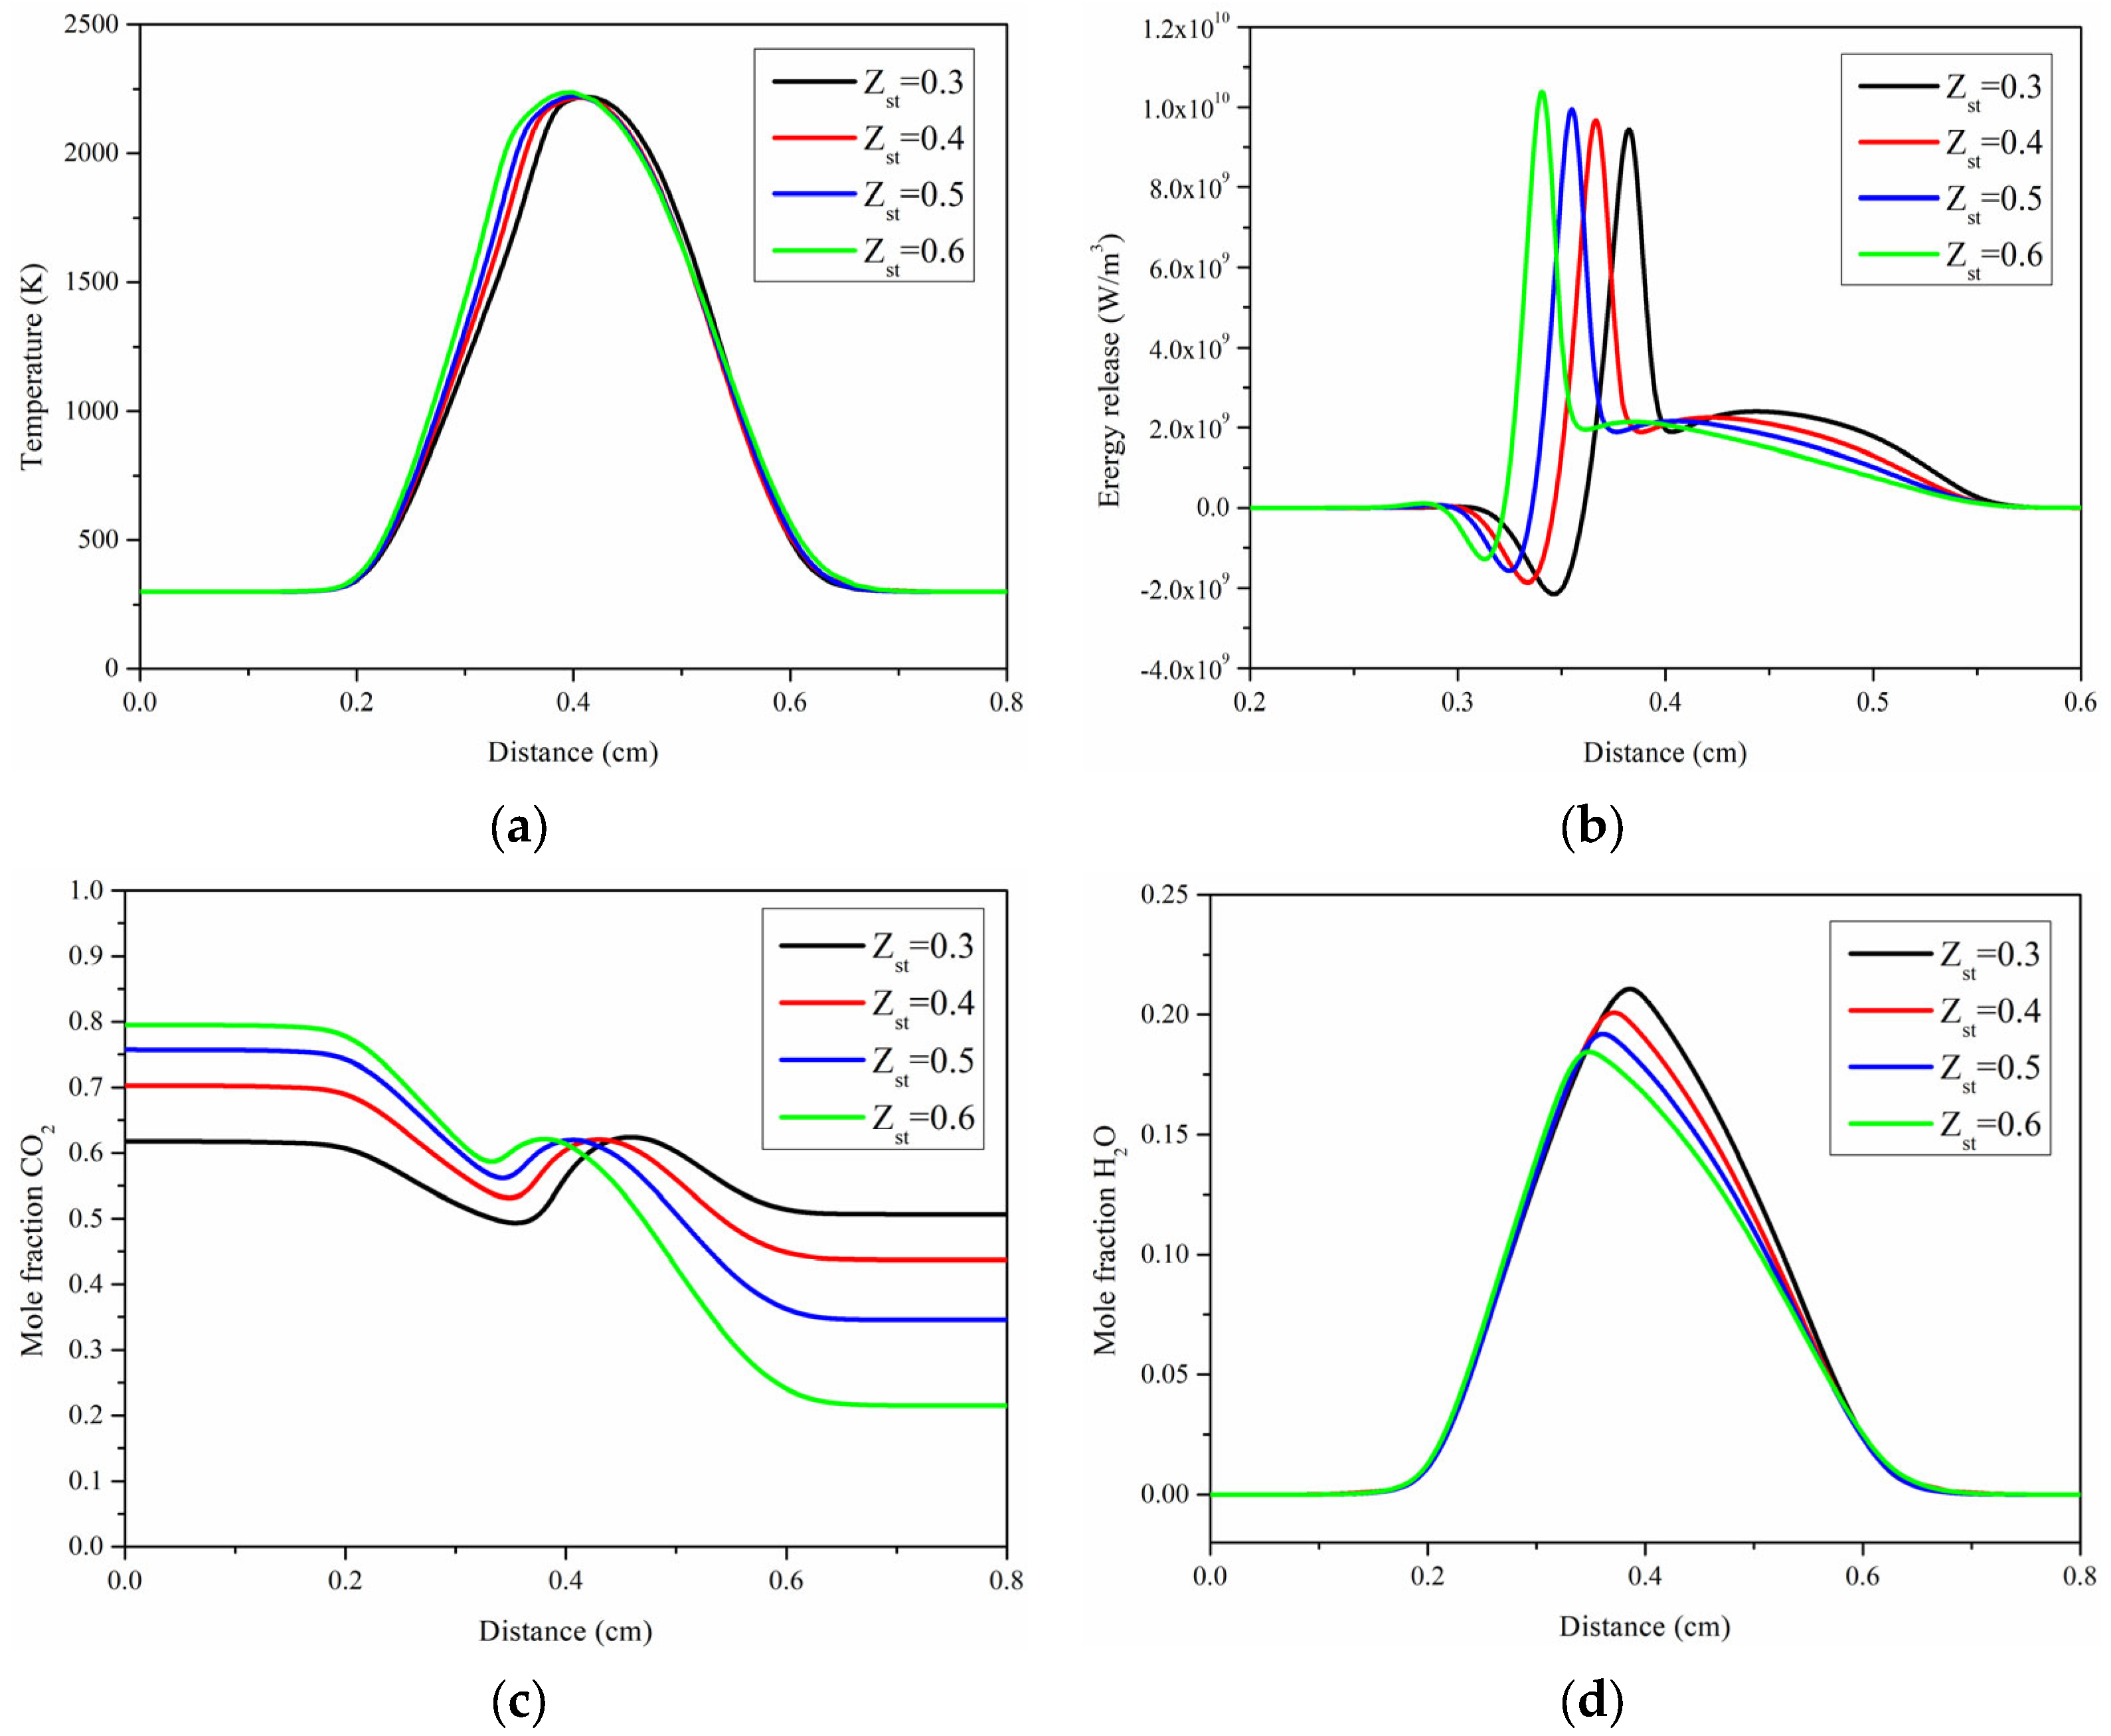
Figure 9 shows the distributions of temperature (a), heat generation (b), CO
2 mole fraction (c), and H
2O mole fraction (d) in cases 2.1–2.4. The peak temperature and the distribution of the temperature field do not differ much when Z
st varies from 0.3 to 0.6, while the high-temperature zone moves about 0.01 cm toward the fuel side.
Figure 9b shows the heat generation profiles of the group flames (cases 2.1–2.4) in different Z
st; the total energy release can be divided into three different regions: the endothermic fuel pyrolysis zone, the primary reaction zone near the maximum peak, and the secondary oxidation zone near the second peak. The peak in the secondary oxidation zone gradually fades with the increase of Z
st, because the pyrolysis zone becomes narrower and the peak of the endothermic fuel pyrolysis zone decreases. The radiation heat source of soot particles and gas is consistent with that of
Figure 7.
Since CO2 is required to dilute fuel and oxygen at the same time, with the increase of Zst, more and more CO2 is transferred from the oxidant side to the fuel side (the peak position has moved about 0.08 cm), making the four conditions in the boundary conditions of CO2 concentration change significantly. The concentrations of CO2 in the distributions vary widely in the nonreaction zone, hardly affecting radiation, while in the high-temperature reaction zone, the concentration of CO2 changes very little with Zst changing. At the same time, the H2O in all conditions is generated only in the reaction without external introduction. The trend of the distribution of concentrations of H2O in the four cases remains essentially unchanged; the peak value gradually decreases (the peak H2O concentration at Zst = 0.6 is 12.4% lower than that at Zst = 0.3) and the position moves closer to the fuel side (from 0.386 to 0.349 cm).
4.3. Effects of Temperature Distribution on Radiation
Cases 1.4, 2.2, and 3.1 have different Tad of 2300 K, 2500 K, and 2700 K, respectively, but all the flames have the same Zst (0.4).
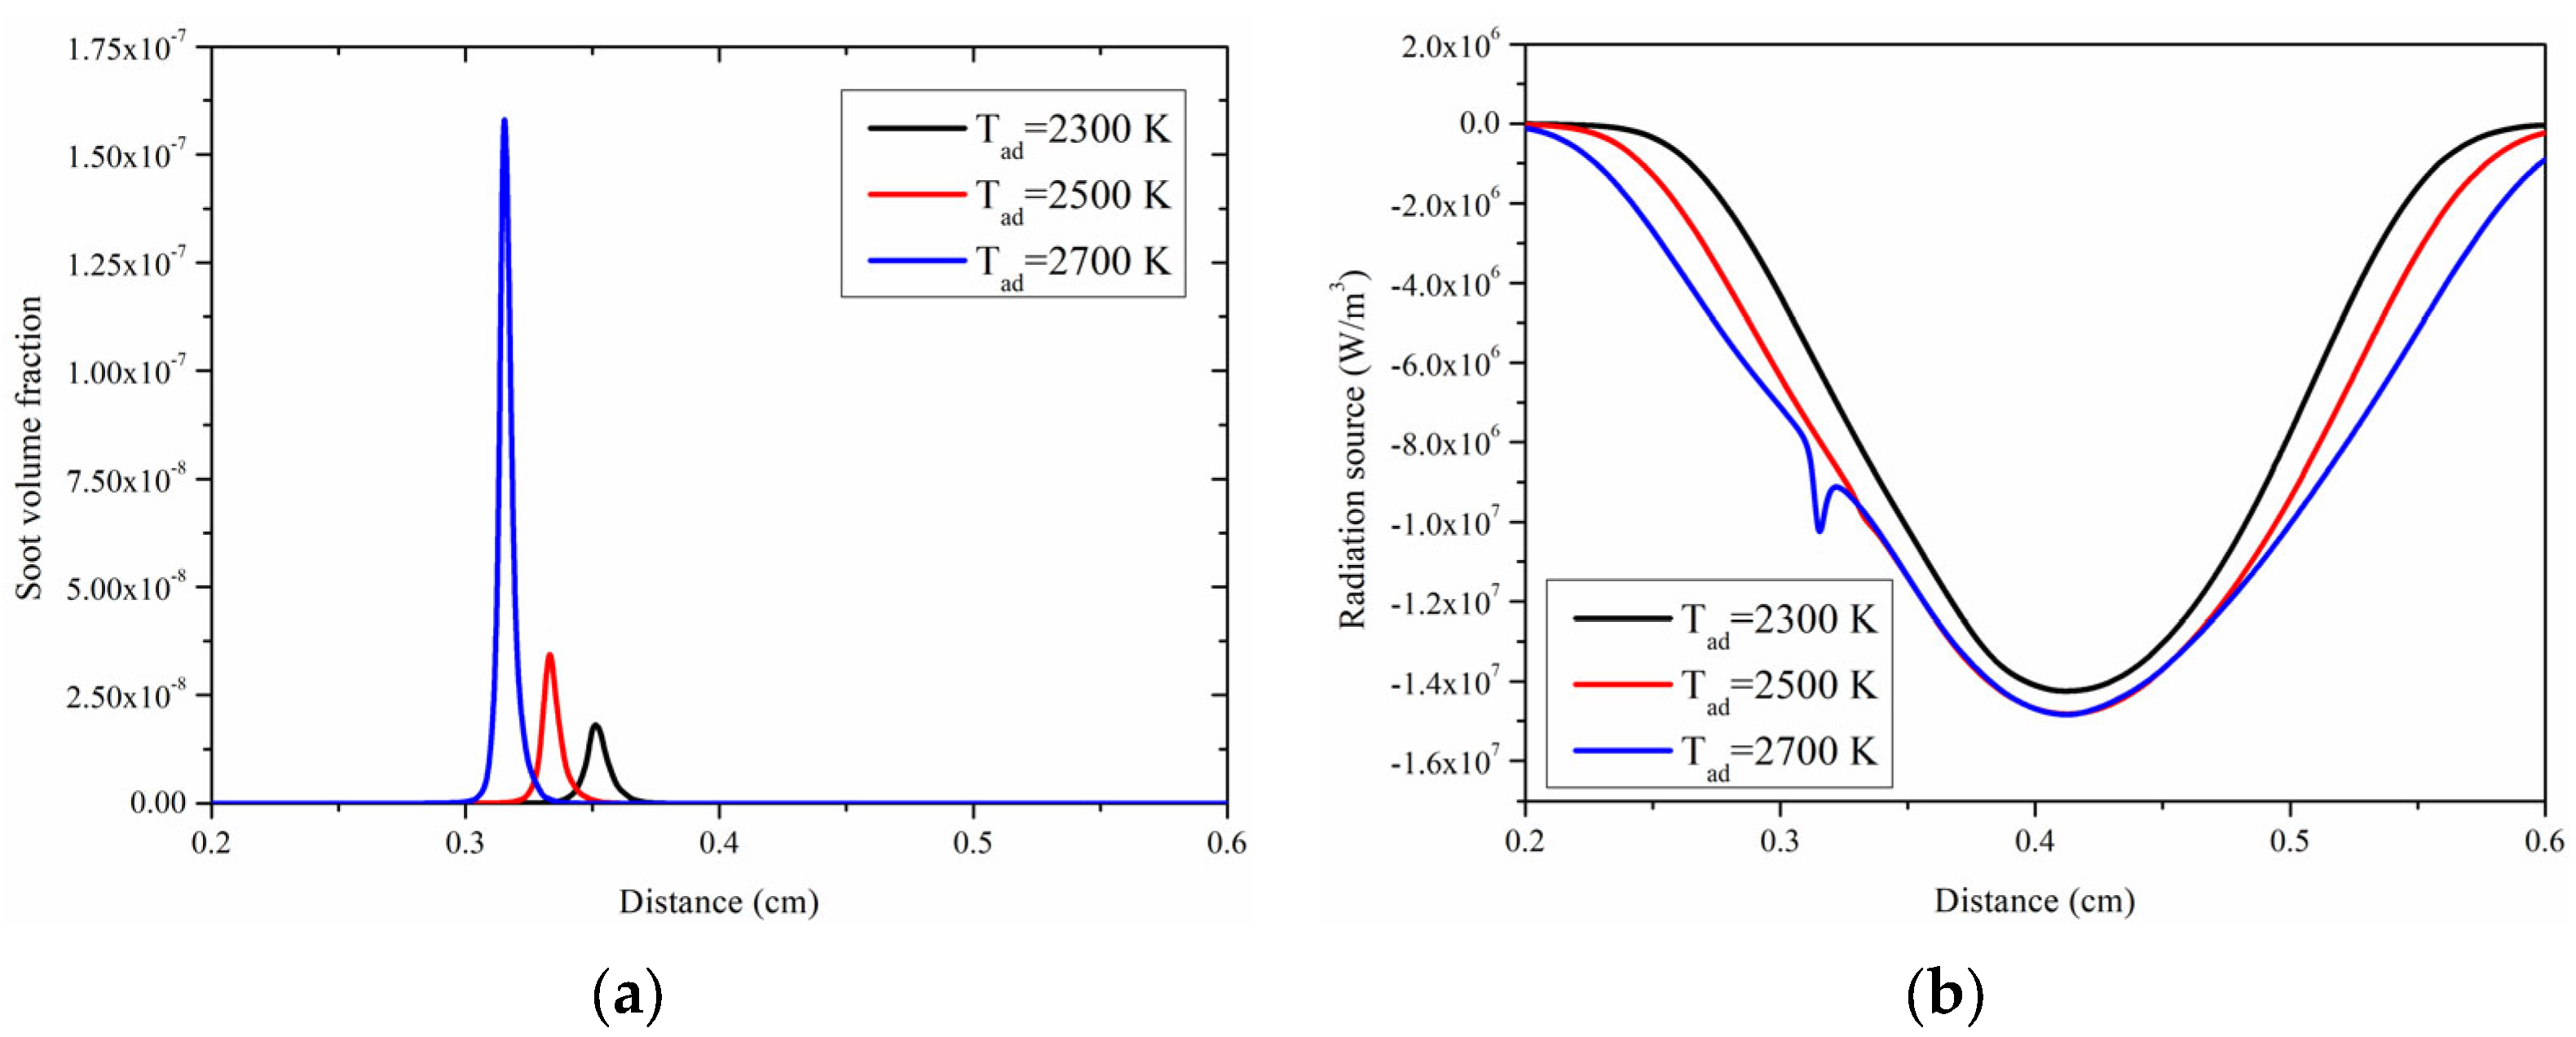
Figure 10 shows the SVF distributions and radiation source caused by soot and gases in cases 1.4, 2.2, and 3.1. With the increase of T
ad, soot formation gradually increases (from 0.019 to 0.205 ppm) and the distance between the peak SVF and the fuel nozzle drops from 0.35 to 0.315 cm. In
Figure 10, we note a lower peak in the radiation source curve of case 3.1 contributed by soot particles. It was found that the gas radiation did not change significantly with the increase of temperature, because the Planck mean absorption coefficient for CO
2 gradually decreased [
35], while the radiation distribution area gradually widened.
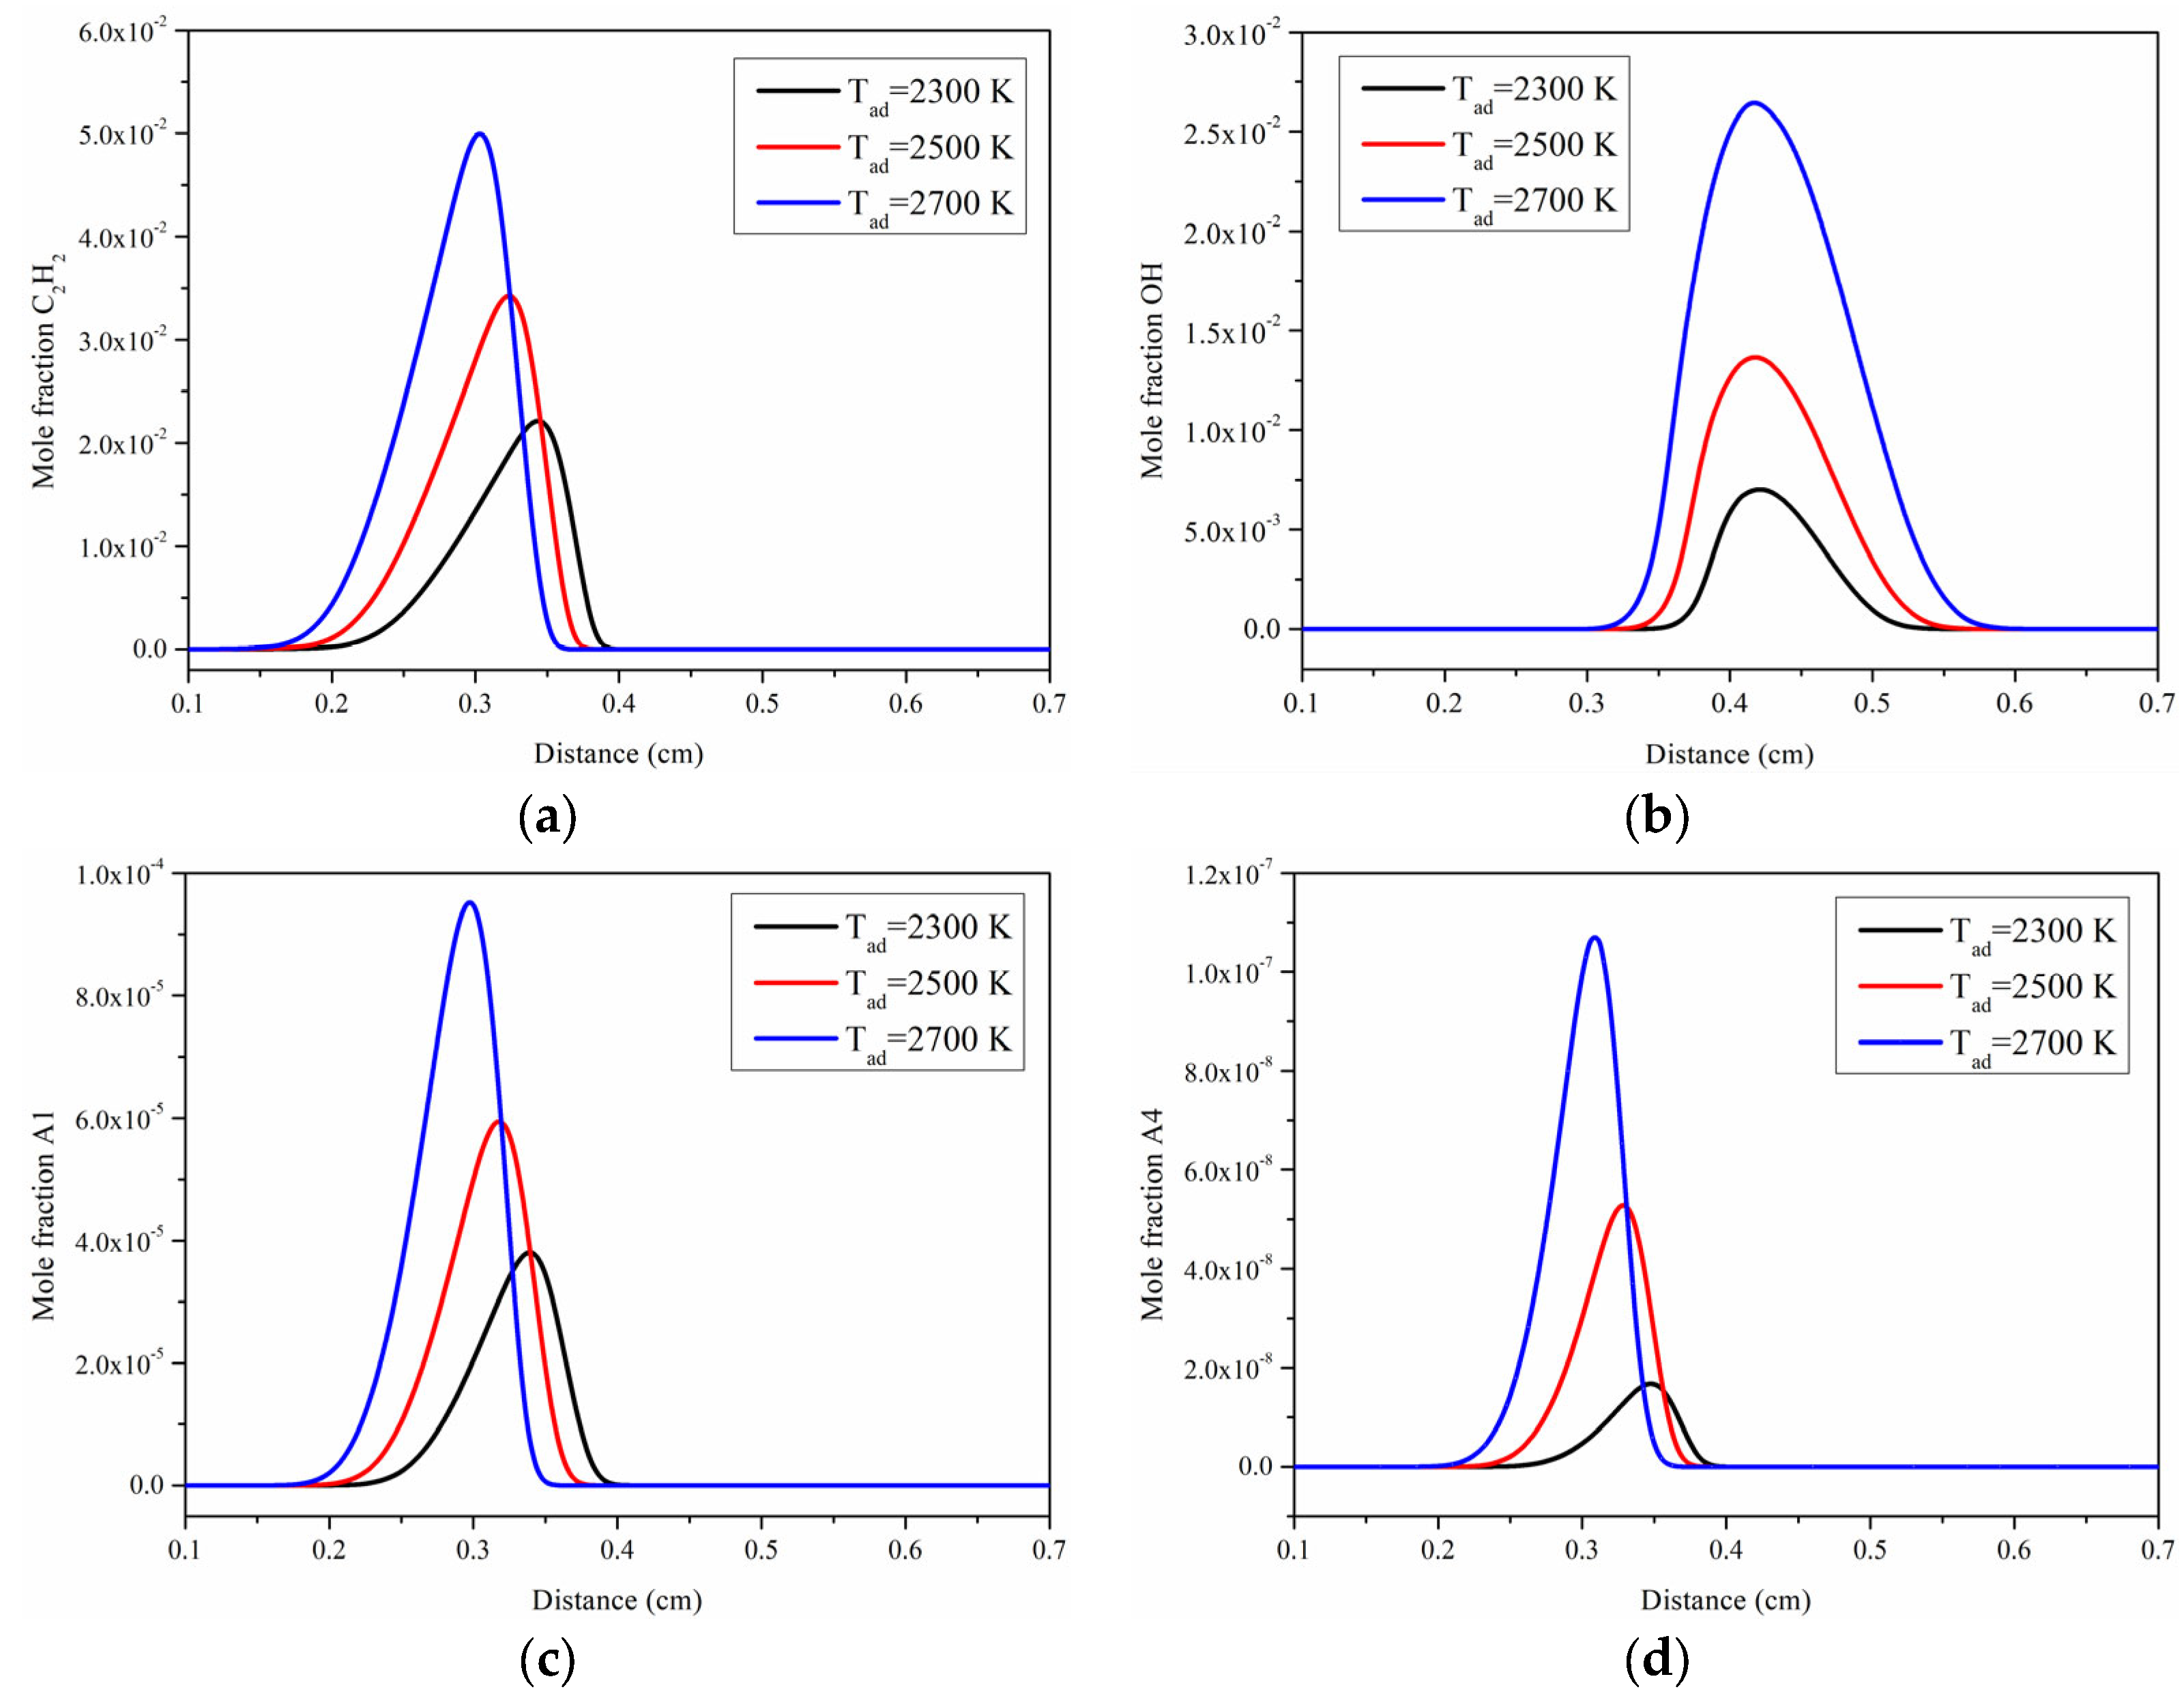
Figure 11 shows the mole fraction distributions of C
2H
2, OH, A1, and A4 in cases 1.4, 2.2, and 3.1. On the whole, whether it is conducive to the growth of soot (C
2H
2, A1, and A4 species), or not (OH species), the molar concentration of species increases with the increase of temperature. This shows that the formation and oxidation of soot particles are accelerated simultaneously; however, compared to the oxidation rate of soot, its formation rate is faster.
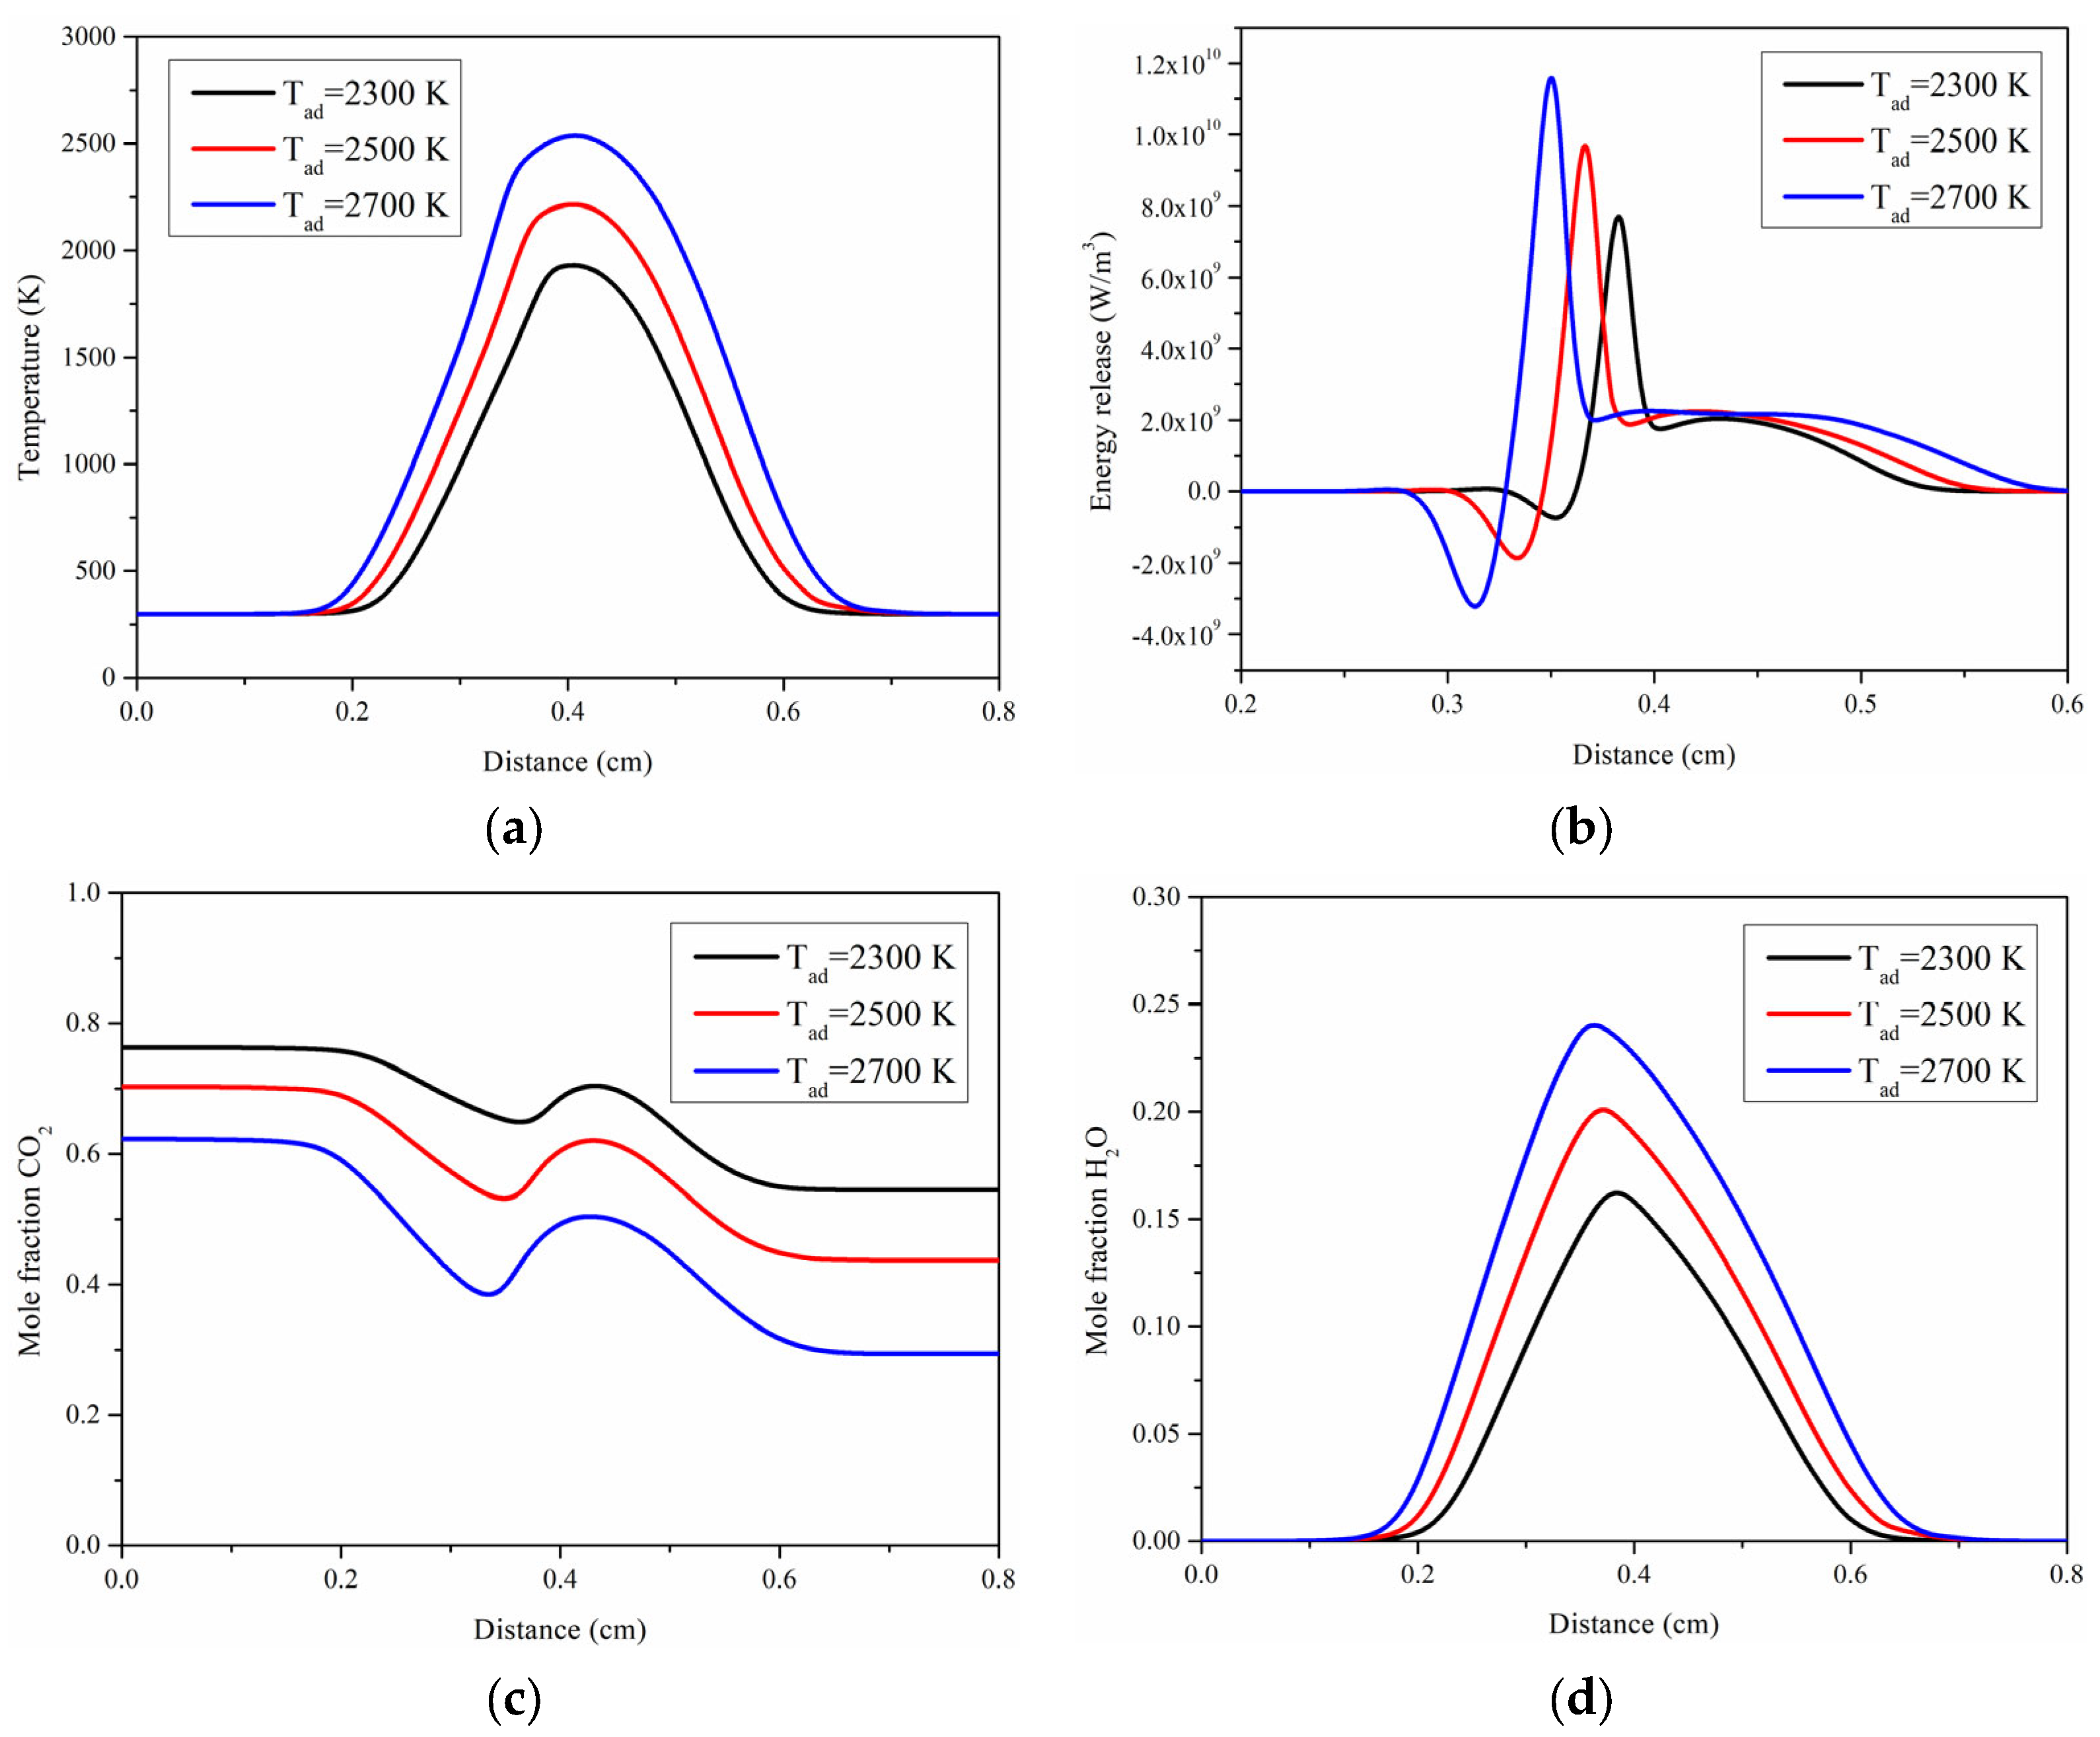
Figure 12 shows the distributions of temperature (a), heat generation (b), CO
2 mole fraction (c), and H
2O mole fraction (d) in cases 1.4, 2.2, and 3.1. The temperature area does not move significantly (about 0.4 cm), while the temperature increases significantly with a decrease in the total amount of CO
2 (for every 200 K increase in T
ad, the peak temperature increases by about 300 K). With a decrease in the total amount of CO
2 as a diluent, more fuel and oxidant are involved in reaction per unit volume, including pyrolysis of the fuel; in other words, more fuel is pyrolyzed and more heat is released, and eventually, the temperature of the flame becomes higher by unit volume as demonstrated in
Figure 12b.
Due to the highly strained nature of the counterflow flame, soot formation is low, compared to the coflow and other flames, such as flames in the actual coal-fired boiler, so the radiation from particles would change violently with the amount of RFG. Therefore, it must be emphasized that the practice of reducing the amount of RFG requires more experimental and theoretical research.


