Case Study of Anaerobic Digestion Process Stability Detected by Dissolved Hydrogen Concentration


Abstract
:1. Introduction
1.1. Variables Monitored during the Digestion Process
1.2. Sensors and the Measurement of the Parameters
2. Laboratory Testing
3. Results and Discussion
4. Conclusions
Author Contributions
Funding
Institutional Review Board Statement
Informed Consent Statement
Data Availability Statement
Conflicts of Interest
References
- Gujer, W.; Zehnder, A.J.B. Conversion processes in anaerobic digestion. Water Sci. Technol. 1983, 15, 127–167. [Google Scholar]
- Mužík, O.; Kára, J. Možnosti Výroby a Využití Bioplynu v ČR. Available online: https://biom.cz/cz/odborne-clanky/moznost-vyroby-a-vyuziti-bioplynu-v-cr (accessed on 17 January 2020).
- Dohányos, M.; Zábranská, J.; Jeníček, P. Anaerobní Technologie v Ochraně Životního Prostředí; Ministerstvo životního prostředí ČR: Praha, Czech Republic, 1996; 172p, ISBN 80-85368-90-0.
- Dohányos, M. Problematika Řízení a Kontroly Bioplynových Stanic. Available online: https://www.czba.cz/problematika-rizeni-a-kontroly-bioplynovych-stanic.html (accessed on 10 November 2019).
- Tvrzník, P.; Zeman, L.; Haitl, M. Bioplynové Stanice z Pohledu Výživy Zvířat. Available online: https://vuzv.cz/wp-content/uploads/2018/03/Studie-Zeman-bioplynky-na-web-2013.pdf (accessed on 6 January 2020).
- Méndez-Acosta, H.O.; Palacios-Ruiz, B.; Alcaraz-González, V.; González-Álvarez, V.; García-Sandoval, J.P. A robust control scheme to improve the stability of anaerobic digestion processes. J. Process Control 2010, 20, 375–383. [Google Scholar] [CrossRef]
- Feitkenhauer, H.; von Sachs, J.; Meyer, U. On-line titration of volatile fatty acids for the process control of anaerobic digestion plants. Water Res. 2020, 36, 212–218. [Google Scholar] [CrossRef]
- Yuan, H.; Zhu, N. Progress in inhibition mechanisms and process control of intermediates and by-products in sewage sludge anaerobic digestion. Renew. Sustain. Energy Rev. 2016, 58, 429–438. [Google Scholar] [CrossRef]
- Dohányos, M. Anaerobní Reaktor Není Černou Skřínkou—Teoretické Základy Anaerobní Fermentace. Available online: http://biom.cz/cz/odborne-clanky/anaerobni-reaktor-neni-cernou-skrinkou-teoreticke-zaklady-anaerobni-fermentace (accessed on 29 November 2019).
- Cord-Ruwisch, R.; Mercz, T.I.; Hoh, C.Y.; Strong, G.E. Dissolved Hydrogen Concentration as an On-Line Control Parameter for the Automated Operation and Optimization of Anaerobic Digesters. Biotechnol. Bioeng. 1997, 56, 626–634. Available online: https://www.ncbi.nlm.nih.gov/pubmed/18642334 (accessed on 3 March 2020). [CrossRef]
- Pauss, A.; Samson, R.; Guiot, S. Continuous measurement of dissolved H2 in an anaerobic reactor. Biotechnol. Bioeng. 1990, 35, 492–501. [Google Scholar] [CrossRef] [PubMed]
- Srinivasan, V.S.; Tarcy, G.P. Adaptation of Clark oxygen electrode for monitoring hydrogen gas. Anal. Chem. 1981, 53, 928–929. [Google Scholar] [CrossRef]
- Schelter, M.; Zosel, J.; Berthold, F.; Oelßner, W.; Guth, U.; Meinsberg Kurt-Schwabe Research Institute. Measurement of dissolved gases in anaerobic biogenic media. In Proceedings of the SENSOR+TEST Conferences 2011, Nürnberg, Germany, 7–9 June 2011; pp. 654–658, ISBN 978-3-9810993-9-3. [Google Scholar] [CrossRef]
- Archer, D.B.; Hilton, M.G.; Adams, P.; Wiecko, H. Hydrogen as a process control index in a pilot scale anaerobic digester. Biotechnol. Lett. 1986, 8, 197–202. [Google Scholar] [CrossRef]
- Strong, G.E.; Cord-Ruwisch, R. An in situ dissolved-hydrogen probe for monitoring anaerobic digesters under overload conditions. Biotechnol. Bioeng. 1995, 45, 63–68. [Google Scholar] [CrossRef] [PubMed]
- Dannetun, H.M.; Petersson, L.-G.; Söderberg, D.; Lundström, I. A hydrogen sensitive Pd-MOS structure working over a wide pressure range. Appl. Surf. Sci. 1984, 17, 259–264. [Google Scholar] [CrossRef]
- Drosg, B. Process Monitoring in Biogas Plants; IEA Bioenergy: Paris, France, 2013; ISBN 978-1-910154-03-8. [Google Scholar]
- Wilcox, S.J.; Hawkes, D.L.; Hawkes, F.R.; Guwy, A.J. A neural network, based on bicarbonate monitoring, to control anaerobic digestion. Water Res. 1995, 29, 1465–1470. [Google Scholar] [CrossRef]
- Aktiengesellschaft, D.S. Mochen: Biogas Plant Having State Monito-Ring for Fermentation. 2009. eP2379696A1, C12M1/107, C12P5/02. Available online: https://patentscope.wipo.int/search/en/detail.jsf?docId=EP30281988 (accessed on 10 March 2020).
- Nguyen, D.; Gadhamshetty, V.; Nitayavardhana, S.; Khanal, S.K. Automatic process control in anaerobic digestion technology: A critical review. Bioresour. Technol. 2015, 193, 513–522. [Google Scholar] [CrossRef] [PubMed]
- Liu, J.; Olsson, G.; Mattiasson, B. Control of an anaerobic reactor towards maximum biogas production. Water Sci. Technol. 2004, 50. [Google Scholar] [CrossRef]
- Gaida, D.; Wolf, C.; Bongards, M. Feed control of anaerobic digestion processes for renewable energy production: A review. Renew. Sustain. Energy Rev. 2017, 68 Pt 2, 869–875. [Google Scholar] [CrossRef]
- EN 15933:2012. Sludges, Treated Biowaste, Soils and Wastes—Determination of pH; BSI: London, UK, 2012. [Google Scholar]
- EN 15934:2012. Sludges, Treated Biowaste, Soils and Wastes—Calculation of the Total Solids Content after Determination of the Drying Residue or Water Content; BSI: London, UK, 2012. [Google Scholar]
- EN 15935:2012. Sludges, Treated Biowaste, Soils and Wastes—Determination of Loss on Ignition; BSI: London, UK, 2012. [Google Scholar]
- Lossie, U. Targeted Control of Biogas Plants with the Help of FOS/TAC; FOS/TAC Analysis; HACH Lange Servises: Salford, UK, 2008. [Google Scholar]


| Parameter | Symbol, Unit | Inoculum | Substrate | Digestate |
|---|---|---|---|---|
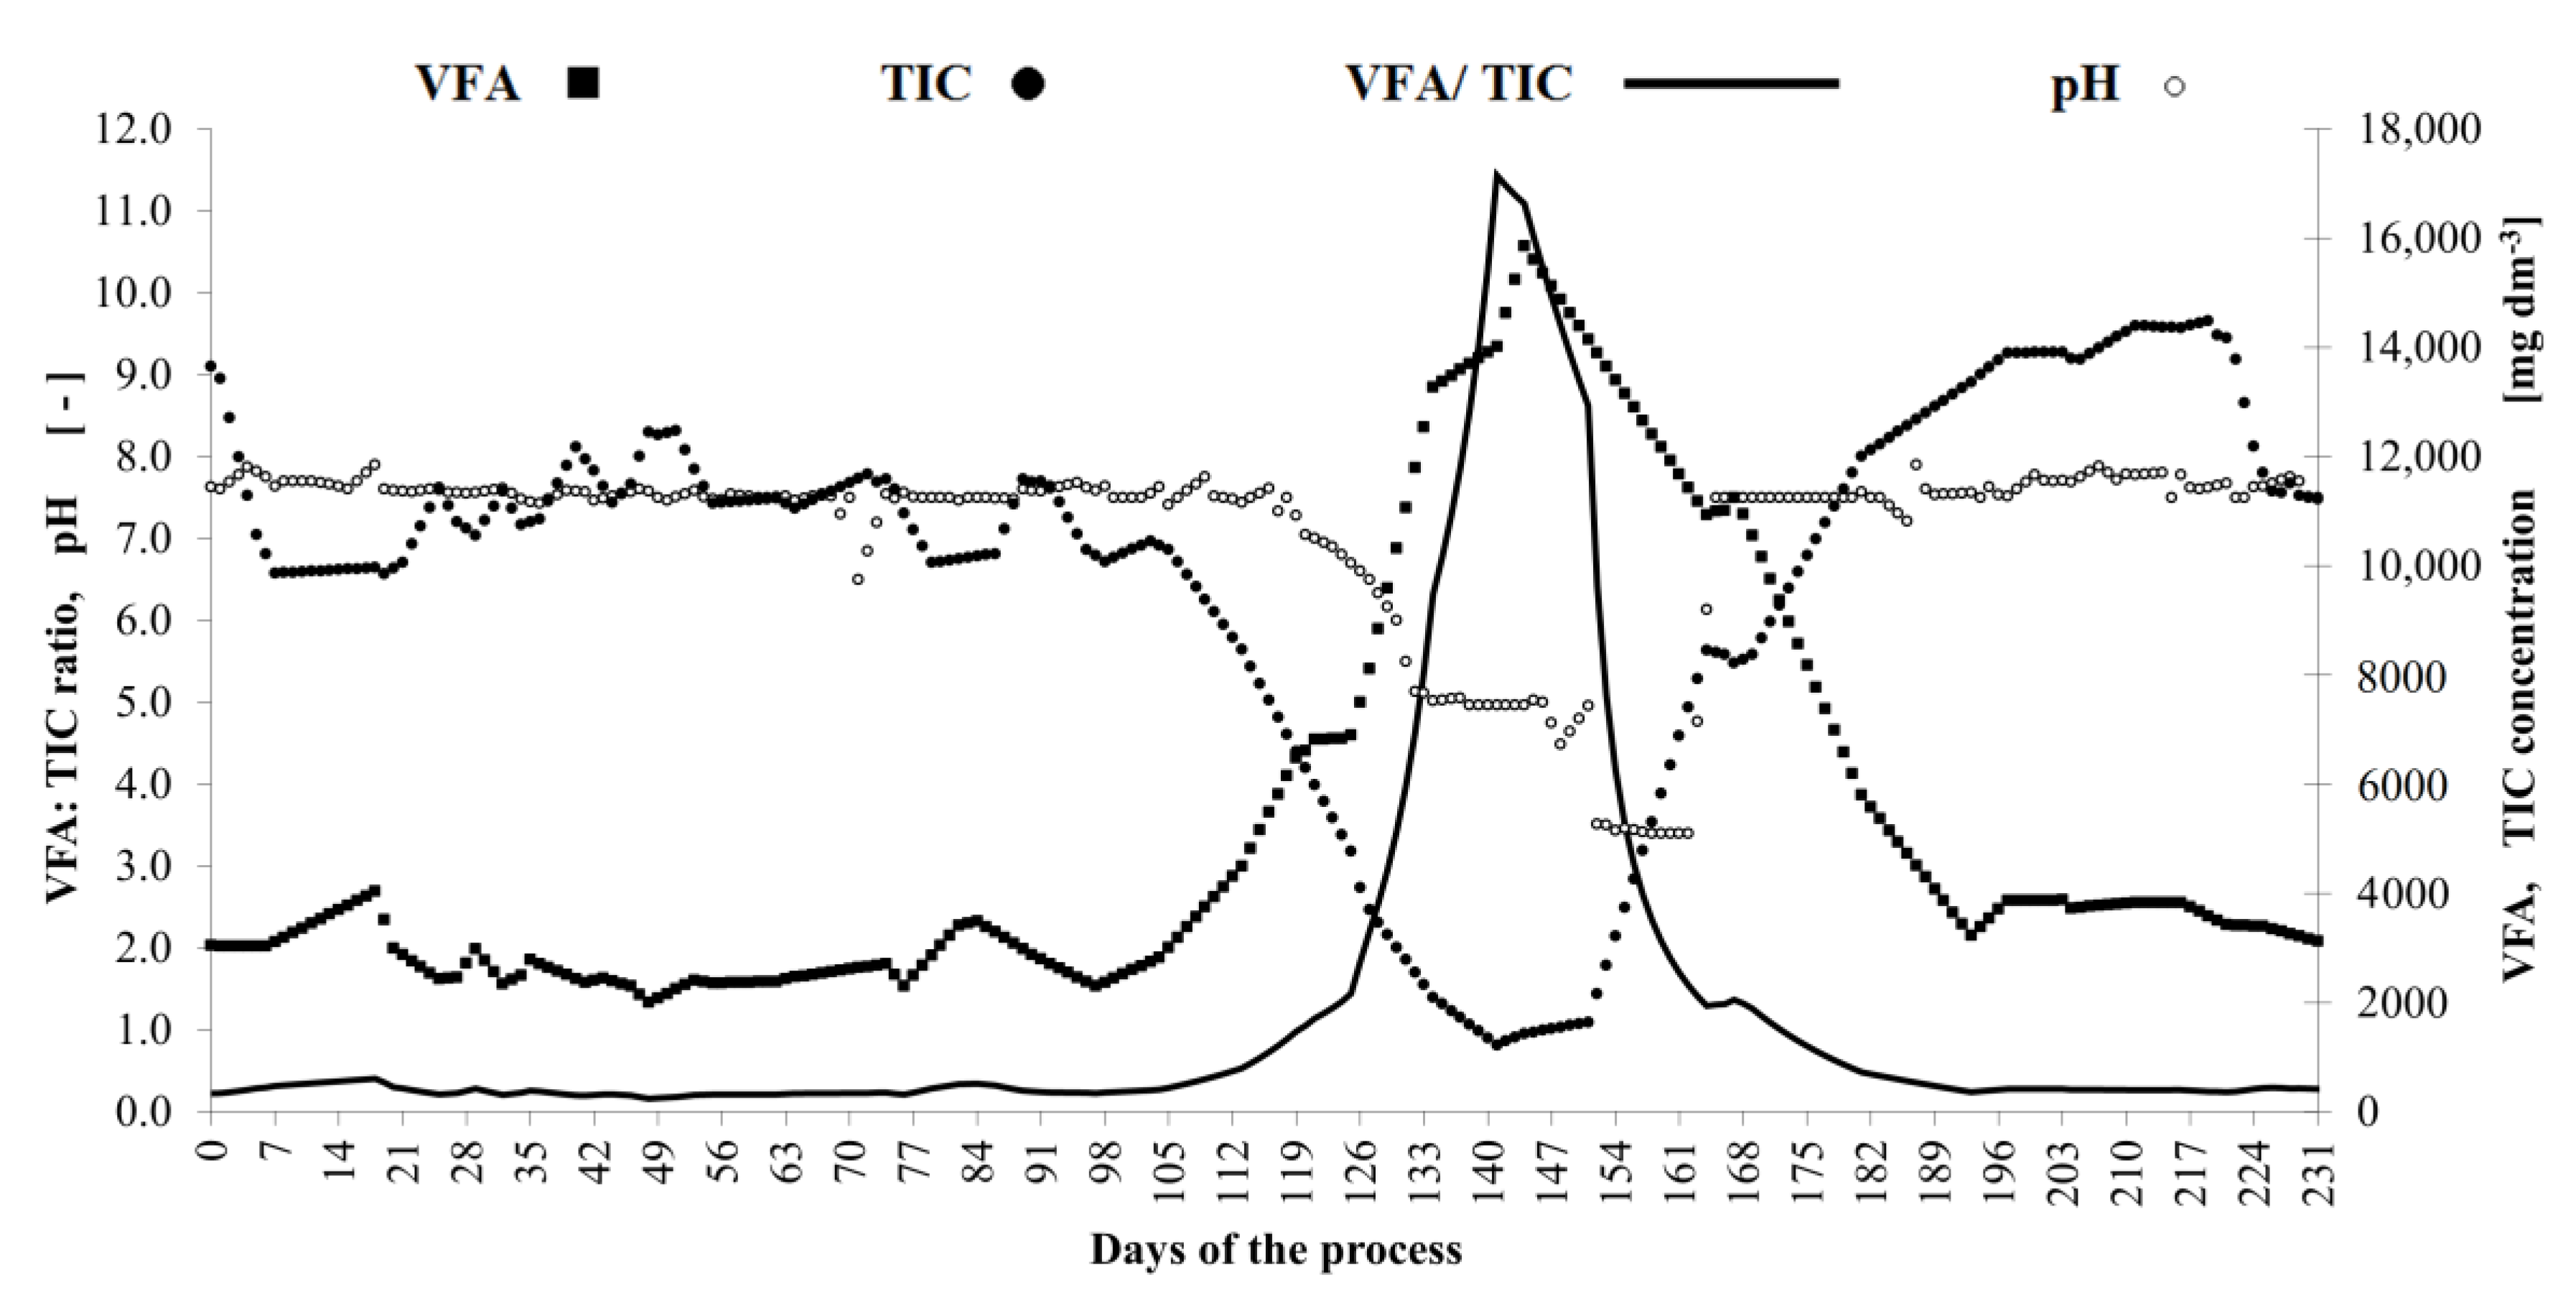
| Potential of Hydrogen | pH-H2O, - | 7.63 | 3.4–5.6; mean 4.2 | 3.4–7.9, mean 7.1 |
| Total Solids (105 °C) | TS, wt. % | 2.96 | 11.2–24.9; mean 16.4 | 2.2–5.4; mean 3.6 |
| Volatile Solids (550 °C) | VS, wt. %TS | 59.79 | 86.00–96.10; mean 92.90 | 50.00–70.60; mean 61.30 |
| Volatile Fatty Acids | VFA, mg dm−3 | 3050 | - | 1999–15,856; mean 5352 |
| Total Inorganic Carbonate | TIC, mg dm−3 | 13,650 | - | 1226–14,489; mean 9773 |
| Digestion Stability Ratio | VFA/TIC, - | 0.223 | - | 0.161–11.431; mean 1.323 |
Publisher’s Note: MDPI stays neutral with regard to jurisdictional claims in published maps and institutional affiliations. |
© 2021 by the authors. Licensee MDPI, Basel, Switzerland. This article is an open access article distributed under the terms and conditions of the Creative Commons Attribution (CC BY) license (http://creativecommons.org/licenses/by/4.0/).
Share and Cite
Platošová, D.; Rusín, J.; Platoš, J.; Smutná, K.; Buryjan, R. Case Study of Anaerobic Digestion Process Stability Detected by Dissolved Hydrogen Concentration. Processes 2021, 9, 106. https://doi.org/10.3390/pr9010106
Platošová D, Rusín J, Platoš J, Smutná K, Buryjan R. Case Study of Anaerobic Digestion Process Stability Detected by Dissolved Hydrogen Concentration. Processes. 2021; 9(1):106. https://doi.org/10.3390/pr9010106
Chicago/Turabian StylePlatošová, Daniela, Jiří Rusín, Jan Platoš, Kateřina Smutná, and Roman Buryjan. 2021. "Case Study of Anaerobic Digestion Process Stability Detected by Dissolved Hydrogen Concentration" Processes 9, no. 1: 106. https://doi.org/10.3390/pr9010106
APA StylePlatošová, D., Rusín, J., Platoš, J., Smutná, K., & Buryjan, R. (2021). Case Study of Anaerobic Digestion Process Stability Detected by Dissolved Hydrogen Concentration. Processes, 9(1), 106. https://doi.org/10.3390/pr9010106