Article

Identifying Shared Risk Genes between Nonalcoholic Fatty Liver Disease and Metabolic Traits by Cross-Trait Association Analysis

1
Key Laboratory of Intelligent Computing and Information Processing of Ministry of Education and Hunan Key Laboratory for Computation and Simulation in Science and Engineering, Xiangtan University, Xiangtan 411105, China
2
School of Mathematics and Statistics, Hubei Normal University, Huangshi 435002, China
3
School of Electrical Engineering and Computer Science, Queensland University of Technology, Brisbane, QLD 4001, Australia
*
Author to whom correspondence should be addressed.
Processes 2021, 9(1), 107; https://doi.org/10.3390/pr9010107
Submission received: 10 December 2020 / Revised: 27 December 2020 / Accepted: 3 January 2021 / Published: 7 January 2021
(This article belongs to the Special Issue Recent Advances in Evolutionary Genomics & Bioinformatics)

Abstract

:
Nonalcoholic fatty liver disease (NAFLD) generally co-occurs with metabolic disorders, but it is unclear which genes have a pleiotripic effect on NAFLD and metabolic traits. We performed a large-scale cross-trait association analysis to identify the overlapping genes between NAFLD and nine metabolic traits. Among all the metabolic traits, we found that obesity and type II diabetes are associated with NAFLD. Then, a multitrait association analysis among NAFLD, obesity and type II diabetes was conducted to improve the overall statistical power. We identified 792 significant variants by a cross-trait meta-analysis involving 100 pleiotripic genes. Moreover, we detected another two common genes by a genome-wide gene test. The results from the pathway enrichment analysis show that the 102 shared risk genes are enriched in cancer, diabetes, insulin secretion, and other related pathways. This study can help us understand the molecular mechanisms underlying comorbid NAFLD and metabolic disorders.

1. Introduction

Nonalcoholic fatty liver disease (NAFLD) refers to fat accumulation in at least 5% of hepatocytes without excessive alcohol intake. It encompasses the spectrum of disease from simple steatosis to nonalcoholic steatohepatitis (NASH) with hepatic inflammation and hepatocyte ballooning. The distinction between these diseases is important because steatosis is less likely to evolve into severe, liver-related complications, whereas NASH might progress to liver cirrhosis and hepatocellular carcinoma [1]. NAFLD is currently recognized as the most common liver disease worldwide [2]. It was estimated that NAFLD affected more than one-third of the population globally and 20 million people would eventually die of NAFLD-related liver diseases [3]. The prevalence of NAFLD is increasing with the dramatic escalation of metabolic syndrome [4]. Metabolic syndrome is defined as the presence of three or more of the following clinical symptoms: abdominal obesity, hypertension, elevated triglycerides, reduced high-density protein cholesterol (HDL) and impaired fasting glucose [5].
Clinical and epidemiological studies showed that NAFLD and metabolic abnormality often coexist in either one patient or different members of the same family [6]. It has been reported that 30–100% of NAFLD patients are obese individuals; type II diabetes is present in 10–75% of NAFLD patients; low HDL affects 64% of NAFLD patients; the prevalence of hypertriglyceridemia in NAFLD patients is 30–42%; the incidence of NAFLD in nonobese, nondiabetic patients with primary hypertension is more than twofold that in the control group [5]. These observations on co-occurrence suggest that there exists comorbidity between NAFLD and metabolism. The high rate of comorbidity may be due to the shared genetic factors and a common molecular mechanism.
NAFLD and metabolic disorders are highly heritable traits [5,7]. Previous twin studies reported substantial genetic correlations between hepatic steatosis and metabolic traits, including HDL (r = 0.451), triglyceride (r = 0.678), hypertension (r = 0.444), obesity (r = 0.534) and diabetes (r = 0.716) [8]. In addition, the liver has been pointed out to be a key determinant of metabolic abnormalities and NAFLD has been considered as a cause and a consequence of metabolic syndrome [9]. Furthermore, a recent study revealed the causal relationship between NAFLD, type II diabetes and obesity by using the Mendelian randomization analysis framework [10]. These studies also demonstrate the existence of shared genetic components between NAFLD and metabolic traits. Identifying shared risk factors among different complex traits is a hot topic at present. For example, shared genetic architectures have been identified between metabolic traits and Alzheimer’s disease [11], seven psychiatric traits [12], chronic obstructive pulmonary disease and cardiovascular disease-related traits [13] and so on. In addition, our previous study integrated multitrait and multiomics approaches to identify shared risk genes for asthma, hay fever and eczema [14].
To date, several genome-wide association studies (GWASs) have been carried out on NAFLD and each of the metabolic traits. Some genes (such as PNPLA3 for NAFLD, FTO for obesity and TCF7L2 for type II diabetes) have been successfully discovered and confirmed [15,16,17,18]. In addition, murine NAFLD models and their potential human relevance were also illustrated [1]. However, it is still unclear which genes have a pleiotropic effect on NAFLD and metabolic traits. Therefore, identifying the shared risk genes of NAFLD and metabolic traits may help us uncover the common genetic architecture and may play a positive role in understanding the disease etiology.
In this study, we first estimated the genetic correlations of NAFLD with nine metabolic traits. Then, we conducted a multitrait association analysis among NAFLD and its genetically related traits to improve the overall statistical power. Moreover, we performed a cross-trait meta-analysis and gene test to identify the pleiotropic variants and shared risk genes. Finally, we undertook a transcriptome-wide association study (TWAS), a pathway enrichment analysis and protein–protein interaction (PPI) network analysis to obtain biological insight of the shared risk genes between NAFLD and its related traits.

2. Materials and Methods

2.1. Data Source

We downloaded the GWAS results from public databases, including NAFLD from the Scalable and Accurate Implementation of GEneralized mixed model (SAIGE) database [19]; hypertension (HTN), obesity and type II diabetes mellitus (T2D) from GWASATLAS database [20]; low-density lipoproteins (LDL), high-density lipoproteins (HDL), triglyceride (TC) and total cholesterol (TG) from The Global Lipids Genetics Consortium (GLGC) website [21]; fasting glucose (FG) and fasting insulin (FIN) from the Meta-Analyses of Glucose and Insulin-related Traits Consortium (MAGIC) website [22]. All the individuals in the SAIGE and GWASATLAS databases are from the UK Biobank (UKBB) study [23]. Detailed GWAS results for each phenotype are listed in Table 1.

2.2. Linkage Disequilibrium Score Regression Analysis

In order to quantitatively measure the genetic correlation between NAFLD and nine metabolic traits, we used linkage disequilibrium score regression (LDSC) to conduct a post-GWAS genome-wide genetic correlation analysis. Notice that all SNPs in the GWAS results were merged with HapMap3 SNPs after excluding those in the HLA region as recommended [11]. In addition, LDSC enables us to estimate the heritability of each trait, as well as the LD-score intercepts which can indicate whether the inflation in GWAS is caused by population structure or sample overlap [24].

2.3. Multitrait Association Analysis

After assessing genetic correlations, we conducted a multitrait association analysis among NAFLD and its genetically related metabolic traits to boost statistical power using MTAG software. The key idea of MTAG is that, when GWAS results from different traits are correlated, the effect estimates of each trait can be improved by appropriately integrating the information from the GWAS results of other traits [25]. Moreover, MTAG can generate trait-specific effect estimates for each SNP.

2.4. Cross-Trait Meta-Analysis

We applied RE2C cross-trait meta-analysis to identify the pleiotropic variations among NAFLD and its related metabolic traits based on the trait-specific GWAS results after MTAG analysis. RE2C is a random effect model to detect the heterogeneous effects of various GWAS results [26]. When we use RE2C software, the correlation matrix is made of the corresponding genetic correlation between each of the two traits. As a result of the GWAS results retrieved from different methods, the regression coefficients are represented as either the SNP effect sizes or odds ratios (ORs). We transformed logOR from logistic regressions for case-control studies into the equivalent regression coefficients obtained on the quantitative scale by the following formula [13]:
logOR = b e t a N c a s e N c o n t r o l ( 1 N c a s e N c o n t r o l )
where beta is the SNP effect size, and Ncase and Ncontrol represent the number of cases and controls, respectively.
To determine significant loci (p < 5 × 10⁻⁸) that are independent of each other and genes within the range, we used the clumping function of PLINK software [27] with parameters --clump-p1 5 × 10⁻⁸ --clump-p2 1 × 10⁻⁵ --clump-r2 0.05 --clump-kb 500 --clump-range NCBI.37.3.gene.loc [13], i.e., the SNPs with a p-value less than 1 × 10⁻⁵, LD statistic r2 more than 0.05, and within 500 kb distance from the peak will be assigned to that peak’s clump; parameter NCBI.37.3.gene.loc is the reference gene list file, which contains all the locations of gene in NCBI human genome build 37.

2.5. Genome-Wide Gene Test

In order to obtain more overlapping genes, we also conducted a genome-wide gene test based on the adjusted GWAS results (i.e., after MTAG analysis) for NAFLD and its related metabolic traits. The genome-wide gene test was performed using MAGMA (version 1.07) software [28], with gene annotation from NCBI human genome build 37 (including 19,427 gene locations) as reference. The significance threshold after Bonferroni correction was determined as 2.57 × 10⁻⁶ (= 0.05/19,427). MAGMA analysis can identify the genes with significant association for each disease or trait.

2.6. Transcriptome-Wide Association Study, Pathway Enrichment Analysis, and Protein–Protein Interaction Network Analysis

We performed a transcriptome-wide association study (TWAS) using FUSION software [29] to detect significant genes whose cis-regulated expression is associated with NAFLD and its related metabolic traits in specific tissues. In our study, TWAS was based on 43 GTEx (version 6) tissues expression weights. The Benjamin–Hochberg method (false discovery rate <0.05) was used for gene-tissue pairs of each trait on p-values to account for multiple test correction. In order to understand the underlying biological pathways for the identified shared risk genes between NAFLD and its related metabolic traits, we used the tool Enrichr [30] to implement the Kyoto Encyclopedia of Genes and Genomes (KEGG) pathway enrichment analysis. The significant criterion is the adjusted p-value less than 0.05. In addition, we applied STRING (version 10) [31] to analyze the protein–protein interaction (PPI) network.
The overall study design is shown in Figure 1.

3. Results

3.1. Genetic Correlation between NAFLD and Metabolic Traits

LDSC was used to estimate the genetic correlation rg (ranging from −1 to 1) between NAFLD and nine metabolic traits. p < 0.05 or rg > 10% between two traits was considered to be significant [13]. We found a significant correlation (rg = 0.2106, p = 0.0132) between NAFLD and type II diabetes. Although the p-value between NAFLD and obesity did not reach the statistical significance level of 0.05, its genetic correlation rg was larger than 10%, so obesity was also considered to be significantly correlated with NAFLD. We did not observe a significant correlation between NAFLD and the other seven metabolic traits. Detailed results of genetic correlation are shown in Table 2.

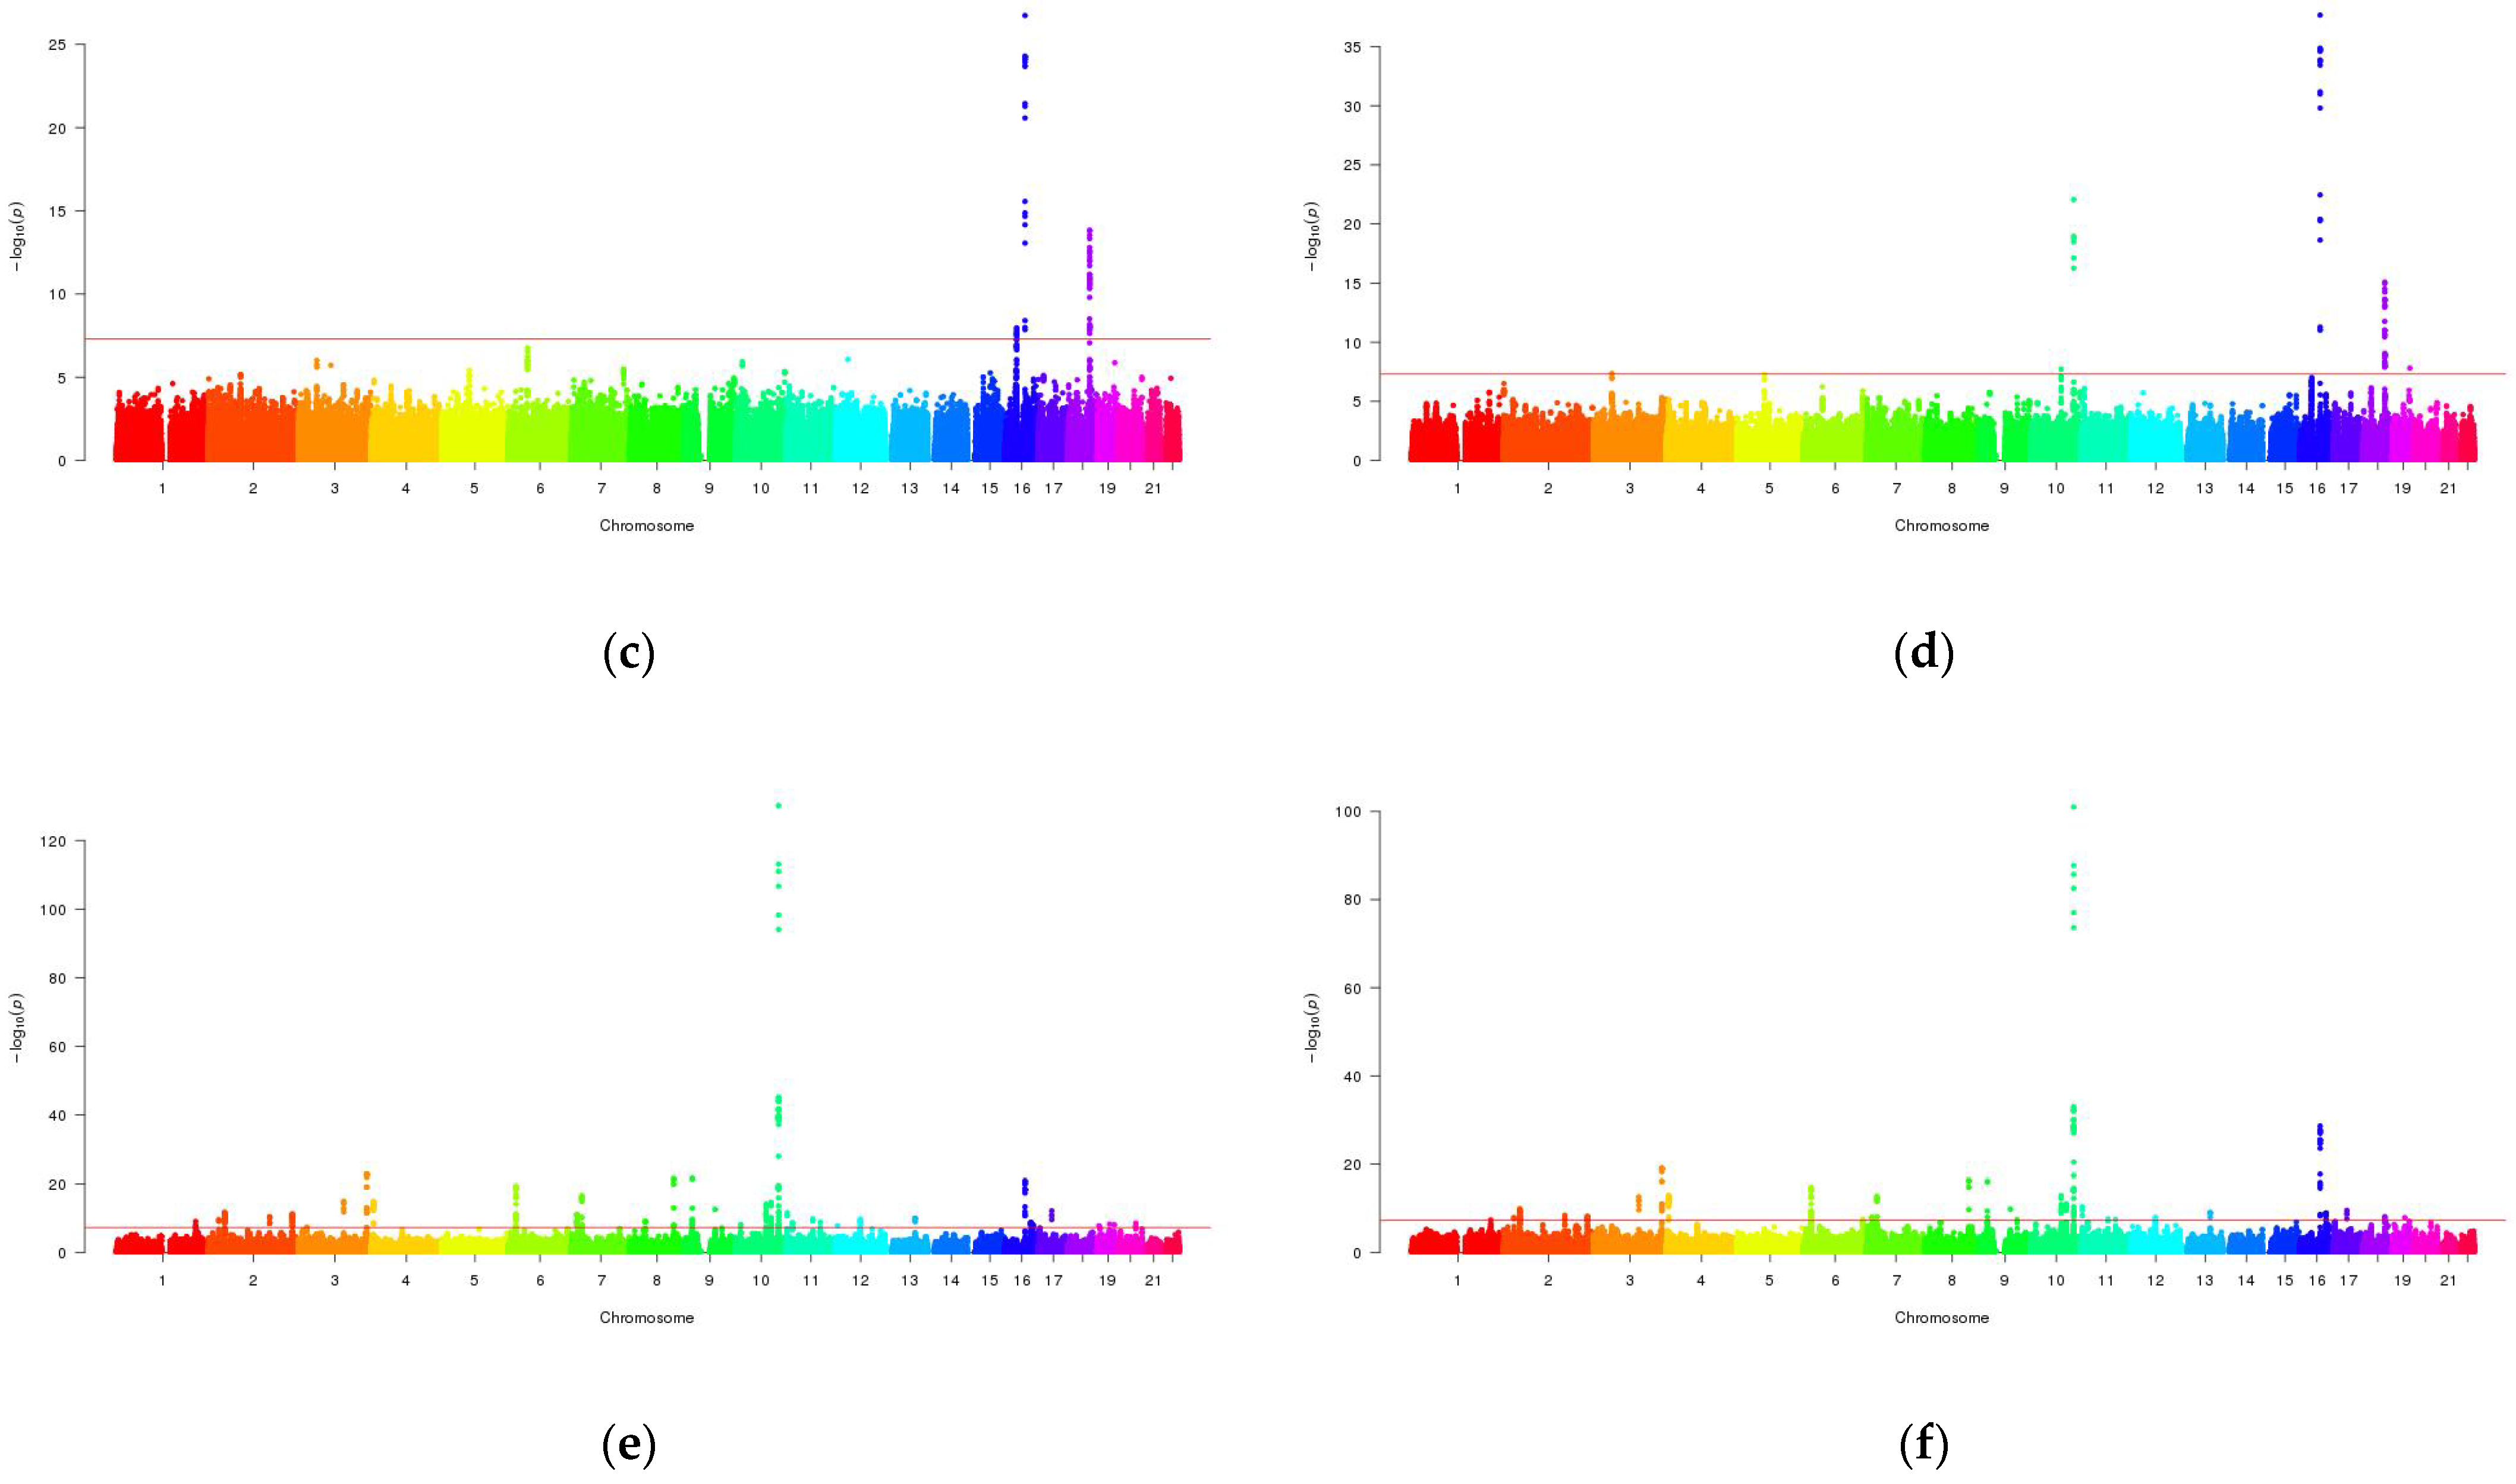
3.2. Mutli-Trait Association Analysis between NAFLD and Metabolic Traits

Given the significant genetic correlations between NAFLD and its two related metabolic traits (obesity and type II diabetes), we improved the overall statistical power to detect novel loci by conducting MTAG multitrait association analysis. After MTAG analysis, the number of significant loci in the GWAS result of NAFLD increases from 24 to 157, and the distribution of locations is more extensive (from chromosomes 19, 22 to chromosomes 2, 3, 4, 6, 7, 8, 9, 10, 16, 22). With regard to obesity, the number of significant loci slightly decreases (from 67 to 65), but the locations broaden from chromosomes 16, 18 to chromosomes 3, 10, 16, 18, 19. Several loci (rs2518796 on chromosome 3, rs3810291 on chromosome 19, and other seven significant loci (rs697237, rs7901695, rs7903146, rs4132670, rs7074440, rs12243326, rs12255372) on chromosome 10 were newly detected. With regard to type II diabetes, the number of significant loci decreases from 385 to 284; however, the distribution of these significant loci is essentially unchanged, both being located on chromosomes 1, 2, 3, 4, 6, 7, 8, 9, 10, 11, 12, 13, 16, 17, 19. In addition, we also explored the independent significant loci, the number of which increased from 2 to 16 for NAFLD, from 3 to 6 for obesity, and decreased from 41 to 34 for type II diabetes. The Manhattan plots of NAFLD, obesity and type II diabetes before and after MTAG analysis are displayed in Figure 2.

3.3. Cross-Trait Meta-Analysis between NAFLD and Metabolic Traits

We identified 792 significant pleiotropic variants, in which 85 loci are independent, involving 100 pleiotropic genes in the region. The strongest association signal rs7903146 (located on chromosome 10, PRE2C = 6.95 × 10−206) is mapped to TCF7L2, which is a well-known gene susceptible to type II diabetes [32]. Moreover, it was reported that TCF7L2 is independently associated with NAFLD in Asian Indians [33], and its effect on type II diabetes risk is modulated by obesity in European populations [34]. The second strongest signal is found on FTO (rs1421085, located on chromosome 16, PRE2C = 4.47 × 10⁻³⁴). FTO is the first obesity-susceptibility gene identified by GWAS, and it has been termed the “fat gene” [35]. The next three strongest signals are observed on IGF2BP2 (rs7651090, located on chromosome 3, PRE2C = 9.28 × 10⁻³⁴), CDKAL1 (rs2206734, located on chromosome 6, PRE2C = 1.61 × 10⁻³²), and SLC30A8 (rs13266634, located on chromosome 8, PRE2C = 1.79 × 10⁻³¹), respectively. They were all proved to be associated with type II diabetes [36]. In addition, the key gene PNPLA3 (rs738408, located on chromosome 22 PRE2C = 6.84 × 10⁻²⁰) for NAFLD was also successfully detected [37]. Partial results of the RE2C cross-trait meta-analysis are shown in Table 3 (the full results are shown in Table S1). The functional relevance of genes in Table 3 is listed in Table S2.

3.4. Overlapping Genes in Genome-Wide Gene Analysis

We used MAGMA genome-wide gene analysis to identify the genes associated with NAFLD, obesity and type II diabetes. After Bonferroni correction, 18, 18, and 26 genes (PMAGMA < 2.57 × 10⁻⁶) were tested to be significantly associated with NAFLD, obesity, and type II diabetes, respectively. NAFLD and type II diabetes have 16 overlapping genes, NAFLD and obesity have six overlapping genes, obesity and type II diabetes have six overlapping genes. There are six genes (IGF2BP2, SLC22A3, ZMIZ1, TCF7L2, FTO, and NPC1) significantly associated with all the three diseases, in which IGF2BP2, TCF7L2 and FTO are the top three genes identified by RE2C analysis. Moreover, SLC22A3 and NPC1 are the two overlapping genes only detected by MAGMA analysis. The results of genome-wide gene test are shown in Table 4 and the functional relevance of genes in Table 4 is also listed in Table S2.

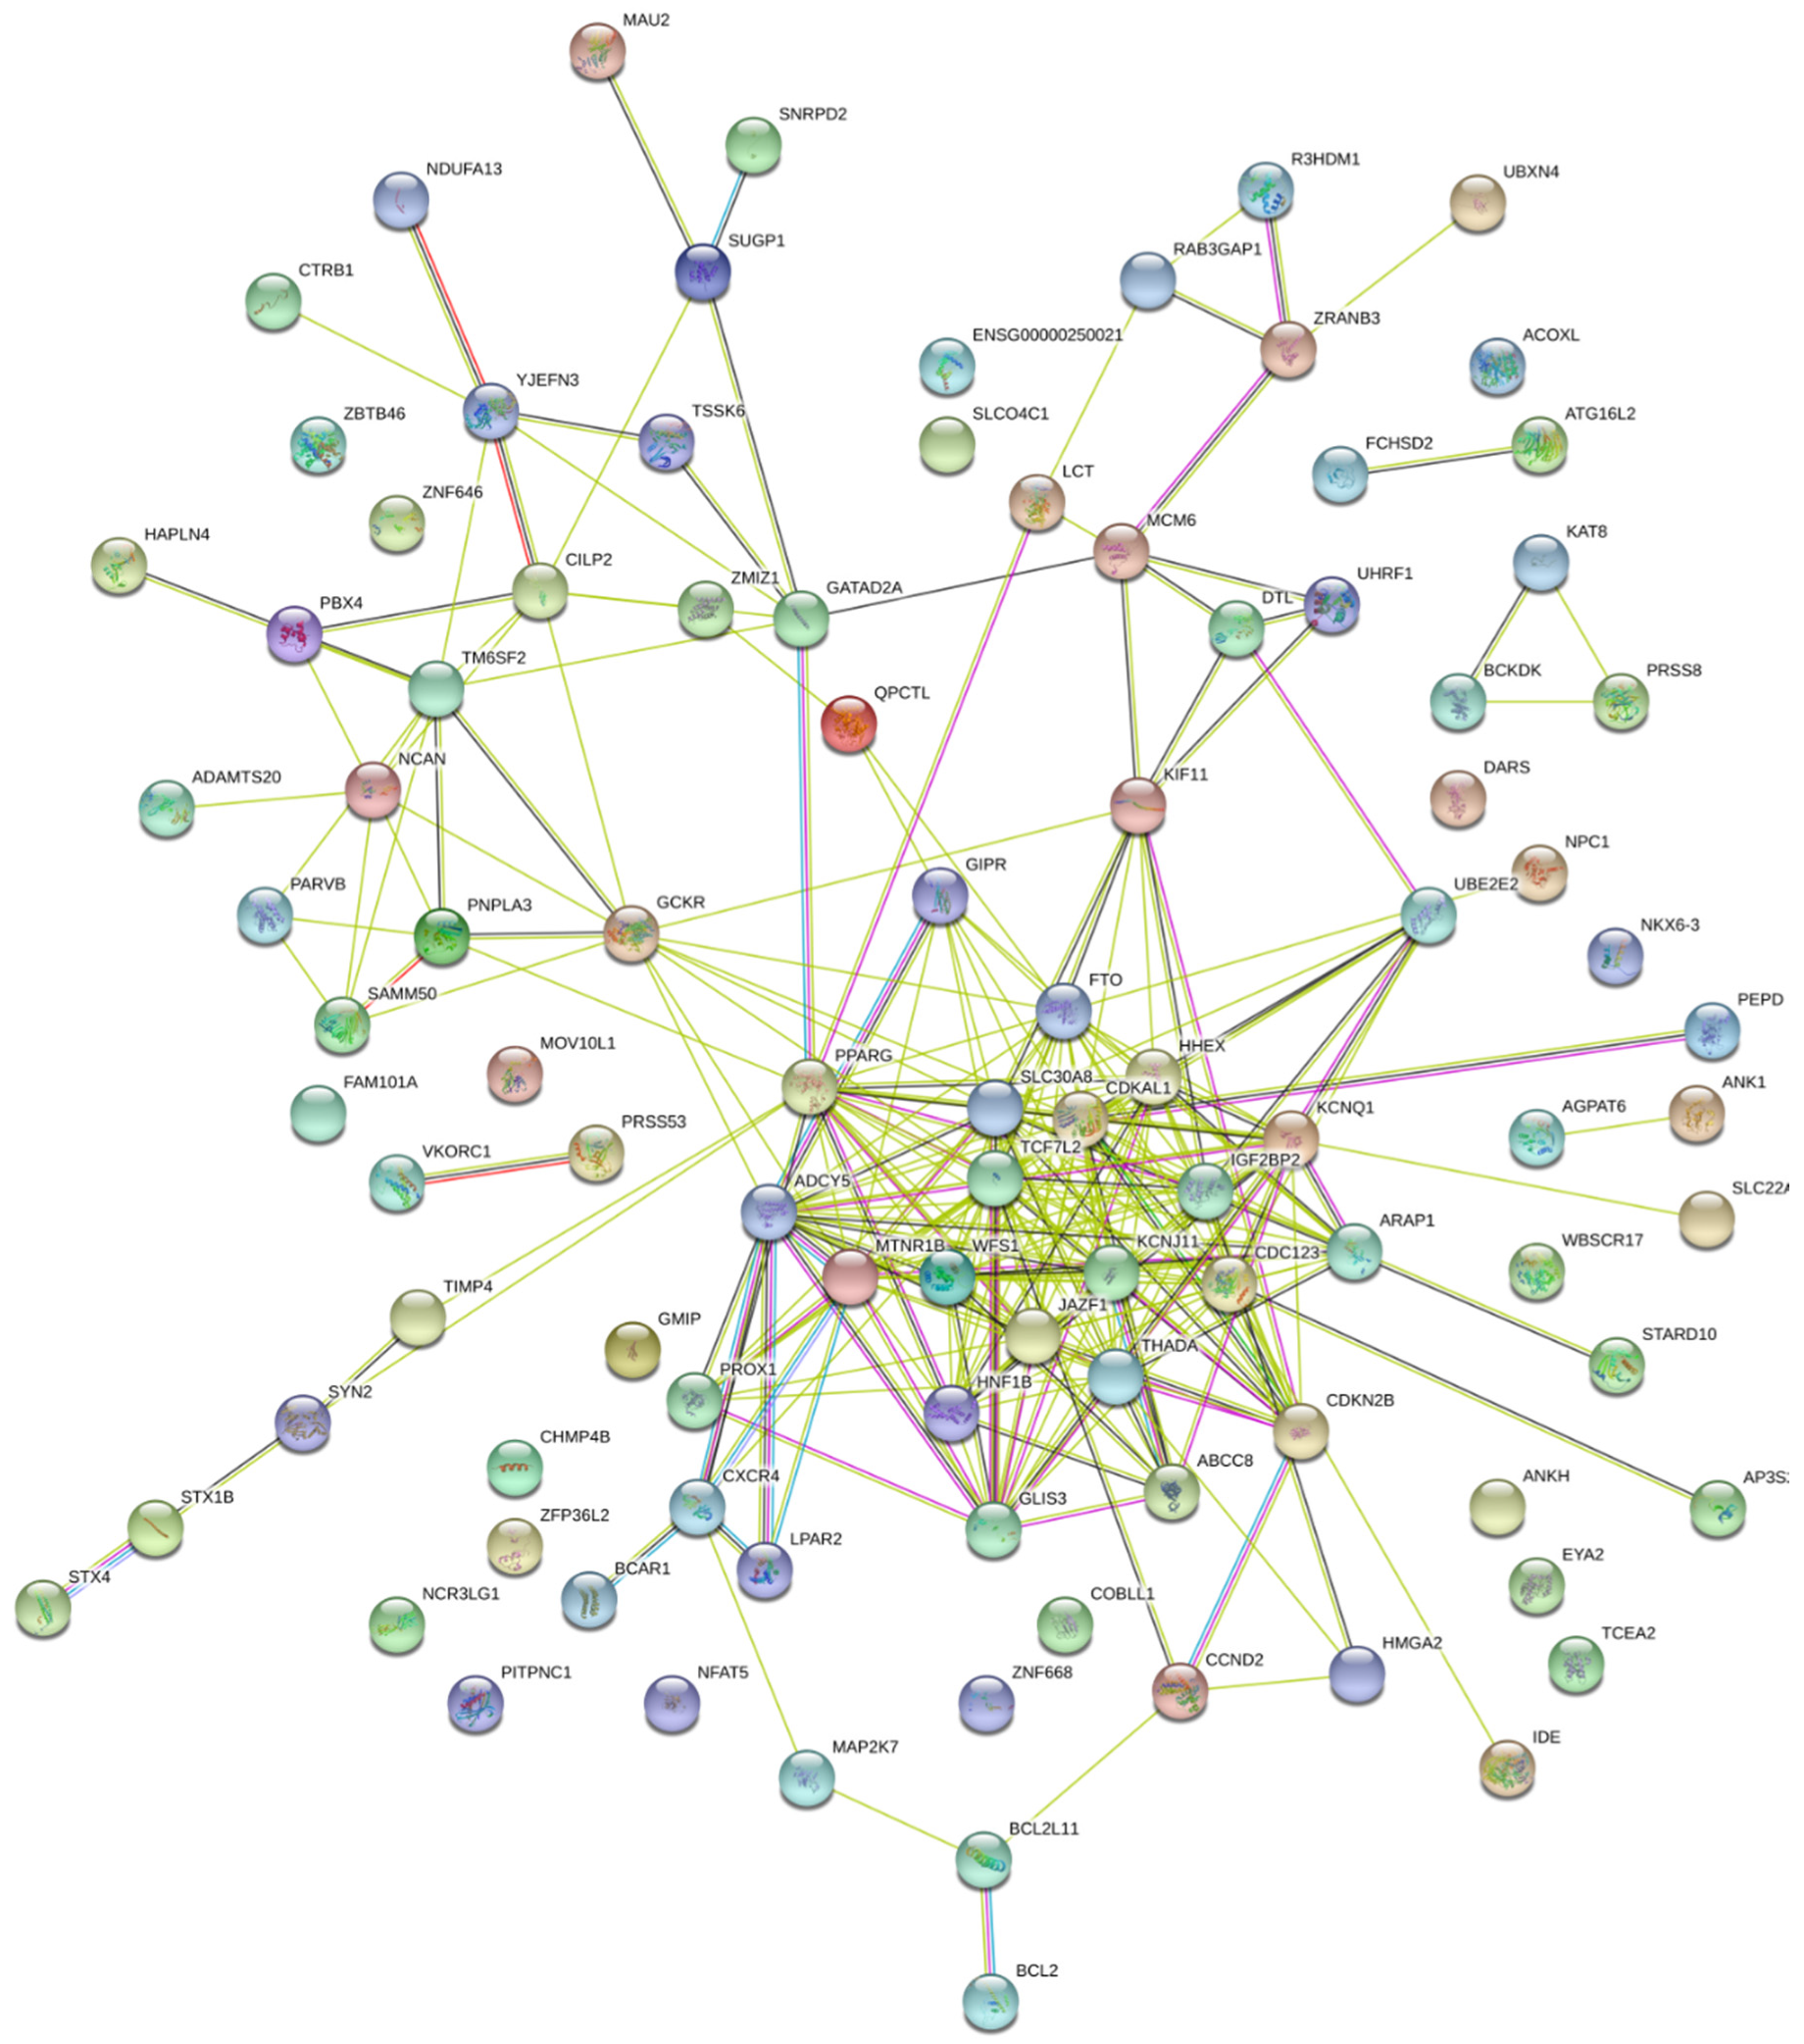
3.5. Results from the Transcriptome-Wide Association Study, Biological Pathway Analysis and Protein–Protein Interaction Network Analysis

We also performed TWAS for the adjusted GWAS results of NAFLD, obesity, and type II diabetes by FUSION software. We found that gene ATP13A1 is significantly associated with a tissue (Cells_Transformed_fibroblasts) for NAFLD, and rs16996148 is the expressed quantitative trait loci (eQTL). In addition, 22 gene-tissue pairs (involving nine genes) were found to be associated with obesity and gene KAT8 is significantly associated with 14 tissues. Moreover, there are 41 gene-tissue pairs (involving 21 genes) associated with type II diabetes and WFS1 is significantly associated with eight tissues. However, none of the genes is observed to be associated with all the three diseases. The TWAS results of NAFLD, obesity and type II diabetes are shown in Table S3.
We combined the pleiotropic genes from cross-trait meta-analysis and genome-wide gene test and 102 shared risk genes were obtained. KEGG pathway enrichment analysis showed that shared risk genes were significantly enriched in 20 biological pathways (Table S4), including cancer, diabetes, insulin secretion and other related pathways. The most strongly enriched one is the cancer pathway, including nine enriched genes (TCF7L2, CDKN2B, CCND2, BCL2L11, BCL2, LPAR2, CXCR4, PPARG and ADCY5).
In order to understand the interaction between shared risk genes, PPI network analysis was carried out using the STRING tool. There were a total of 292 pairs of interactions. All the interacting genes had combined scores of no less than 0.4, in which five pairs of genes had scores larger than 0.95. The 13 hub genes (with degrees larger than 10) that interacted extensively with other genes are TCF7L2, CDKAL1, SLC30A8, MTNR1B, CDC123, FTO, IGF2BP2, KCNQ1, PPARG, ADCY5, HHEX, KCNJ11 and THADA, which includes the top five genes of significance identified by cross-trait meta-analysis. The PPI network for shared risk genes is shown in Figure 3.

4. Discussion

To our knowledge, this study is the first large-scale cross-trait association analysis to investigate the genetic overlap between NAFLD and metabolic traits. Selecting GWASs with the largest samples can facilitate the detection of novel associations. As expected from epidemiologic and genetic studies [3,10,38], obesity and type II diabetes were found to have significant genetic correlation with NAFLD. However, we did not observe significant genetic correlation between NAFLD and hypertension, which suggests that the association between NAFLD and new-onset hypertension might be due to the main linking mechanism, such as insulin resistance [39].
MTAG multitrait association analysis is a very powerful procedure in our study. It incorporates correlations among multiple various GWAS results to enhance detections. In some traits (not all traits), MTAG results are more significant than the original GWASs. Notice that 133 significant loci were newly discovered on chromosomes 2, 3, 4, 6, 7, 8, 9, 10, 16 for NAFLD. Furthermore, MTAG makes significant loci for each trait more widely distributed. The distributions of significant loci for NAFLD and obesity were obviously more extensive, and it remained unchanged for type II diabetes (both located on chromosomes 1, 2, 3, 4, 6, 7, 8, 9, 10, 11, 12, 13, 16, 17, 19) in spite of the decrease in significant loci. Therefore, by applying multitrait association analysis, we have the opportunity to detect novel associations and then identify more shared risk genes.
RE2C cross-trait meta-analysis also has the advantage to detect shared loci, due to the fact that many traits or diseases exist with a polygenic background and most of the variants have too weak effects to be detected. RE2C identified 792 significant pleiotropic loci, involving 100 pleiotropic genes. The top five genes of significance (TCF7L2, FTO, IGF2BP2, CDKAL1 and SLC30A8) are all hub genes according to PPI network analysis. Many pleiotropic genes have been reported to be associated with at least one of the three diseases. For example, PNPLA3, TM6SF2, and GCKR were found to have robust and reproducible associations with NAFLD by GWASs [37]; FTO, LCT, and PPARG were reported to be associated with obesity [18]; TCF7L2, SLC30A8, CDKAL1, CDKN2B, IGF2BP2, HHEX, FTO, PPARG and KCNJ11 were confirmed to be associated with type 2 diabetes [36]. These results indicate the reliability of the pleiotropic genes we identified.
In the genome-wide gene test, we detected two additional novel common genes (SLC22A3 and NCP1). Gene SLC22A3 has been regarded as a therapy target for type 2 diabetes in a previous study, because it may confer metformin clinical responses in patients with type 2 diabetes [40]. This gene has neither been reported in the GWASs of NAFLD or obesity. However, higher SLC22A3 methylation was reported to be related to higher body mass index [41], which suggests that SLC22A3 is associated with obesity. Moreover, genetic studies have implicated the NPC1 gene in susceptibility to obesity, and it may play a role in adipocyte processes underlying obesity [42]. NPC1 was also reported to affect liver fat metabolism by regulating the transport of cholesterol and lipids from lysosome to different cellular compartments, but there is still little evidence for a role of altered NPC1 function in NAFLD pathogenesis [43]. These suggest that NCP1 may play a role in some undetermined mechanisms of NAFLD. The other four genes (IGF2BP2, ZMIZ1, TCF7L2 and FTO) can also be identified by cross-trait meta-analysis and IGF2BP2, TCF7L2 and FTO are the top three genes.
Pathway enrichment analysis shows that 102 shared risk genes are enriched in 20 pathways, in which the cancer pathway has the strongest enrichment signal. This finding is essentially consistent with the previous statement that NAFLD, obesity, and type II diabetes are replacing viral and alcoholic liver disease as the main pathogenic factors of hepatic cellular cancer [44]. Moreover, there are other enriched pathways, maturity onset diabetes of the young, colorectal cancer, insulin secretion, and so on. These conclusions broaden our understanding of NAFLD, obesity and type II diabetes, and provide guidance for disease prevention.
The limitations of our study include the following: First, we used the public datasets with the largest cohorts at the present, and the results cannot be replicated because we did not find other independent GWASs to confirm our findings. Second, genome-wide genetic correlation between NAFLD and each of metabolic traits is relatively weak and local genetic correlation analysis is needed to evaluate the functionally categorized genetic correlation at every LD-independent region. Third, we identified 102 shared risk genes, some of which might be potential causal genes. Further functional experiments are needed to study the causal variants or genes.

5. Conclusions

Our study showed strong genetic correlations between NAFLD and two of the metabolic traits (obesity and type II diabetes). After a multitrait association study of the GWAS results for NAFLD, obesity and type II diabetes, 102 shared risk genes were identified by cross-trait meta-analysis and gene test. A pathway enrichment analysis revealed that the shared risk genes are enriched in cancer, diabetes, insulin secretion, and other related pathways. These shared risk genes and pathways may serve as common drug targets in NAFLD and metabolic disorders and provide help in the treatment of both diseases in clinical settings.

Supplementary Materials

The following are available online at https://www.mdpi.com/2227-9717/9/1/107/s1, Table S1: Cross-trait meta-analysis result between NAFLD, obesity and T2D.; Table S2: The functional relevance of genes in Table 3 and Table 4; Table S3: Significant overlap transcriptome-wide association analysis results between NAFLD, obesity and T2D (P < 5 × 10⁻⁸); Table S4: KEGG pathway analysis for NAFLD, obesity and T2D.

Author Contributions

Conceptualization, H.G. and Z.Y.; methodology, H.G.; writing—original draft preparation, H.G.; writing—review and editing, H.G. and Z.Y.; supervision, Z.Y. Both authors have read and agreed to the published version of the manuscript.

Funding

This research was funded by National Natural Science Foundation of China (Grant No. 11871061).

Data Availability Statement

The datasets analyzed in the current study are available from public websites. NAFLD: summary results for all variants are available at https://www.leelabsg.org/resources. HTN and T2D: summary results are available from the GWASATLAS database (https://atlas.ctglab.nl/). LDL, HDL, TC and TG: summary results are publicly available at the GLGC website (http://lipidgenetics.org/). FG and FIN: summary results are publicly available at the MAGIC website (https://www.magicinvestigators.org/).

Conflicts of Interest

The authors declare no conflict of interest.

References

  1. Bettermann, K.; Hohensee, T.; Haybaeck, J. Steatosis and steatohepatitis: Complex disorders. Int. J. Mol. Sci. 2014, 15, 9924–9944. [Google Scholar] [CrossRef] [Green Version]
  2. Loomba, R.; Sanyal, A.J. The global NAFLD epidemic. Nat. Rev. Gastroenterol. Hepatol. 2013, 10, 686–690. [Google Scholar] [CrossRef]
  3. Eslam, M.; Valenti, L.; Romeo, S. Genetics and epigenetics of NAFLD and NASH: Clinical impact. J. Hepatol. 2018, 68, 40–52. [Google Scholar] [CrossRef]
  4. Mansour-Ghanaei, F.; Joukar, F.; Mobaraki, S.N.; Mavaddati, S.; Hassanipourd, S.; Sepehrimaneshad, M. Prevalence of non-alcoholic fatty liver disease in patients with diabetes mellitus, hyperlipidemia, obesity and polycystic ovary syndrome: A cross-sectional study in north of Iran. Diabetes Metab. Syndr. Clin. Res. Rev. 2019, 13, 1591–1596. [Google Scholar] [CrossRef]
  5. Paschos, P.; Paletas, K. Non alcoholic fatty liver disease and metabolic syndrome. Hippokratia 2009, 13, 9–19. [Google Scholar] [CrossRef]
  6. Hamaguchi, M.; Kojima, T.; Takeda, N.; Nakagawa, T.; Taniguchi, H.; Fujii, K.; Omatsu, T.; Nakajima, T.; Sarui, H.; Shimazaki, M.; et al. The metabolic syndrome as a predictor of nonalcoholic fatty liver disease. Ann. Intern. Med. 2005, 143, 722–728. [Google Scholar] [CrossRef]
  7. Schwimmer, J.B.; Celedon, M.A.; Lavine, J.E.; Salem, R.; Campbell, N.; Schork, N.J.; Shiehmorteza, M.; Yokoo, T.; Chavez, A.; Middleton, M.S.; et al. Heritability of nonalcoholic fatty liver disease. Gastroenterology 2009, 136, 1585–1592. [Google Scholar] [CrossRef] [Green Version]
  8. Cui, J.; Chen, C.H.; Lo, M.T.; Schork, N.; Bettencourt, R.; Gonzalez, M.P.; Bhatt, A.; Hooker, J.; Shaffer, K.; Nelson, K.E.; et al. Shared genetic effects between hepatic steatosis and fibrosis: A prospective twin study. Hepatology 2016, 64, 1547–1558. [Google Scholar] [CrossRef] [Green Version]
  9. Hannele, Y. Non-alcoholic fatty liver disease as a cause and a consequence of metabolic syndrome. Lancet Diabetes Endocrinol. 2014, 2, 901–910. [Google Scholar] [CrossRef]
  10. Liu, Z.; Zhang, Y.; Graham, S.; Wang, X.; Cai, D.; Huang, M.; Pique-Regi, R.; Dong, X.C.; Chen, Y.E.; Willer, C.; et al. Causal relationships between NAFLD, T2D and obesity have implications for disease subphenotyping. J. Hepatol. 2020, 73, 263–276. [Google Scholar] [CrossRef]
  11. Zhu, Z.; Lin, Y.; Li, X.; Driver, J.A.; Liang, L. Shared genetic architecture between metabolic traits and Alzheimer’s disease: A large-scale genome-wide cross-trait analysis. Hum. Genet. 2019, 138, 271–285. [Google Scholar] [CrossRef] [PubMed]
  12. Liu, S.; Rao, S.; Xu, Y.; Li, J.; Huang, H.; Zhang, X.; Fu, H.; Wang, Q.; Cao, H.; Baranova, A.; et al. Identifying common genome-wide risk genes for major psychiatric traits. Hum. Genet. 2020, 139, 185–198. [Google Scholar] [CrossRef] [PubMed]
  13. Zhu, Z.; Wang, X.; Li, X.; Lin, Y.; Shen, S.; Liu, C.L.; Hobbs, B.D.; Hasegawa, K.; Liang, L.; Boezen, H.M.; et al. Genetic overlap of chronic obstructive pulmonary disease and cardiovascular disease-related traits: A large-scale genome-wide cross-trait analysis. Respir. Res. 2019, 20, 64. [Google Scholar] [CrossRef] [PubMed]
  14. Guo, H.; An, J.; Yu, Z. Identifying shared risk genes for asthma, hay fever, and eczema by multi-trait and multiomic association analyses. Front. Genet. 2020, 11, 270. [Google Scholar] [CrossRef] [PubMed] [Green Version]
  15. Namjou, B.; Lingren, T.; Huang, Y.; Parameswaran, S.; Cobb1, B.L.; Stanaway, I.B.; Connolly, J.J.; Mentch, F.D.; Benoit, B.; Niu, X.; et al. GWAS and enrichment analyses of non-alcoholic fatty liver disease identify new trait-associated genes and pathways across eMERGE Network. BMC Med. 2019, 17, 135. [Google Scholar] [CrossRef] [PubMed]
  16. Chalasani, N.; Guo, X.; Loomba, R.; Goodarzi, M.O.; Haritunians, T.; Kwon, S.; Cui, J.; Taylor, K.D.; Wilson, L.; Cummingslow, O.W.; et al. Genome-wide association study identifies variants associated with histologic features of nonalcoholic fatty liver disease. Gastroenterology 2010, 139, 1567–1576. [Google Scholar] [CrossRef] [Green Version]
  17. Kahali, B.; Halligan, B.; Speliotes, E.K. Insights from genome-wide association analyses of nonalcoholic fatty liver disease. Semin. Liver Dis. 2015, 35, 375–391. [Google Scholar] [CrossRef] [Green Version]
  18. Fall, T.; Ingelsson, E. Genome-wide association studies of obesity and metabolic syndrome. Mol. Cell. Endocrinol. 2014, 382, 740–757. [Google Scholar] [CrossRef]
  19. Zhou, W.; Nielsen, J.B.; Fritsche, L.G.; Dey, R.; Gabrielsen, M.E.; Wolford, B.N.; LeFaive, J.; VandeHaar, P.; Gagliano, S.A.; Gifford, A.; et al. Efficiently controlling for case-control imbalance and sample relatedness in large-scale genetic association studies. Nat. Genet. 2018, 50, 1335–1341. [Google Scholar] [CrossRef]
  20. Watanabe, K.; Stringer, S.; Frei, O.; Mirkov, M.U.; de Leeuw, C.; Polderman, T.J.C.; vander Sluis, S.; Andreassen, O.A.; Neale, B.M.; Posthuma, D. A global overview of pleiotropy and genetic architecture in complex traits. Nat. Genet. 2019, 51, 1339–1348. [Google Scholar] [CrossRef]
  21. Willer, C.J.; Schmidt, E.M.; Sengupta, S.; Peloso, G.M.; Gustafsson, S.; Kanoni, S.; Ganna, A.; Chen, J.; Buchkovich, M.L.; Mora, S.; et al. Discovery and refinement of loci associated with lipid levels. Nat. Genet. 2013, 45, 1274–1283. [Google Scholar] [CrossRef] [PubMed] [Green Version]
  22. Dupuis, J.; Langenberg, C.; Prokopenko, I.; Saxena, R.; Soranzo, N.; Jackson, A.U.; Wheeler, E.; Glazer, N.L.; Bouatia-Naji, N.; Gloyn, A.L.; et al. New genetic loci implicated in fasting glucose homeostasis and their impact on type 2 diabetes risk. Nat. Genet. 2010, 42, 105–116. [Google Scholar] [CrossRef] [PubMed]
  23. Sudlow, C.; Gallacher, J.; Allen, N.; Beral, V.; Burton, P.; Danesh, J.; Downey, P.; Elliott, P.; Green, J.; Landray, M.; et al. UK Biobank: An open access resource for identifying the causes of a wide range of complex diseases of middle and old age. PLoS Med. 2015, 12, e1001779. [Google Scholar] [CrossRef] [PubMed] [Green Version]
  24. Bulik-Sullivan, B.K.; Loh, P.R.; Finucane, H.K.; Ripke, S.; Yang, J.; Schizophrenia Working Group of the Psychiatric Genomics Consortium; Patterson, N.; Daly, M.J.; Price1, A.L.; Neale, B.M. LD Score regression distinguishes confounding from polygenicity in genome-wide association studies. Nat. Genet. 2015, 47, 291–295. [Google Scholar] [CrossRef] [PubMed] [Green Version]
  25. Turley, P.; Walters, R.K.; Maghzian, O.; Okbay, A.; Lee, J.J.; Fontana, M.A.; Nguyen-Viet, T.A.; Wedow, R.; Zacher, M.; Furlotte, N.A.; et al. Multi-trait analysis of genome-wide association summary statistics using MTAG. Nat. Genet. 2018, 50, 229–237. [Google Scholar] [CrossRef]
  26. Lee, C.H.; Eskin, E.; Han, B. Increasing the power of meta-analysis of genome-wide association studies to detect heterogeneous effects. Bioinformatics 2017, 33, i379–i388. [Google Scholar] [CrossRef] [Green Version]
  27. Purcell, S.; Neale, B.; Todd-Brown, K.; Thomas, L.; Ferreira, M.A.R.; Bender, D.; Maller, J.; Sklar, P.; Bakker, P.I.W.D.; Daly, M.J. PLINK: A tool set for whole-genome association and population-based linkage analyses. Am. J. Hum. Genet. 2007, 81, 559–575. [Google Scholar] [CrossRef] [Green Version]
  28. De Leeuw, C.A.; Mooij, J.M.; Heskes, T.; Posthuma, D. MAGMA: Generalized gene-set analysis of GWAS Data. PLoS Comput. Biol. 2015, 11, e1004219. [Google Scholar] [CrossRef]
  29. Mancuso, N.; Freund, M.; Johnson, R.; Shi, H.; Kichaev, G.; Gusev, A.; Pasaniuc, B. Probabilistic fine-mapping of transcriptome-wide association studies. Nat. Genet. 2020, 51, 675–682. [Google Scholar] [CrossRef]
  30. Kuleshov, M.; Jones, M.; Rouillard, A.; Fernandez, N.; Duan, Q.; Wang, Z.; Koplev, S.; Jenkins, S.L.; Jagodnik, K.M.; Lachmann, A.; et al. Enrichr: A comprehensive gene set enrichment analysis web server 2016 update. Nucleic Acids Res. 2016, 44, W90–W97. [Google Scholar] [CrossRef] [Green Version]
  31. Szklarczyk, D.; Franceschini, A.; Wyder, S.; Forslund, K.; Heller, D.; Huerta-Cepas, J.; Simonovic, M.; Roth, A.; Santos, A.; Tsafou, K.P.; et al. STRING v10: Protein–protein interaction networks, integrated over the tree of life. Nucleic Acids Res. 2015, 43, D447–D452. [Google Scholar] [CrossRef] [PubMed]
  32. Gloyn, A.L.; Braun, M.; Rorsman, P. Type 2 Diabetes Susceptibility Gene TCF7L2 and Its Role in β-Cell Function. Diabetes 2009, 58, 800–802. [Google Scholar] [CrossRef] [PubMed] [Green Version]
  33. Bhatt, S.P.; Misra, A.; Pandey, R.M. rs7903146 (C/T) polymorphism of Transcription factor 7 like 2 (TCF7L-2) gene is independently associated with non-alcoholic fatty liver disease in Asian Indians. Diabetes Metab. Syndr. Clin. Res. Rev. 2020, 14, 175–180. [Google Scholar] [CrossRef]
  34. Cauchi, S.; Choquet, H.; Gutiérrez-Aguilar, R.; Capel, F.; Grau, K.; Proença, C.; Dina, C.; Duval, A.; Balkau, B.; Marre, M.; et al. Effects of TCF7L2 polymorphisms on obesity in European populations. Obesity 2008, 16, 476–482. [Google Scholar] [CrossRef] [PubMed]
  35. Loos, R.J.F.; Yeo, G.S.H. The bigger picture of FTO--the first GWAS-identified obesity gene. Nat. Rev. Endocrinol. 2014, 10, 51–61. [Google Scholar] [CrossRef]
  36. Mohlke, K.L.; Boehnke, M. Recent advances in understanding the genetic architecture of type 2 diabetes. Hum. Mol. Genet. 2015, 24, R85–R92. [Google Scholar] [CrossRef] [Green Version]
  37. Trépo, E.; Valenti, L. Update on NAFLD genetics: From new variants to the clinic. J. Hepatol. 2020, 72, 1196–1209. [Google Scholar] [CrossRef]
  38. Dongiovanni, P.; Valenti, L. Genetics of nonalcoholic fatty liver disease. Metabolism 2016, 65, 1026–1037. [Google Scholar] [CrossRef]
  39. Oikonomou, D.; Georgiopoulos, G.; Katsi, V.; Kourek, C.; Tsioufis, C.; Alexopoulou, A.; Koutli, E.; Tousoulis, D. Non-alcoholic fatty liver disease and hypertension: Coprevalent or correlated? Eur. J. Gastroenterol. Hepatol. 2018, 30, 979–985. [Google Scholar] [CrossRef]
  40. Moeez, S.; Riaz, S.; Masood, N.; Kanwal, N.; Arif, M.A.; Niazi, R.; Khalid, S. Evaluation of the rs3088442 G>A SLC22A3 gene polymorphism and the role of microRNA 147 in groups of adult Pakistani populations with type 2 diabetes in response to metformin. Can. J. Diabetes 2019, 43, 128–135. [Google Scholar] [CrossRef]
  41. Sonia, G.C.; Alexander, P.; Ville, M.; Vanessa, D.M.; Emma, N.; Jussi, P.; Charlotte, L. Diabetes medication associates with DNA methylation of metformin transporter genes in the human liver. Clin. Epigenet. 2017, 9, 102. [Google Scholar] [CrossRef] [Green Version]
  42. Bambace, C.; Dahlman, I.; Arner, P.; Kulyté, A. NPC1 in human white adipose tissue and obesity. Bmc Endocr. Disord. 2013, 13, 5. [Google Scholar] [CrossRef] [PubMed] [Green Version]
  43. Du, J.; Ji, Y.; Qiao, L.; Liu, Y.; Lin, J. Cellular endo-lysosomal dysfunction in the pathogenesis of non-alcoholic fatty liver disease. Liver Int. 2020, 40, 271–280. [Google Scholar] [CrossRef] [PubMed] [Green Version]
  44. Marengo, A.; Rosso, C.; Bugianesi, E. Liver Cancer: Connections with Obesity, Fatty Liver, and Cirrhosis. Annu. Rev. Med. 2016, 67, 103–117. [Google Scholar] [CrossRef] [PubMed]
Figure 1. The overall design of our study.
Processes 09 00107 g001
Figure 2. Manhattan plots of NAFLD, obesity, and T2D before and after MTAG multitrait association analysis. (a) Manhattan plot of NAFLD before MTAG; (b) Manhattan plot of NAFLD after MTAG; (c) Manhattan plot of obesity before MTAG; (d) Manhattan plot of obesity after MTAG; (e) Manhattan plot of T2D before MTAG; (f) Manhattan plot of T2D after MTAG.
Processes 09 00107 g002aProcesses 09 00107 g002b
Figure 3. Protein–protein interaction (PPI) network analysis for 102 shared risk genes.
Processes 09 00107 g003
Table 1. Summary of genome-wide association studies (GWAS) data for nonalcoholic fatty liver disease (NAFLD) and nine metabolic traits.
PhenotypeData SourceSamples’ Size# SNPs
CasesControlsTotal
NAFLDUKBB1664392,813394,47728,281,760
HTNUKBB99,665189,642289,30710,321,705
ObesityUKBB9805235,085244,89010,154,467
T2DUKBB16,673228,217244,89010,154,467
LDLGLGC--188,5772,437,751
HDLGLGC--188,5772,447,441
TCGLGC--188,5772,439,432
TGGLGC--188,57724,46,981
FGMAGIC--58,0742,628,879
FINMAGIC--51,7502,627,848
SNP: single nucleotide polymorphism; UKBB: UK Biobank; NAFLD: nonalcoholic fatty liver disease; HTN: hypertension; T2D: type II diabetes; LDL: low-density lipoproteins; HDL: high-density lipoproteins; TC: Total cholesterol; TG: triglycerides; FG: fasting glucose; FIN: fasting insulin.
Table 2. Genetic correlation between NAFLD and nine metabolic traits.
Phenotype 1Phenotype 2rgrg _s.e.p Value
NAFLDHTN0.01440.05090.7773
Obesity0.22760.12160.0613
T2D0.21060.0850.0132
LDL0.01890.07340.7964
HDL0.03610.0750.6303
TC0.04880.07290.5029
TG−0.0580.0730.4264
FG−0.0390.05830.503
FIN0.05170.07050.4635
rg: genetic correlation; rg_s.e.: standard error of genetic correlation; NAFLD: nonalcoholic fatty liver disease; HTN: hypertension; T2D: type II diabetes; LDL: low-density lipoproteins; HDL: high-density lipoproteins; TC: Total cholesterol; TG: triglycerides; FG: fasting glucose; FIN: fasting insulin.
Table 3. Cross-trait meta-analysis result between NAFLD, obesity and T2D (only showing the top 20 pleiotropic variants and the corresponding genes).
SNPGenome PositionA1/A2PRE2CGenes within Clumping Region
rs7903146chr10:114597109-114914665T/C6.95 × 10−206TCF7L2
rs10811661chr9:22130065-22134094C/T1.50 × 10−34-
rs1421085chr16:53800387-53839135C/T4.47 × 10−34FTO
rs7651090chr3:185473065-185547917G/A9.28 × 10−34IGF2BP2
rs2206734chr6:20529542-20766697T/C1.61 × 10−32CDKAL1
rs13266634chr8:118183551-118217307T/C1.79 × 10−31SLC30A8
rs849135chr7:28138639-28256240G/A1.97 × 10−26JAZF1
rs7018475chr9:22137685-22137685G/T3.23 × 10−26-
rs7923837chr10:94232247-94499577A/G3.04 × 10−24HHEX, IDE, KIF11
rs2972144chr2:226897985-227199263A/G9.76 × 10−21-
rs10244051chr7:15023729-15065467T/G1.49 × 10−20-
rs11708067chr3:123065778-123131254G/A3.18 × 10−20ADCY5
rs2796441chr9:84304985-84380739A/G5.11 × 10−20-
rs738408chr22:44324730-44395451T/C6.84 × 10−20PARVB, PNPLA3, SAMM50
rs1128249chr2:165501849-165558252T/G2.05 × 10−19COBLL1
rs13411629chr2:43450138-43848664C/T1.06 × 10−18THADA, ZFP36L2
rs10885414chr10:114835452-114916586G/A1.29 × 10−18TCF7L2
rs1801206chr4:6264968-6321396C/T2.19 × 10−18WFS1
rs11651755chr17:36098040-36103565C/T1.43 × 10−16HNF1B
rs476828chr18:57732689-57912785C/T2.62 × 10−15-
chr: chromosome; A1/A2 refers to the effect allele and reference allele; -: no corresponding gene.
Table 4. Shared risk genes for NAFLD, obesity and T2D in MAGMA gene-based analysis.
GenePosition# SNPsPMAGMA
NAFLDObesityT2D
IGF2BP2chr3:185361527-185542827531.25 × 10132.06 × 1066.08 × 1015
SLC22A3chr6:160769405-160873613941.01 × 1062.03 × 1063.77 × 108
ZMIZ1chr10:80828751-810762851622.42 × 10111.04 × 10107.08 × 1015
TCF7L2chr10:114709978-114927437961.23 × 10383.53 × 10132.99 × 1055
FTOchr16:53737875-541483792468.44 × 10141.17 × 10211.16 × 1015
NPC1chr18:21086148-21166581332.57 × 1062.04 × 1062.10 × 106
# SNP: single nucleotide polymorphism; NAFLD: nonalcoholic fatty liver disease; T2D: type II diabetes; chr: chromosome.
Publisher’s Note: MDPI stays neutral with regard to jurisdictional claims in published maps and institutional affiliations.

