Article

Optimization of Extrusion and Ultrasound-Assisted Extraction of Phenolic Compounds from Jizi439 Black Wheat Bran

1
Key Laboratory of Bulk Grain and Oil Deep Processing Ministry of Education, Wuhan Polytechnic University, Wuhan 430023, China
2
College of Food Science and Engineering, Wuhan Polytechnic University, Wuhan 430023, China
3
National “111” Center for Cellular Regulation and Molecular Pharmaceutics, Key Laboratory of Fermentation Engineering (Ministry of Education), Hubei University of Technology, Wuhan 430068, China
*
Authors to whom correspondence should be addressed.
Processes 2020, 8(9), 1153; https://doi.org/10.3390/pr8091153
Submission received: 20 August 2020 / Revised: 3 September 2020 / Accepted: 9 September 2020 / Published: 15 September 2020
(This article belongs to the Special Issue Green Separation and Extraction Processes)

Abstract

:
Jizi439, a newly developed black wheat breeding line, was reported to effectively regulate blood glucose, which may potentially be associated with its intrinsic high level of phenolic compounds (PCs). To maximize the PCs yield and thereby enhance their antioxidant activity, orthogonal experiments were designed in sequence for extrusion of Jizi439 black wheat bran (BWB) powder and followed by the extraction of PCs assisted with ultrasound technique. White wheat bran was used as a control. The optimum condition for extrusion was 110 °C, 25% feed water content, 140 rpm screw speed; meanwhile, 50 °C, 40 min, 35 kHz ultrasonic frequency, 300 W ultrasonic power for ultrasound-assisted extraction (UAE). Total phenolic content (TPC) as determined by Folin–Ciocalteu method was 2856.3 ± 57.7 μg gallic acid equivalents (GAE) per gram of dry weight (DW) of phenolic extract; meanwhile, antioxidant activity (AA) in terms of DPPH radical scavenging ratio was 85.5% ± 1.1% under optimized conditions, which were both significantly higher than the control. Phenolic acids except for gallic acid, as well as flavonoids, including luteolin and apigenin were increased by extrusion and ultrasound, as suggested by HPLC results. In conclusion, our study would provide a valuable reference for processing Jizi439 BWB before making or commercially utilize it into health-related food products.

1. Introduction

Wheat bran, the by-product of the wheat milling process, is commonly discarded and destined for animal feeding. However, due to the rising findings on the health benefits of its components, especially phenolic compounds, the use of bran as a food ingredient is increasing [1]. Jizi439 black wheat was recently developed by the combination of genes from four different breeding lines, namely, Australia black wheat 14,928, 95-5031, durum wheat 190,268, and Henan black wheat Luozhen No.1, by Hebei Academy of Agricultural and Forestry Sciences (Hebei, China) [2]. This breeding has been reported to effectively regulate blood glucose levels of Type 2 Diabetes patients after ingestion [3], which may (to some extent) associated with the high level of chromium and low GI index [3,4,5,6].
Except for that, phenolic compounds in the bran could be another factor in regulating the blood glucose levels of Type 2 Diabetes patients. Since diabetes is associated with not only hyperglycemia and hyperlipidemia, but also oxidative stress caused by free radicals [7]. Phenolic compounds can serve as natural antioxidants that act against those free radicals [8], and lower the risk of mortality from Type 2 diabetes and obesity [9,10,11,12]. It was reported that wheat bran phenolics were of notable antioxidant activity [13,14]. Among different varieties of wheat (white, red, purple, black, etc.), black wheat possesses the highest level of phenolics [15,16]. Thus, the phenolics from the newly developed breeding Jizi439 were selected in the present study, which to our knowledge, is rarely reported.
Wheat bran is often pre-processed, so it has a more desirable sensory acceptance and nutritional value, before it is put into the market. Extrusion is a versatile process comprising operations, including mixing, cooking, kneading, shearing, shaping, and forming [17]. Research on cereal products has shown that thermal processing, such as extrusion might assist in releasing bound phenolics by breaking down cellular constituents and cell walls [18]. Studies reported that the antioxidant activity could be significantly increased by extrusion of wheat bran [19,20].
Besides extrusion, ultrasound-assisted extraction is another efficient way to maximize the yield of phenolic compounds [21,22], which is well known to have a significant positive effect on the extraction rate in the chemical and food industry. Using this technique, full extraction could be completed quickly, solvent consumption and fossil energy could be reduced, which is superior to conventional extraction, such as water or enzyme-assistant extraction [22].
The present study aims to optimize the extrusion and ultrasound-assistant extraction conditions in order to obtain more phenolic compounds and improve the antioxidant activity of extracts. In this respect, two orthogonal experiments were conducted for extrusion and ultrasound-assistant extraction in sequence, while total phenolic content and the antioxidant activity of the extracts were used as responses for the orthogonal design. Phenolic profiles were compared among extracts of the control, raw, and treated Jizi439 BWB as preliminary investigation for further study of Jizi439 phenolic compounds.

2. Materials and Methods

2.1. Raw Materials and Chemicals

The Jizi439 black wheat bran (BWB) was obtained from Yueqing Agricultural Science and Technology Co., Ltd. (Handan, China). Gallic acid standard was purchased from Aladdin chemical Co. (Shanghai, China). Tris-HCl buffer was purchased from Solarbio Science and Technology Co. (Beijing, China). DPPH (2,2-diphenyl-1-picrylhydrazyl) free radical was purchased from Sigma-Aldrich (St. Louis, MO, USA). Folin–Ciocalteu reagent and sodium carbonate anhydrous were purchased from Hushi chemical Co. (Shanghai, China). Phenolic compounds standards were purchased from Shanghai Yuanye Bio-Technology Co., Ltd. (Shanghai, China).

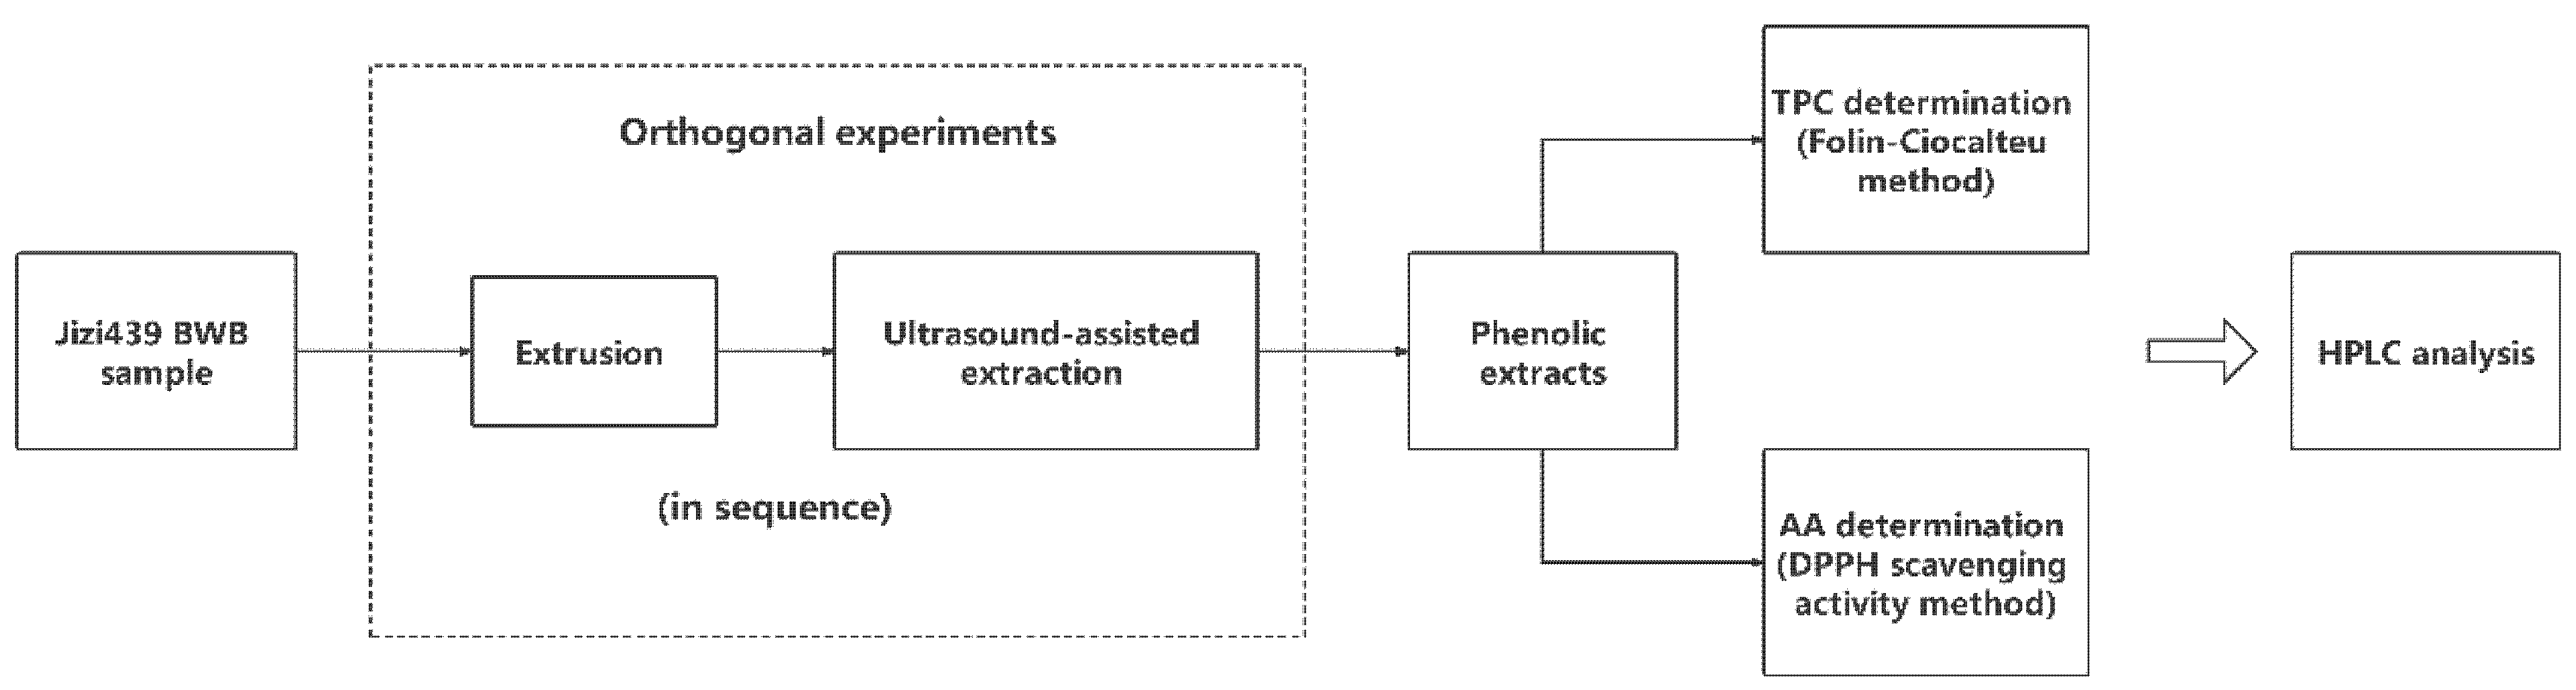
2.2. Experiment Design

The scheme of optimizing Jizi439 BWB extrusion and extraction processing steps are shown in Figure 1. Two orthogonal experiments were conducted, respectively, for extrusion and ultrasound-assisted extraction (UAE). Total phenolic content (TPC) and antioxidant activity (AA, in terms of DPPH scavenging activity) were used as responses. After optimization, the Jizi439 BWB was divided into four groups, including: (1) NENU group, raw bran without extrusion and phenolics were extracted without ultrasound; (2) E group, extruded bran whose phenolics were extracted without ultrasound, (3) U group, raw bran with UAE; and (4) EU group, extruded bran with UAE. White wheat bran, without extrusion and ultrasound, was used as a control. Total phenolic content and antioxidant activity were compared among each group. The profile of phenolic compounds in the extracts was compared among NENU, EU, and control groups.

2.3. Orthogonal Experiment for Extrusion and UAE

Jizi439 BWB was extruded in a twin-screw extruder (FMHE36-24; Hunan Fumach Foodstuff Engineering and Technology Co., Ltd., Hunan, China). The length (L) of the screw was 864 mm, and its diameter (D) was 36 mm (L/D = 24:1). The feed rate was 125 g/min. To optimize extrusion condition, an L9(34) orthogonal design was set up with three levels of screw speeds (140, 160, or 180 rpm), feed water content (21%, 23%, or 25%), and the third heating block temperature (90, 110, or 130 °C), respectively (Table 1). The temperature in the first, second, fourth, and fifth heating blocks were 60, 90, 60, and 50 °C, respectively [23]. The extrudates were dried at 60 °C for 30 min, ground and passed through a 60-mesh sieve, and then stored at −18 °C in sealed plastic bags and protected from light until further study.
Phenolic compounds were extracted from extruded Jizi439 BWB with 80% aqueous ethanol assisted by an ultrasound electronic instrument (THC-2B, Jining Tianhua Ultrasound Electronic Instrument Co., Ltd., Jining, China) [14]. The orthogonal design was set up with three levels of temperature (30, 50, or 70 °C), time (20, 40, or 60 min), ultrasonic frequency (20, 35, or 50 kHz), and ultrasonic power (200, 300, or 400 W), respectively (Table 2). Extracts were then centrifuged at 2800×g for 15 min. Supernatants were collected for determination of TPC, or concentrated under rotary evaporation and freeze-dried for DPPH scavenging activity assay and HPLC analysis.

2.4. Determination of TPC

The TPC of extracts were determined by Folin–Ciocalteu method, according to Zhang et al., in 2006, with slight modifications [24]. Briefly, 20 μL of each sample solution was mixed with 100 μL of Folin–Ciocalteu reagent and loaded on a 96-well plate, incubated for 5 min before 80 μL of 7.5% Na2CO3 solution was added. The 96-well plate was then covered and left in a dark at room temperature for 2 h. The absorbance was measured at 750 nm with a spectrophotometric microplate reader (EnSpire® Multimode Plate reader, PerkinElmer Management (Shanghai) Co., Ltd., China). Distilled water was used as a blank. Each sample solution and the standard solution was repeated in sextuplicate. The TPC was expressed as micrograms of gallic acid equivalents per gram of dry weight BWB (μg GAE/g DW) calculated from a calibration curve of a standard gallic acid solution with concentrations of 0–100 μg/mL (R2 > 0.999).

2.5. Determination of Antioxidant Activity (AA)

The antioxidant activity (AA) of Jizi439 BWB extracts was tested by DPPH radical scavenging assay, according to Li and Shimamura [25,26] with slight modifications. Extracts were dried under a nitrogen flow and weighed before re-dissolved in 3 mL 80% methanol. The extracts were then diluted 10, 20, 50, and 100 times and analyzed for DPPH scavenging activity. Briefly, the DPPH solution was freshly made for each run, 20 μL of sample solutions with 80 μL of 0.1 M Tris-HCl buffer was added into each well before 100 μL of DPPH solution was added. Left in a dark at room temperature for 30 min. The absorbance was measured at 515 nm with a spectrophotometric microplate reader (EnSpire® Multimode Plate reader, PerkinElmer Management (Shanghai) Co., Ltd., Shanghai, China). Each sample solution was repeated in sextuplicate. The inhibition ratio of the phenolic extracts was calculated according to the following Equation (1):
Inhibitioin   ratio   ( % ) = ( 1 A s A 1 A c ) × 100
Determination of the DPPH. As is the absorbance of DPPH solution and Tris-HCl buffer with sample solution; Ac is the absorbance of DPPH solution Tris-HCl buffer with ethanol (80%) instead of the sample; A1 is the absorbance of Tris-HCl buffer and sample solution with methanol (80%) for background absorbance.
The IC50 value of each phenolic extract was determined by interpolation from linear regression analysis using the SPSS statistics program (SPSS Inc., Chicago, IL, USA) [27]. Lower IC50 values indicate higher antioxidant activities.

2.6. HPLC Analysis of Phenolic Compounds

The profile of phenolic compounds in Jizi439 BWB extracts were analyzed by a Waters e2695 HPLC system equipped with a symmetry C18 column (250 × 4.6 mm, 5 µm) and a UV detector (Milford, MA, USA) using methanol (solvent A) and 0.1% formic acid solution (solvent B) as mobile phase: 5% A in 5 min, 5–15% A in 10 min, 37–38% A in 25 min, 38–50% A in 10 min, 50–95% A in 10 min, 95% A in 5 min and 95–5% A in 2 min, at a flow rate of 0.5 mL/min. The injection volume was 10 μL, and the column temperature was 30 °C. Pure compounds (p-hydroxybenzoic acid, gallic acid, vanillic acid, p-coumaric acid, ferulic acid, syringic acid, caffeic acid, chlorogenic acid, luteolin, and apigenin) were used as standards. The detection of components was monitored at 280 nm. Retention times and ultraviolet-visible spectra of obtained chromatographic peaks were matched with those of the standards. Samples were prepared and analyzed in duplicate.

2.7. Statistical Analysis

The result of TPC and AA were expressed as average ± standard deviation (SD). Data were analyzed by one-way ANOVA and Duncan’s multiple range test at a 5% significance level (p < 0.05) by using the SPSS statistics program (SPSS Inc., Chicago, IL, USA).

3. Results

3.1. Orthogonal Experiment for Extrusion

The orthogonal experiment was carried out according to Table 1. Effects of the three factors, i.e., the third heating block temperature (A), feed water content (B), and screw speeds (C) on TPC was analyzed by the range and variance analysis.
Range analysis. The results of the range analysis were shown in Table 3. The average of responses at each level and their ranges were calculated and expressed as k1, k2, k3, and R. The value of k could be used to assess the influence of each actor level on the response, while R values reflect the importance of each factor. A larger k or R represents a more desirable condition or a greater effect of the factor on the response. K values were calculated according to Li [28].
For response TPC, results showed that RA > RB > RC, this means A (the third heating block temperature) had the greatest effect on TPC, followed by B (feed water content) and C (screw speeds). According to k values of A, B, and C, the optimum combination was A2B3C1. For response AA, results showed that RA > RC > RB, and the optimum combination is A3B3C1, according to k values. As shown in Figure 2, TPC reached a peak value at 110 °C; however, for response AA, the peak was at 130 °C. The impact of factors B and C on TPC and AA show similar trends. A verification experiment was conducted using combination A2B3C1 the best combination for both TPC and AA, higher TPC (2304.3 ± 127.4 μg GAE/g DW), and AA (86.2% ± 0.8%) was obtained. Thus, the optimum extrusion conditions should be A2B3C1 (the third heating block temperature 110 °C, feed water content 25%, and screw speeds 140 rpm).
Variance analysis. The variance analysis was carried out to assess the influence of each factor on TPC and AA. As shown in Table 3, SS and MS represent for the sum of the squares of deviations and the sum of mean-square error, respectively. F and p value were used to determine whether the factors significantly impact the response or not. A larger F value or a smaller p value represents a stronger impact of the factor. According to Table 4, factor A was the most significant factor (p < 0.05) that influence AA, which was consistent with the Range analysis above.

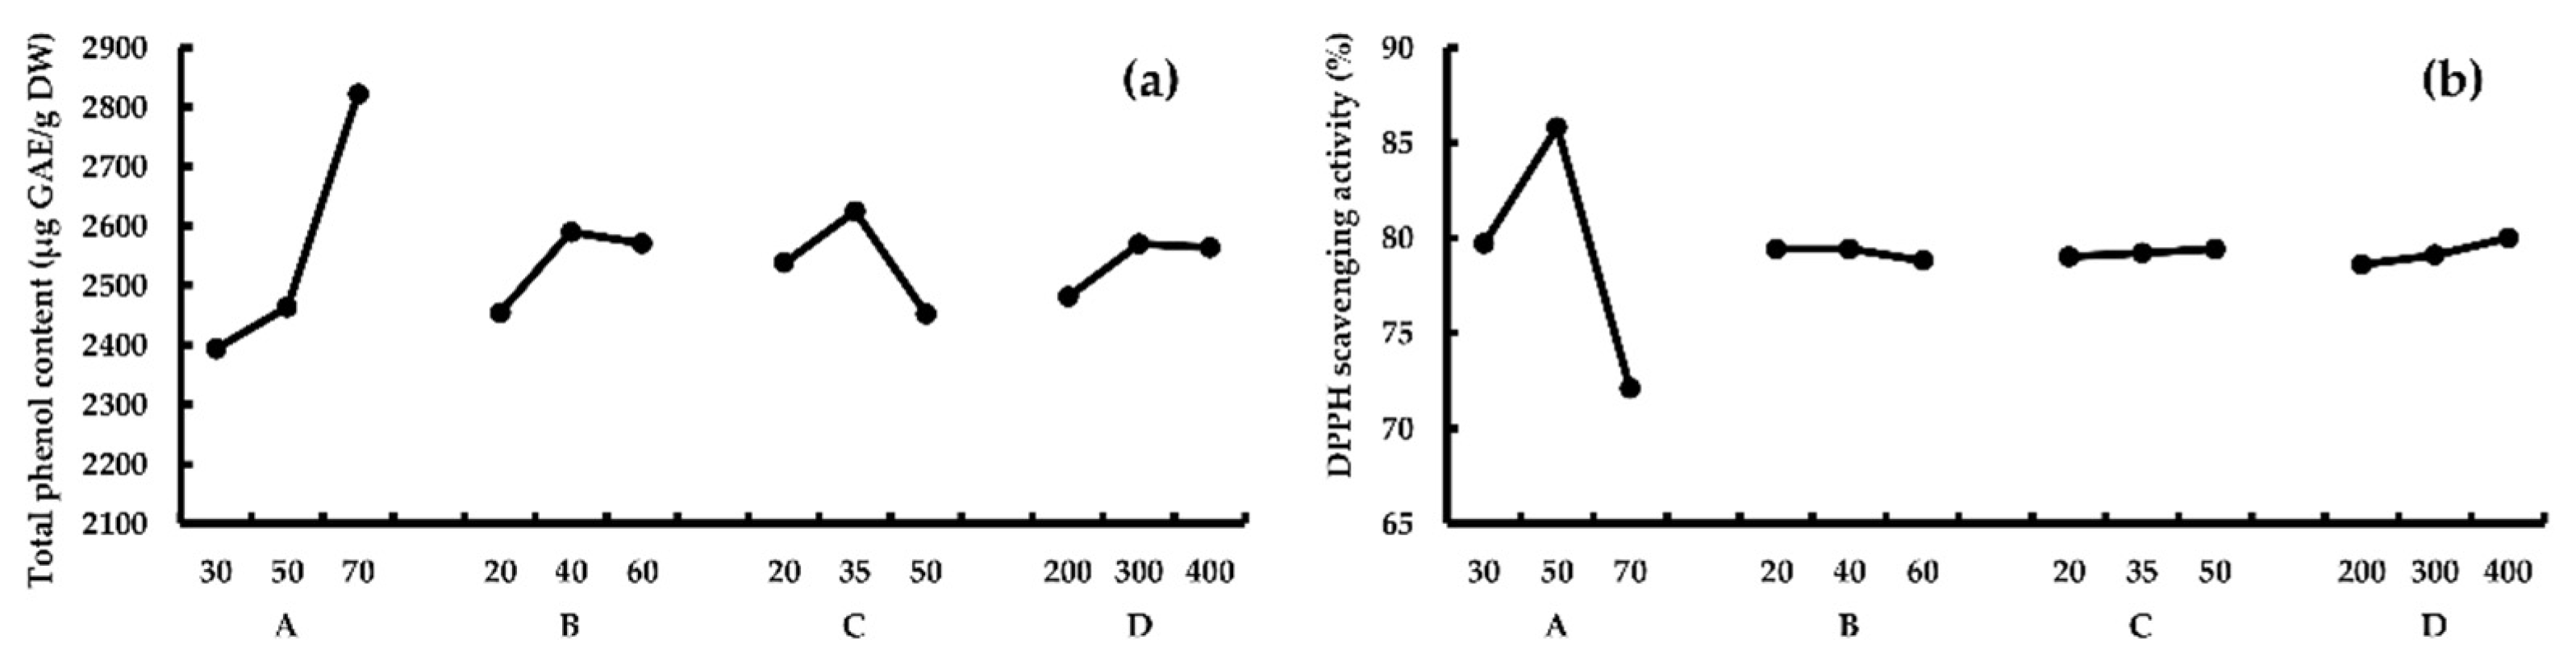
3.2. Orthogonal Experiment for Ultrasound-Assisted Extraction (UAE)

To further maximize the TPC yield of Jizi439 BWB, another L9(34) orthogonal experiment was conducted using Jizi439 BWB, which extruded under the optimum condition mentioned in Section 3.1. Table 4 shows the assignment of the orthogonal factors and their levels. The four factors were temperature (A), time (B), ultrasonic frequency (C), and ultrasound power (D). The effects of four factors on TPC were analyzed by range (Table 5) and variance analysis (Table 6).
Range analysis. According to Table 5, for response TPC, RA > RC > RB > RD, this means A (temperature) had the greatest effect on TPC, followed by C (ultrasonic frequency), B (time) and D (ultrasonic power). And the optimum process combination was A3B2C2D2, according to k values. For response AA, results showed that RA > RD > RB > Rc, which means A had the greatest effect on AA, followed by D and B, and the optimum combination was A2B1(B2)C3D3, according to k values. TPC and AA reached peaks at 70 °C and 50 °C, respectively (Figure 3). The results of the verification experiment showed that both higher TPC (2856.3 ± 57.7 μg GAE/g DW) and AA (85.5% ± 1.1%) were obtained under combination A2B2C2D2. Thus, A2B2C2D2 (50 °C, 40 min, ultrasonic frequency 35 kHz, and ultrasonic power 300 W) should be the optimum UAE conditions.
Variance analysis. The results of the variance analysis for ultrasound-assisted extraction (UAE) were listed in Table 6. Factor A was the most significant factor (p < 0.05) for both TPC and AA. Factor B and C could significantly influence TPC (p < 0.05), while factor D could significantly influence AA (p < 0.05).

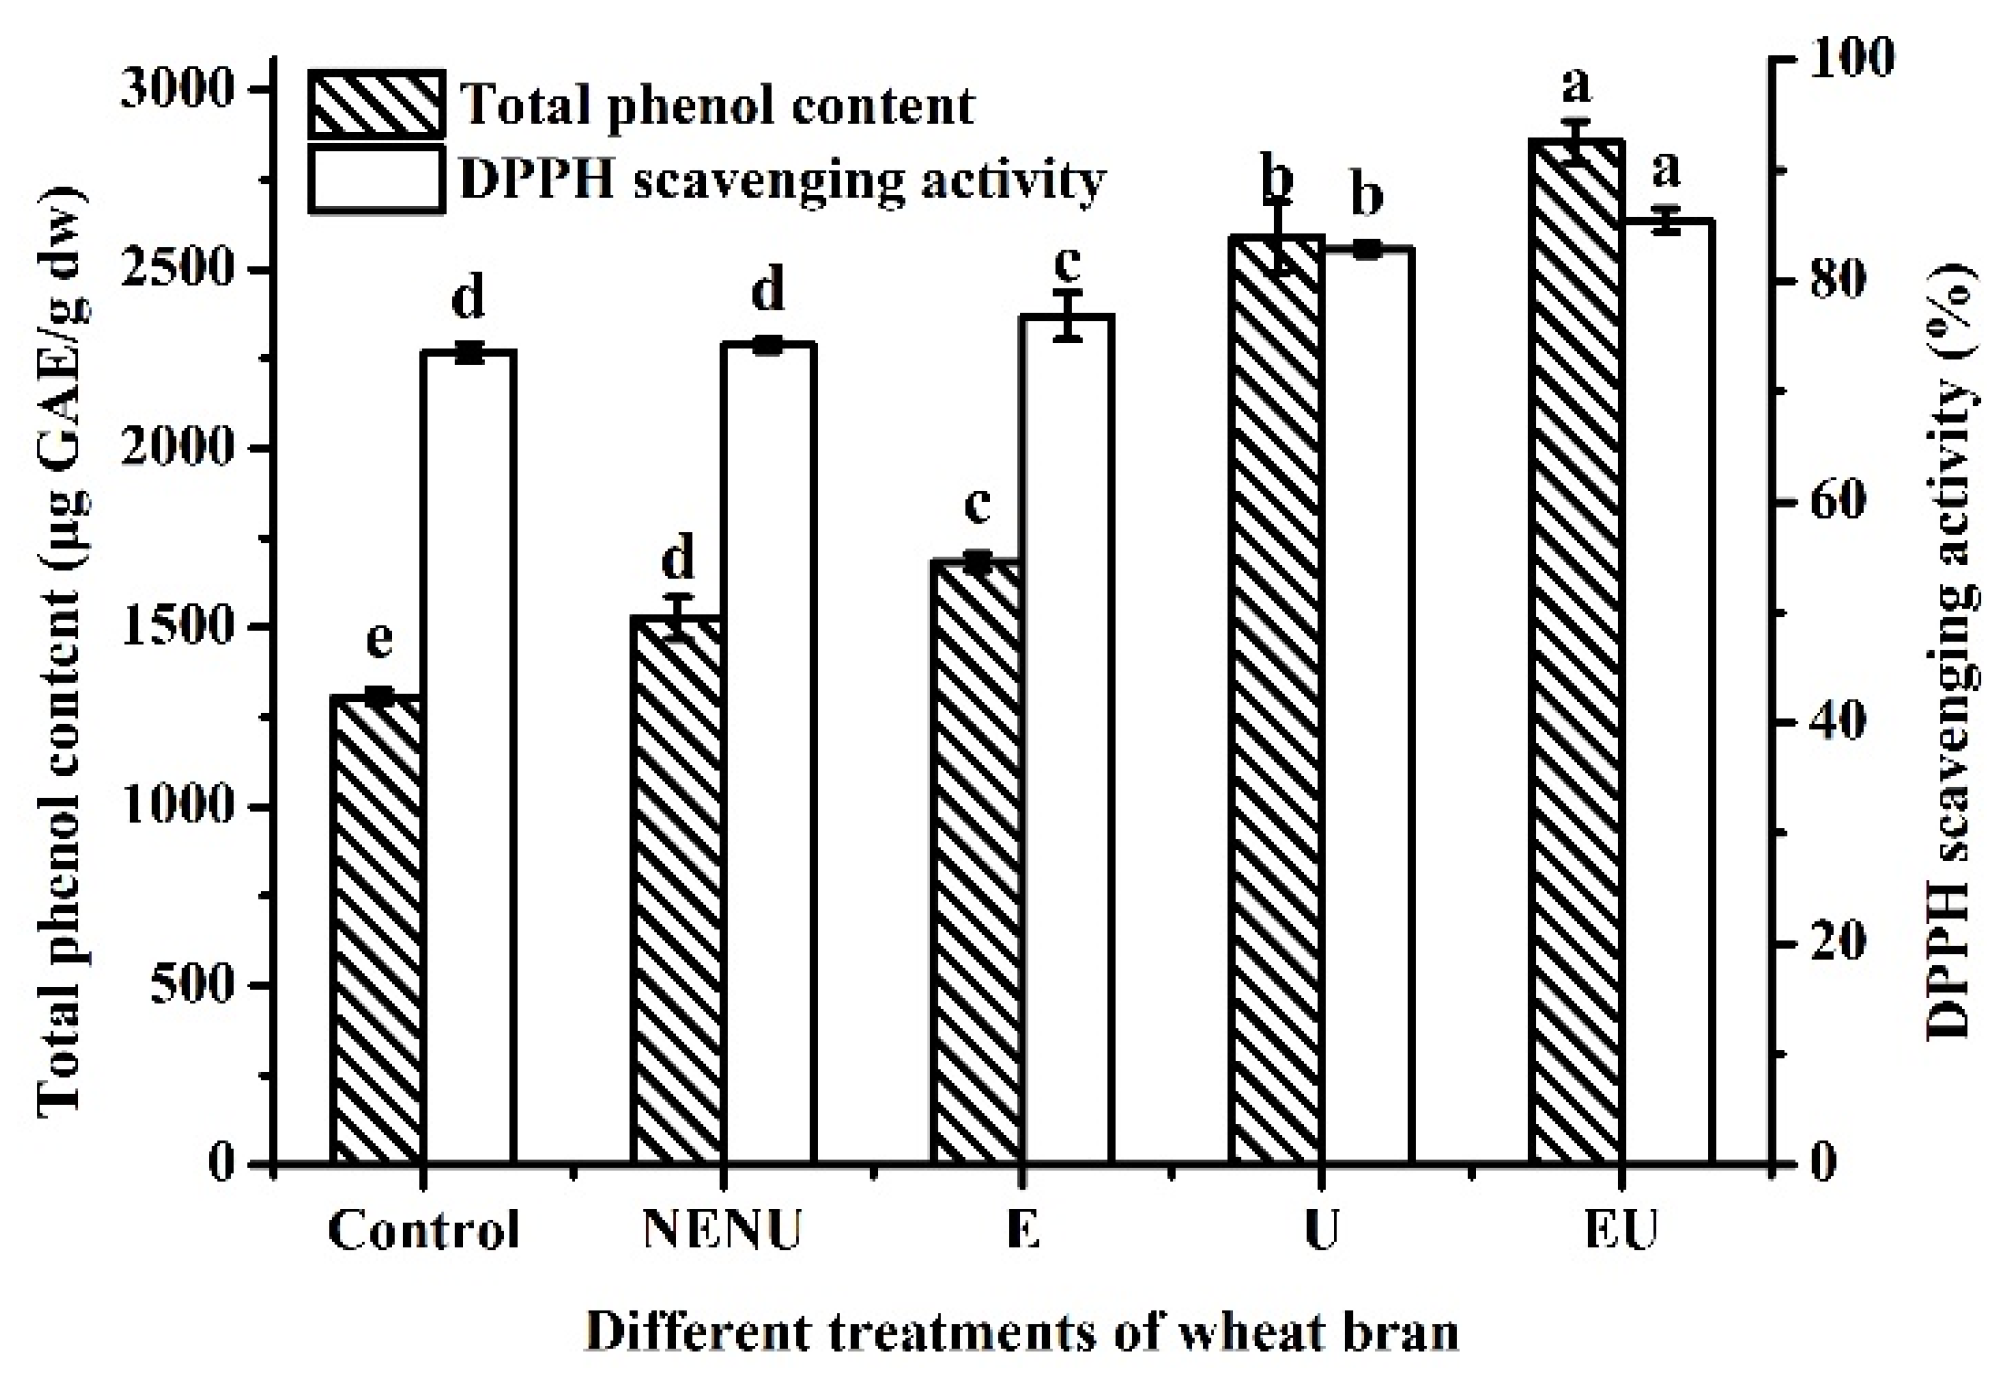
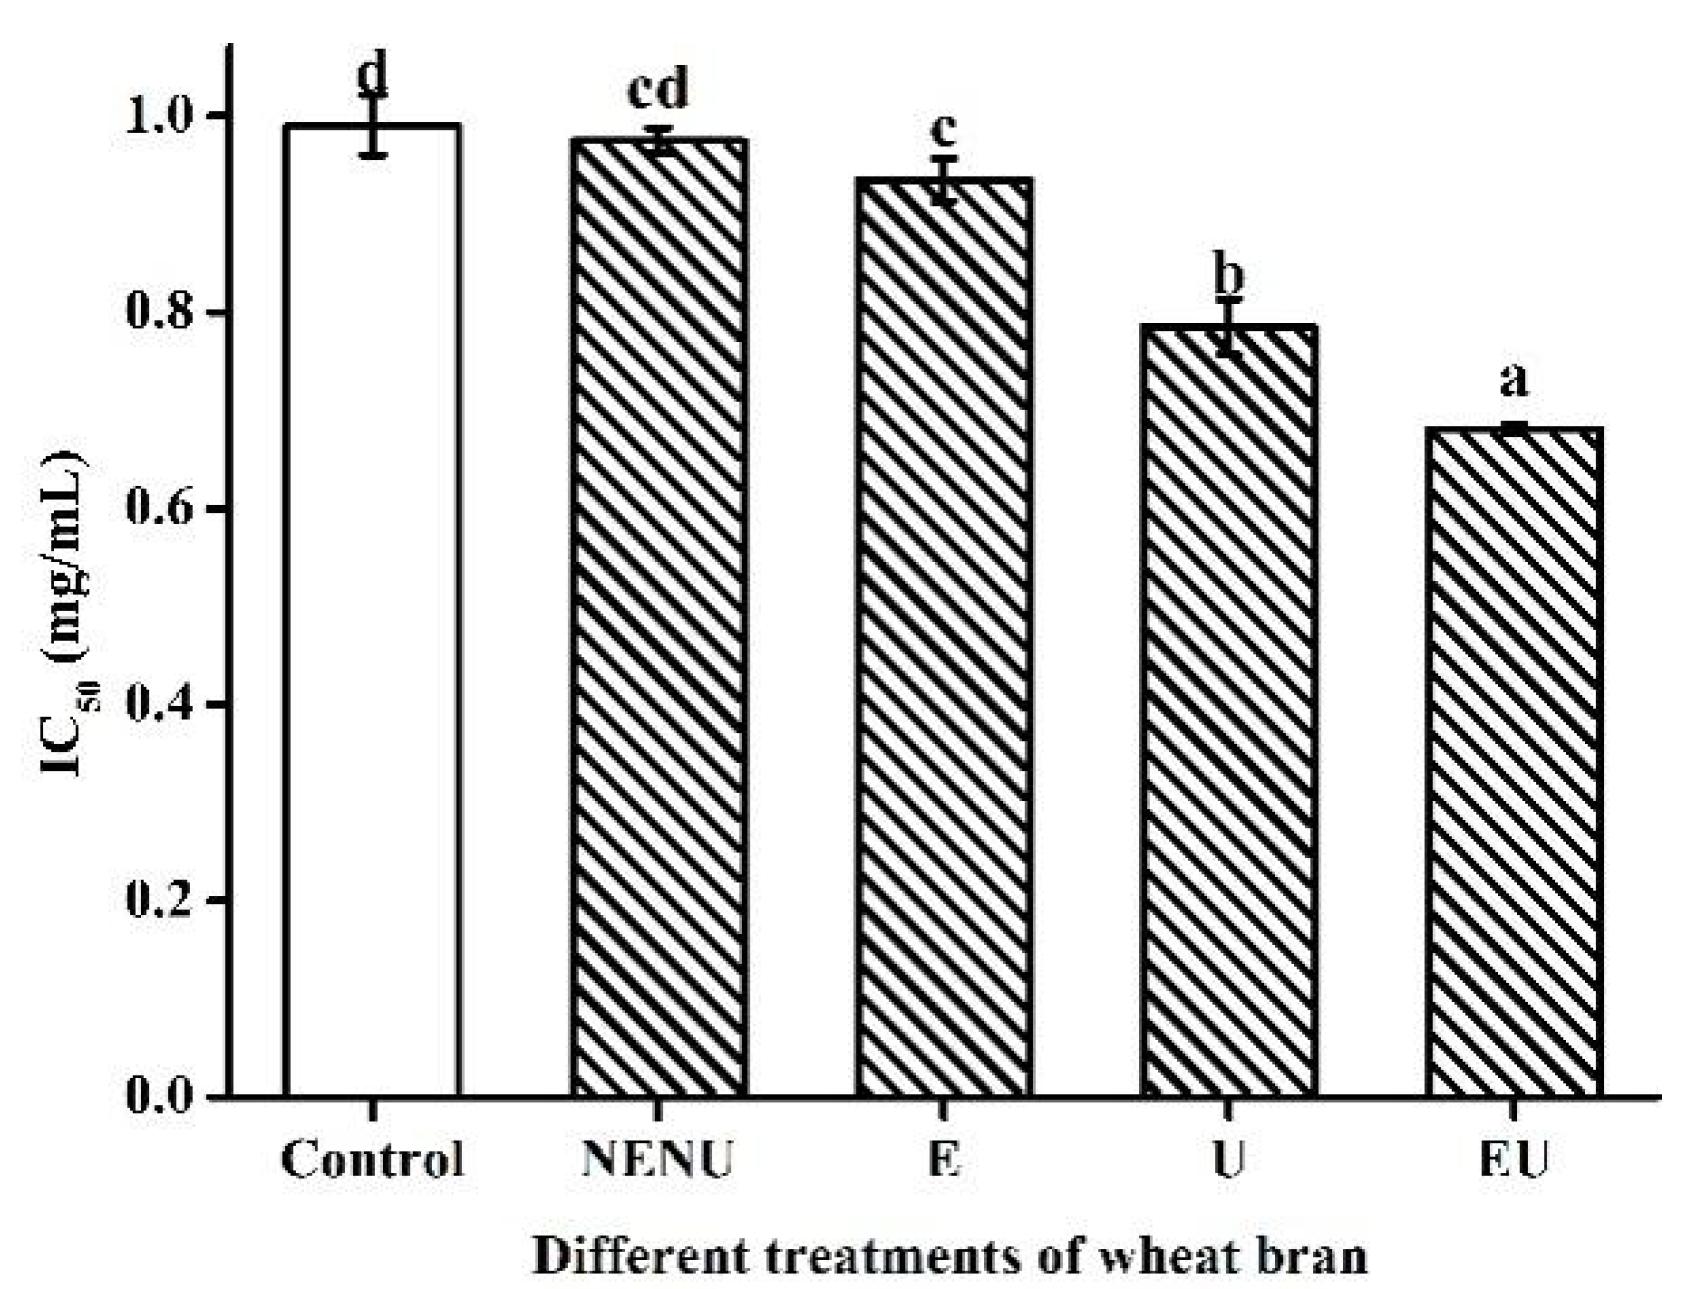
3.3. The Effect of Extrusion and UAE on TPC and AA of Jizi439 BWB

Jizi439 BWB powder was divided into four groups, including NENU, E, U, and EU groups. The white wheat bran was used as a control. As shown in Figure 4, the TPC and AA of Jizi439 BWB were both significantly improved by extrusion or UAE, which were up to 2856.3 ± 57.7 μg GAE/g DW and 85.5% ± 1.1% when two processes were both conducted.
The IC50 values were calculated by interpolation from linear regression analysis of the percentage of scavenging activity (AA) against sample concentration (mg/mL) using the SPSS statistics program, and lower IC50 values represent higher antioxidant activity. There is no significant difference between the control and NENU groups. Extrusion or UAE could decrease IC50 values significantly, with the EU group being the lowest, suggesting that extrusion and UAE could increase AA (Figure 5).

3.4. Profile of Phenolic Compounds in Jizi439 BWB Extracts

The identification of phenolic compounds from Jizi439 BWB extracts was carried out by comparison of retention times with external standards. The HPLC chromatogram of 11 pure compositions mixture standard was shown in Figure 6.
The profiles of phenolic compounds from NENU, EU, and control groups were shown in Table 7. Three simple phenolic acids, including gallic acid, syringic acid, and p-coumaric acid, were observed in the control group. Gallic acid, chlorogenic acid, vanillic acid, caffeic acid, luteolin, and apigenin were identified in NENU and EU groups. Gallic acid in NENU and EU groups were significantly lower than that of control. Other phenolic acids, including chlorogenic acid, vanillic acid, caffeic acid, and flavonoids (including luteolin, and apigenin) in the EU group were significantly higher than the NENU group.

4. Discussion

Extrusion has been reported to increase TPC and AA of snacks made from beans [29] or wheat bran [23]. It could potentially improve sensory acceptance and nutritional properties of many food products, including rice, sorghum, apple pomace [30]. Our study showed that the optimized extrusion processes should be 110 °C for the third heating block temperature, 25% feed water content, and 140 rpm screw speeds. Results in Table 3 and Table 4 indicated that extrusion temperature was the most important factor on AA, which reached peak value at 130 °C, according to Figure 2. Similar results were found previously by Sharama et al., and the possible explanation could be the browning pigments that generated from Maillard reaction enhanced AA [31]. Increased temperature promoted the release of phenolic compounds, so that TPC reached peak value at 110 °C; however, it decreased along with the increase of temperature (Figure 2) as phenolics are unstable when the temperature is over 120 °C [32]. An increase in feed water content resulted in higher TPC and AA (Table 3), possibly because of the weakened shearing effects by water in the extruder [33]. There’s controversy regarding whether screw speed could increase AA or not, our results was in accordance with Khanal et al. [34] that AA increased with screw speed, which was due to the procyanidin in the wheat bran degraded under high screw speed. On the contrary, a decrease of AA was found when the screw speed increased in Ozer’s research [33]. Thus, more work should be addressed on the association between screw speed and AA during the extrusion process in the future.
Based on the optimized extrusion condition, another orthogonal experiment was designed for UAE. Results showed that the extraction temperature was the most significant factor on TPC (p < 0.05) and AA (p < 0.005). TPC reached maximum value when the temperature went up to 70 °C (Figure 3), since more phenolics diffused into the solvent at higher temperature [35]. Conversely, AA was declined after it reached the peak value at 50 °C (Figure 3). Similar phenomena were reported by Thoo et al. [36]. Unlike extrusion, whose thermal process is within a short time, heat treatment during extraction is a relatively long-time process that could cause the degradation of polyphenols, and therefore, leading to a significant loss of antioxidant capacity [36,37,38]. The optimal extraction time for TPC and AA was different, because DPPH scavenging ability depends not only on phenolics, but also other antioxidant compounds that may exist in the extracts [39]. Ultrasonic frequency possessed the second most significant impact on TPC (p < 0.05), and the optimal condition was at the medium level of 35 kHz. Increased frequency and energy provided by ultrasound could release phenolics from the matrix, while paradoxically accelerate the degradation of phenolics [40]. Ultrasonic power was another factor that significantly increases AA (p < 0.05) according to our results (Table 6), which was reported before in tannin extraction [41]. Thus, the optimized UAE processes should be 50 °C, 40 min, 35 kHz, and 300 W for ultrasonic frequency and power. Verification experiments were conducted under optimized extrusion and extraction conditions. As shown in Figure 2 and Figure 3, TPC and AA of Jizi439 BWB were significantly increased by optimized extrusion, and especially UAE processing (p < 0.05). Extrusion could partially break the ester bonds between phenolics and cell wall matrix that resulted in the release of bound phenolics. Meanwhile, sonication simultaneously enhanced the hydration and fragmentation process, while facilitating the mass transfer of solutes to the extraction solvent [21].
The profile of phenolic extracts from Jizi439 BWB was investigated by HPLC analysis; results were shown in Table 7. Four phenolic acid (gallic acid, chlorogenic acid, vanillic acid, and caffeic acid), and two flavonoids (luteolin and apigenin) had been detected in the extracts. Chlorogenic acid was the predominant phenolic compound in Jizi439 BWB according to our results, which was different from other studies that ferulic acid is the most abundant phenolic compound in wheat [42,43]. Although differences of wheat varieties and growing environments could be the reason for that [44], more investigation regarding phenolic profile in Jizi439 BWB should be done in the future. It should be noted that gallic acid was not increased by either extrusion or UAE, indicating that gallic acid may not be freed from bonds with other molecules, a similar phenomenon was mentioned before by Gaxiola-Cuevas et al. [45]. Luteolin exhibited the greatest increase after extrusion and UAE, which was in accordance with Hernandez et al. [46] in black bean.

5. Conclusions

Both extrusion and UAE could significantly increase the TPC and AA of Jizi439 BWB. The optimized extrusion combination was the third heating block temperature 110 °C, feed water content 25%, screw speeds 140 rpm; meanwhile, the optimum UAE combination was temperature 50 °C, time 40 min, 35 kHz, and 300 W for ultrasonic frequency and power. Preliminary investigation of the phenolic profile by HPLC suggested that by optimizing extrusion and extraction condition, phenolic acids (except for gallic acid), and flavonoid (especially luteolin) were significantly increased in Jizi439 BWB. Our study would provide a valuable reference for processing Jizi439 BWB before making or commercially utilize it into health-related food products.

Author Contributions

Conceptualization, X.C. and W.D.; methodology, X.C., X.L., G.W. and K.Z.; validation, X.Z. and W.D.; investigation, X.L.; data curation, X.L.; writing—original draft preparation, X.C. and X.L.; writing—review and editing, X.C., X.Z., Y.W., and W.D. X.C. and X.L. contributed equally to this study. All authors have read and agreed to the published version of the manuscript.

Funding

This research was funded by Key Laboratory of Bulk Grain and Oil Deep Processing Ministry of Education (Wuhan Polytechnic University)(grant number 2018JYBQGDKFB04), the Collaborative Grant-in-Aid of the HBUT National “111” center for cellular Regulation and Molecular Pharmaceutics (XBTK-2020001), and The National Key Research and Development Program of China (grant number: 2018YFD0401002).

Conflicts of Interest

The authors declare no conflict of interest.

References

  1. Laddomada, B.; Caretto, S.; Mita, G. Wheat Bran Phenolic Acids: Bioavailability and Stability in Whole Wheat-Based Foods. Molecules 2015, 20, 15666–15685. [Google Scholar] [CrossRef] [PubMed]
  2. Lan, S.Q.; Li, X.P.; Zhang, Y.L.; Chen, S. Development of a New Black Wheat Variety Jizi439 with High Contents of Trace Elements. J. Hebei Agric. Sci. 2010, 14, 43–45. (In Chinese) [Google Scholar] [CrossRef]
  3. Wu, H.; Ji, T.; Ma, X.; Wang, L. Effect of Jizi439 (Black Wheat) on Blood Glucose Levels in Patients with Type 2 Diabetes. Chin. J. Pharm. Econ. 2015, 12, 75–79. (In Chinese) [Google Scholar]
  4. Sharma, S.; Agrawal, R.P.; Choudhary, M.; Jain, S.; Goyal, S.; Agarwal, V. Beneficial effect of chromium supplementation on glucose, HbA1C and lipid variables in individuals with newly onset type-2 diabetes. J. Trace Elem. Med. Boil. 2011, 25, 149–153. [Google Scholar] [CrossRef] [PubMed]
  5. Havel, P.J. A scientific review: The role of chromium in insulin resistance. Diabetes Educ. 2004, 30, 1–14. [Google Scholar]
  6. Wolever, T. Is glycaemic index (GI) a valid measure of carbohydrate quality? Eur. J. Clin. Nutr. 2013, 67, 522–531. [Google Scholar] [CrossRef]
  7. Dembinska-Kiec, A.; Mykkänen, O.; Kieć-Wilk, B.; Mykkänen, H. Antioxidant phytochemicals against type 2 diabetes. Br. J. Nutr. 2008, 99, ES109–ES117. [Google Scholar] [CrossRef] [Green Version]
  8. Hu, C.; Cai, Y.-Z.; Li, W.; Corke, H.; Kitts, D.D. Anthocyanin characterization and bioactivity assessment of a dark blue grained wheat (Triticum aestivum L. cv. Hedong Wumai) extract. Food Chem. 2007, 104, 955–961. [Google Scholar] [CrossRef]
  9. Baynes, J.W.; Thorpe, S.R. Role of oxidative stress in diabetic complications: A new perspective on an old paradigm. Diabetes 1999, 48, 1–9. [Google Scholar] [CrossRef]
  10. Pickup, J. Inflammation and activated innate immunity in the pathogenesis of type 2 diabetes. Diabetes Care 2004, 27, 813–823. [Google Scholar] [CrossRef] [Green Version]
  11. Urso, M.; Clarkson, P.M. Oxidative stress, exercise, and antioxidant supplementation. Toxicology 2003, 189, 41–54. [Google Scholar] [CrossRef]
  12. Lea, A.J.; Tung, J.; Zhou, X. A Flexible, Efficient Binomial Mixed Model for Identifying Differential DNA Methylation in Bisulfite Sequencing Data. PLoS Genet. 2015, 11, e1005650. [Google Scholar] [CrossRef] [PubMed] [Green Version]
  13. Iqbal, S.; Bhanger, M.; Anwar, F. Antioxidant properties and components of bran extracts from selected wheat varieties commercially available in Pakistan. LWT Food Sci. Technol. 2007, 40, 361–367. [Google Scholar] [CrossRef]
  14. Liu, Q.; Qiu, Y.; Beta, T. Comparison of Antioxidant Activities of Different Colored Wheat Grains and Analysis of Phenolic Compounds. J. Agric. Food Chem. 2010, 58, 9235–9241. [Google Scholar] [CrossRef] [PubMed]
  15. Vaher, M.; Matso, K.; Levandi, T.; Helmja, K.; Kaljurand, M. Phenolic compounds and the antioxidant activity of the bran, flour and whole grain of different wheat varieties. Procedia Chem. 2010, 2, 76–82. [Google Scholar] [CrossRef] [Green Version]
  16. Sharma, S.; Chunduri, V.; Kumar, A.; Kumar, R.; Khare, P.; Kondepudi, K.K.; Bishnoi, M.; Garg, M. Anthocyanin bio-fortified colored wheat: Nutritional and functional characterization. PLoS ONE 2018, 13, e0194367. [Google Scholar] [CrossRef] [Green Version]
  17. Guha, M.; Ali, S.Z. Extrusion cooking of rice: Effect of amylose content and barrel temperature on product profile. J. Food Process. Preserv. 2006, 30, 706–716. [Google Scholar] [CrossRef]
  18. Dewanto, V.; Wu, X.; Liu, R.H. Processed Sweet Corn Has Higher Antioxidant Activity. J. Agric. Food Chem. 2002, 50, 4959–4964. [Google Scholar] [CrossRef]
  19. Esposito, F.; Arlotti, G.; Bonifati, A.M.; Napolitano, A.; Vitale, D.; Fogliano, V. Antioxidant activity and dietary fibre in durum wheat bran by-products. Food Res. Int. 2005, 38, 1167–1173. [Google Scholar] [CrossRef]
  20. Brennan, C.S.; Brennan, M.; Derbyshire, E.; Tiwari, B. Effects of extrusion on the polyphenols, vitamins and antioxidant activity of foods. Trends Food Sci. Technol. 2011, 22, 570–575. [Google Scholar] [CrossRef]
  21. Wang, J.; Sun, B.; Cao, Y.; Tian, Y.; Li, X. Optimisation of ultrasound-assisted extraction of phenolic compounds from wheat bran. Food Chem. 2008, 106, 804–810. [Google Scholar] [CrossRef]
  22. Chemat, F.; Rombaut, N.; Sicaire, A.-G.; Meullemiestre, A.; Fabiano-Tixier, A.-S.; Abert-Vian, M. Ultrasound assisted extraction of food and natural products. Mechanisms, techniques, combinations, protocols and applications. A review. Ultrason. Sonochem. 2017, 34, 540–560. [Google Scholar] [CrossRef] [PubMed]
  23. Ramos-Enríquez, J.R.; Ramirez-Wong, B.; Robles-Sánchez, R.M.; Robles-Zepeda, R.; González-Aguilar, G.A.; Gutiérrez-Dorado, R. Effect of Extrusion Conditions and the Optimization of Phenolic Compound Content and Antioxidant Activity of Wheat Bran Using Response Surface Methodology. Plant. Foods Hum. Nutr. 2018, 73, 228–234. [Google Scholar] [CrossRef] [PubMed]
  24. Zhang, Q.; Zhang, J.; Shen, J.; Silva, A.; Dennis, D.A.; Barrow, C.J. A Simple 96-Well Microplate Method for Estimation of Total Polyphenol Content in Seaweeds. Envrion. Boil. Fishes 2006, 18, 445–450. [Google Scholar] [CrossRef] [Green Version]
  25. Li, W.; Shan, F.; Sun, S.; Corke, A.H.; Beta, T. Free Radical Scavenging Properties and Phenolic Content of Chinese Black-Grained Wheat. J. Agric. Food Chem. 2005, 53, 8533–8536. [Google Scholar] [CrossRef] [PubMed]
  26. Shimamura, T.; Sumikura, Y.; Yamazaki, T.; Tada, A.; Kashiwagi, T.; Ishikawa, H.; Matsui, T.; Sugimoto, N.; Akiyama, H.; Ukeda, H. Applicability of the DPPH assay for evaluating the antioxidant capacity of food additives—Inter-laboratory evaluation study. Anal. Sci. 2014, 30, 717–721. [Google Scholar] [CrossRef] [PubMed] [Green Version]
  27. Zimmer, A.R.; Leonardi, B.; Miron, D.; Schapoval, E.E.S.; De Oliveira, J.R.; Gosmann, G. Antioxidant and anti-inflammatory properties of Capsicum baccatum: From traditional use to scientific approach. J. Ethnopharmacol. 2012, 139, 228–233. [Google Scholar] [CrossRef] [Green Version]
  28. Li, Y.Y.; Hu, C.R. Experiment Design and Data Processing, 2nd ed.; Chemical Industry Press: Beijing, China, 2008; pp. 124–146. [Google Scholar]
  29. Anton, A.A.; Fulcher, R.G.; Arntfield, S.D. Physical and nutritional impact of fortification of corn starch-based extruded snacks with common bean (Phaseolus vulgaris L.) flour: Effects of bean addition and extrusion cooking. Food Chem. 2009, 113, 989–996. [Google Scholar] [CrossRef]
  30. Lohani, U.C.; Muthukumarappan, K. Effect of Extrusion Processing Parameters on Antioxidant, Textural and Functional Properties of Hydrodynamic Cavitated Corn Flour, Sorghum Flour and Apple Pomace-Based Extrudates. J. Food Process. Eng. 2016, 40, 40. [Google Scholar] [CrossRef]
  31. Sharma, P.; Gujral, H.S.; Singh, B. Antioxidant activity of barley as affected by extrusion cooking. Food Chem. 2012, 131, 1406–1413. [Google Scholar] [CrossRef]
  32. Chalermchaiwat, P.; Jangchud, K.; Jangchud, A.; Charunuch, C.; Prinyawiwatkul, W. Antioxidant activity, free gamma-aminobutyric acid content, selected physical properties and consumer acceptance of germinated brown rice extrudates as affected by extrusion process. LWT Food Sci. Technol. 2015, 64, 490–496. [Google Scholar] [CrossRef]
  33. Ozer, E.A.; Herken, E.N.; Guzel, S.; Ainsworth, P.; Ibanoglu, S. Effect of extrusion process on the antioxidant activity and total phenolics in a nutritious snack food. Int. J. Food Sci. Technol. 2006, 41, 289–293. [Google Scholar] [CrossRef]
  34. Khanal, R.C.; Howard, L.R.; Brownmiller, C.R.; Prior, R.L. Influence of Extrusion Processing on Procyanidin Composition and Total Anthocyanin Contents of Blueberry Pomace. J. Food Sci. 2009, 74, H52–H58. [Google Scholar] [CrossRef]
  35. Al-Farsi, M.; Lee, C.Y. Optimization of phenolics and dietary fibre extraction from date seeds. Food Chem. 2008, 108, 977–985. [Google Scholar] [CrossRef]
  36. Thoo, Y.Y.; Ho, S.K.; Liang, J.Y.; Ho, C.W.; Tan, C.P. Effects of binary solvent extraction system, extraction time and extraction temperature on phenolic antioxidants and antioxidant capacity from mengkudu (Morinda citrifolia). Food Chem. 2010, 120, 290–295. [Google Scholar] [CrossRef]
  37. Dini, I.; Tenore, G.C.; Dini, A. Antioxidant compound contents and antioxidant activity before and after cooking in sweet and bitter Chenopodium quinoa seeds. LWT Food Sci. Technol. 2010, 43, 447–451. [Google Scholar] [CrossRef]
  38. Liyana-Pathirana, C.; Shahidi, F. Optimization of extraction of phenolic compounds from wheat using response surface methodology. Food Chem. 2005, 93, 47–56. [Google Scholar] [CrossRef]
  39. Silva, E.; Rogez, H.; Larondelle, Y. Optimization of extraction of phenolics from Inga edulis leaves using response surface methodology. Sep. Purif. Technol. 2007, 55, 381–387. [Google Scholar] [CrossRef]
  40. Biesaga, M. Influence of extraction methods on stability of flavonoids. J. Chromatogr. A 2011, 1218, 2505–2512. [Google Scholar] [CrossRef]
  41. Sivakumar, V.; Verma, V.R.; Rao, P.G.; Swaminathan, G. Studies on the use of power ultrasound in solid–liquid myrobalan extraction process. J. Clean. Prod. 2007, 15, 1813–1818. [Google Scholar] [CrossRef]
  42. Kim, K.-H.; Tsao, R.; Yang, R.; Cui, S.W. Phenolic acid profiles and antioxidant activities of wheat bran extracts and the effect of hydrolysis conditions. Food Chem. 2006, 95, 466–473. [Google Scholar] [CrossRef]
  43. Van Hung, P.; Maeda, T.; Miyatake, K.; Morita, N. Total phenolic compounds and antioxidant capacity of wheat graded flours by polishing method. Food Res. Int. 2009, 42, 185–190. [Google Scholar] [CrossRef]
  44. Wang, S.; Dong, F.; Wang, G. Optimization of Extraction Process for Phenolic Acid from Wheat Grains and Effect of Geographic Origin and Variety on Phenolic Acid Content. Food Sci. 2019, 40, 306–312. [Google Scholar]
  45. Gaxiola-Cuevas, N.; Mora-Rochín, S.; Cuevas-Rodríguez, E.; León-López, L.; Reyes-Moreno, C.; Montoya-Rodríguez, A.; Milán-Carrillo, J. Phenolic Acids Profiles and Cellular Antioxidant Activity in Tortillas Produced from Mexican Maize Landrace Processed by Nixtamalization and Lime Extrusion Cooking. Plant. Foods Hum. Nutr. 2017, 72, 314–320. [Google Scholar] [CrossRef] [PubMed]
  46. Chuck-Hernández, C.; Gutiérrez-Uribe, J.; Serna-Saldivar, S.O. Effect of thermoplastic extrusion and cell wall degrading enzymes on the phenolic and flavonoid compounds extracted from whole and dehulled black beans (Phaseolus vulgaris L.). Insights Biotechnol. 2011, 1, 14–18. [Google Scholar]
Figure 1. Scheme of optimizing Jizi439 black wheat bran (BWB) processing steps.
Processes 08 01153 g001
Figure 2. The effect of different extrusion parameters on TPC (a) and AA (b). A, the third heating block temperature (°C); B, feed water content (%); C, screw speeds (rpm).
Processes 08 01153 g002
Figure 3. The effect of different UAE parameters on TPC (a) and AA (b). A, temperature (°C); B, time (min); C, ultrasonic frequency (kHz); D, ultrasonic power (Watt).
Processes 08 01153 g003
Figure 4. Effect of different treatments on TPC and AA of Jizi439 BWB. Control, white wheat bran (without extrusion and UAE); NENU, raw black wheat bran (without extrusion and UAE); E, extruded but without UAE black wheat bran; U, UAE but without extruded black wheat bran; EU, extruded, and UAE black wheat bran. (ae) Indicate a significant difference between different groups (n = 3; p < 0.05).
Processes 08 01153 g004
Figure 5. IC50 values of phenolic extracts from Jizi439 BWB by different treatments. Control, white wheat bran (without extrusion and UAE); NENU, raw Jizi439 BWB (without extrusion and UAE); E, extruded but without UAE; U, UAE but without extruded; EU, extruded, and UAE; (ad) Indicate a significant difference between different groups (n = 3; p < 0.05).
Processes 08 01153 g005
Figure 6. HPLC chromatogram of mixed standards. Peak 1, gallic acid; 2, chlorogenic acid; 3, p-hydroxybenzoic acid; 4, vanillic acid and caffeic acid; 5, syringic acid; 6, p-coumaric acid; 7, ferulic acid; 8, o-coumaric acid; 9, luteolin; 10, apigenin.
Processes 08 01153 g006
Table 1. L9(34) orthogonal factors and levels of extrusion.
LevelFactors
A BC
19021140
211023160
313025180
A, the third heating block temperature (°C); B, feed water content (%); C, screw speeds (rpm).
Table 2. L9(34) orthogonal factors and levels of extraction.
LevelFactors
A BCD
1302020200
2504035300
3706050400
A, temperature (°C); B, time (min); C, ultrasonic frequency (kHz); D, ultrasonic power (Watt).
Table 3. L9(34) Orthogonal experiment for extrusion of BWB.
Experiment No.ABCTPC
(μg GAE/g DW)
AA
DPPH Scavenging Activity (%)
11111848.0 ± 138.169.5 ± 2.3
21221897.2 ± 40.971.2 ± 1.1
31331951.0 ± 88.372.3 ± 1.6
42122106.8 ± 93.783.3 ± 1.3
52231956.5 ± 64.675.4 ± 1.7
62312232.4 ± 64.986.7 ± 2.9
73131951.8 ± 30.481.1 ± 0.6
83212024.7 ± 69.185.0 ± 1.8
93321999.3 ± 120.382.9 ± 1.8
TPCk11898.71968.92035.0
k22098.61959.52001.1
k31991.92060.91953.1
R199.8101.482.0
AAk171.078.080.4
k281.877.279.1
k383.080.676.2
R12.03.44.1
Means ± SD, n = 3; A, the third heating block temperature (°C); B, feed water content (%); C, screw speeds (rpm); TPC, total phenolic content; AA, antioxidant activity in terms of DPPH radical scavenging activity; k1, k2, k3, average responses at level 1, 2, 3; R, range of average responses.
Table 4. Variance analysis of L9(34) orthogonal experiment for extrusion.
Variance SourcesResponseFree DegreeSSMSFp
ATPC259,99029,9952.90.26
AA2316158260.04
BTPC223,76011,8801.10.47
AA28.84.40.70.58
CTPC217658820.10.92
AA21.10.60.10.91
ErrorTPC220,68210,341
AA212.06
A, the third heating block temperature (°C); B, feed water content (%); C, screw speeds (rpm); SS, the sum of the squares of deviations; MS, the sum of mean-square error. The critical F value is 39.00 at 97.5% confidence, and 19.00 at 95.0% confidence.
Table 5. L9(34) Orthogonal experiment for extraction of BWB.
Experiment No.ABCDTPC
(μg GAE/g DW)
AA
DPPH Scavenging Activity (%)
111112188.2 ± 110.079.0 ± 1.1
212222499.2 ± 38.879.7 ± 1.6
313332301.3 ± 145.980.3 ± 1.1
421232491.7 ± 14.686.8 ± 1.3
522312370.9 ± 187.485.6 ± 1.5
623122527.3 ± 96.085.1 ± 0.8
731322682.7 ± 26.672.4 ± 1.0
832132898.5 ± 230.172.9 ± 0.9
933212883.2 ± 87.671.0 ± 0.6
TPCk12393.62454.22538.02480.8
k22463.32589.52624.72569.8
k32821.52570.62451.62563.8
R491.9135.3173.189.0
AAk179.779.479.078.6
k285.879.479.279.1
k372.178.879.480.0
R13.70.60.41.43
Means ± SD, n = 3; A, temperature (°C); B, time (min); C, ultrasonic frequency (kHz); D, ultrasonic power(Watt); TPC, total phenolic content; AA, antioxidant activity; k1, k2, k3, average responses at level 1, 2, 3; R, range of average responses.
Table 6. Variance analysis of L9(34) orthogonal experiment for UAE.
Variance SourcesResponseFree DegreeSSMSFp
ATPC21,164,365582,18237.20.00
AA2851426326.50.00
BTPC296,64548,3223.10.07
AA22.01.00.80.47
CTPC2134,77367,3874.30.03
AA20.70.40.30.76
DTPC244,47722,2381.40.27
AA29.54.73.60.04
ErrorTPC2281,51615,640
AA223.51.3
A, temperature (°C); B, time (min); C, ultrasonic frequency (kHz); D, ultrasonic power (Watt); SS, the sum of the squares of deviations; MS, the sum of mean-square error. The critical F value is 199.00 at 99.5% confidence, 99.01 at 99.0% confidence, 39.00 at 97.5% confidence, and 19.00 at 95.0% confidence.
Table 7. Contents of identified phenolic compounds in extracts from Jizi439 BWB (μg/mg dry matter).
ControlNENUEU
Gallic acid2.80 ± 0.09a0.46 ± 0.02b0.47 ± 0.001b
Chlorogenic acidND2.17 ± 0.01b2.41 ± 0.001a
Vanillic acid and caffeic acidND0.65 ± 0.003b0.80 ± 0.001a
Syringic acid1.16 ± 0.002NDND
P-coumaric acid0.92 ± 0.02NDND
LuteolinND1.30 ± 0.05b2.10 ± 0.01a
ApigeninND0.02 ± 0.002b0.03 ± 0.001a
Control, white wheat bran (without extrusion and UAE); NENU, raw black wheat bran (without extrusion and UAE); EU, extruded, and UAE black wheat bran. (ab) Indicate a significant difference between different groups (n = 3; p < 0.05); ND, not detected.

