Effect of Heat Treatment and Light Exposure on the Antioxidant Activity of Flavonoids


Abstract
1. Introduction
2. Materials and Methods
2.1. Chemicals
2.2. Model Solutions of Flavonoids
2.3. Heat Treatment
2.4. Light Exposure
2.5. Measurement of Flavonoid Content and Antioxidant Activity
2.5.1. HPLC/DAD Analysis
2.5.2. ABTS+• Method
2.6. Assessment of the In Vivo Bioactivities
2.6.1. Animals
2.6.2. Preparation of Primary Splenocytes and Macrophages
2.6.3. Preparation of the Liver, Brain, Spleen, and Kidney Extracts
2.6.4. Cell Treatment
2.6.5. Analytical Measurements
- T and B cell proliferation assay
- 2.
- Evaluation of lipid peroxidation status
- 3.
- Determination of reduced glutathione
- 4.
- Measurement of catalase activity
- 5.
- Analysis of superoxide dismutase activity
- 6.
- Cellular anti-oxidant activity (CAA) assay
2.7. Statistical Analysis
3. Results
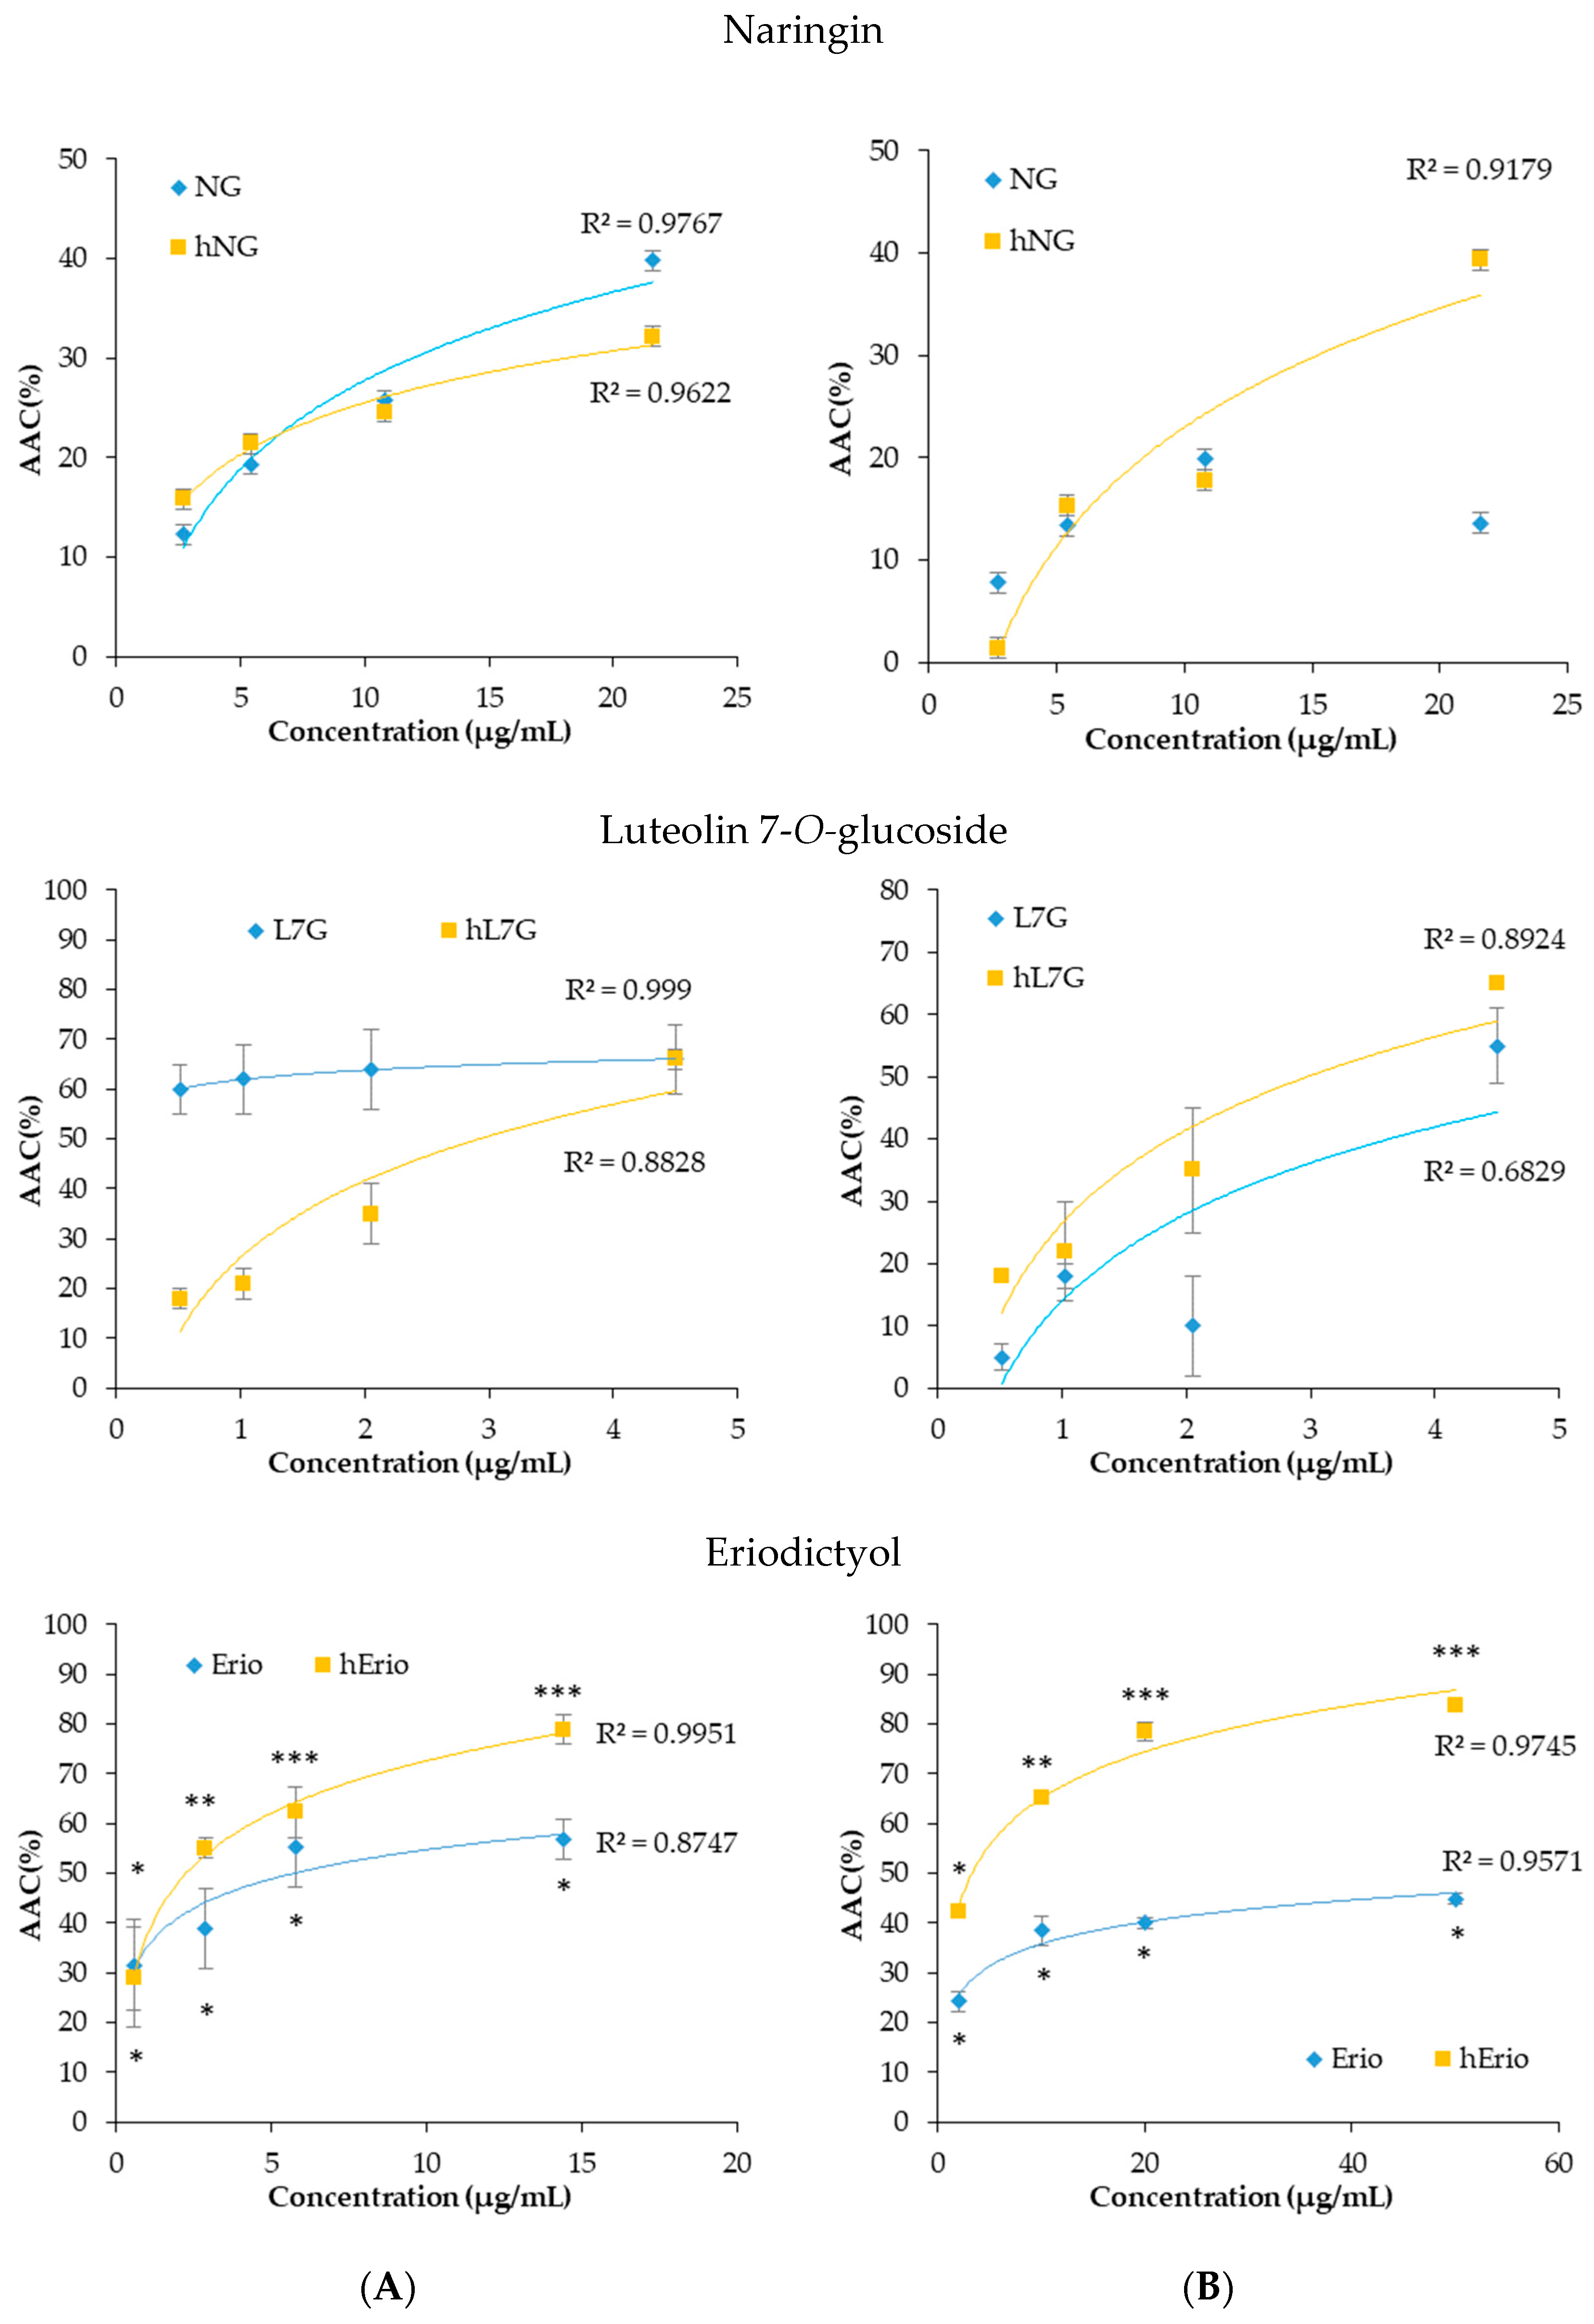
3.1. ΔTEAC a New Parameter to Understand the Evolution of the Antioxidant Activity of the Flavonoids
3.2. Effect of a Thermal Treatment and an Exposure to Light on the Evolution of ΔTEAC
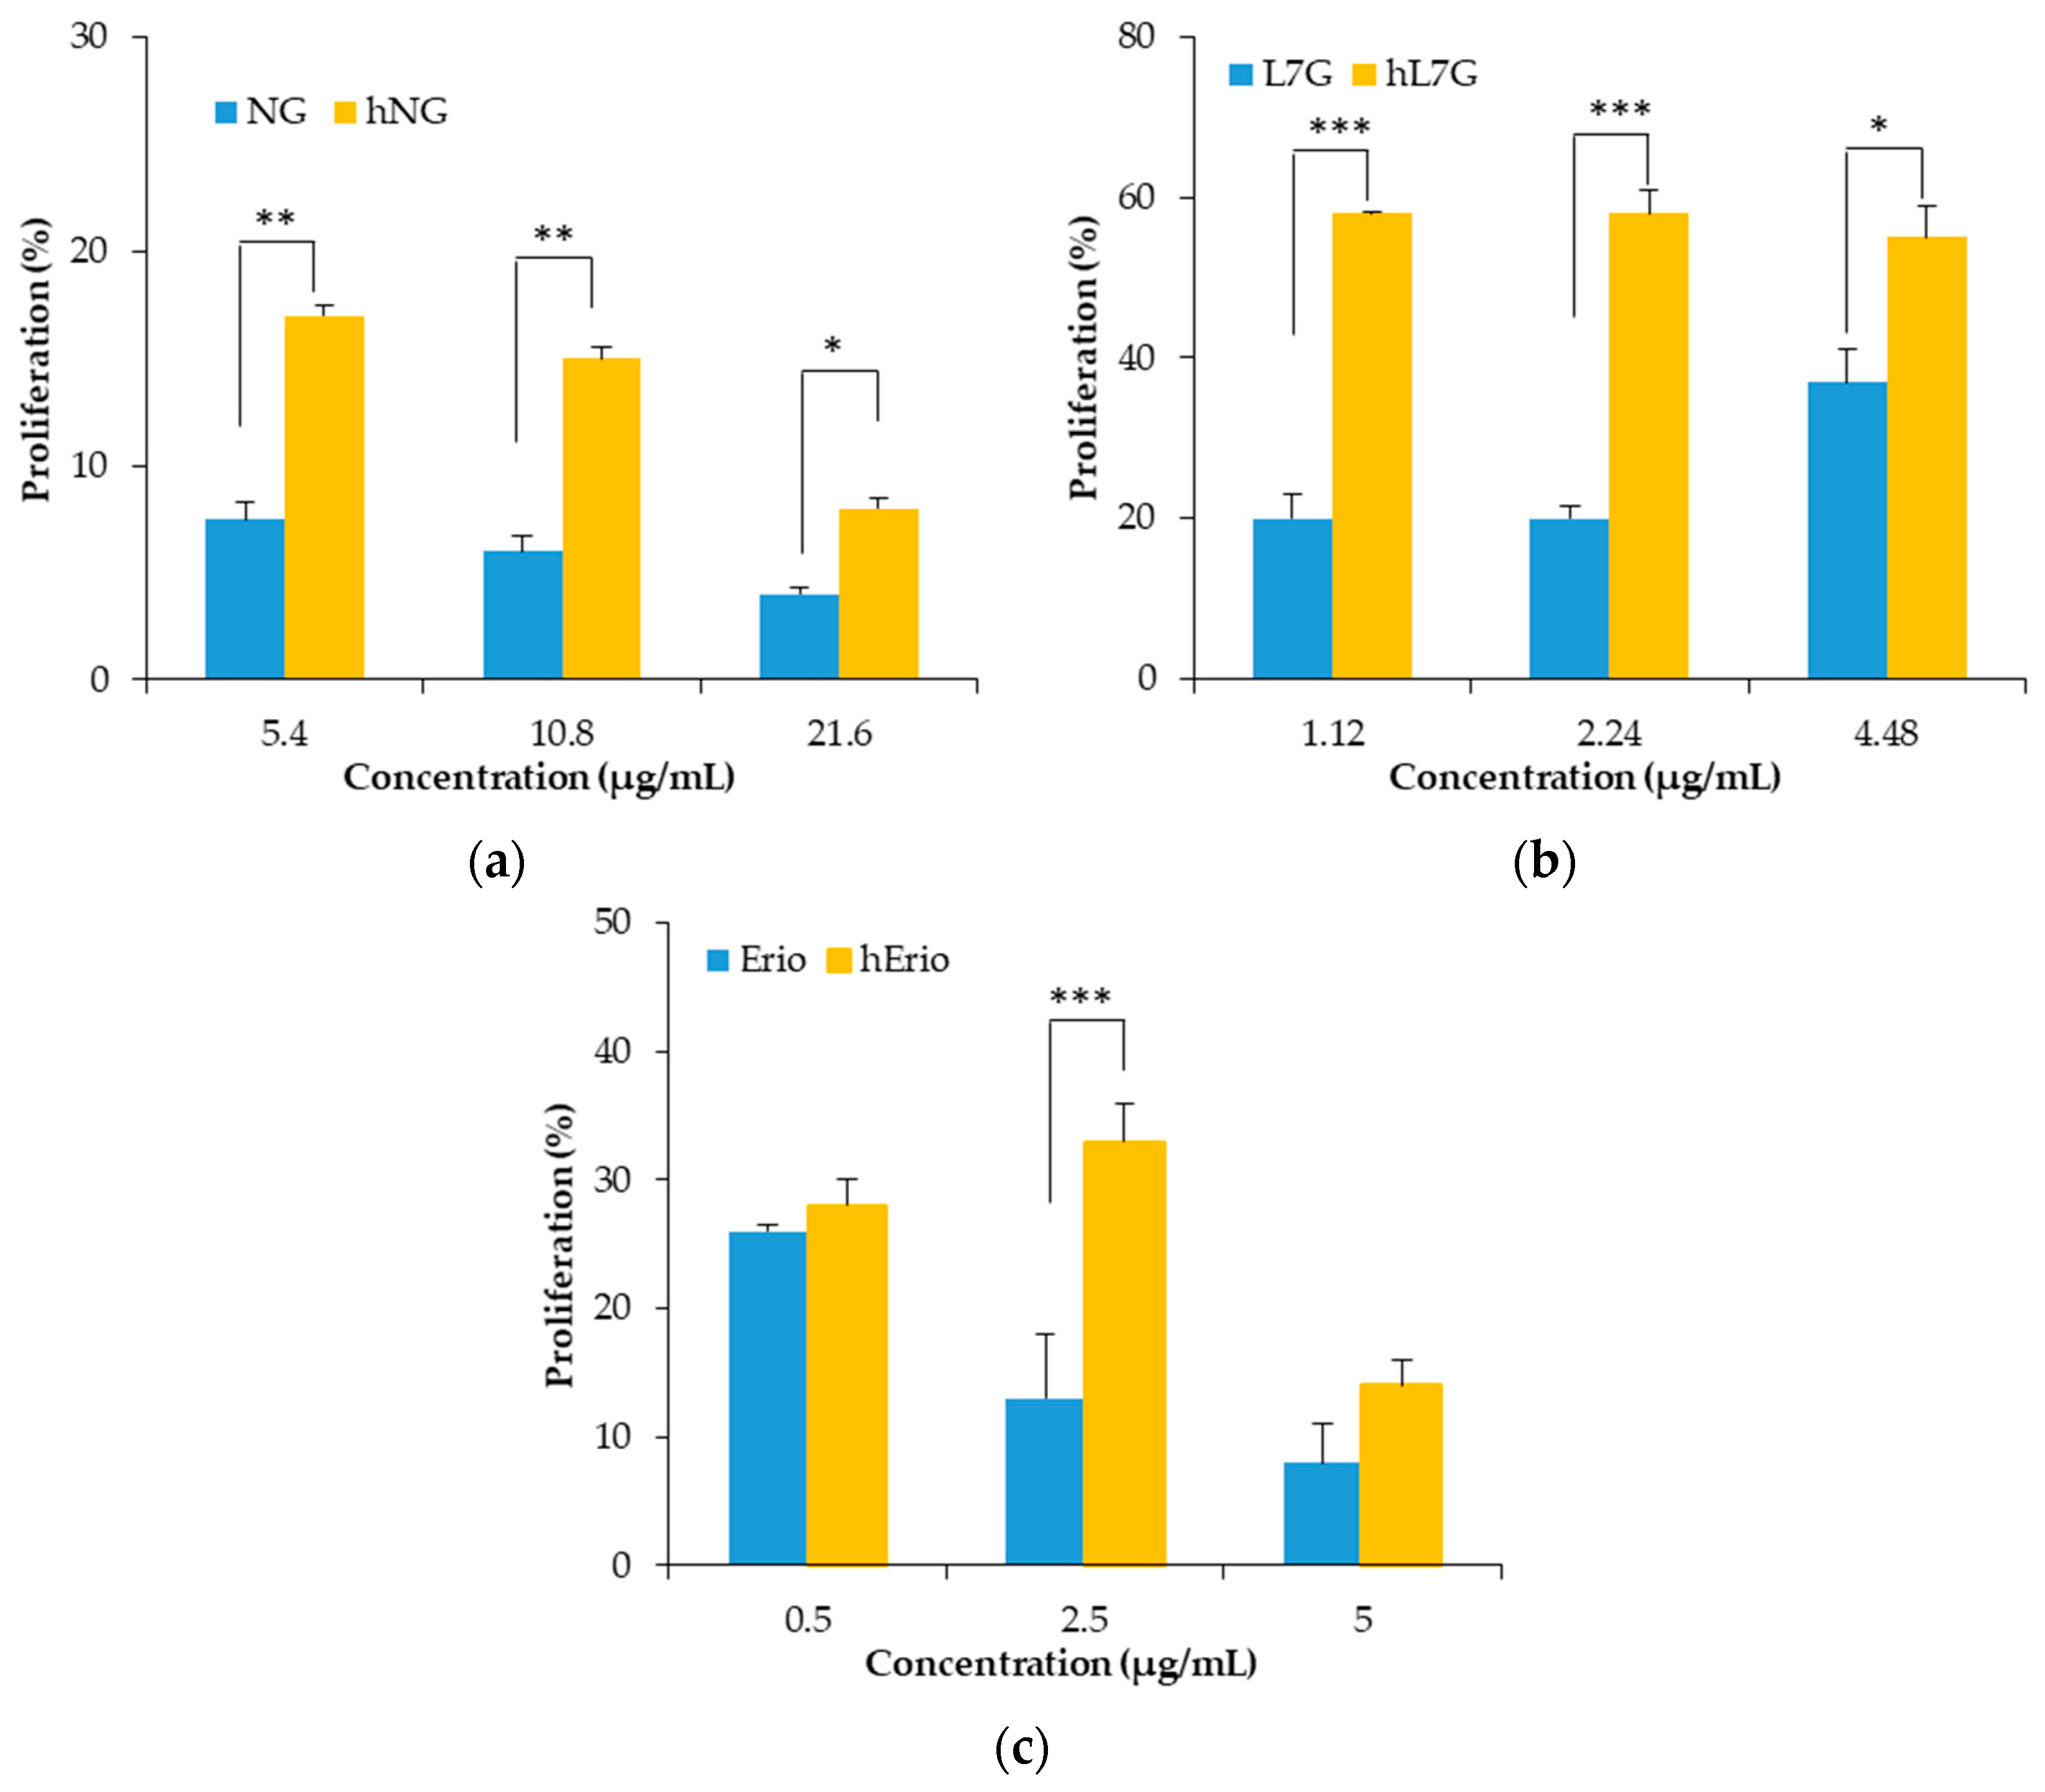
3.3. Evolution of the Biological Activities of the Flavonoid Model Solutions Thermally Treated

| MDA (nmol/mg Protein) | SOD (U/mg Protein) | GPx (U/mg Protein) | ||
|---|---|---|---|---|
| Liver | TN | 2.70 ± 0.29 | 0.730 ± 0.057 | 3.07 ± 0.11 |
| NG (40 mg/kg b.w.) | 2.08 ± 0.31 | 0.920 ± 0.081 | 3.24 ± 0.22 | |
| hNG (40 mg/kg b.w.) | 2.04 ± 0.21 | 0.890 ±.0076 | 3.83 ± 0.16 | |
| Kidney | TN | 1.93 ± 0.20 | 0.430 ± 0.053 | 4.09 ± 0.19 |
| NG (40 mg/kg b.w.) | 1.58 ± 0.19 | 0.650 ± 0.043 * | 3.71 ± 0.21 | |
| hNG (40 mg/kg b.w.) | 1.97 ± 0.23 | 0.830 ± 0.073 ** | 3.83 ± 0.24 | |
| Brain | TN | 2.50 ± 0.27 | 0.340 ± 0.012 | 4.01 ± 0.39 |
| NG (40 mg/kg b.w.) | 2.05 ± 0.26 | 0.790 ± 0.690 ** | 3.55 ± 0.46 | |
| hNG (40 mg/kg b.w.) | 1.94 ± 0.19 * | 0.490 ± 0.022 ♦ | 3.40 ± 0.29 | |
4. Discussion
5. Conclusions
Author Contributions
Funding
Conflicts of Interest
References
- Tomás-Barberan, F.A.; Ferreres, F.; Gil, M.I. Antioxidant phenolic metabolites from fruit and vegetables and changes during postharvest storage and processing. In Studies in Natural Products Chemistry; Atta-ur-Rahman, Ed.; Elsevier Science: Amsterdam, The Netherlands, 2000; Volume 23, pp. 739–795. Available online: http://linkinghub.elsevier.com/retrieve/pii/S1572599500801416 (accessed on 18 June 2018).
- Heim, K.E.; Tagliaferro, A.R.; Bobilya, D.J. Flavonoid antioxidants: Chemistry, metabolism and structure-activity relationships. J. Nutr. Biochem. 2002, 13, 572–584. [Google Scholar] [CrossRef]
- Ioannou, I.; Hafsa, I.; Ghoul, M. Review of the effects of food processing and formulation on flavonol and anthocyanin behaviour. J. Food Eng. 2012, 111, 208–217. [Google Scholar] [CrossRef]
- Larrauri, J.A.; Rez, P.R.; Saura-Calixto, F. Effect of Drying Temperature on the Stability of Polyphenols and Antioxidant Activity of Red Grape Pomace Peels. J. Agric. Food Chem. 1997, 45, 1390–1393. [Google Scholar] [CrossRef]
- Makris, D.P.; Rossiter, J.T. Domestic processing of onion bulbs (Allium cepa) and Asparagus spears (Asparagus officinalis): Effect of flavonol content and antioxidant status. J. Agric. Food Chem. 2001, 49, 3216–3222. [Google Scholar] [CrossRef] [PubMed]
- Jeong, S.M.; Kim, S.Y.; Kim, D.R.; Jo, S.C.; Nam, K.C.; Ahn, D.U.; Lee, S.C. Effect of Heat Treatment on the Antioxidant Activity of Extracts from Citrus Peels. J. Agric. Food Chem. 2004, 52, 3389–3393. [Google Scholar] [CrossRef] [PubMed]
- Murakami, M.; Yamaguchi, T.; Takamura, H.; Matoba, T. Effects of Thermal Treatment on Radical-scavenging Activity of Single and Mixed Polyphenolic compounds. J. Food Sci. 2004, 69, FCT7–FCT10. [Google Scholar] [CrossRef]
- Buchner, N.; Krumbein, A.; Rohn, S.; Kroh, L.W. Effect of thermal processing on the flavonols rutin and quercetin. Rapid Commun. Mass Spectrom. 2006, 20, 3229–3235. [Google Scholar] [CrossRef]
- Choi, Y.; Lee, S.M.; Chun, J.; Lee, H.B.; Lee, J. Influence of heat treatment on antioxidant activities and polyphenolic compounds of Shiitake (Lentinusedodes) mushroom. Food Chem. 2006, 99, 381–387. [Google Scholar] [CrossRef]
- Huang, Y.; Chang, Y.; Shao, Y. Effects of genotype and treatment on the antioxydant activity of sweet potato in Taiwan. Food Chem. 2006, 98, 529–538. [Google Scholar] [CrossRef]
- Rakić, S.; Petrović, S.; Kukić, J.; Jadranin, M.; Tesević, V.; Povrenović, D.; Šiler-Marinković, S. Influence of thermal treatment on phenolic compounds and antioxidant properties of oak acorns from Serbia. Food Chem. 2007, 104, 830–834. [Google Scholar] [CrossRef]
- Chuah, A.M.; Lee, Y.C.; Yamaguchi, T.; Takamura, H.; Yin, L.J.; Matoba, T. Effect of cooking on the antioxidant properties of coloured peppers. Food Chem. 2008, 111, 20–28. [Google Scholar] [CrossRef]
- Gorinstein, S.; Leontowicz, H.; Leontowicz, M.; Namiesnik, J.; Najman, K.; Drzewiecki, J.; Cvikrova, M.; Martincova, O.; Katrich, E.; Trakhtenberg, S. Comparison of the Main Bioactive Compounds and Antioxidant Activities in Garlic and White and Red Onions after Treatment Protocols. J. Agric. Food Chem. 2008, 56, 4418–4426. [Google Scholar] [CrossRef] [PubMed]
- Odriozola-Serrano, I.; Soliva-Fortuny, R.; Martin-Belloso, O. Phenolic acids, flavonoids, vitamin C and antioxidant capacity of strawberry juices processed by high-intensity pulsed electric fields or heat treatments. Eur. Food Res. Technol. 2008, 228, 239–248. [Google Scholar] [CrossRef]
- Vina, S.Z.; Chaves, A.R. Effect of heat treatment and refrigerated storage on antioxidant properties of pre-cut celery (Apium graveolens L.). Int. J. Food Sci. Technol. 2008, 43, 44–51. [Google Scholar] [CrossRef]
- Xu, B.; Chang, S.K.C. Total Phenolics, Phenolic Acids, Isoflavones, and Anthocyanins and Antioxidant Properties of Yellow and Black Soybeans as Affected by Thermal Processing. J. Agric. Food Chem. 2010, 56, 7165–7175. [Google Scholar] [CrossRef]
- Yue, X.; Xu, Z. Changes of Anthocyanins, Anthocyanidins, and Antioxidant Activity in Bilberry Extract during Dry Heating. J. Food Sci. 2008, 73, C494–C499. [Google Scholar] [CrossRef]
- Ranilla, L.G.; Genovese, M.I.; Lajolo, F.M. Effect of different cooking conditions on phenolic compounds and antioxidant capacity of some selected Brazilian bean (Phaselous vulgaris L.) cultivars. J. Agric. Food Chem. 2009, 57, 5734–5742. [Google Scholar] [CrossRef]
- Zielinski, H.; Mishalska, A.; Amigo-Benavent, M.; Del Castillo, M.D.; Piskula, M.K. Changes in protein quality and antioxidant properties of buckwheat seeds and groats induced by roasting. J. Agric. Food Chem. 2009, 57, 4771–4776. [Google Scholar] [CrossRef]
- Zhang, M.; Chen, H.; Li, J.; Pei, Y.; Liang, Y. Antioxidant properties of tartary buckwheat extracts as affected by different thermal processing methods. LWT 2010, 43, 181–185. [Google Scholar] [CrossRef]
- Kim, H.G.; Kim, G.W.; Oh, H.; Yoo, S.Y.; Kim, Y.O.; Oh, M.S. Influence of roasting on the antioxidant activity of small black soybean (Glycine Max L. Merrill). LWT 2011, 44, 992–998. [Google Scholar] [CrossRef]
- Pradeep, S.R.; Guha, M. Effect of processing methods on the nutraceutical and antioxidant properties of little millet (Panicum sumatrense) extracts. Food Chem. 2011, 126, 1643–1647. [Google Scholar] [CrossRef] [PubMed]
- Zhang, L.; Zhou, J.; Liu, H.; Khan, M.A.; Huang, K.; Gu, Z. Compositions of anthocyanins in blackberry juice and their thermal degradation in relation to antioxidant activity. Eur. Food Res. Technol. 2011, 235, 637–645. [Google Scholar] [CrossRef]
- Bernaert, N.; De Loose, M.; Van Bockstaele, E.; Van Droogenbroeck, B. Antioxidant changes during domestic food processing of the white shaft and green leaves of leek (Allium ampeloprasum var. Porrum): Antioxidant changes during domestic food processing of leek. J. Sci. Food Agric. 2014, 94, 1168–1174. [Google Scholar] [CrossRef] [PubMed]
- Lou, S.N.; Lai, Y.C.; Huang, J.D.; Ho, C.T.; Ferng, L.H.A.; Chang, Y.C. Drying effect on flavonoid composition and antioxidant activity of immature kumquat. Food Chem. 2015, 171, 356–363. [Google Scholar] [CrossRef] [PubMed]
- Cardoso, L.; Pinheiro, S.S.; de Carvalho, C.W.P.; Queiroz, V.A.V.; de Menezes, C.B.; Moreira, A.V.B.; Pinheiro-Sant’Ana, H.M. Phenolic compounds profile in sorghum processed by extrusion cooking and dry heat in a conventional oven. J. Cereal Sci. 2015, 65, 220–226. [Google Scholar] [CrossRef]
- Juániz, I.; Ludwig, I.A.; Huarte, E.; Pereira-Caro, G.; Moreno-Rojas, J.M.; Cid, C.; De Peña, M.P. Influence of heat treatment on antioxidant capacity and (poly)phenolic compounds of selected vegetables. Food Chem. 2016, 197, 466–473. [Google Scholar] [CrossRef]
- López-Rubira, V.; Conesa, A.; Allende, A.; Artés, F. Shelf life and overall quality of minimally processed pomegranate arils modified atmosphere packaged and treated with UV-C. Postharvest Biol. Technol. 2005, 37, 174–185. [Google Scholar] [CrossRef]
- Wang, C.Y.; Chen, C.T.; Wang, S.Y. Changes of flavonoid content and antioxidant capacity in blueberries after illumination with UV-C. Food Chem. 2009, 117, 429–441. [Google Scholar] [CrossRef]
- Aramwit, P.; Bang, N.; Srichana, T. The properties and stability of anthocyanins in mulberry fruits. Food Res. Int. 2010, 43, 1093–1097. [Google Scholar] [CrossRef]
- Oms-Oliu, G.; Aguiló-Aguayo, I.; Martin-Belloso, O.; Soliva-Fortuny, R. Effects of pulsed light treatments on quality and antioxidant properties of fresh-cut mushrooms (Agaricus bisporus). Postharvest Biol. Technol. 2010, 56, 216–222. [Google Scholar] [CrossRef]
- Nguyen, C.T.T.; Kim, J.; Yoo, K.S.; Lim, S.; Lee, E.J. Effect of Prestorage UV-A, -B, and -C Radiation on Fruit Quality and Anthocyanin of ‘Duke’ Blueberries during Cold Storage. J. Agric. Food Chem. 2014, 62, 12144–12151. [Google Scholar] [CrossRef] [PubMed]
- Choi, I.L.; Yoo, T.J.; Kang, H.M. UV-C treatments enhance antioxidant activity, retain quality and microbial safety of fresh-cut paprika in MA storage. Hortic. Environ. Biotechnol. 2015, 56, 324–329. [Google Scholar] [CrossRef]
- Pataro, G.; Sinik, M.; Capitoli, M.M.; Donsi, G.; Ferrari, G. The influence of post-harvest UV-C and pulsed light treatments on quality and antioxidant properties of tomato fruits during storage. Innov. Food Sci. Emerg. Technol. 2015, 30, 103–111. [Google Scholar] [CrossRef]
- Kokalj, D.; Hribar, J.; Cigić, B.; Zlatić, E.; Demšar, L.; Sinkovič, L.; Šircel, H.; Bizjak, G.; Vidrih, R. Influence of Yellow Light-Emitting Diodes at 590 nm on Storage of Apple, Tomato and Bell Pepper Fruit. Food Technol. Biotechnol. 2016, 54, 228–235. [Google Scholar] [CrossRef]
- Ali, A.; Chong, C.H.; Mah, S.H.; Abdullah, L.C.; Choong, T.S.Y.; Chua, B.L. Impact of Storage Conditions on the Stability of Predominant Phenolic Constituents and Antioxidant Activity of Dried Piper betle Extracts. Molecules 2018, 23, 84. [Google Scholar] [CrossRef]
- Azad, O.K.; Kim, W.W.; Park, C.H.; Cho, D.H. Effect of Artificial LED Light and Far Infrared Irradiation on Phenolic Compound, Isoflavones and Antioxidant Capacity in Soybean (Glycine max L.) Sprout. Foods 2018, 7, 174. [Google Scholar] [CrossRef]
- Sirmah, P.; Dumarcay, S.; Masson, E.; Gerardin, P. Unusual amount of (2) mesquitol from the heartwood of Proposis juliflora. Nat. Prod. Res. 2009, 23, 183–189. [Google Scholar] [CrossRef]
- Maatouk, M.; Mustapha, N.; Mokdad-Bzeouich, I.; Chaaban, H.; Ioannou, I.; Ghedira, K.; Ghoul, M.; Chekir-Ghedira, L. Heated naringin mitigate the genotoxicity effect of Mitomycin C in BALB/c mice through enhancing the antioxidant status. Biomed. Pharmacother. 2018, 97, 1417–1423. [Google Scholar] [CrossRef]
- Maatouk, M.; Mustapha, N.; Mokdad-Bzeouich, I.; Chaaban, H.; Abed, B.; Ioannou, I.; Ghedira, K.; Ghoul, M.; Ghedira, L.C. Thermal treatment of luteolin-7-O-β-glucoside improves its immunomodulatory and antioxidant potencies. Cell Stress Chaperones 2017, 22, 775–785. [Google Scholar] [CrossRef]
- Chaaban, H.; Ioannou, I.; Chebil, L.; Slimane, M.; Gerardin, C.; Paris, C.; Charbonnel, C.; Ghoul, M. Effect of heat treatment on thermal stability and antioxidant activity of six flavonoids. J. Food Process. Preserv. 2017. [Google Scholar] [CrossRef]
- Chaaban, H.; Ioannou, I.; Gerardin, C.; Charbonnel, C.; Ghoul, M. Effect of light and oxygen on the degradation of 6 flavonoids and the evolution of their antioxidant activity. J. Photochem. Photobiol. A 2017, 336, 131–139. [Google Scholar] [CrossRef]
- Re, R.; Pellegrini, N.; Proteggente, A.; Yang, M.; Rice-Evans, C. Antioxidant activity applying an improved ABTS radical cation decolorization assay. Free Radic. Biol. Med. 1999, 26, 1231–1237. [Google Scholar] [CrossRef]
- Limem, I.; Harizi, H.; Ghedira, K.; Chekir-Ghedira, L. Leaf extracts from Phlomis crinita Cav. subs. mauritanica Munby affect immune cell functions in vitro. Immunopharmacol. Immunotoxicol. 2011, 33, 309–314. [Google Scholar] [CrossRef] [PubMed]
- Mustapha, N.; Mokdad-Bzéouich, I.; Sassi, A.; Abed, B.; Ghedira, K.; Hennebelle, T.; Chekir-Ghedira, L. Immunomodulatory potencies of isolated compounds from Crataegus azarolus through their antioxidant activities. Tumour Biol. 2016, 37, 7967–7980. [Google Scholar] [CrossRef] [PubMed]
- Kilani-Jaziri, S.; Mustapha, N.; Mokdad-Bzeouich, I.; El Gueder, D.; Ghedira, K.; Ghedira-Chekir, L. Flavones induce immunomodulatory and anti-inflammatory effects by activating cellular anti-oxidant activity: A structure-activity relationship study. Tumour Biol. 2015, 37, 6571–6579. [Google Scholar] [CrossRef]
- Bradford, M.M. A rapid and sensitive method for the quantitation of microgram quantities of protein utilizing the principle of protein-dye binding. Anal. Biochem. 1976, 72, 248–254. [Google Scholar] [CrossRef]
- Manosroi, A.; Saraphanchotiwitthaya, A.; Manosroi, J. Immunomodulatory activities of Clausena excavata Burm. f. wood extracts. J. Ethnopharmacol. 2003, 89, 155–160. [Google Scholar] [CrossRef]
- Mosmann, T. Rapid colorimetric assay for cellular growth and survival: Application to proliferation and cytotoxicity assays. J. Immunol. Methods 1983, 65, 55–63. [Google Scholar] [CrossRef]
- Camera, E.; Mastrofrancesco, A.; Fabbri, C.; Daubrawa, F.; Picardo, M.; Sies, H.; Stahl, W. Astaxanthin, canthaxanthin and beta-carotene differently affect UVA-induced oxidative damage and expression of oxidative stress-responsive enzymes. Exp. Dermatol. 2009, 18, 222–231. [Google Scholar] [CrossRef]
- Arjumand, W.; Sultana, S. Glycyrrhizic acid: A phytochemical with a protective role against cisplatin-induced genotoxicity and nephrotoxicity. Life Sci. 2011, 89, 422–429. [Google Scholar] [CrossRef]
- Flohe, L.; Gunzler, W.A. Assays of glutathione peroxidase. Methods Enzymol. 1984, 105, 114–121. [Google Scholar] [PubMed]
- Clairbone, A. Catalase activity. In Handbook of Methods for Oxygen Radical Research; CRC Press: Boca Raton, FL, USA, 1985. [Google Scholar]
- Beauchamp, C.; Fridovich, I. Superoxide dismutase: Improved assays and an assay applicable to acrylamide gels. Anal. Biochem. 1971, 44, 276–287. [Google Scholar] [CrossRef]
- Houmani, H.; Rodriguez-Ruiz, M.; Palma, J.M.; Abdelly, C.; Corpas, F.J. Modulation of superoxide dismutase (SOD) isozymes by organ development and high long-term salinity in the halophyte Cakile maritima. Protoplasma 2016, 253, 885–894. [Google Scholar] [CrossRef] [PubMed]
- Wolfe, K.L.; Liu, R.H. Cellular antioxidant activity (CAA) assay for assessing antioxidants, foods, and dietary supplements. J. Agric. Food Chem. 2007, 55, 8896–8907. [Google Scholar] [CrossRef]
- Khlifi, R.; Dhaouefi, Z.; Maatouk, M.; Sassi, A.; Boudhiba, N.; Ioannou, I.; Ghedira, K.; Chekir-Ghedira, L.; Kilani-Jaziri, S. Heat treatment improves the immunomodulatory and cellular antioxidant behavior of a natural flavanone: Eriodictyol. Int. Immunopharmacol. 2018, 61, 317–324. [Google Scholar] [CrossRef]


| Food/Model Solution of Flavonoid | Process Parameters | Antioxidant Activity | References |
|---|---|---|---|
| Red grape, pomace peel | Drying (140 °C; 3 h) | Decrease of the AA (50%) for a decrease of PC (32.6%) | [4] |
| Onion bulbs | Boiling (60 min) | Decrease of the AA | [5] |
| Citrus peel | HT (100 °C; 60 min) | 13% increase for AA for an increase of the PC of 43% | [6] |
| Rutin/Luteolin 7-O-glucoside model solutions | HT (100 °C, 360 min) | Loss of 15% of the AA | [7] |
| Quercetin model solution | HT (100 °C) | AA constant | [8] |
| Shiitake mushroom | HT (121 °C, 30 min) | Increase of the AA by 2.0-fold | [9] |
| Sweet potato | Steaming 40 min | Increase of the AA | [10] |
| Oak corn | HT (200 °C; 10 min) | Increase of the AA | [11] |
| Red and green peppers | Frying (180 °C; 5 min) Microwave (500 W; 5 min) | AA constant for a PC content unchanged | [12] |
| Garlic/Onion | HT (100 °C; 10 min) | Decrease of the AA | [13] |
| Strawberry juice | HT (90 °C; 30/60 s) | AA constant | [14] |
| Celery | Immersion treatment (55 °C, 60 s) Storage 24 days at 0 °C | AA constant Decrease until 6 h then an increase until 15 h | [15] |
| Yellow and Black soybeans | HT (100 °C, 60 min) | Decrease of the AA | [16] |
| Bilberry | Drying (80 °C; 30 min/125 °C; 10 min) | Increase of the AA | [17] |
| Beans | Cooking (100/121 °C) | Increase of the AA and the PC | [18] |
| Buckwheat seeds and groats | Roasting (160 °C; 30 min) | Decrease of the AA | [19] |
| Flour of tartary buckwheat | Roasting (120 °C; 40 min) Microwave (700 W; 10 min) | Decrease of the AA | [20] |
| Small black soybean | HT (250 °C; 30 min) | Increase of the AA | [21] |
| Little millet | HT (165 °C; 75 s) | Increase of the AA | [22] |
| Blackberry juice | HT (90 °C; 5 h) | Decrease of the AA | [23] |
| Green leaves of leeks | Steaming (30 min) | Increase of the AA 20% for a decrease of PC 20% | [24] |
| Kumquat | 130 °C, 30 min | Increase of the AA | [25] |
| Sorgo | Baking (121 °C; 25 min) | Increase of the AA 16% for a decrease of PC 10% | [26] |
| Cardon | Frying in sunflower oil (115 °C; 10 min) | Increase of the AA 20% for an increase of PC 20% | [27] |
| Food/Model Solution of Flavonoid | Process Parameters | Antioxidant Activity | References |
|---|---|---|---|
| Pomegranate | 5 days, 5 °C,UV-C | Constant | [28] |
| Blueberry | 4 days, 24 °C, light | Increase | [29] |
| Mulberry | 10 h, fluorescent light | Increase | [30] |
| Mushroom | 15 days, 4 °C, pulsed light | Decrease (28 J/cm2) and constant (4.8 J/cm2) | [31] |
| Blueberry | 28 days, 0 °C, UV light 6 kJ/m2 | Increase | [32] |
| Paprika | 7 days, 8 °C, UV-C 15 kJ | Constant | [33] |
| Tomato | 21 days, 20 °C, UV-C | Increase | [34] |
| Apple, tomato, bell pepper | 7 days, 7 °C, LED (590 nm) | Increase | [35] |
| Piper betle | 6 months, 5/25 °C, light | Decrease | [36] |
| Soybean sprouts | LED and FIR light | Increase | [37] |
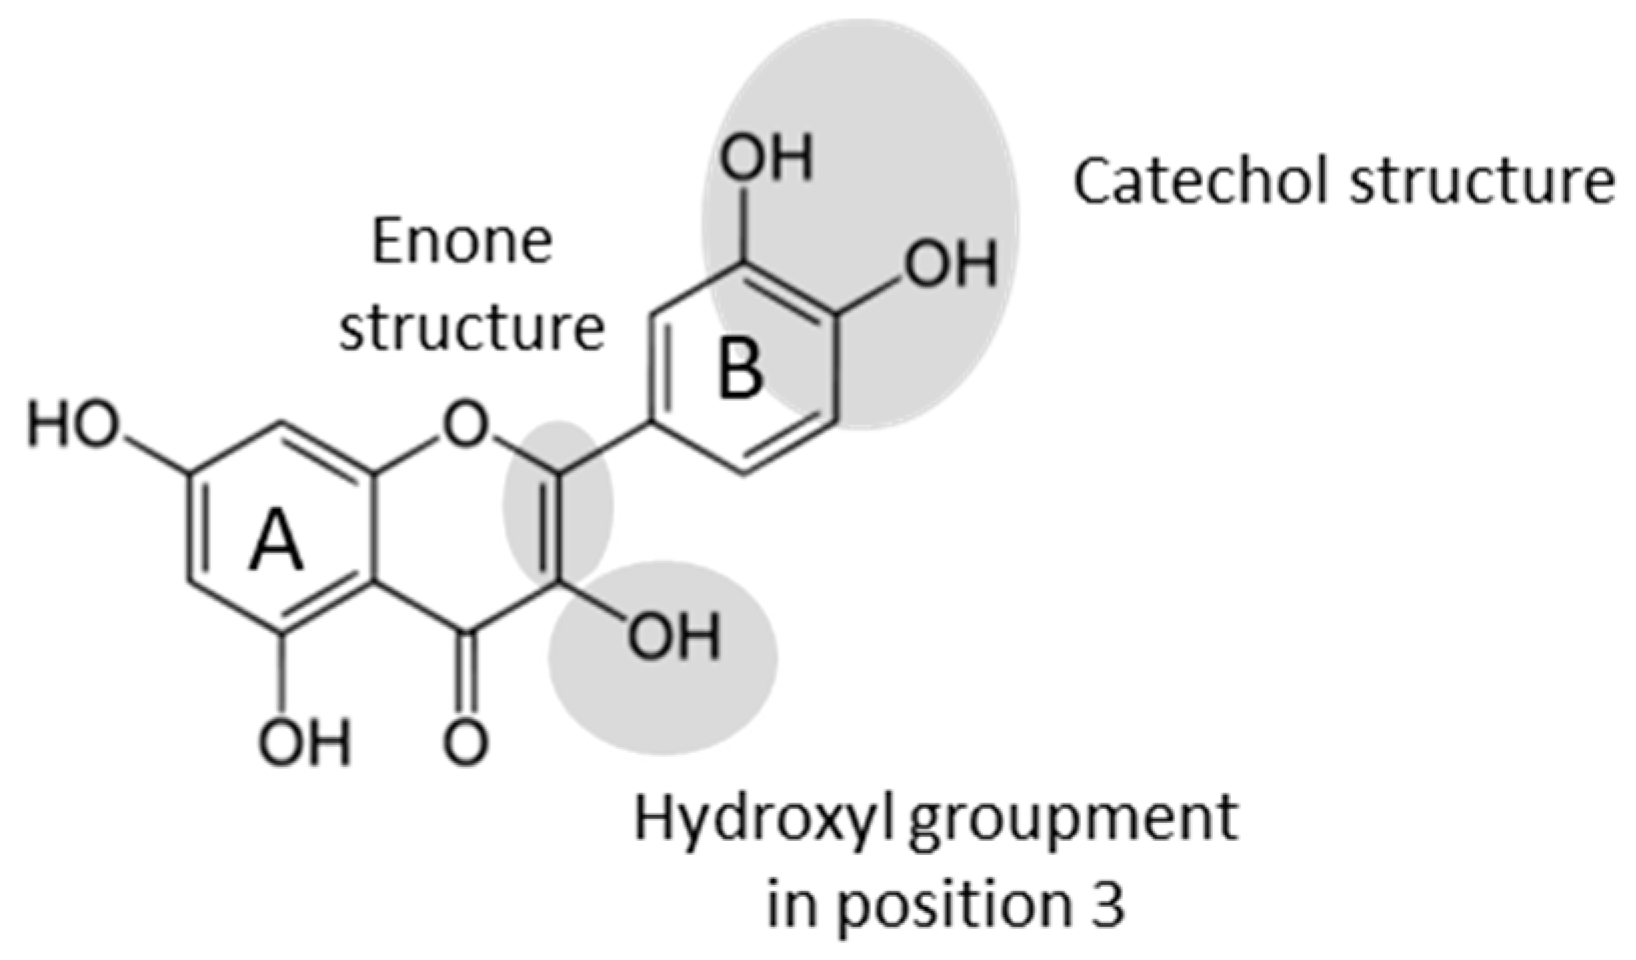
| Flavonoid | Acronym | Class | Glycosylation | Enone Structure | OH Groups | Phenol Position |
|---|---|---|---|---|---|---|
| Rutin | Flavonol | Glucose-Rhamnose in position 3 | Yes | 4 | 4′-5′-5-7 | |
| Narangin | NG | Flavanone | Glucose-Rhamnose in position 7 | No | 2 | 4′-5 |
| Eriodictyol | Erio | Flavanone | No | No | 4 | 3′-4′-5-7 |
| Mesquitol | Flavanol | No | No | 5 | 3′-4′-3-7-8 | |
| Luteolin | Flavone | No | Yes | 4 | 3′-4′-5-7 | |
| Luteolin 7-O-glucoside | L7G | Flavone | Glucose in position 7 | Yes | 3 | 3′-4′-5 |
© 2020 by the authors. Licensee MDPI, Basel, Switzerland. This article is an open access article distributed under the terms and conditions of the Creative Commons Attribution (CC BY) license (http://creativecommons.org/licenses/by/4.0/).
Share and Cite
Ioannou, I.; Chekir, L.; Ghoul, M. Effect of Heat Treatment and Light Exposure on the Antioxidant Activity of Flavonoids. Processes 2020, 8, 1078. https://doi.org/10.3390/pr8091078
Ioannou I, Chekir L, Ghoul M. Effect of Heat Treatment and Light Exposure on the Antioxidant Activity of Flavonoids. Processes. 2020; 8(9):1078. https://doi.org/10.3390/pr8091078
Chicago/Turabian StyleIoannou, Irina, Leila Chekir, and Mohamed Ghoul. 2020. "Effect of Heat Treatment and Light Exposure on the Antioxidant Activity of Flavonoids" Processes 8, no. 9: 1078. https://doi.org/10.3390/pr8091078
APA StyleIoannou, I., Chekir, L., & Ghoul, M. (2020). Effect of Heat Treatment and Light Exposure on the Antioxidant Activity of Flavonoids. Processes, 8(9), 1078. https://doi.org/10.3390/pr8091078