Article

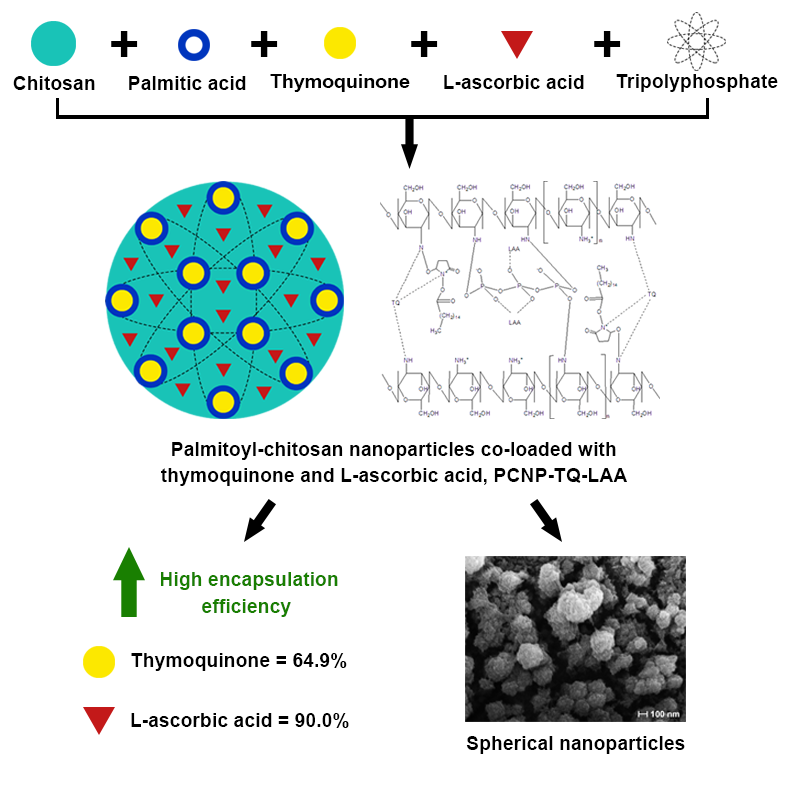
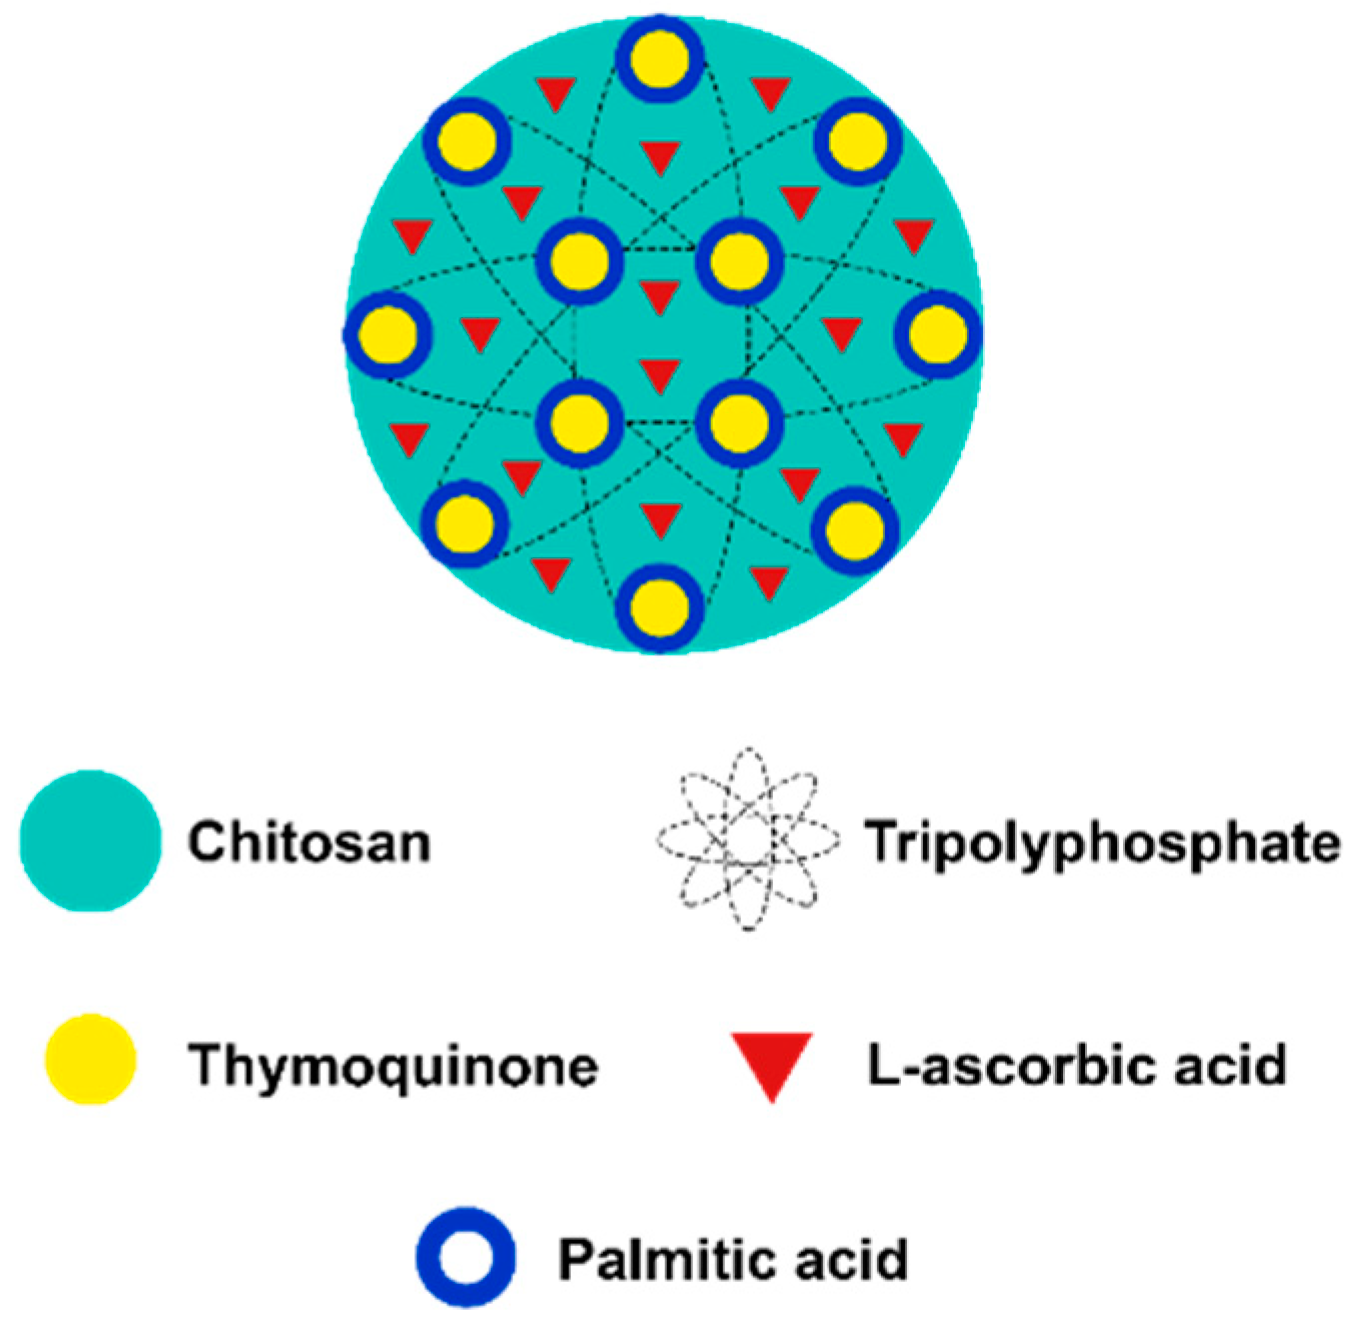
l-Ascorbic Acid and Thymoquinone Dual-Loaded Palmitoyl-Chitosan Nanoparticles: Improved Preparation Method, Encapsulation and Release Efficiency

by
Nurhanisah Othman
1,
Siti Nurul Ain Md. Jamil
1,2,*,
Mas Jaffri Masarudin
3,4,
Luqman Chuah Abdullah
5,
Rusli Daik
6 and
Nor Syazwani Sarman
1
1
Department of Chemistry, Faculty of Science, Universiti Putra Malaysia, Serdang 43400, Selangor, Malaysia
2
Center of Foundation Studies for Agricultural Science, Universiti Putra Malaysia, Serdang 43400, Selangor, Malaysia
3
Department of Cell and Molecular Biology, Faculty of Biotechnology and Biomolecular Sciences, Universiti Putra Malaysia, Serdang 43400, Selangor, Malaysia
4
Cancer Research Laboratory, Institute of Biosciences, Universiti Putra Malaysia, Serdang 43400, Selangor, Malaysia
5
Department of Chemical and Environmental Engineering, Faculty of Engineering, Universiti Putra Malaysia, Serdang 43400, Selangor, Malaysia
6
Department of Chemical Sciences, Faculty of Science and Technology, Universiti Kebangsaan Malaysia, Bangi 43600, Selangor, Malaysia
*
Author to whom correspondence should be addressed.
Processes 2020, 8(9), 1040; https://doi.org/10.3390/pr8091040
Submission received: 18 June 2020 / Revised: 3 August 2020 / Accepted: 3 August 2020 / Published: 26 August 2020
(This article belongs to the Special Issue Biotechnology for Sustainability and Social Well Being)

Abstract

:
Encapsulation of dual compounds of different characters (hydrophilic and hydrophobic) in single nanoparticles carrier could reach the site of action more accurately with the synergistic effect but it is less investigated. In our previous findings, combined-compounds encapsulation and delivery from chitosan nanoparticles were impaired by the hydrophilicity of chitosan. Therefore, hydrophobic modification on chitosan with palmitic acid was conducted in this study to provide an amphiphilic environment for better encapsulation of antioxidants; hydrophobic thymoquinone (TQ) and hydrophilic l-ascorbic acid (LAA). Palmitoyl chitosan nanoparticles (PCNPs) co-loaded with TQ and LAA (PCNP-TQ-LAA) were synthesized via the ionic gelation method. Few characterizations were conducted involving nanosizer, Fourier-transform infrared spectroscopy (FTIR), field-emission scanning electron microscopy (FESEM) and high-resolution transmission electron microscopy (HRTEM). UV–VIS spectrophotometry was used to analyze the encapsulation and release efficiency of the compounds in PCNPs. Successfully modified PCNP-TQ-LAA had an average particle size of 247.7 ± 24.0 nm, polydispersity index (PDI) of 0.348 ± 0.043 and zeta potential of 19.60 ± 1.27 mV. Encapsulation efficiency of TQ and LAA in PCNP-TQ-LAA increased to 64.9 ± 5.3% and 90.0 ± 0%, respectively. TQ and LAA in PCNP-TQ-LAA system showed zero-order release kinetics, with a release percentage of 97.5% and 36.1%, respectively. Improved preparation method, encapsulation and release efficiency in this study are anticipated to be beneficial for polymeric nanocarrier development.

Graphical Abstract

1. Introduction

Tremendous illnesse treatments like those of cancers [1,2,3] and tuberculosis (TB) [4,5,6] require a combination of drugs to achieve positive progress, whether to cure, control or palliate the pain. Although the standard therapies have been successful to some extent, multi-drug transportation could be eased by formulating them together rather than taking them individually, without reducing their effectiveness. Researchers have started to look at multi-drug delivery from single system formulation for various treatments [7,8,9,10,11,12,13,14,15]. Aside from knowing drug compatibility, a system definitely needs an outstanding carrier to content and deliver them excellently.
Nanoparticles (NPs) come to fulfil this request by acting as a promising carrier due to its large surface area that causes it to be more reactive [11,16,17]. Having a size of 10–1000 nm [18,19,20,21], NPs are classified as potent drug carrier as it can move more freely in the body. NPs uptake by cells was reported to be 15–250 times higher than 1–10 µm particles [22]. Furthermore, NPs have been broadly used in the biomedical sector to treat diseases like diabetes [23,24,25] and cancers [26,27,28,29]. As NPs carrier is now drawing promising outcomes for multi-drug therapy, the present study aims at developing smart chitosan-based nanoparticles (CNPs) for combined antioxidants, hydrophobic thymoquinone (TQ) and hydrophilic l-ascorbic acid (LAA).
The use of chitosan (CS) as a polymer for NPs production has been widely discovered [13,30,31,32]. Abundant sources of CS from chitin of crustacean shells, fungi and insects makes it accessible and cheap [33,34,35]. It is one of the most auspicious polymers for drug delivery, which is biodegradable and biocompatible [33,36,37]. CS can be degraded in vertebrates by enzymatic reactions, depending on the degree of deacetylation (DD) and molecular weight (MW); low DD and MW could assist in faster CS degradation [34,38]. Moreover, the cationic property of CNPs enriched its efficacy in internalizing negatively charged cell plasma membranes [18,39]. CNPs can be synthesized by several routes, but the ionic gelation method has been more meticulously discovered, involving crosslinking reactions of CS amine groups with various anionic crosslinkers [36,40]. However, ionic gelation implementation in producing CNPs was typically done by using sodium tripolyphosphate (TPP) crosslinker [30,36,41,42].
In addition, the presence of amino and hydroxyl groups in CS makes it highly modifiable for moieties addition [43]. Palmitic acid is one of the potential modifiers for hydrophobic sites addition. Studies by Sharma et al. stated that the transfection efficiency of CS for gene delivery was successfully enhanced once modified with palmitic acid [44]. In another study, palmitic acid was used in modifying CS for an improved controlled release of tamoxifen, a breast cancer drug [45]. Kuen et al. reported on the modification of CS with palmitic acid for more effective encapsulation of hydrophobic Silibinin into NPs. The encapsulation efficiency (EE) of Sibilibin in modified palmiltoyl-chitosan nanoparticles (PCNP) was increased twice as much, compared to the EE of Silibinin in unmodified chitosan nanoparticles (CNP), because the palmitoyl anchor provides a hydrophobic core for Silibinin to stay in [41]. The concept of having both hydrophilic and hydrophobic sites in one NP system could be implemented to contain a wider range of compatible drugs or compounds to elevate synergistic effects. Therefore, this study aims at developing modified-chitosan nanoparticles by using palmitic acid N-hydroxysuccinimide (NHS) ester for hydrophobic thymoquinone (TQ) and hydrophilic l-ascorbic acid (LAA) antioxidants, as illustrated in Figure 1 below.
TQ is an active hydrophobic component of Nigella sativa, known as black seed, that shows several pharmacological properties and potential therapeutic effects such as anti-inflammatory and antioxidant properties [46,47]. LAA, known as vitamin C, is a universal antioxidant that possesses various benefits in preventing and reducing the common cold [48]. Its potential for alleviating acute viral infections treatments [49,50] was also reported. The combination of LAA and TQ was proven to have an anticonvulsant property by showing synergistic effects in lessening pentylenetetrazole-induced seizures [51]. As TQ and LAA are both antioxidants, this powerful combination can scavenge reactive oxygen species (ROS). ROS are unstable radicals containing oxygen that can easily react with molecules in a cell. Its inhibition is important to maintain good health because an excessive amount of ROS in the body could lead to oxidative stress. Prolonged oxidative stress state could then prime the emergence of complications such as neurological disorders, hypertension and acute respiratory distress syndrome [52]. Hence, by taking sufficient antioxidants in a more effective formulation, along with practicing healthy life style, numerous illnesses could be prevented and a more productive life awaits.
The present work demonstrates the synthesis and optimization of stable and homogenously dispersed palmitoyl-chitosan nanoparticles co-loaded with thymoquinone and l-ascorbic acid (PCNP-TQ-LAA). This study explores how the dual loaded compounds, hydrophobic TQ and hydrophilic LAA in a modified chitosan nanoparticles system is possible. Development and study of such systems are important, as a lot of treatment regimens involve a concoction of drugs/compounds of different physico–kinetic properties and dual administration of their combination are often plagued with many problems. This study attempts to be a proof-of-concept to pave way for finding a solution to this. As suggested in Figure 2, ammonium cations (from the chitosan chains) form ionic interaction with the phosphate anions (from the TPP crosslinker). Such interaction is possible because the positively charge chitosan can form an electrostatic attraction with negatively charge TPP. A similar interaction was suggested in previous research work [53]. Analysis on particle size, dispersion and zeta potential by the nanosizer, investigation on the presence of functional groups by Fourier-transform infrared spectroscopy (FTIR), surface morphologies by field-emission scanning electron microscopy (FESEM) and high-resolution transmission electron microscopy (HRTEM) together with encapsulation and release efficiency studies by UV-Vis spectrophotometry were conducted to characterize the NPs.

2. Materials and Methods

2.1. Materials

CS with MW = 50,000–190,000 Da, ≥75% (deacetylated) was used as a carrier, and TPP with MW = 367.86 Da was used as the crosslinking agent. Both were purchased from Sigma-Aldrich (St. Louis, MO, USA). Glacial acetic acid, sodium hydroxide pallets, 5% w/v hydrochloric acid, l-ascorbic acid, dimethylsulfoxide (DMSO), sodium bicarbonate, sodium dodecyl sulfate and methanol were purchased from R&M Chemicals (Semenyih, Selangor, Malaysia). Thymoquinone, palmitic acid N-hydroxysuccinimide ester and picrylsulfonic acid solution were purchased from Sigma Aldrich (St. Louis, MO, USA). Absolute ethanol was purchased from Systerm. Phosphate Buffered Saline (PBS) pellet was purchased from MP Biomedicals (Solon, OH, USA). All chemicals are of analytical grade and were used without any further purification.

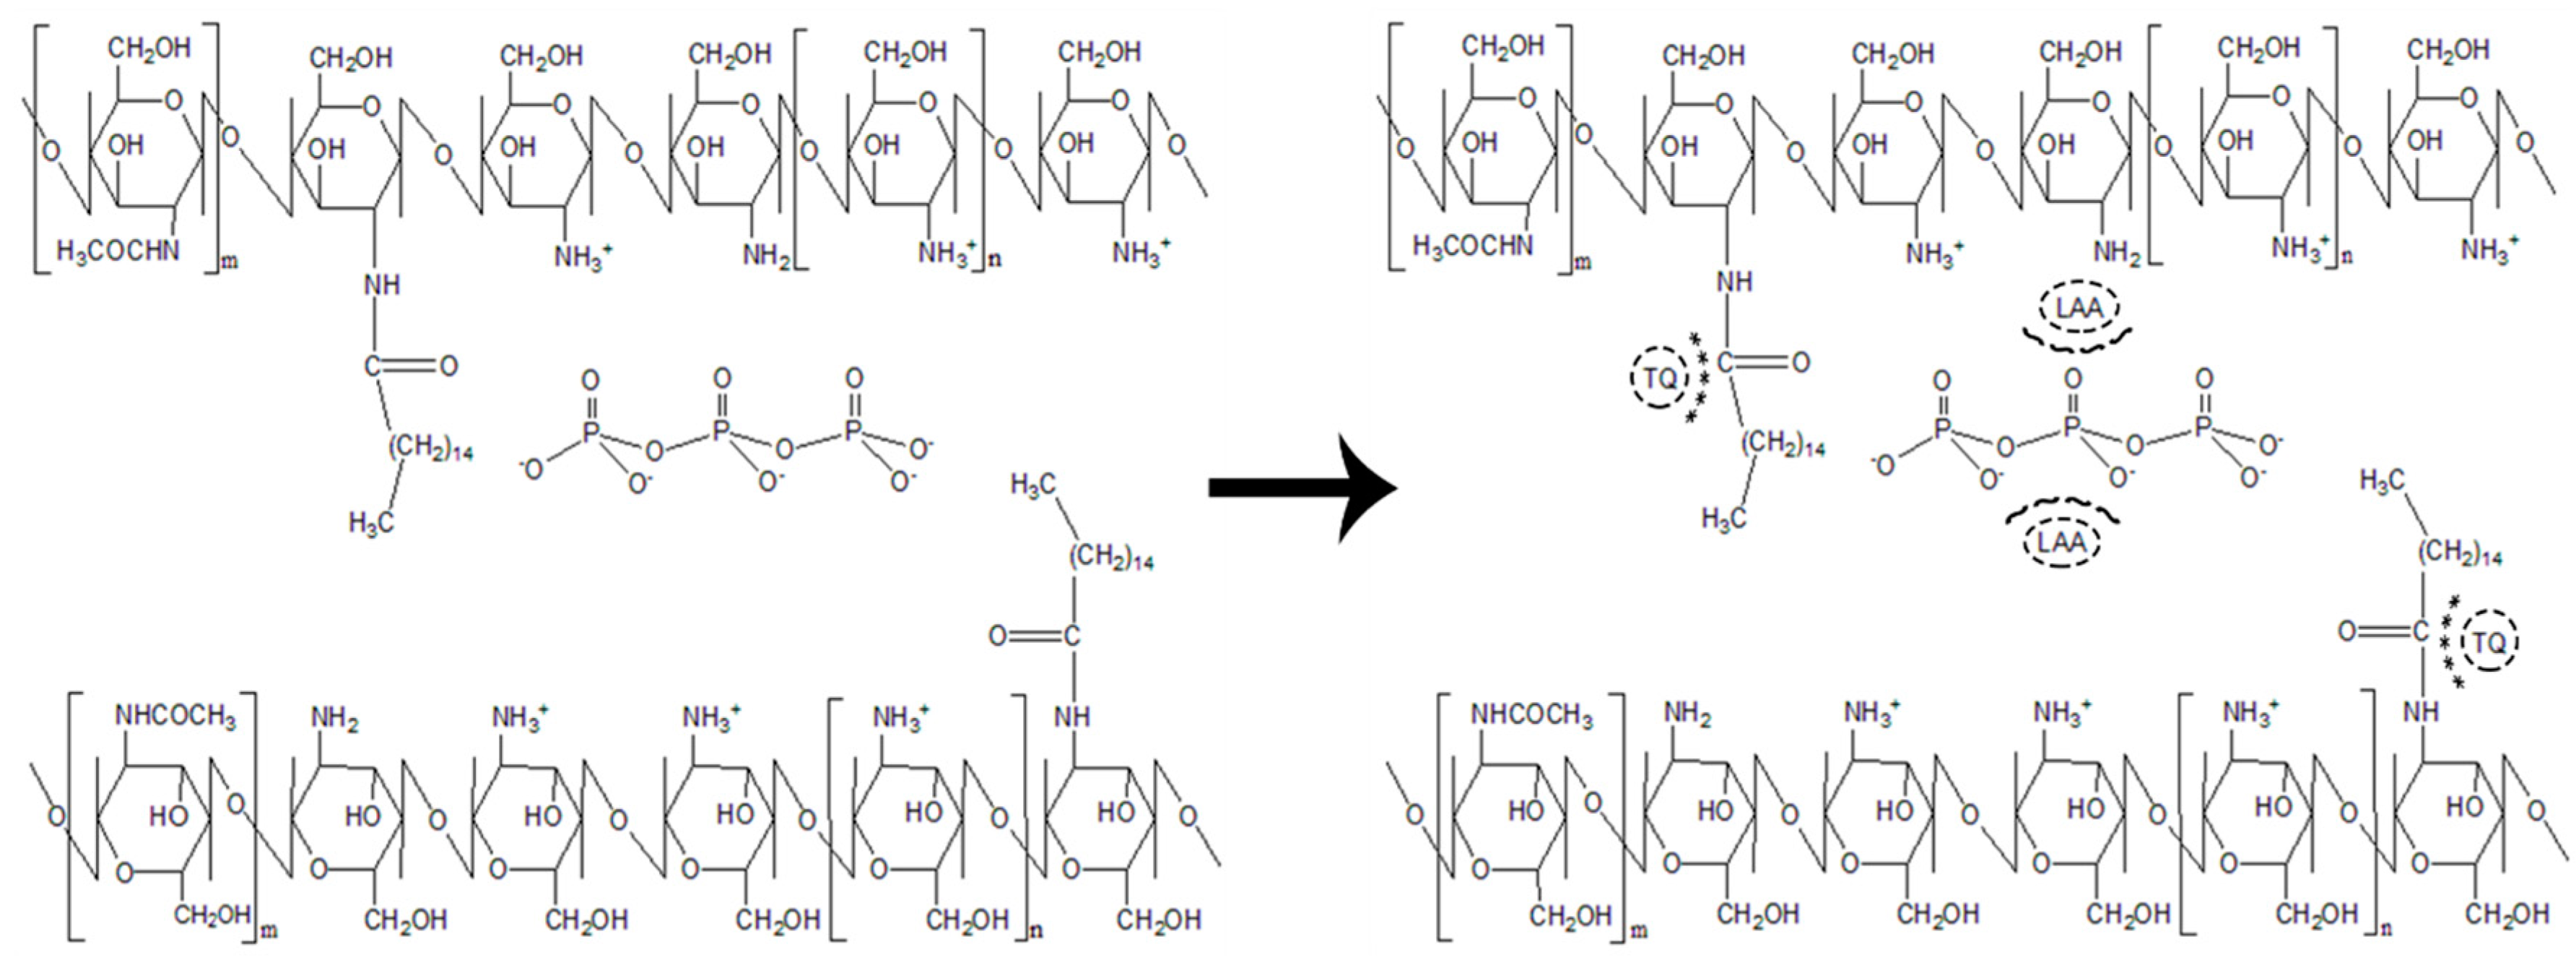
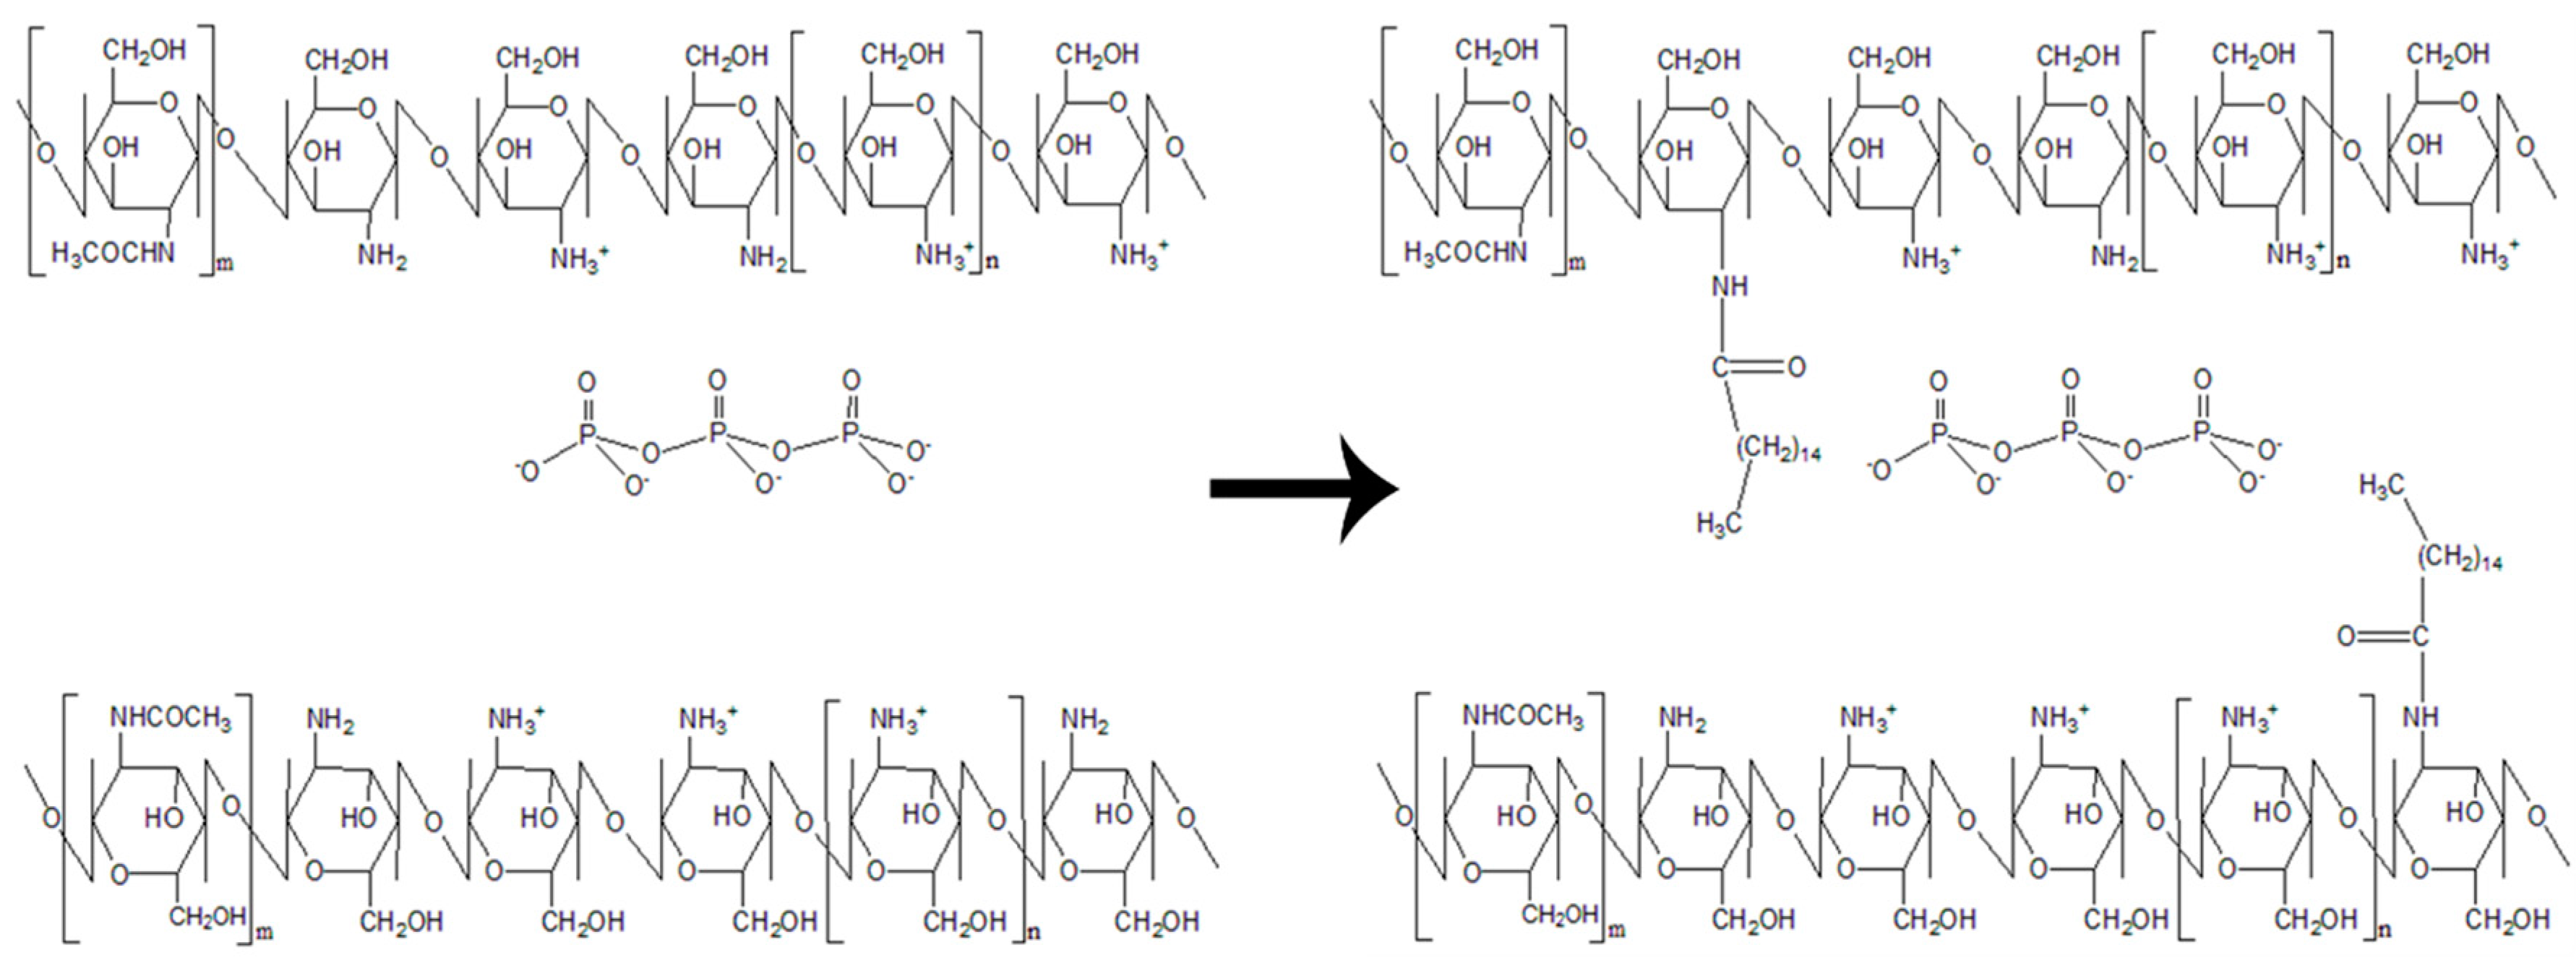
2.2. Synthesis of Palmitic Acid-Modified Chitosan, PCS

For the purpose of modifying chitosan to be more hydrophobic, palmitic acid NHS ester was added in the synthesis process. Chitosan (CS) powder was dissolved in 1.0% acetic acid and distilled water to form a concentration of 1.0 mg/mL CS master solution (CS MS). Separately, palmitic acid NHS ester was dissolved in absolute ethanol to a concentration of 0.36 mg/mL. Then, the CS solution was adjusted to pH 6. Palmitic acid NHS ester solution was added into the CS solution dropwise, with a volume ratio of 1:2 and the mixture was left for 20 h at 50 °C to react. After the incubation completed, the solution was adjusted to pH 9 by using 1 M sodium hydroxide. Then, it was centrifuged at 2200× g for 45 min to form a precipitate. Following precipitation, it was washed once with 50:50 acetone: absolute ethanol and twice with distilled water. The supernatant was removed from each centrifugation cycle. The precipitate was dried in an oven for 72 h at 50 °C. This process produced pellet, which is called palmitoyl-chitosan (PCS). The PCS pellet will be used to synthesize PCNP, PCNP-LAA, PCNP-TQ and PCNP-LAA-TQ.

2.3. Synthesis of Palmitic Acid-Modified Chitosan Nanoparticles, PCNP

Firstly, the PCS pellet was dissolved with 1.0% acetic acid and distilled water to a concentration of 1.0 mg/mL. It was diluted to two-fold to get 0.5 mg/mL PCS working solution. Then, the solution was adjusted to pH 5 by adding 1 M aqueous sodium hydroxide solution. The crosslinker, TPP was dissolved in distilled water to make a concentration of 0.7 mg/mL and altered to pH 2.0 by using 1.0 M hydrochloric acid. PCNP was formed by adding 600 µL of PCS to 250 µL of TPP. Then, the mixture was centrifuged at 13,000 rpm for 20 min to get purified PCNP (only for unencapsulated PCNP). Previously, it was found that 250 µL of TPP was an optimum volume to synthesize CNP and therefore, the same volume was used in this study to synthesize modified PCNP. That optimum TPP volume was mainly determined based on the smallest empty carrier produced [42]. This is because the expansion after encapsulation will be most minimal, which will enhance in vivo biological delivery.

2.4. Encapsulation of l-Ascorbic Acid and Thymoquinone into PCNP

For a single encapsulation process, LAA was prepared by first pouring approximately 10.0 mg of LAA into 10.0 mL of 0.7 mg/mL TPP solution, making an LAA stock concentration of 5.7 mM. Then, 250 µL of diluted LAA was added into 600 µL of 0.5 mg/mL PCS solution, to produce PCNP-LAA. Final LAA concentration that was used is 160 µM. Another single-loaded PCNP, PCNP-TQ, was prepared by dissolving approximately 2.0 mg of TQ in 2.0 mL of 99.0% DMSO, making a stock concentration of 6.1 mM. Only 100 µL of diluted TQ was added into 600 µL of 0.5 mg/mL of PCS. Lastly, 250 µL of 0.7 mg/mL of TPP was dropped into the PCS-TQ mixture to produce PCNP-TQ. Final TQ concentration that was used is 150 µM.
The encapsulation of both compounds, LAA and TQ, used to make PCNP-LAA-TQ is shown in Figure 1. Basically, the LAA and TQ solutions were prepared as mentioned previously. PCNP-TQ-LAA was prepared by mixing 100 µL of diluted TQ solution with 600 µL of 0.5 mg/mL of PCS for a while. Then, 250 µL of LAA-diluted solution was added into the mixture of TQ and PCS.

2.5. Quantification of Primary Amine Content in CNP and PCNP

Primary amine content determination was done by using a chemical called picrylsulfonic acid (TNBS reagent) according to modified methods [30,54]. The process started with preparation of the TNBS reagent, NaHCO3, SDS and HCl at concentration of 0.05% (v/v), 0.1 M, 10.0% (w/v) and 1.0 M, respectively. First, standard solutions of CS were prepared by performing two-fold dilution of 0.5 mg/mL CS solution in 0.1 M NaHCO3; each sample contained 50 µL of CS solution and 50 µL of NaHCO3, serially diluted. This was followed by the addition of 50 µL of 0.05% (v/v) TNBS. Similar steps were applied to prepare standard solutions for PCS. Second, for sample solutions, 100 µL of CNP of different TPP volume (0 to 300 µL) were added into 100 µL of 0.05% (v/v) TNBS. All standards and sample solutions were incubated at 37 °C water bath for 3 h. Next, 100 µL of all standard and sample solutions were transferred into 96 well plates. This was followed by addition of 100 µL of 10.0% (w/v) sodium dodecyl sulfate and 75 µL of 1.0 M HCl into each occupied well and they were mixed well. Samples were then read with on a µQuant microplate reader (Bio-Tek Instruments, Winooski, VT, USA) at 335 nm. Absorbance values were analyzed by using Equation (2) to find the primary amine percentage available:
  Percentage   of   available   amines = Abs .   of   CNP Abs .   of   PCNP Abs .   of   CS Abs .   of   PCS × 100

2.6. Physicochemical Characterizations of PCNP Samples

2.6.1. Detection of Functional Groups in PCNP Samples

Emergence and disappearance of functional groups in nanoparticle samples were detected by FTIR. Prior to analyzing samples by FTIR, they were freeze-dried using a Coolsafe 95-15 PRO freeze drier (ScanVac, Lynge, Denmark) for 48 h to pull out liquid content. FTIR was performed using a Perkin Elmer Spectrum 100 FTIR Spectrometer (Shelton, CT, USA) with a universal attenuated total reflectance (ATR) technique to identify the functional groups in the PCNPs. Samples were measured in the range of 280–4000 cm−1 at 25 °C.

2.6.2. Particle Size Distribution, PSD Study

PSD study was performed by using dynamic light scattering (DLS) technique to analyze particle size, dispersity in the sample and zeta potential. Prepared NPs were diluted with distilled water to produce 40% v/v solution. Then, the sample was analyzed by using Zetasizer 3000HSA (Malvern Instruments, Worcestershire, UK). pH of the system was around 6–6.5, near to pKa of chitosan. Three different synthesis batches (N = 3) were used in this study to obtain the average particle size, polydispersity index (PDI) and zeta potential.

2.6.3. Surface Morphology of PCNP Samples by Field-Emission Scanning Electron Microscopy (FESEM)

The surface morphologies of PCNP, PCNP-TQ, PCNP-LAA and PCNP-TQ-LAA were observed using FESEM analysis. Samples were prepared as for DLS study, which were then sonicated for five minutes. Small volumes of samples were dropped on cleaned stubs and left to dry for three days in a 50 °C oven. The dried samples were coated with platinum by using JEOL JEC-3000FC auto fine coater (Tokyo, Japan). Finally, the samples were analyzed under an electron microscope, JEOL JSM 7600F (Tokyo, Japan). The NP diameters and particle size distributions were calculated using Image J software by National Institutes of Health (version 1.52a) from the FESEM image analysis of 50 individual particles [55].

2.6.4. Surface Morphology of PCNP Samples by High-Resolution Transmission Electron Microscopy (HRTEM)

HRTEM was used to determine morphology and clarify functions of detected structures; also, to measure particle size and check its uniformity. Firstly, samples were prepared as for DLS study, followed by sonication for fifteen minutes. Then, a tiny droplet of each sample was applied onto a formvar/carbon film, 400 mesh copper TEM grids. After that, the samples were letft to dry for 7 h under a lamp, followed by the analysis process by JEOL JEM 2100F Field Emission TEM (Tokyo, Japan).

2.6.5. Encapsulation Efficiency Study of Thymoquinone and l-Ascorbic Acid into PCNP

The encapsulation efficiency (EE) was calculated by comparing the difference in absorbance of a total compound and free compound. Total compound refers to compound solution only, while free compound refers to the compound that is unencapsulated in PCNP-TQ, PCNP-LAA or PCNP-TQ-LAA. Both solutions contained the same concentration of the compound. The % EE indicates the percentage of compound successfully encapsulated in the carrier; it was calculated using the following formula [56]:
Encapsulation   efficiency ,   % = Abs .   of   total   compound     Abs .   of   free   compound Abs .   of   total   compound × 100
The absorbance was measured using Lambda 35 UV–Vis spectrophotometer (PerkinElmer, Waltham, MA, USA) at wavelengths of 257 nm and 267 nm for LAA and TQ, respectively. The wavelengths were determined based on the highest peak detected. Triplicate test (N = 3) analysis of single and dual compounds loaded in PCNP were tested.

2.6.6. Preliminary Study of Thymoquinone and l-Ascorbic Acid In Vitro Release from PCNP

The in vitro release study of thymoquinone (TQ) and l-ascorbic acid (LAA) loaded PCNP formulations were conducted first by freeze-drying all samples using a Coolsafe 95-15 PRO freeze drier (ScanVac, Lynge, Denmark) for 48 h. Then, the pellet was loaded into a quartz cuvette containing phosphate-buffered saline (PBS) pH 7.4. The cuvette was later inserted into a UV–Vis spectrophotometer (PerkinElmer, Waltham, MA, USA) and set to wavelengths of 257 nm and 267 nm for LAA and TQ, respectively. The sample was left in the UV–Vis spectrophotometer for 48 h, with auto data recording set for every 1 min (time drive option).
A calibration curve for each compound is needed in order to convert the absorbance reading to the concentration of the compound released. After considering the dilution factor, the percentage of compound released (%) could then be measured using the following formula:
Compound   released ,   % = Released   compound   concentration Encapsulated   compound   concentration × 100
Obtained release profiles were analyzed with zero order, first order, Higuchi, Hixson–Crowell and Korsmeyer–Peppas models.
Zero-order kinetic model is as follows [57]:
m t = m b + k 0 t ,
where m t is the amount of compound released at time t , m b is the amount of compound in solution before release (usually 0) and k 0 is the zero-order rate constant.
First-order kinetic model is as follows [57]:
ln ( m 0 m t ) = ln ( m 0 ) k 1 t ,
where m 0 is the amount of compound in the formulation before the dissolution and k 1 is the first-order release rate constant.
Higuchi model is as follows [58]:
m t = k H t ,
where k H is Higuchi rate constant.
Hixson–Crowell model is as follows [59]:
m 0 3 m l e f t 3 = k H C t ,
where m l e f t is the amount of compound left in the formulation over time t and k H C is Hixson–Crowell rate constant.
Korsmeyer–Peppas model is as follows [60]:
log ( m t m ) = log k K P + n log t
where m is the amount of compound released after an infinitive time, k K P is Korsmeyer–Peppas rate constant and n is the parameter indicative of the release mechanism.

3. Results and Discussion

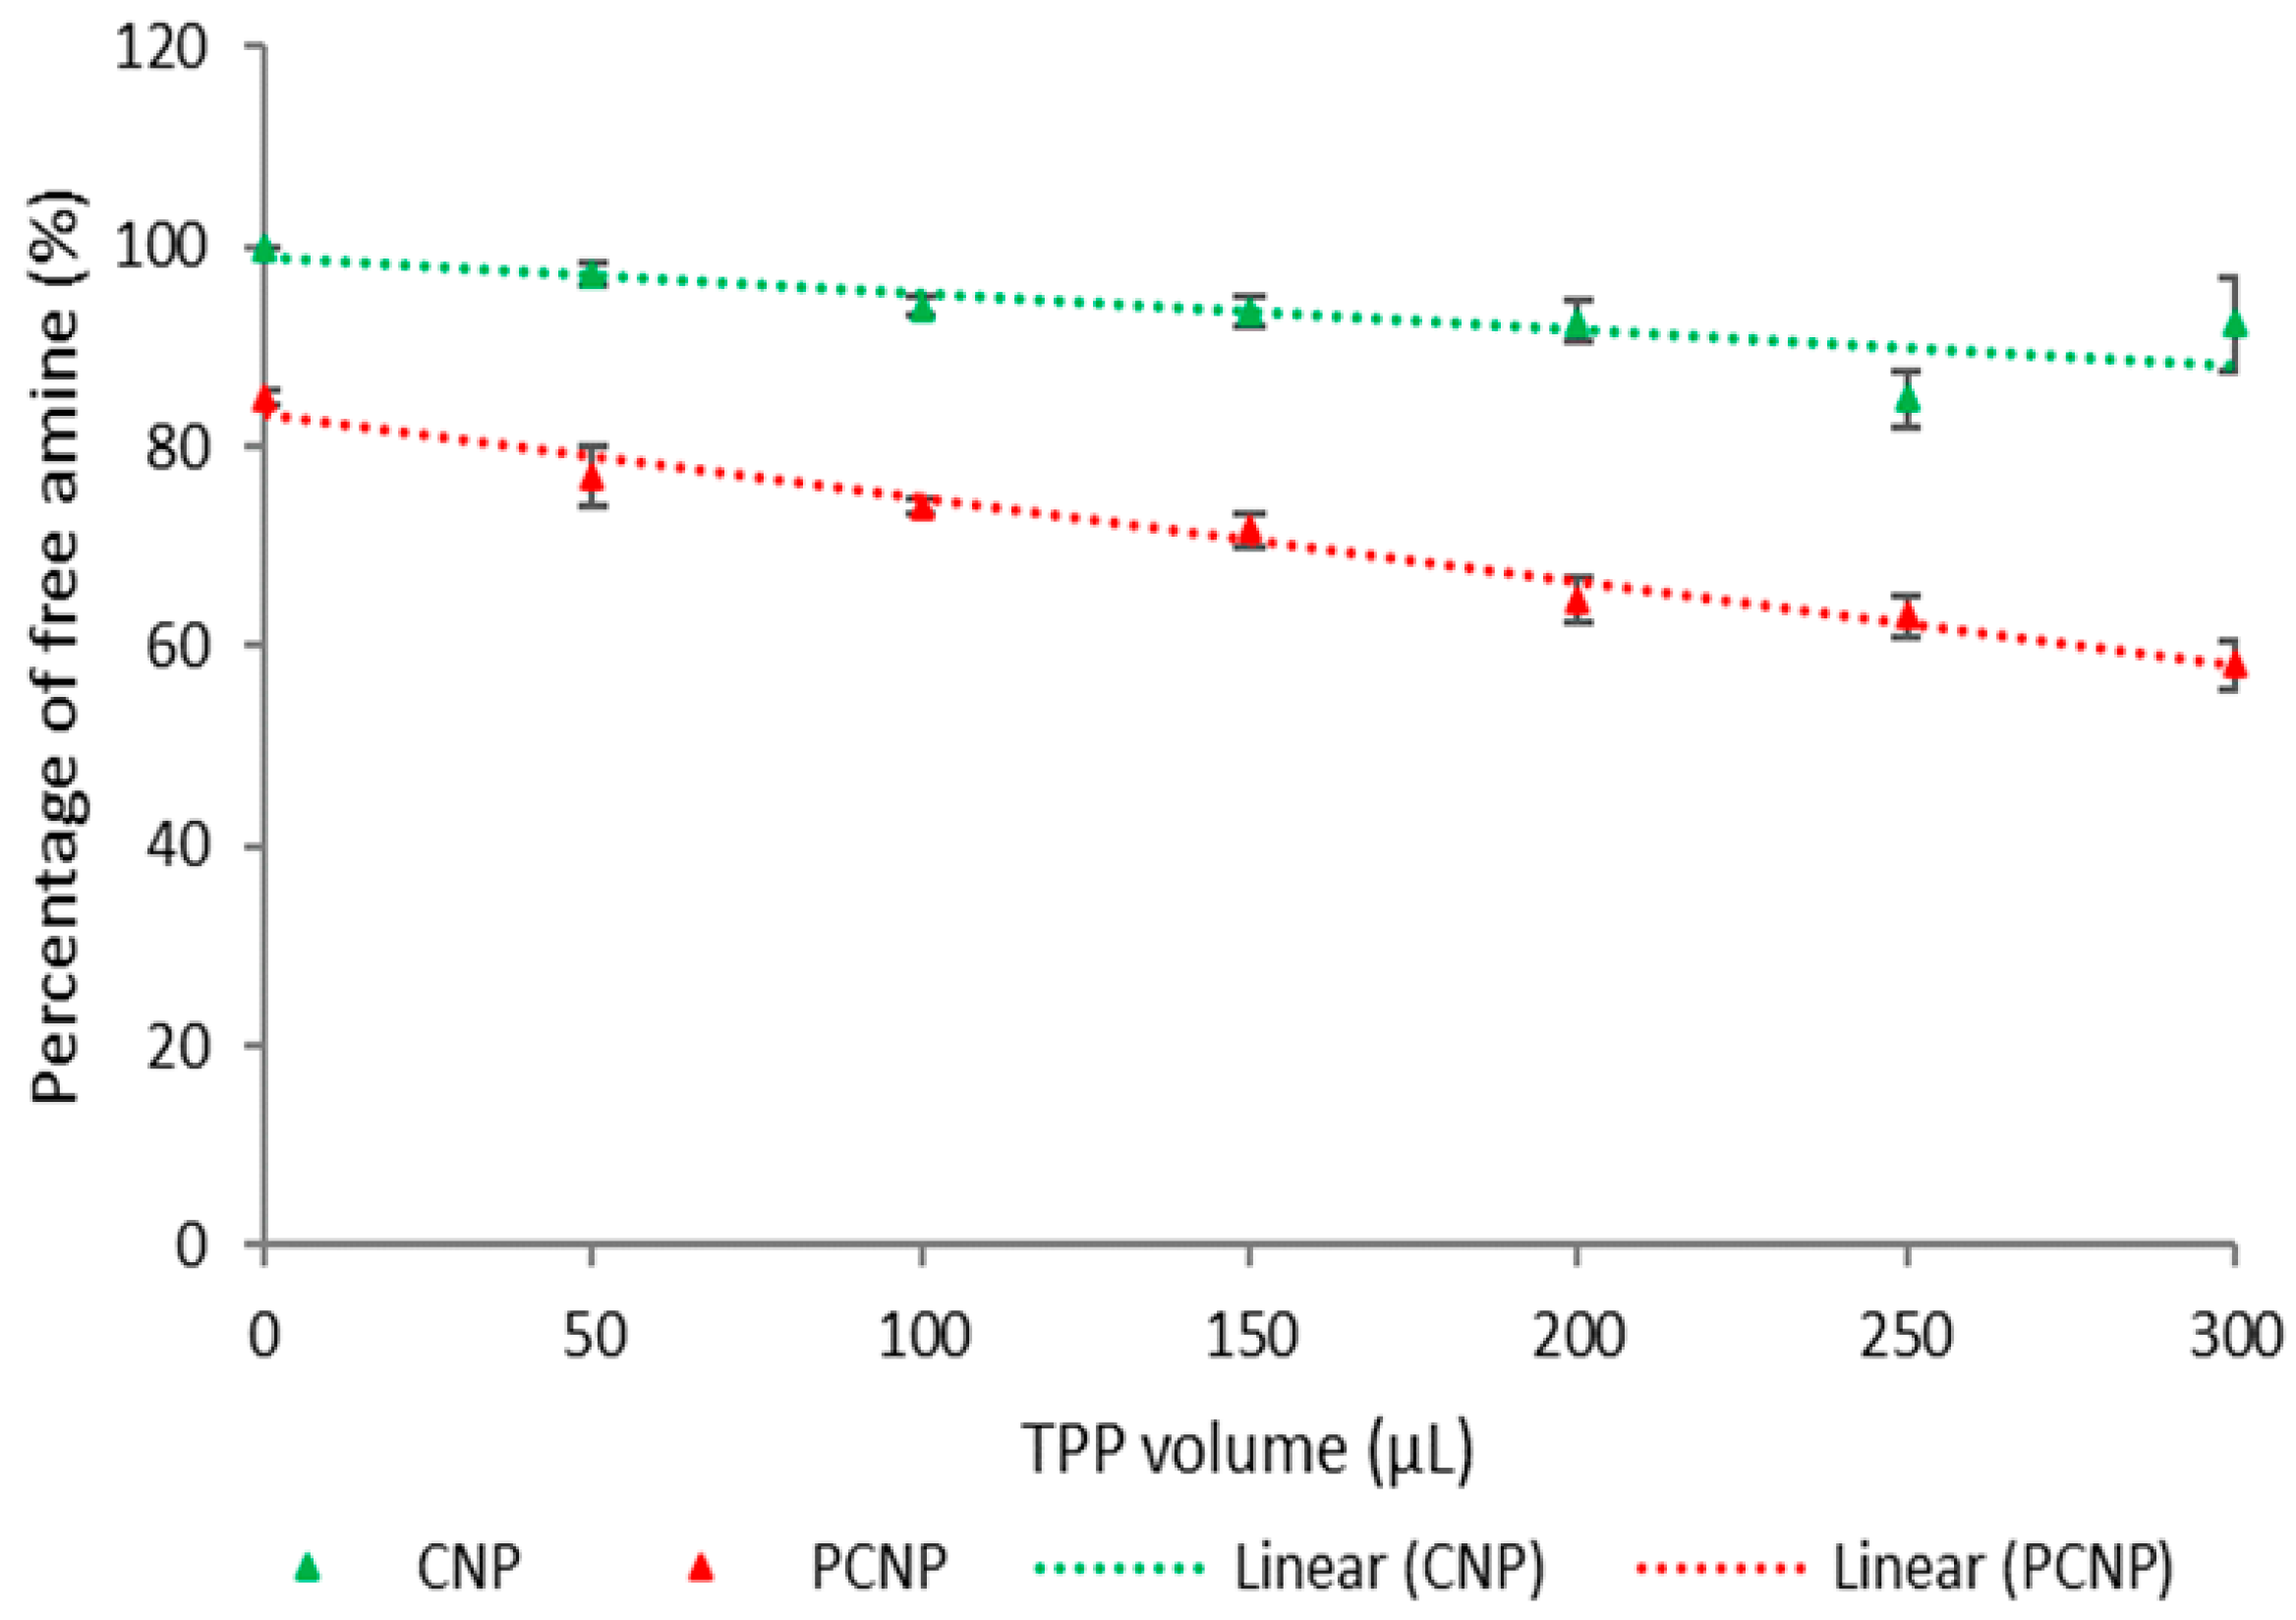
3.1. Quantification of Hydrophobic Palmitic Acid Functionalization on Chitosan by (TNBS) Assay

The amount of primary amine content in chitosan (CS) before and after modified with palmitic acid are shown in Table 1 and Figure 3. At optimum TPP volume of 250 µL, 25% of free amine content decreased from 88.35 ± 5.78% (CNP) to 62.99 ± 2.18% (PCNP). Decreased in the free primary amine groups of CS with TPP indicates increased in the crosslinking reactions between cationic amine groups of CS and anionic TPP. In other words, functionalization of the amine group of CS with hydrophobic palmitic acid NHS was a success and this outcome is similarly seen in previous studies [30,41]. This is essential to ensure adequate sites for hydrophobic thymoquinone encapsulation later. As shown in Figure 4, the palmitic acid only conjugated the amine sites of CS partially and that is crucial because some of the amine sites will be utilized by TPP crosslinker to interact during the PCNPs synthesis later [61].

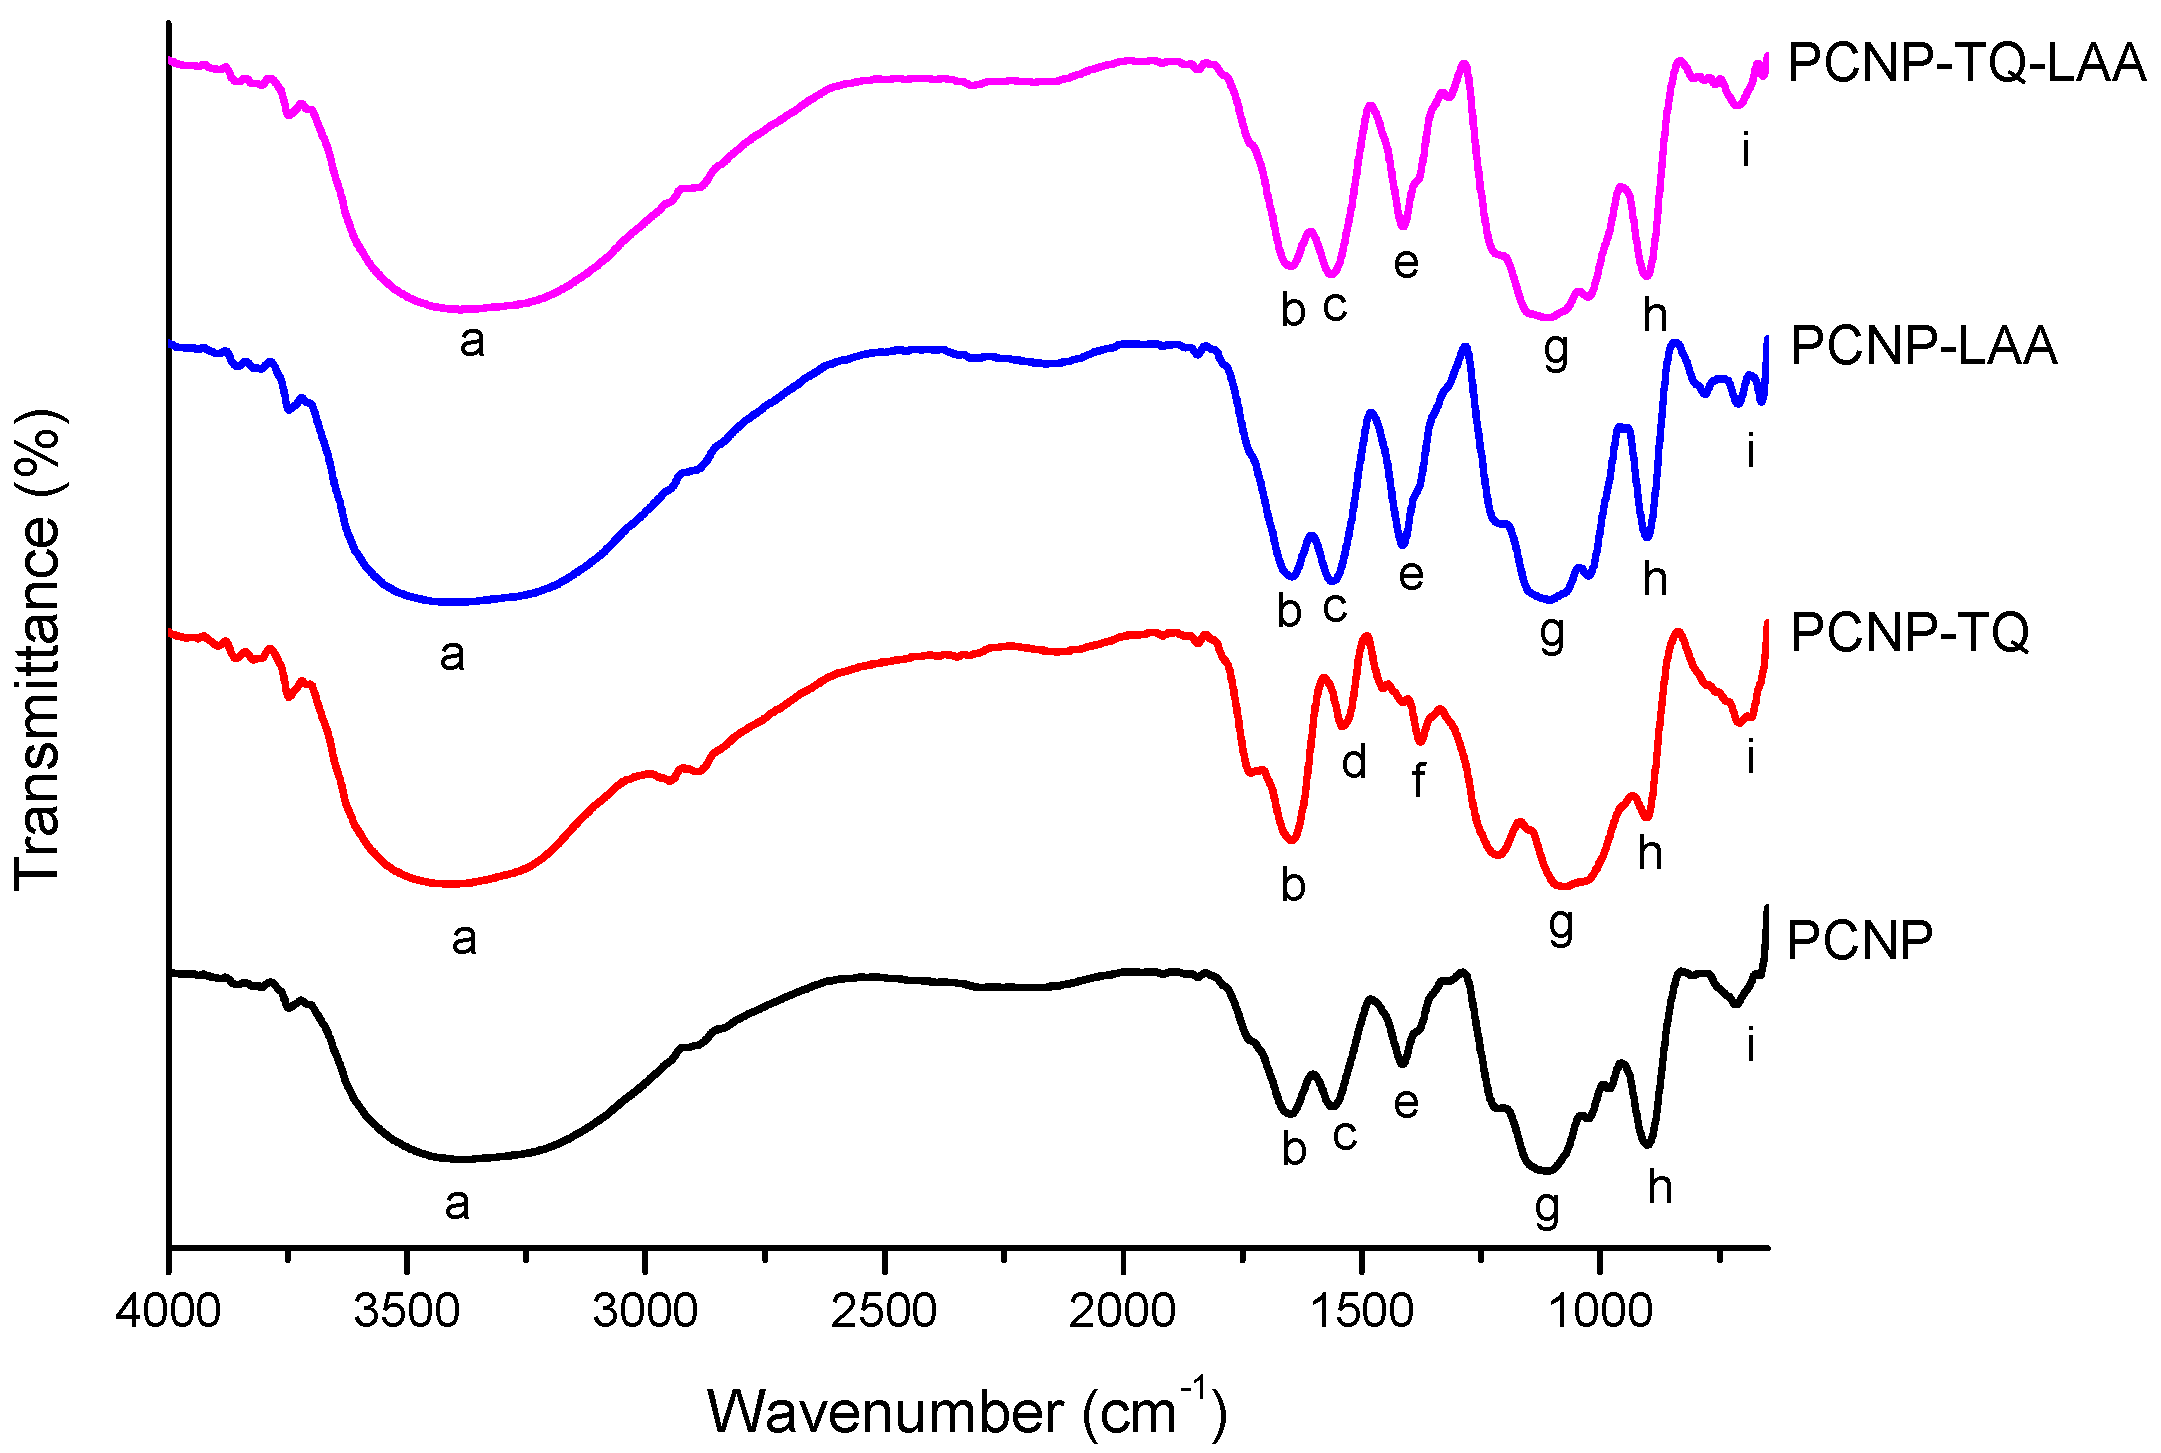
3.2. Functional Groups Determination by Fourier-Transform Infrared Spectroscopy (FTIR)

ATR-FTIR spectra of the NPs samples; PCNP, PCNP-TQ, PCNP-LAA and PCNP-TQ-LAA are shown in Figure 5 in the range of 4000–650 cm−1. A number of moieties were recognized based on the peaks and the numerical values of transmitted beams are reported in Table 2. Based on Table 2, PCNP, PCNP-LAA and PCNP-TQ-LAA have the same set of peaks. The FTIR interpretation was done by referring to the Virtual Textbook of Organic Chemistry, Infrared Spectroscopy topic by William Reusch [62].
PCNP-TQ, on the other hand, has extra peak d (1542 cm−1) and peak f (1379 cm−1) that represent carboxylic acid NH (amide) bend and alkane CH2 and CH3 deformation, respectively. The emergence of these peaks could be supported by the chemical structure of TQ itself (refer to Supplementary Materials, Figure S1). TQ has many C=O components that might bind with the amine of palmitic acid-NHS and CS. This answers the emergence of peak d and indirectly proves that hydrophobic TQ had successfully interacted with hydrophobic palmitic acid-NHS, which enhanced its encapsulation. Peak f in PCNP-TQ, on the other hand, emerged to resemble CH2 and CH3 deformation in conjunction with TQ association with palmitic acid NHS.
Peak a at 3399 cm−1 appeared in all samples and it suggests an overlay of alcohol OH (H bonded) with secondary amine NH stretch. The strong and broad peak a was majorly contributed by OH (H bonded) stretch, while NH stretch was weak. For peak a, encapsulated PCNPs had stronger bands as compared to PCNP because PCNP has the least source of OH. PCNP-LAA showed the strongest band because LAA has the highest OH sites that could have bonded with the OH from TPP (refer to Supplementary Materials, Figure S1 for LAA chemical structure). On the other hand, NH contributed to the emergence of the peak a and CS played an important role in supplying NH for all PCNPs conditions.
Peak b at 1647 cm−1 appeared in all samples and they are primary amine, C=O amide and alkene C=C stretch. It also represents N–C=O group resulted in the addition of palmitic acid to chitosan during the hydrophobic modification. This N–C=O group was less significant in unmodified chitosan samples as reported by Othman et al., 2018 in Table 1 [42]. Therefore, this justifies the successful insertion of palmitic acid to chitosan. Besides, similar palmitoyl-chitosan nanoparticles have been reported to exhibit palmitic acid in this range [41,45].

3.3. Particle Size Distribution by Zetasizer

The particle size distribution of all samples (PCNP, PCNP-TQ, PCNP-LAA and PCNP-TQ-LAA) were analyzed by zetasizer. The size, polydispersity index (PDI) and zeta potential of particles were successfully determined as shown in Table 3 and Figure 6. Particle size resembles the size of nanoparticles, while PDI resembles homogeneity of particles distribution; lower PDI samples are made up of more uniform particles size and therefore, they are more monodisperse [30]. Zeta potential, on the other hand, indicates the surface charge of nanoparticles that develops at the particle–liquid interface (slipping plane).
Overall, PCNP had the smallest particle size average, 92.6 ± 8.6 nm because it has not been encapsulated with any antioxidant yet. Therefore, the crosslinked PCS with TPP resulted in the smallest particles, with a size less than 100 nm. PNCP also had the lowest PDI value, 0.277 ± 0.103; this indicates that it had the most even dispersion of particles as compared to other samples. Studies reported that incorporation of compounds or drugs into nanoparticles resulted in increased of particle size [45,63]. Likewise, in this study, the encapsulated nanoparticle samples, PCNP-TQ, PCNP-LAA and PCNP-TQ-LAA showed an increment in size. PCNP-LAA had a slightly larger particles, 165.8 ± 12.9 nm than PCNP-TQ, 158.3 ± 13.9 nm because LAA has a higher molecular weight, 176.12 g/mol, while TQ is 164.20 g/mol. Furthermore, the final concentration of LAA used in the PCNP-LAA and PCNP-TQ-LAA formulation was 160 µM; which is 10 µM more than TQ encapsulated in PCNP-TQ and PCNP-TQ-LAA. Additionally, TQ also has more double bonds as compared to LAA; hence, it may have a smaller radius as it is more compact (refer to Supplementary Materials, Figure S1). For PCNP-TQ-LAA, the average particle size was the biggest, 247.7 ± 24.0 nm, and it signifies that LAA and TQ had been efficaciously encapsulated. Besides that, the PDI value of PCNP-TQ-LAA was 0.348 ± 0.043 and it is lower than PCNP-TQ, 0.374 ± 0.052 and PCNP-LAA, 0.392 ± 0.087. This remarks that dual loaded PCNP had more unvarying particles size against single loaded PCNP-TQ and PCNP-LAA due to more complex crosslinking formation.
For zeta potential, the values among samples did not differ much. It can be concluded that the encapsulation of thymoquinone, TQ and l-ascorbic acid, LAA did not contribute to a significant change of the nanoparticle surface charge. Therefore, it proves that they did not conjugate to the nanoparticle, instead they were encapsulated. In addition, the zeta potentials of PCNPs were almost similar with reported studies, which were in the range of +20 mV to +30 mV [46,64,65]. Moreover, the positively charged PCNPs could provide better interaction with negatively charged mucosal membrane; this could later facilitate the PCNPs delivery and cellular uptake [46,66].

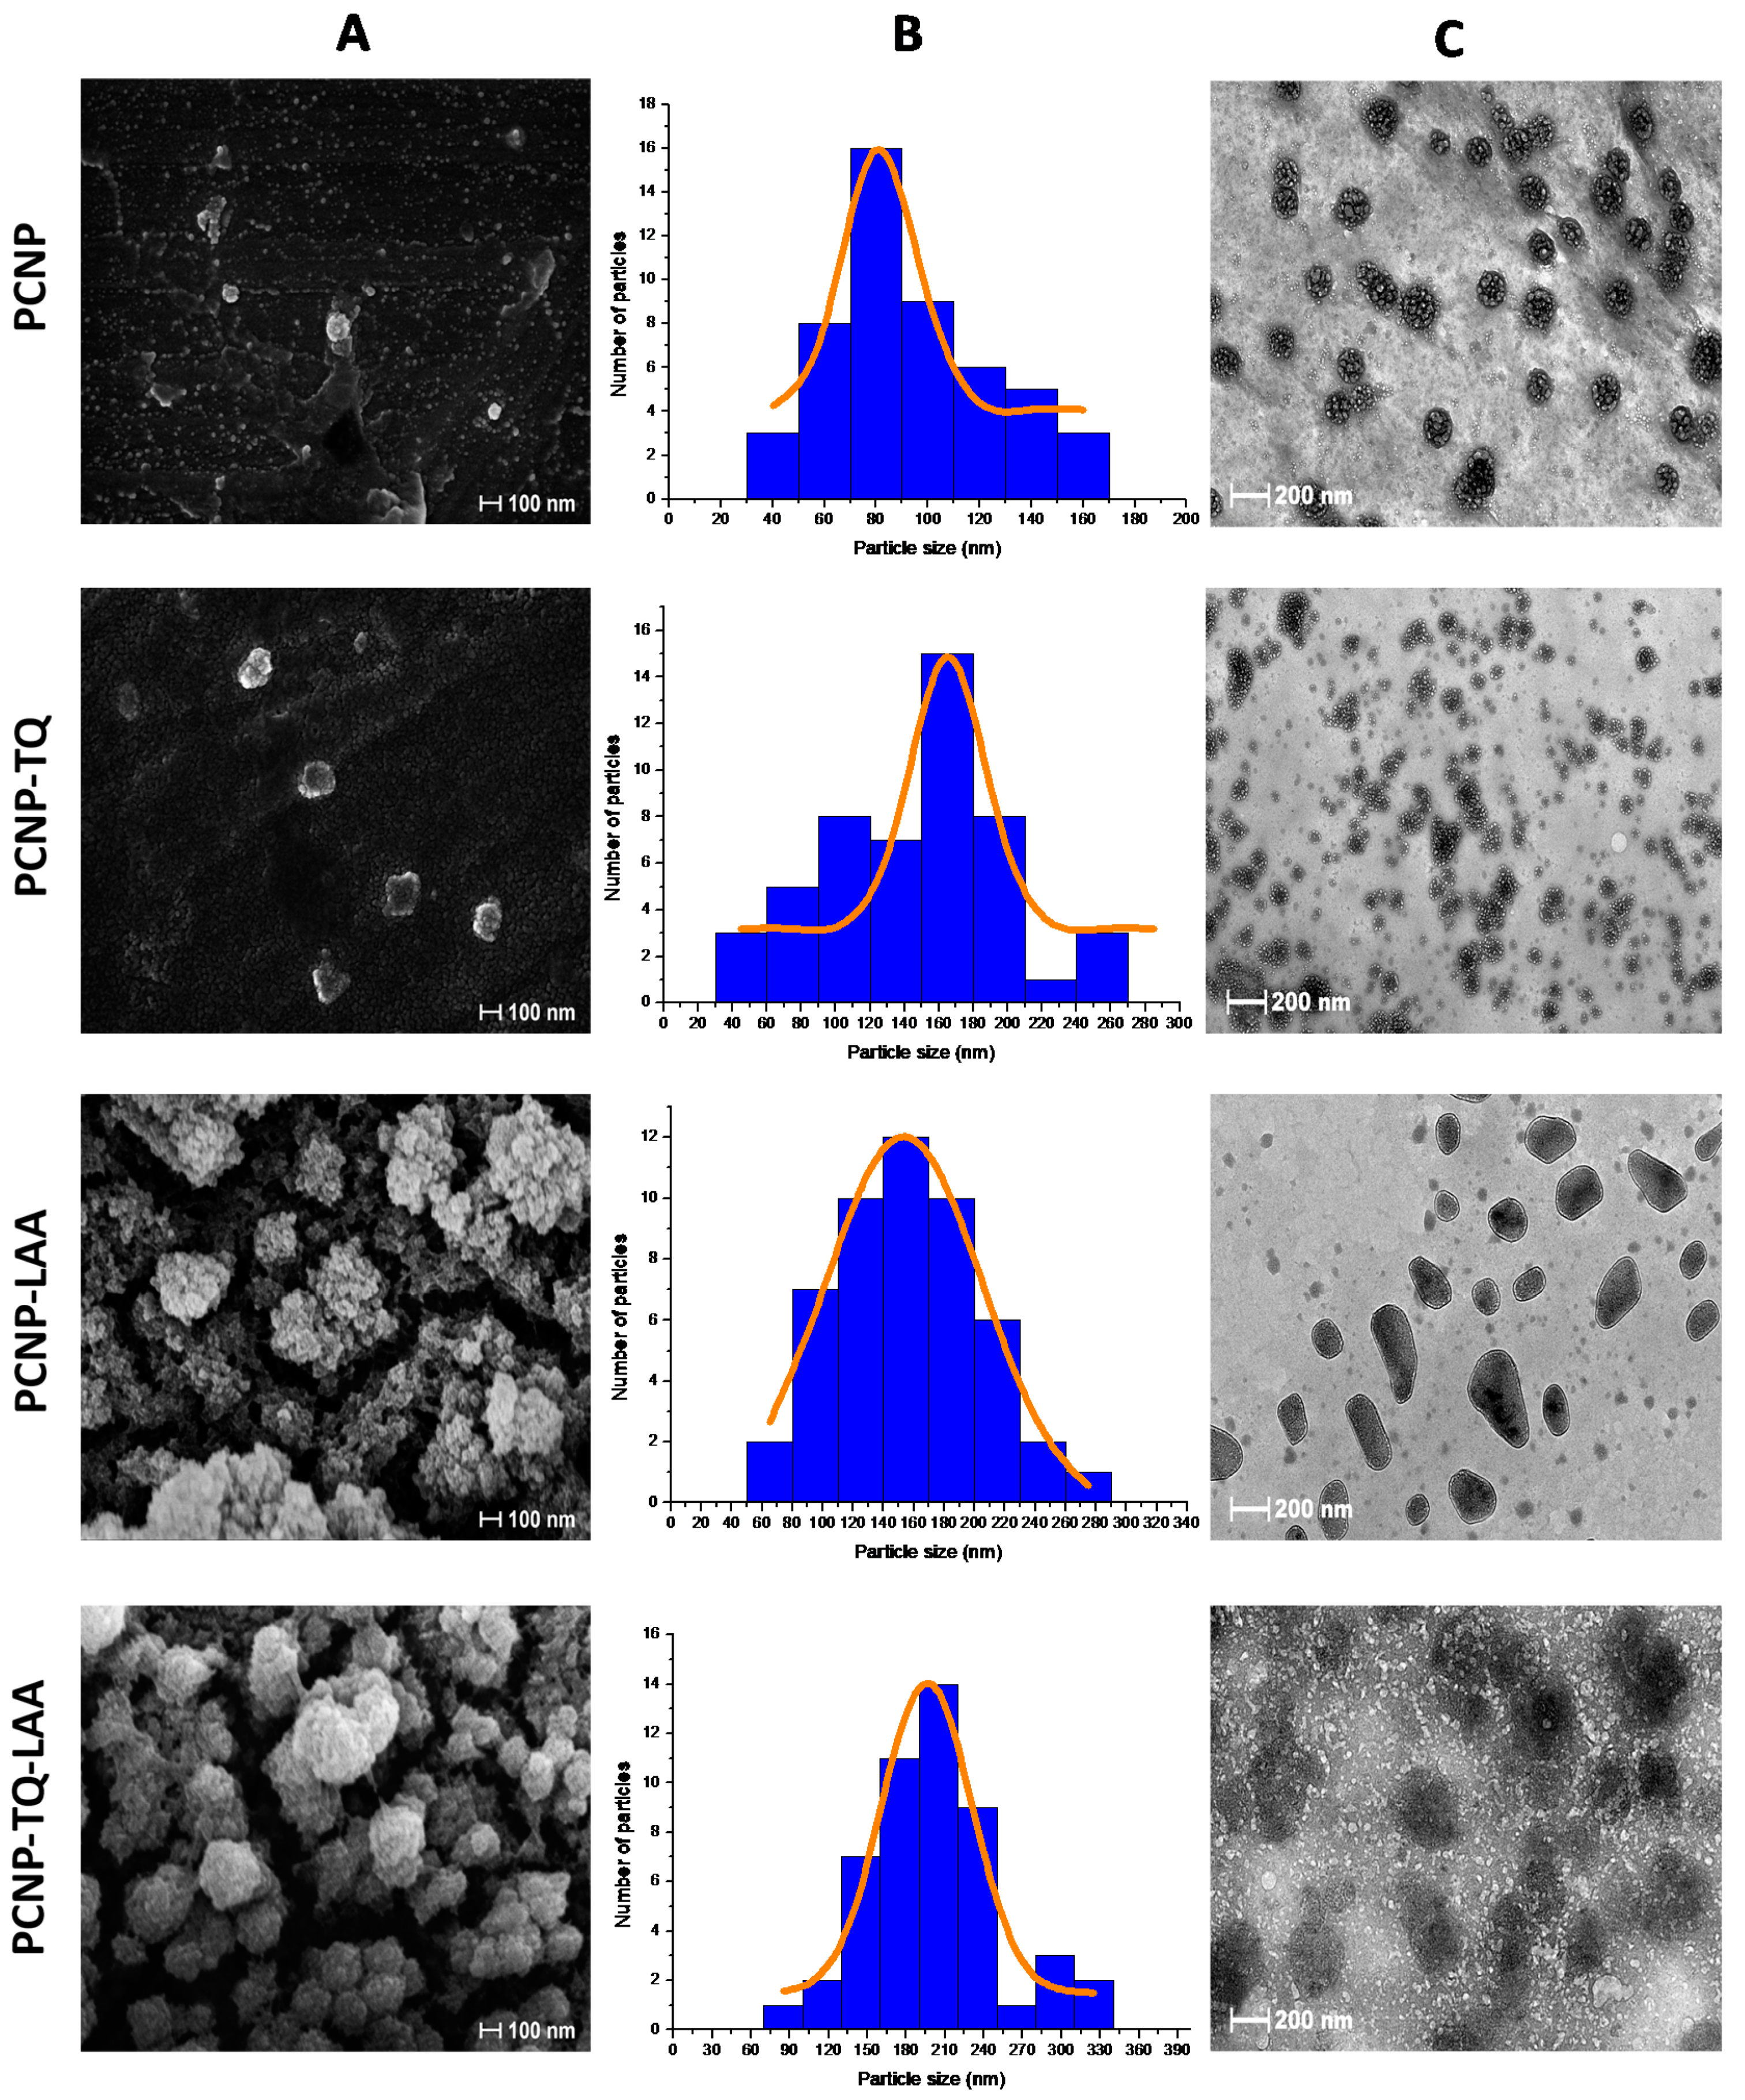
3.4. Surface Morphologies of Nanoparticles

Morphologies of empty PCNP, single loaded PCNP-TQ and PCNP-LAA and dual loaded PCNP-TQ-LAA were performed by FESEM and HRTEM. FESEM images were taken at 50,000 magnification as shown in Figure 7A, while HRTEM images were taken at 10,000 magnification as shown in Figure 7C. All samples were performed at least thrice.
Based on FESEM images Figure 7A, the shape of nanoparticles is spherical with uneven surface texture. As reported by a few researchers, the spherical shape of nanoparticles establishes more efficacious therapeutics delivery process by having large surface areas [11,16,17]. The formation of particles was clearly seen and the particle sizes were in range if compared with PSD study. Figure 7B shows a histogram and normal distribution curves of particle size based on the FESEM images. The bin range for PCNP is 20 while the other bin range is 30. The average particle size of PCNP was 81.49 ± 14.33 nm. PCNP had the smallest particle size average in comparison with PCNP-TQ, 165.32 ± 21.80 nm, PCNP-LAA, 153.50 ± 51.89 nm and PCNP-TQ-LAA, 195.90 ± 34.58 nm. For PCNP-TQ particle size distribution (refer to Figure 7B, PCNP-TQ), the second most measured particles have a size range of 90–110 nm. This clarifies that there are few particles unencapsulated and it matches with encapsulation efficiency percentage of TQ as stated in Table 4, which is only 41.3 ± 0.6%. On the other hand, PCNP-LAA has better particle dispersion as compared to PCNP-TQ because of the selectivity of chitosan that readily interacted with LAA which is of the same nature, hydrophilic [67].
HRTEM images, on the other hand, show layers of compounds by looking at the different color tones. Black particles represent the nanoparticles that have an average size that is almost the same as FESEM and PSD results. Besides, there are lots of tiny white pods in PCNP and PCNP-TQ which are palmitic acid micelles, the chemical used to modify chitosan to hydrophobic. The existence of palmitic acid in the system could be proven by looking at the FTIR interpretation. However, once PCNP was loaded with LAA, the white pods were less obvious and solid lines outlining those particles appeared to separate them from the surrounding. Meanwhile in PCNP-TQ-LAA, the image of particles became opaque, which indicated that they were fully occupied.
In addition, small white pods were also seen outside of the black particles. They are globular unreacted palmitic acid micelles. The amount of palmitic acid loaded might be excessive; therefore, they leached out from the NPs. It was proposed that the palmitic acid will attach to chitosan as an anchor on the surface of it; instead, it formed circular shapes. The palmitic acid anchor might be too long, which caused the formation of a circle as a result of joint ends.

3.5. Encapsulation Efficiency (EE)

This study was conducted to quantify how much of the loaded compound was successfully encapsulated. The concentration of TQ and LAA loaded in each sample PCNP-TQ, PCNP-LAA and PCNP-TQ-LAA were 150 µM and 160 µM, respectively. These optimized concentrations were used according to the previous study on unmodified chitosan nanoparticles done by Othman et al. (2018) in Section 3.5 [42]. According to Table 4 and Figure 8, LAA showed better EE as compared to TQ in both single and dual system PCNP with EE values of 73.0 ± 2.6% (116.8 µM) and 90.0 ± 0.0% (143.9 µM), respectively. These EE of LAA were much higher as compared to its EE before the modification by palmitic acid. By looking at Section 3.5, Table 4 by Othman et al., 2018, the EE of LAA in unmodified CNP-LAA and CNP-TQ-LAA were 69.3 ± 1.8% (110.9 µM) and 22.8 ± 3.2% (36.5 µM), respectively [42].
On the other hand, only 41.3 ± 0.6% (62.0 µM) and 64.9 ± 5.3% (97.3 µM) of TQ were encapsulated in PCNP-TQ and PCNP-TQ-LAA, respectively. Lower EE of TQ compared with LAA in PCNPs was contributed by the hydrophobic nature of the compound itself, which requires stronger energy to interact with the main polymer, hydrophilic chitosan [33,46,68]. However, by having the palmitic acid modifier that holds TQ in place, the EE of TQ in the modified PCNPs were found to be higher compared to EE of TQ in the unmodified CNPs. As stated by Othman et al., 2018 in Section 3.5, Table 4, the EE of TQ in unmodified CNP-TQ and CNP-TQ-LAA were 68.7 ± 4.8% (103.1 µM) and 35.6 ± 3.6% (53.4 µM), respectively [42].
Following the modification, both TQ and LAA showed an increase in the EE for the dual loaded system. The EE of TQ in modified PCNP-TQ-LAA increased to about 29% compared to unmodified CNP-TQ-LAA. Meanwhile, the EE of LAA in modified PCNP-TQ-LAA increased to about 67% compared to unmodified CNP-TQ-LAA. This proves that the modification of chitosan by palmitic acid NHS was able to augment the EE of antioxidants. Same observations were seen in the increment of drugs EE when palmitic acid was used as a modifier in chitosan [30,41]. This clarifies that the palmitic acid is a highly potential modifier in polymeric nanocarrier for encapsulation enhancement of pharmaceuticals.

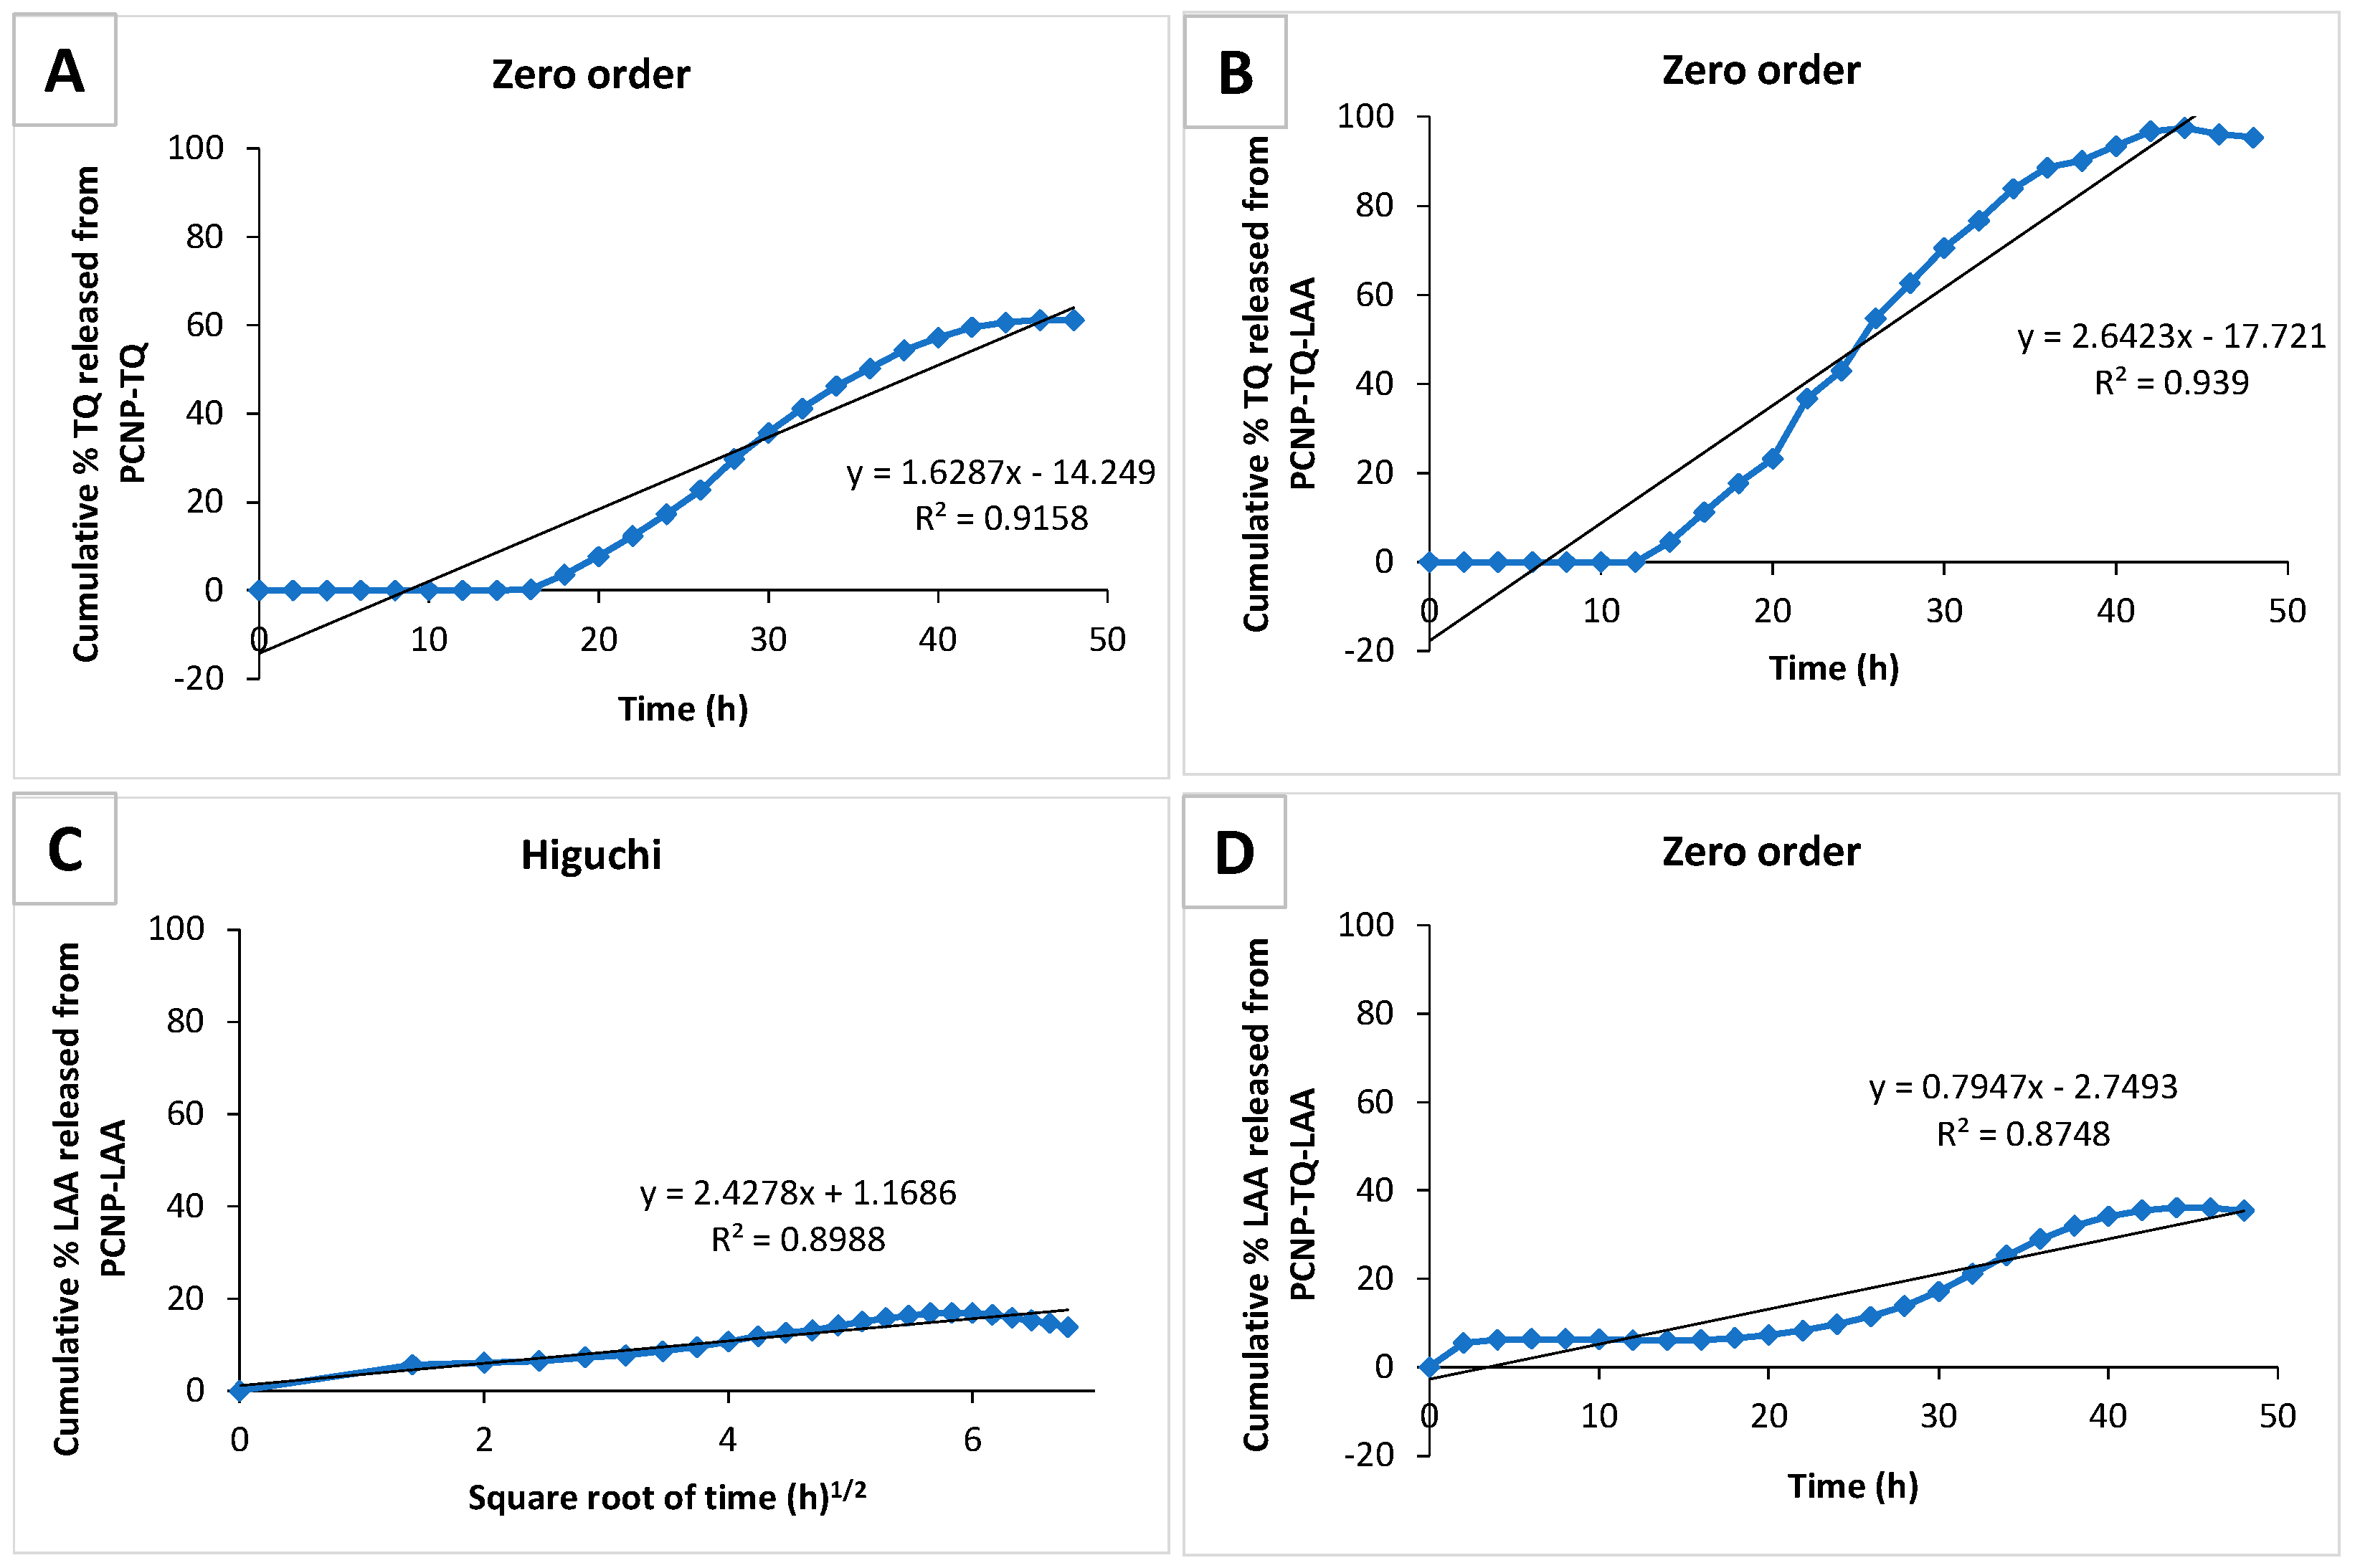
3.6. Preliminary Study of Thymoquinone and l-Ascorbic Acid In Vitro Release from PCNP

Release study was conducted to quantify how much of the encapsulated compound was successfully released from the PCNP carrier. The percentage and concentration of compounds released were included in Table 5. Release of TQ from the dual loaded system, PCNP-TQ-LAA was 37% more than the release of TQ from single loaded PCNP-TQ. LAA also showed higher release percentage from the dual loaded system as compared to a single loaded system, PCNP-LAA by around 19%. This trend indicates that when TQ and LAA were encapsulated together in a carrier, they could be released more efficiently.
The zero-order, first-order, Higuchi, Hixson–Crowell and Korsmeyer–Peppas plots were made for each release sample (A, B, C and D as labelled in Table 5). Release kinetic of a sample was determined by selecting the highest correlation value, R2 from the best fit line of all models. Figure 9 summarizes the best release kinetic model for all samples. Only sample C follows the Higuchi model, while the rest follow the zero-order model. The zero-order explains the constant release rate of a pharmaceutical product. It means TQ and LAA were able to be released controllably from the dual loaded system, PCNP-TQ-LAA. This indirectly tells us that the system could help people predict how long to expect a pharmaceutical product to work.

4. Conclusions

In this study, modification of biodegradable and biocompatible chitosan with palmitic acid NHS prior to nanoparticles formation had resulted in average particle size of around 250 nm for dual loaded thymoquinone and l-ascorbic acid palmitoyl-chitosan nanoparticles, PCNP-TQ-LAA. The robust and easy modification had also successfully increased the encapsulation efficiency of thymoquinone and l-ascorbic acid in the dual loaded system by about 29% and 67%, respectively; therefore, less loaded antioxidants were unencapsulated. This is supported by FTIR spectra of particular peaks to resemble related functional groups and also by morphology images using FESEM and HRTEM. It could also be proven that a 2:1 volume ratio of chitosan to palmitic acid NHS is remarkably appropriate to obtain partial hydrophobic sites in chitosan for more efficient encapsulation of antioxidants. The achievement of modifying this carrier with better capability of encapsulating dual classes hydrophilic and hydrophobic antioxidants has contributed to improvization in multi-drug therapy. As the dual loaded antioxidants TQ and LAA showed zero- order release kinetics, the polymeric nanoparticles carrier could potentially be reused with different sets of drugs for more effective delivery.

Supplementary Materials

The following are available online at https://www.mdpi.com/2227-9717/8/9/1040/s1, Figure S1: Chemical structure of thymoquinone, TQ (left) and l-ascorbic acid, LAA (right).

Author Contributions

Conceptualization and methodology: N.O., S.N.A.M.J. and M.J.M.; software and data curation: N.O. and N.S.S.; experimental work: N.O.; reagents/materials/analysis tools and validation: S.N.A.M.J., M.J.M., L.C.A. and R.D.; writing: N.O., S.N.A.M.J. and M.J.M. All authors have read and agreed to the published version of the manuscript.

Funding

This research was funded by Universiti Putra Malaysia, UPM-GP-IPS, project code UPM/700-2/1/GP-IPS/2017/9546900, with vote number 9546900. The APC was funded by Research Management Center of Universiti Putra Malaysia.

Acknowledgments

Thanks are due to Chemistry Department, Faculty of Science, Universiti Putra Malaysia, Cell and Molecular Biology Department, Faculty of Biotechnology and Biomolecular Sciences, Universiti Putra Malaysia, Chemical and Environmental Engineering Department, Faculty of Engineering, Universiti Putra Malaysia and Chemical Sciences Department, Faculty of Science and Technology, Universiti Kebangsaan Malaysia for providing the research facilities.

Conflicts of Interest

The authors declare no conflict of interest.

References

  1. Chen, S.; Wang, Z.; Huang, Y.; Barr, S.A.O.; Wong, R.A.; Yeung, S.; Chow, M.S.S. Ginseng and Anticancer Drug Combination to Improve Cancer Chemotherapy: A Critical Review. Hindawi 2014, 2014. [Google Scholar] [CrossRef]
  2. Sun, J.; Wei, Q.; Zhou, Y.; Wang, J.; Liu, Q.; Xu, H. A systematic analysis of FDA-approved anticancer drugs. BMC Syst. Biol. 2017, 11. [Google Scholar] [CrossRef]
  3. Wong, C.C.; Cheng, K.; Rigas, B. Preclinical Predictors of Anticancer Drug Efficacy: Critical Assessment with Emphasis on Whether Nanomolar Potency Should Be Required of Candidate Agents. J. Pharm. Exp. Ther. 2012, 341, 572–578. [Google Scholar] [CrossRef] [Green Version]
  4. Xu, Y.; Wu, J.; Liao, S.; Sun, Z. Treating tuberculosis with high doses of anti-TB drugs: Mechanisms and outcomes. Ann. Clin. Microbiol. Antimicrob. 2017, 16, 1–13. [Google Scholar] [CrossRef] [PubMed]
  5. Zhu, C.; Liu, Y.; Hu, L.; Yang, X.M.; He, Z. Molecular mechanism of the synergistic activity of ethambutol and isoniazid against Mycobacterium tuberculosis. J. Biol. Chem. 2018, 293, 16741–16750. [Google Scholar] [CrossRef] [Green Version]
  6. Rey-jurado, E.; Tudó, G.; Antonio, J.; González-martín, J. Synergistic effect of two combinations of antituberculous drugs against Mycobacterium tuberculosis. Tuberculosis 2012, 92, 260–263. [Google Scholar] [CrossRef] [PubMed]
  7. Liu, Q.; Zhang, J.; Sun, W.; Xie, Q.R.; Xia, W.; Gu, H. Delivering hydrophilic and hydrophobic chemotherapeutics simultaneously by magnetic mesoporous silica nanoparticles to inhibit cancer cells. Int. J. Nanomed. 2012, 7, 999–1013. [Google Scholar]
  8. Ma, Y.; Liu, D.; Wang, D.; Wang, Y.; Fu, Q.; Fallon, J.K.; Yang, X.; He, Z.; Liu, F. Combinational delivery of hydrophobic and hydrophilic anticancer drugs in single nanoemulsions to treat MDR in cancer. Mol. Pharm. 2014, 11, 2623–2630. [Google Scholar] [CrossRef] [PubMed]
  9. Jingou, J.; Shilei, H.; Weiqi, L.; Danjun, W.; Tengfei, W.; Yi, X. Preparation, characterization of hydrophilic and hydrophobic drug in combine loaded chitosan/cyclodextrin nanoparticles and in vitro release study. Colloids Surf. B Biointerfaces 2011, 83, 103–107. [Google Scholar] [CrossRef] [PubMed]
  10. Naderinezhad, S.; Amoabediny, G.; Haghiralsadat, F. Co-delivery of hydrophilic and hydrophobic anticancer drugs using biocompatible pH-sensitive lipid-based nano-carriers for multidrug-resistant cancers. RSC Adv. 2017, 7, 30008–30019. [Google Scholar] [CrossRef] [Green Version]
  11. Hao, S.; Wang, B.; Wang, Y. Porous hydrophilic core/hydrophobic shell nanoparticles for particle size and drug release control. Mater. Sci. Eng. C 2015, 49, 51–57. [Google Scholar] [CrossRef] [PubMed]
  12. Kaur, G.; Mehta, S.K.; Kumar, S.; Bhanjana, G.; Dilbaghi, N. Coencapsulation of Hydrophobic and Hydrophilic Antituberculosis Drugs in Synergistic Brij 96 Microemulsions: A Biophysical Characterization. J. Pharm. Sci. 2015, 104, 2203–2212. [Google Scholar] [CrossRef] [PubMed]
  13. Calvo, P.; Remunan-Lopez, C.; Vila-Jato, J.L.; Alonso, M.J. Novel hydrophilic chitosan-polyethylene oxide nanoparticles as protein carriers. J. Appl. Polym. Sci. 1997, 63, 125–132. [Google Scholar] [CrossRef]
  14. Dini, E.; Alexandridou, S.; Kiparissides, C. Synthesis and characterization of cross-linked chitosan microspheres for drug delivery applications. J. Microencapsul. 2003, 20, 375–385. [Google Scholar] [CrossRef]
  15. Liu, H.; He, J. Simultaneous release of hydrophilic and hydrophobic drugs from modified chitosan nanoparticles. Mater. Lett. 2015, 161, 415–418. [Google Scholar] [CrossRef]
  16. Jamil, A.; Lim, H.N.; Yusof, N.A.; Ahmad Tajudin, A.; Huang, N.M.; Pandikumar, A.; Moradi Golsheikh, A.; Lee, Y.H.; Andou, Y. Preparation and characterization of silver nanoparticles-reduced graphene oxide on ITO for immunosensing platform. Sens. Actuators B Chem. 2015, 221, 1423–1432. [Google Scholar] [CrossRef]
  17. Vijayan, V.; Reddy, K.R.; Sakthivel, S.; Swetha, C. Optimization and charaterization of repaglinide biodegradable polymeric nanoparticle loaded transdermal patchs: In vitro and in vivo studies. Colloids Surf. B Biointerfaces 2013, 111, 150–155. [Google Scholar] [CrossRef] [PubMed]
  18. Biswas, A.K.; Islam, R.; Choudhury, Z.S.; Mostafa, A.; Kadir, M.F. Nanotechnology based approaches in cancer therapeutics. Adv. Nat. Sci. Nanosci. Nanotechnol. 2014, 5. [Google Scholar] [CrossRef]
  19. Rizvi, S.A.A.; Saleh, A.M. Applications of nanoparticle systems in drug delivery technology. Saudi Pharm. J. 2018, 26, 64–70. [Google Scholar] [CrossRef]
  20. Jeevanandam, J.; Barhoum, A.; Chan, Y.S.; Dufresne, A.; Danquah, M.K. Review on nanoparticles and nanostructured materials: History, sources, toxicity and regulations. Beilstein J. Nanotechnol. 2018, 9, 1050–1074. [Google Scholar] [CrossRef] [Green Version]
  21. Mudshinge, S.R.; Deore, A.B.; Patil, S.; Bhalgat, C.M. Nanoparticles: Emerging carriers for drug delivery. Saudi Pharm. J. 2011, 19, 129–141. [Google Scholar] [CrossRef] [PubMed] [Green Version]
  22. Emeje, M.O.; Obidike, I.C.; Akpabio, E.I.; Ofoefule, S.I. Nanotechnology in Drug Delivery; IntechOpen: London, UK, 2012. [Google Scholar]
  23. Ahad, A.; Al-Saleh, A.A.; Akhtar, N.; Al-Mohizea, A.M.; Al-Jenoobi, F.I. Transdermal delivery of antidiabetic drugs: Formulation and delivery strategies. Drug Discov. Today 2015, 20, 1217–1227. [Google Scholar] [CrossRef] [PubMed]
  24. Sharma, G.; Sharma, A.R.; Nam, J.S.; Doss, G.P.C.; Lee, S.S.; Chakraborty, C. Nanoparticle based insulin delivery system: The next generation efficient therapy for Type 1 diabetes. J. Nanobiotechnol. 2015, 13, 1–13. [Google Scholar] [CrossRef] [PubMed] [Green Version]
  25. Wong, C.Y.; Al-Salami, H.; Dass, C.R. Potential of insulin nanoparticle formulations for oral delivery and diabetes treatment. J. Control. Release 2017, 264, 247–275. [Google Scholar] [CrossRef] [PubMed]
  26. Nayak, D.; Minz, A.P.; Ashe, S.; Rauta, P.R.; Kumari, M.; Chopra, P.; Nayak, B. Synergistic combination of antioxidants, silver nanoparticles and chitosan in a nanoparticle based formulation: Characterization and cytotoxic effect on MCF-7 breast cancer cell lines. J. Colloid Interface Sci. 2016, 470, 142–152. [Google Scholar] [CrossRef] [PubMed]
  27. Bahrami, B.; Hojjat-farsangi, M.; Mohammadi, H.; Anvari, E. Nanoparticles and targeted drug delivery in cancer therapy. Immunol. Lett. 2017, 190, 64–83. [Google Scholar] [CrossRef]
  28. Grobmyer, S.R.; Zhou, G.; Gutwein, L.G.; Iwakuma, N.; Sharma, P.; Hochwald, S.N. Nanoparticle delivery for metastatic breast cancer. Nanomed. Nanotechnol. Biol. Med. 2012, 8, S21–S30. [Google Scholar] [CrossRef]
  29. Li, C.; Kuo, T.; Su, H.; Lai, W.; Yang, P.-C.; Chen, J.-S.; Wang, D.-Y.; Wu, Y.C.; Chen, C.-C. Fluorescence-Guided Probes of Aptamer-Targeted Gold Nanoparticles with Computed Tomography Imaging Accesses for in Vivo Tumor Resection. Sci. Rep. 2015, 5. [Google Scholar] [CrossRef] [PubMed]
  30. Masarudin, M.J.; Cutts, S.M.; Evison, B.J.; Phillips, D.R.; Pigram, P.J. Factors determining the stability, size distribution, and cellular accumulation of small, monodisperse chitosan nanoparticles as candidate vectors for anticancer drug delivery: Application to the passive encapsulation of [14C]-doxorubicin. Nanotechnol. Sci. Appl. 2015, 8, 67–80. [Google Scholar] [CrossRef] [Green Version]
  31. Zhao, L.M.; Shi, L.E.; Zhang, Z.L.; Chen, J.M.; Shi, D.D.; Yang, J.; Tang, Z.X. Preparation and application of chitosan nanoparticles and nanofibers. Braz. J. Chem. Eng. 2011, 28, 353–362. [Google Scholar] [CrossRef]
  32. Elgadir, M.A.; Uddin, S.; Ferdosh, S.; Adam, A.; Jalal, A.; Chowdhury, K.; Islam, Z. Impact of chitosan composites and chitosan nanoparticle composites on various drug delivery systems: A review. J. Food Drug Anal. 2014, 23, 619–629. [Google Scholar] [CrossRef] [Green Version]
  33. Szymanska, E.; Winnicka, K. Stability of Chitosan—A Challange for Pharmaceutical and Biomedical Applications. Mar. Drugs 2015, 13, 1819–1846. [Google Scholar] [CrossRef] [PubMed]
  34. Dash, M.; Chiellini, F.; Ottenbrite, R.M.; Chiellini, E. Chitosan—A versatile semi-synthetic polymer in biomedical applications. Prog. Polym. Sci. 2011, 36, 981–1014. [Google Scholar] [CrossRef]
  35. Ifuku, S. Chitin and Chitosan Nanofibers: Preparation and Chemical Modifications. Molecules 2014, 19, 18367–18380. [Google Scholar] [CrossRef] [PubMed]
  36. Sreekumar, S.; Goycoolea, F.M.; Moerschbacher, B.M.; Rivera-Rodriguez, G.R. Parameters influencing the size of chitosan-TPP nano- and microparticles. Sci. Rep. 2018, 8, 1–11. [Google Scholar] [CrossRef] [Green Version]
  37. Desai, P.; Patlolla, R.R.; Singh, M. Interaction of nanoparticles and cell-penetrating peptides with skin for transdermal drug delivery. Mol. Membr. Biol. 2010, 27, 247–259. [Google Scholar] [CrossRef] [PubMed] [Green Version]
  38. Kofuji, K.; Qian, C.; Nishimura, M.; Sugiyama, I.; Murata, Y.; Kawashima, S. Relationship between physicochemical characteristics and functional properties of chitosan. Eur. Polym. J. 2005, 41, 2784–2791. [Google Scholar] [CrossRef]
  39. Banquy, X.; Suarez, F.; Argaw, A.; Rabanel, J.; Grutter, P.; Giasson, S. Effect of mechanical properties of hydrogel nanoparticles on macrophage cell uptake. Soft Matter 2009, 5, 3984–3991. [Google Scholar] [CrossRef]
  40. Mahapatro, A.; Singh, D.K. Biodegradable nanoparticles are excellent vehicle for site directed in-vivo delivery of drugs and vaccines. J. Nanobiotechnol. 2011, 9, 55. [Google Scholar] [CrossRef] [Green Version]
  41. Kuen, C.; Fakurazi, S.; Othman, S.; Masarudin, M. Increased Loading, Efficacy and Sustained Release of Silibinin, a Poorly Soluble Drug Using Hydrophobically-Modified Chitosan Nanoparticles for Enhanced Delivery of Anticancer Drug Delivery Systems. Nanomaterials 2017, 7, 379. [Google Scholar] [CrossRef] [Green Version]
  42. Othman, N.; Masarudin, M.J.; Kuen, C.Y.; Dasuan, N.A.; Abdullah, L.C.; Md. Jamil, S.N.A. Synthesis and Optimization of Chitosan Nanoparticles Loaded with L -Ascorbic Acid and Thymoquinone. Nanomaterials 2018, 8, 920. [Google Scholar] [CrossRef] [PubMed] [Green Version]
  43. Kyzas, G.Z.; Bikiaris, D.N. Recent modifications of chitosan for adsorption applications: A critical and systematic review. Mar. Drugs 2015, 13, 312–337. [Google Scholar] [CrossRef] [PubMed]
  44. Sharma, D.; Singh, J. Synthesis and Characterization of Fatty Acid Grafted Chitosan Polymer and Their Nanomicelles for Nonviral Gene Delivery Applications. Bioconjug. Chem. 2017, 28, 2772–2783. [Google Scholar] [CrossRef] [PubMed]
  45. Thotakura, N.; Dadarwal, M.; Kumar, R.; Singh, B.; Sharma, G.; Kumar, P.; Prakash, O.; Raza, K. Chitosan-palmitic acid based polymeric micelles as promising carrier for circumventing pharmacokinetic and drug delivery concerns of tamoxifen. Int. J. Biol. Macromol. 2017, 102, 1220–1225. [Google Scholar] [CrossRef]
  46. Alam, S.; Khan, Z.I.; Mustafa, G.; Kumar, M.; Islam, F.; Bhatnagar, A.; Ahmad, F.J. Development and evaluation of thymoquinone—Encapsulated chitosan nanoparticles for nose-to-brain targeting: A pharmacoscintigraphic study. Int. J. Nanomed. 2012, 7, 5705–5718. [Google Scholar] [CrossRef] [PubMed] [Green Version]
  47. Goyal, S.N.; Prajapati, C.P.; Gore, P.R.; Patil, C.R.; Mahajan, U.B.; Sharma, C.; Talla, S.P.; Ojha, S.K. Therapeutic potential and pharmaceutical development of thymoquinone: A multitargeted molecule of natural origin. Front. Pharmacol. 2017, 8. [Google Scholar] [CrossRef]
  48. Hemilä, H.; Chalker, E. Vitamin C for preventing and treating the common cold. Cochrane Libr. Cochrane Rev. 2017. [Google Scholar] [CrossRef]
  49. Gonzalez, M.J.; Miranda-Massari, J.R.; Berdiel, M.J.; Duconge, J.; Rodriguez-Lopez, J.L.; Hunninghake, R.; Cobas-Rosario, V.J. High Dose Intraveneous Vitamin C and Chikungunya Fever: A Case Report. J. Orthomol. Med. 2015, 29, 154–156. [Google Scholar]
  50. Hemilä, H. Vitamin C and Infections. Nutrients 2017, 9, 339. [Google Scholar] [CrossRef] [Green Version]
  51. Ullah, I.; Badshah, H.; Naseer, M.I.; Lee, H.Y.; Kim, M.O. Thymoquinone and Vitamin C Attenuates Pentylenetetrazole- Induced Seizures Via Activation of GABA B1 Receptor in Adult Rats Cortex and Hippocampus. Neuromol. Med. 2014. [Google Scholar] [CrossRef]
  52. Birben, E.; Sahiner, U.M.; Sackesen, C.; Erzurum, S.; Kalayci, O. Oxidative Stress and Antioxidant Defense. World Allergy Organ. J. 2012, 5, 9–19. [Google Scholar] [CrossRef] [PubMed] [Green Version]
  53. Loutfy, S.A.; El-din, H.M.A.; Elberry, M.H.; Allam, N.G.; Hasanin, M.T.M.; Abdellah, A.M. Synthesis, characterization and cytotoxic evaluation of chitosan nanoparticles: In vitro liver cancer model. Adv. Nat. Sci. Nanosci. Nanotechnol. 2016, 7. [Google Scholar] [CrossRef]
  54. Hanahan, D.; Weinberg, R.A. Review Hallmarks of Cancer: The Next Generation. Cell 2011, 144, 646–674. [Google Scholar] [CrossRef] [PubMed] [Green Version]
  55. Subri, N.N.S.; Cormack, P.A.G.; Md. Jamil, S.N.A.; Abdullah, L.C.; Daik, R. Synthesis of poly(acrylonitrile-co-divinylbenzene-co-vinylbenzyl chloride)-derived hypercrosslinked polymer microspheres and a preliminary evaluation of their potential for the solid-phase capture of pharmaceuticals. J. Appl. Polym. Sci. 2017, 135, 1–9. [Google Scholar] [CrossRef] [Green Version]
  56. Shi, Y.; Wan, A.; Shi, Y.; Zhang, Y.; Chen, Y. Experimental and mathematical studies on the drug release properties of aspirin loaded chitosan nanoparticles. BioMed Res. Int. 2014. [Google Scholar] [CrossRef] [PubMed]
  57. Bohrey, S.; Chourasiya, V.; Pandey, A. Polymeric nanoparticles containing diazepam: Preparation, optimization, characterization, in-vitro drug release and release kinetic study. Nano Converg. 2016, 3. [Google Scholar] [CrossRef] [Green Version]
  58. Higuchi, T. Mechanism of Sustained—Action Medication. J. Pharm. Sci. 1963. [Google Scholar]
  59. Hixson, A.W.; Crowell, J.H. Dependence of Reaction Velocity upon Surface and Agitation. Ind. Eng. Chem. 1931, 23, 1160–1168. [Google Scholar] [CrossRef]
  60. Korsmeyer, R.W.; Gurny, R.; Doelker, E.; Buri, P.; Peppas, N.A. Mechanisms of solute release from porous hydrophilic polymers. Int. J. Pharm. 1983, 15, 25–35. [Google Scholar] [CrossRef]
  61. Balan, V.; Redinciuc, V.; Tudorachi, N.; Verestiuc, L. Biotinylated N-palmitoyl chitosan for design of drug loaded self-assembled nanocarriers. Eur. Polym. J. 2016, 81, 284–294. [Google Scholar] [CrossRef]
  62. Reusch, W. Virtual Textbook of Organic Chemistry. Available online: https://www2.chemistry.msu.edu/faculty/reusch/VirtTxtJml/Spectrpy/InfraRed/infrared.htm#ir1 (accessed on 11 February 2020).
  63. Ramalingam, P.; Ko, Y.T. Improved oral delivery of resveratrol from N-trimethyl chitosan-g-palmitic acid surface-modified solid lipid nanoparticles. Colloids Surf. B Biointerfaces 2015, 139. [Google Scholar] [CrossRef] [PubMed]
  64. Zhao, Y.; Du, W.; Wu, H.; Wu, M.; Liu, Z.; Dong, S. Chitosan/sodium tripolyphosphate nanoparticles as efficient vehicles for enhancing the cellular uptake of fish—Derived peptide. J. Food Biochem. 2018. [Google Scholar] [CrossRef] [PubMed]
  65. Jang, K.-I.; Lee, H.G. Stability of Chitosan Nanoparticles for L-Ascorbic Acid during Heat Treatment in Aqueous Solution. J. Agric. Food Chem. 2008, 56, 1936–1941. [Google Scholar] [CrossRef] [PubMed]
  66. Du, X.J.; Wang, J.L.; Iqbal, S.; Li, H.J.; Cao, Z.T.; Wang, Y.C.; Wang, J. The Effect of Surface Charge on Oral Absorption of Polymeric Nanoparticles. Biomater. Sci. 2018. [Google Scholar] [CrossRef] [PubMed]
  67. Thaipong, K.; Boonprakob, U.; Crosby, K.; Cisneros-Zevallos, L.; Hawkins Byrne, D. Comparison of ABTS, DPPH, FRAP, and ORAC assays for estimating antioxidant activity from guava fruit extracts. J. Food Compos. Anal. 2006, 19, 669–675. [Google Scholar] [CrossRef]
  68. Ong, Y.S.; Yazan, L.S.; Ng, W.K.; Noordin, M.M.; Sapuan, S.; Foo, J.B.; Tor, Y.S. Acute and subacute toxicity profiles of thymoquinone-loaded nanostructured lipid carrier in BALB/c mice. Int. J. Nanomed. 2016, 5905–5915. [Google Scholar] [CrossRef] [PubMed] [Green Version]
Figure 1. Proposed illustration of hydrophobically modified palmitoyl-chitosan nanoparticles encapsulated with hydrophobic thymoquinone and hydrophilic l-ascorbic acid, palmiltoyl-chitosan nanoparticles (PCNP)-thymoquinone (TQ)-l-ascorbic acid (LAA).
Processes 08 01040 g001
Figure 2. Proposed ionic interaction of pamiltoyl-chitosan nanoparticles, PCNP (left) and palmitoyl-chitosan nanoparticles encapsulated with thymoquinone and l-ascorbic acid, PCNP-TQ-LAA (right). “m” and “n” denote repetition of acetylated and deacetylated group of chitosan, respectively. (*) denotes hydrophobic–hydrophobic interaction between TQ and palmitic acid, while (~) denotes hydrophilic–hydrophilic interaction between l-ascorbic acid and tripolyphosphate.
Processes 08 01040 g002
Figure 3. Percentage of free amine content in chitosan before (CNP) and after (PCNP) modification across a range of TPP volume. The free amine content in PCNP was lesser than in CNP. The loss of primary amine in CNP was due to the conjugation of palmitic acid during modification.
Processes 08 01040 g003
Figure 4. Conjugation of palmitic acid to amine group of chitosan. (left) Structure refers to unmodified CNP, and (right) structure refers to modified PCNP. “m” and “n” denote repetition of acetylated and deacetylated group of chitosan, respectively.
Processes 08 01040 g004
Figure 5. Fourier-transform infrared spectroscopy (FTIR) spectra of PCNP, PCNP-TQ, PCNP-LAA and PCNP-TQ-LAA. The labelled peaks that represent certain functional groups are stated in Table 2.
Processes 08 01040 g005
Figure 6. (A) Particle size of PCNP, PCNP-TQ, PCNP-LAA and PCNP-TQ-LAA, with t-test conducted to see the significance of particle size changes between samples. The confidence level was set to 95% and the results are labelled as a to f. (a) Significant ** with a p-value of 0.0022, (b) significant ** with a p-value of 0.0012, (c) significant *** with a p-value of 0.0005, (d) not significant with a p-value of 0.5320, (e) significant ** with a p-value of 0.0051, and (f) significant ** with a p-value of 0.0065. (B) Polydispersity index and significance test (t-test) of PCNP, PCNP-TQ, PCNP-LAA and PCNP-TQ-LAA. (a) Not significant with a p-value of 0.2168, (b) not significant with a p-value of 0.2129, (c) not significant with a p-value of 0.3279, (d) not significant with a p-value of 0.7820, (e) not significant with a p-value of 0.5437, and (f) not significant with a p-value of 0.4818. (C) Zeta potential and significance test (t-test) of PCNP, PCNP-TQ, PCNP-LAA and PCNP-TQ-LAA. The differences between all samples were insignificant with (a–f) p-values of 0.1649, 0.3161, 0.1851, 0.4284, 0.9146 and 0.4936, respectively.
Processes 08 01040 g006
Figure 7. Field-emission scanning electron microscopy (FESEM) images (column A), normal distribution of particles based on FESEM images (column B) and high-resolution transmission electron microscopy (HRTEM) images (column C) of PCNP, PCNP-TQ, PCNP-LAA and PCNP-TQ-LAA samples (from top to bottom row). Particle sizes increased as the encapsulated number of antioxidant increased (from empty PCNP to PCNP-TQ-LAA).
Processes 08 01040 g007
Figure 8. The percentage encapsulation of TQ in PCNP-TQ, TQ in PCNP-TQ-LAA, LAA in PCNP-LAA, and LAA in PCNP-TQ-LAA. A t-test was conducted to see the significance of the percentage encapsulation changes between samples. The confidence level was set to 95% and the results are labelled as a to f. (a) Significant ** with a p-value of 0.0097, (b) significant *** with a p-value of 0.0005, (c) significant **** with p-value of <0.0001, (d) not significant with a p-value of 0.0762, (e) significant ** with a p-value of 0.0080, and (f) significant ** with p-value of 0.0031.
Processes 08 01040 g008
Figure 9. Release kinetics summary of TQ and LAA from all samples. (A) Release of TQ from PCNP-TQ, (B) release of TQ from PCNP-TQ-LAA, (C) release of LAA from PCNP-TQ-LAA and (D) release of LAA from PCNP-TQ-LAA. (A,B,D) follow zero-order release kinetics, while (C) follows the Higuchi release kinetic.
Processes 08 01040 g009
Table 1. Percentage of free amine and significancy test (t-test) between chitosan nanoparticles (CNP) and PCNP at different sodium tripolyphosphate (TPP) volume. (a) significant **** with a p value of <0.0001, (b) significant *** with a p value of 0.0004, (c) significant **** with a p value of <0.0001, (d) significant **** with a p value of <0.0001, (e) significant **** with a p value of <0.0001, (f) significant *** with a p value of 0.0004, and (g) significant *** with a p value of 0.0004.
LabelVolume of TPP (µL)Percentage of Free Amine (%)t-Test
CNPStandard DeviationPCNPStandard Deviationp-ValueSignificance between CNP and PCNP Reading at Different TPP Volume
a0100.00084.760.77<0.0001****
b5097.411.1577.112.930.0004***
c10094.050.9474.040.79<0.0001****
d15093.471.5971.611.78<0.0001****
e20092.542.1664.722.14<0.0001****
f25084.872.8162.992.180.0004***
g30092.384.7058.172.430.0004***
Table 2. Percent transmittance of functional groups existed in PCNP, PCNP-TQ, PCNP-LAA and PCNP-TQ-LAA.
PeakFunctional GroupWavenumber (cm−1)Percent Transmittance (%)
PCNPPCNP-TQPCNP-LAAPCNP-TQ-LAA
aAlcohol OH (H bonded) and NH stretch (2° amine)33997.474.153.176.18
bAmine NH2 scissor (1° amine), carboxylic acid C=O (amide) and alkene C=C stretch164724.2020.2412.4621.96
cAmine NH2 scissor (1° amine)156326.91-10.8918.99
dCarboxylic acid NH (amide) bend1542-62.19--
eAlkane CH2 and CH3 deformation and carboxylic acid C-O-H bend141442.41-24.1436.45
fAlkane CH2 and CH3 deformation1379-56.40--
gAmine C-N and carboxylic acid C-O stretch, P=O stretch11063.199.018.527.02
hAlkene =C-H and =CH2 bend90312.7728.4226.8818.32
iAmine NH2 and N-H wagging (shifts on H-bonding)71864.7963.5277.4686.57
Table 3. Particle size, polydispersity index and zeta potential of all samples; PCNP, PCNP-TQ, PCNP-LAA and PCNP-TQ-LAA.
SampleParticle Size (nm)PDIZeta Potential (mV)
PCNP92.6 ± 8.60.277 ± 0.10322.35 ± 1.48
PCNP-TQ158.3 ± 13.90.374 ± 0.05219.45 ± 1.20
PCNP-LAA165.8 ± 12.90.392 ± 0.08720.60 ± 1.13
PCNP-TQ-LAA247.7 ± 24.00.348 ± 0.04319.60 ± 1.27
Table 4. The concentration of TQ and LAA loaded and encapsulated in PCNP samples.
CompoundLoaded Compound Concentration (µM)EE (%)Standard DeviationEncapsulated Compound Concentration (µM)
TQ in PCNP-TQ15041.30.662.0
TQ in PCNP-TQ-LAA64.95.397.3
LAA in PCNP-LAA16073.02.6116.8
LAA in PCNP-TQ-LAA90.00.0143.9
Table 5. Release percentage and concentration of thymoquinone (TQ) and l-ascorbic acid (LAA) from PCNP samples.
LabelRelease ofReleased
Percentage (%)Concentration (µM)Total Time (h)
ATQ from PCNP-TQ60.637.643.9
BTQ from PCNP-TQ-LAA97.594.943.9
CLAA from PCNP-LAA17.019.833.7
DLAA from PCNP-TQ-LAA36.152.033.7

