Comparison of Different Extraction Methods for the Recovery of Olive Leaves Polyphenols

 ,
,  ,
,  ,
, 
Abstract
1. Introduction
2. Materials and Methods
2.1. Chemicals
2.2. Plant Material
2.3. Extraction Conditions
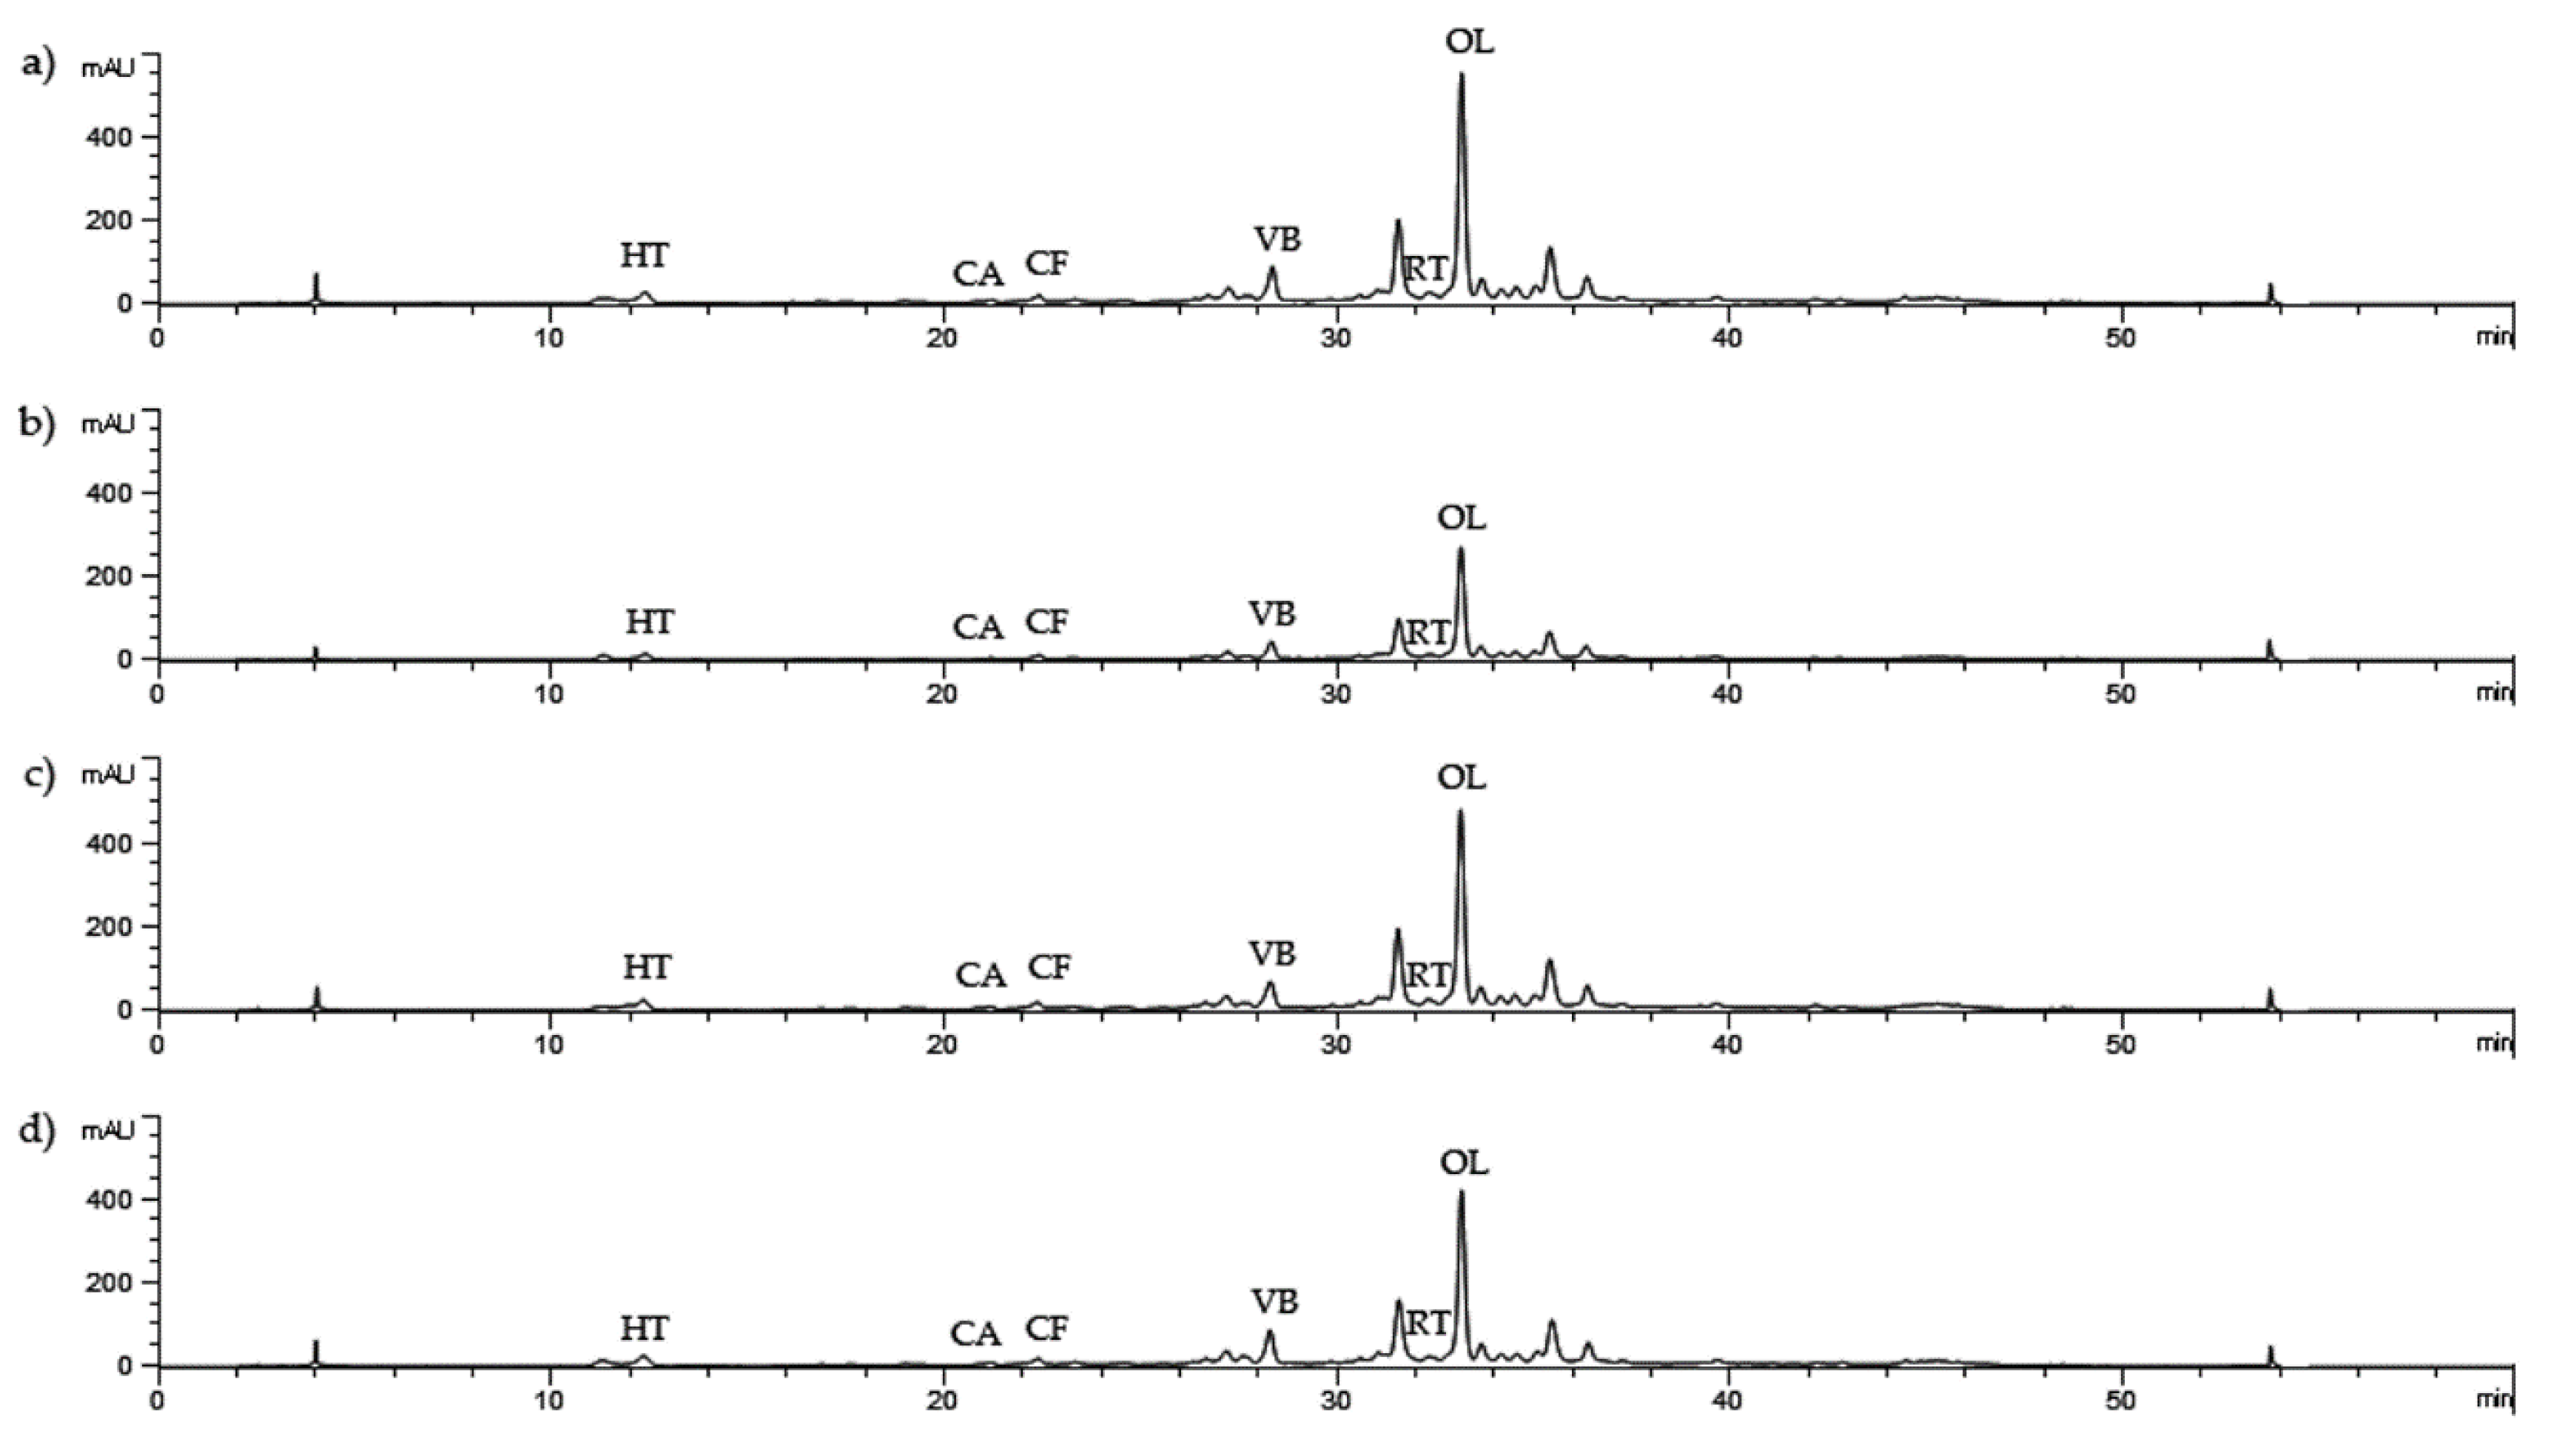
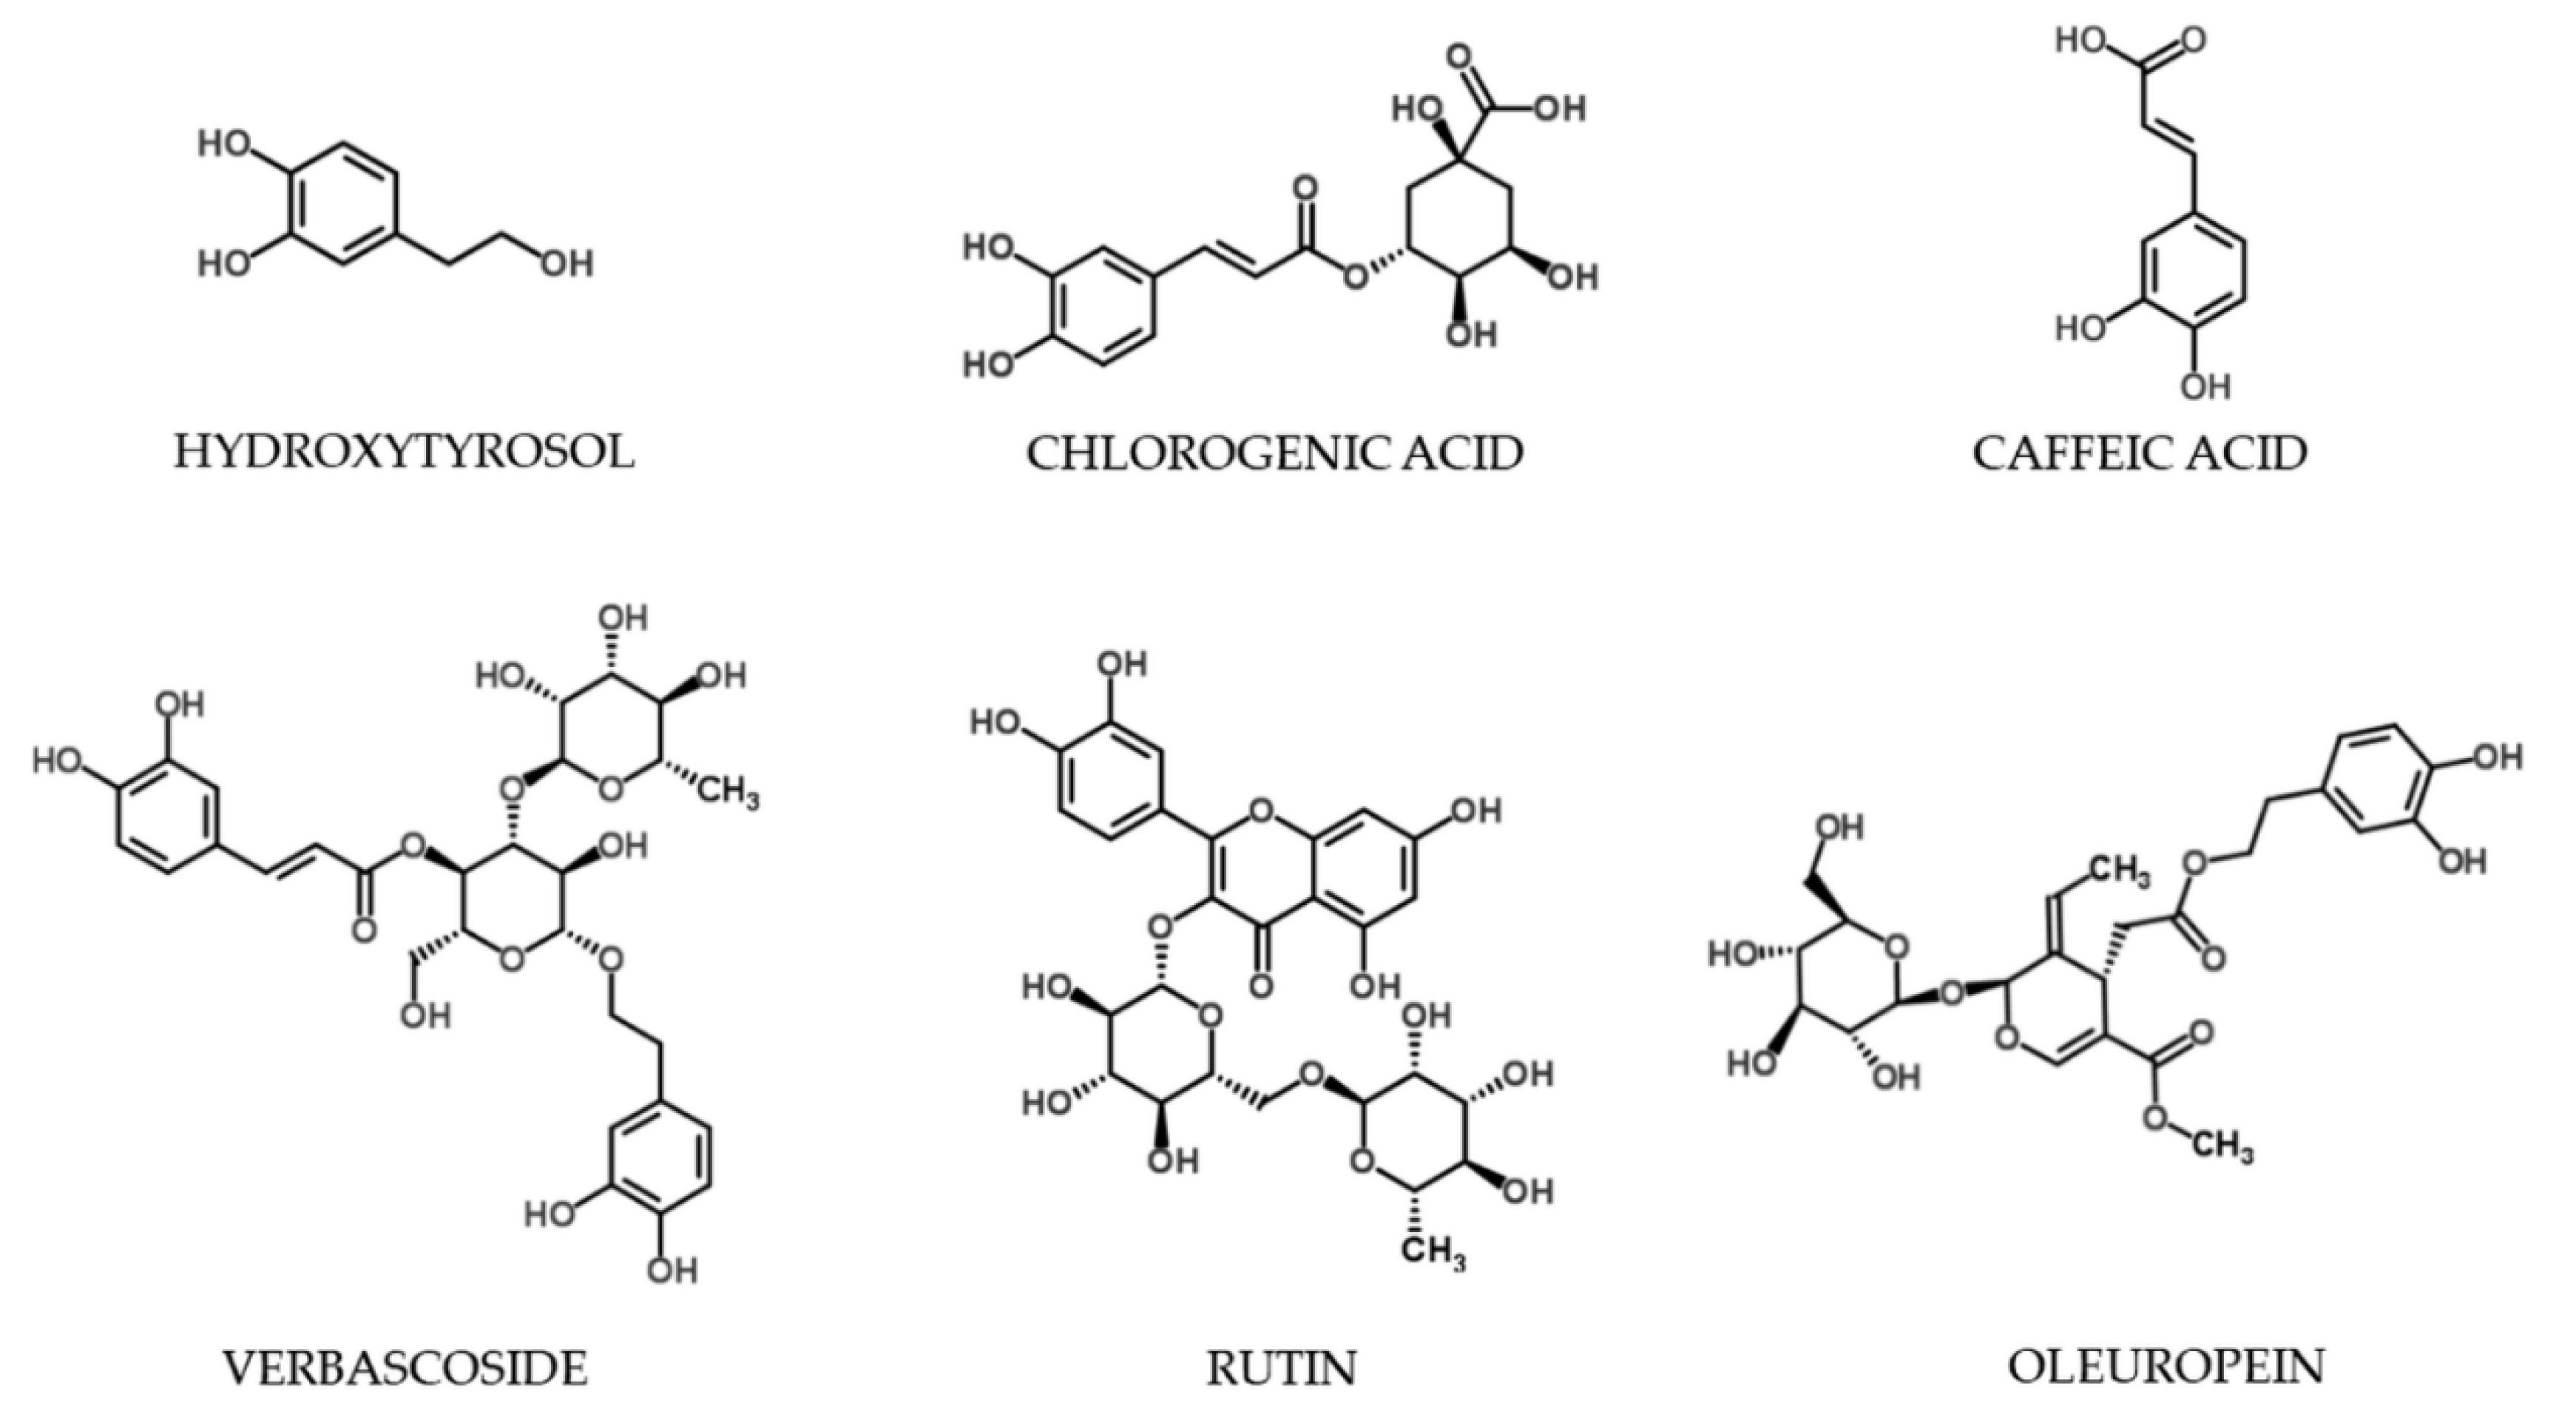
2.4. HPLC Analysis
2.5. Statistical Analysis
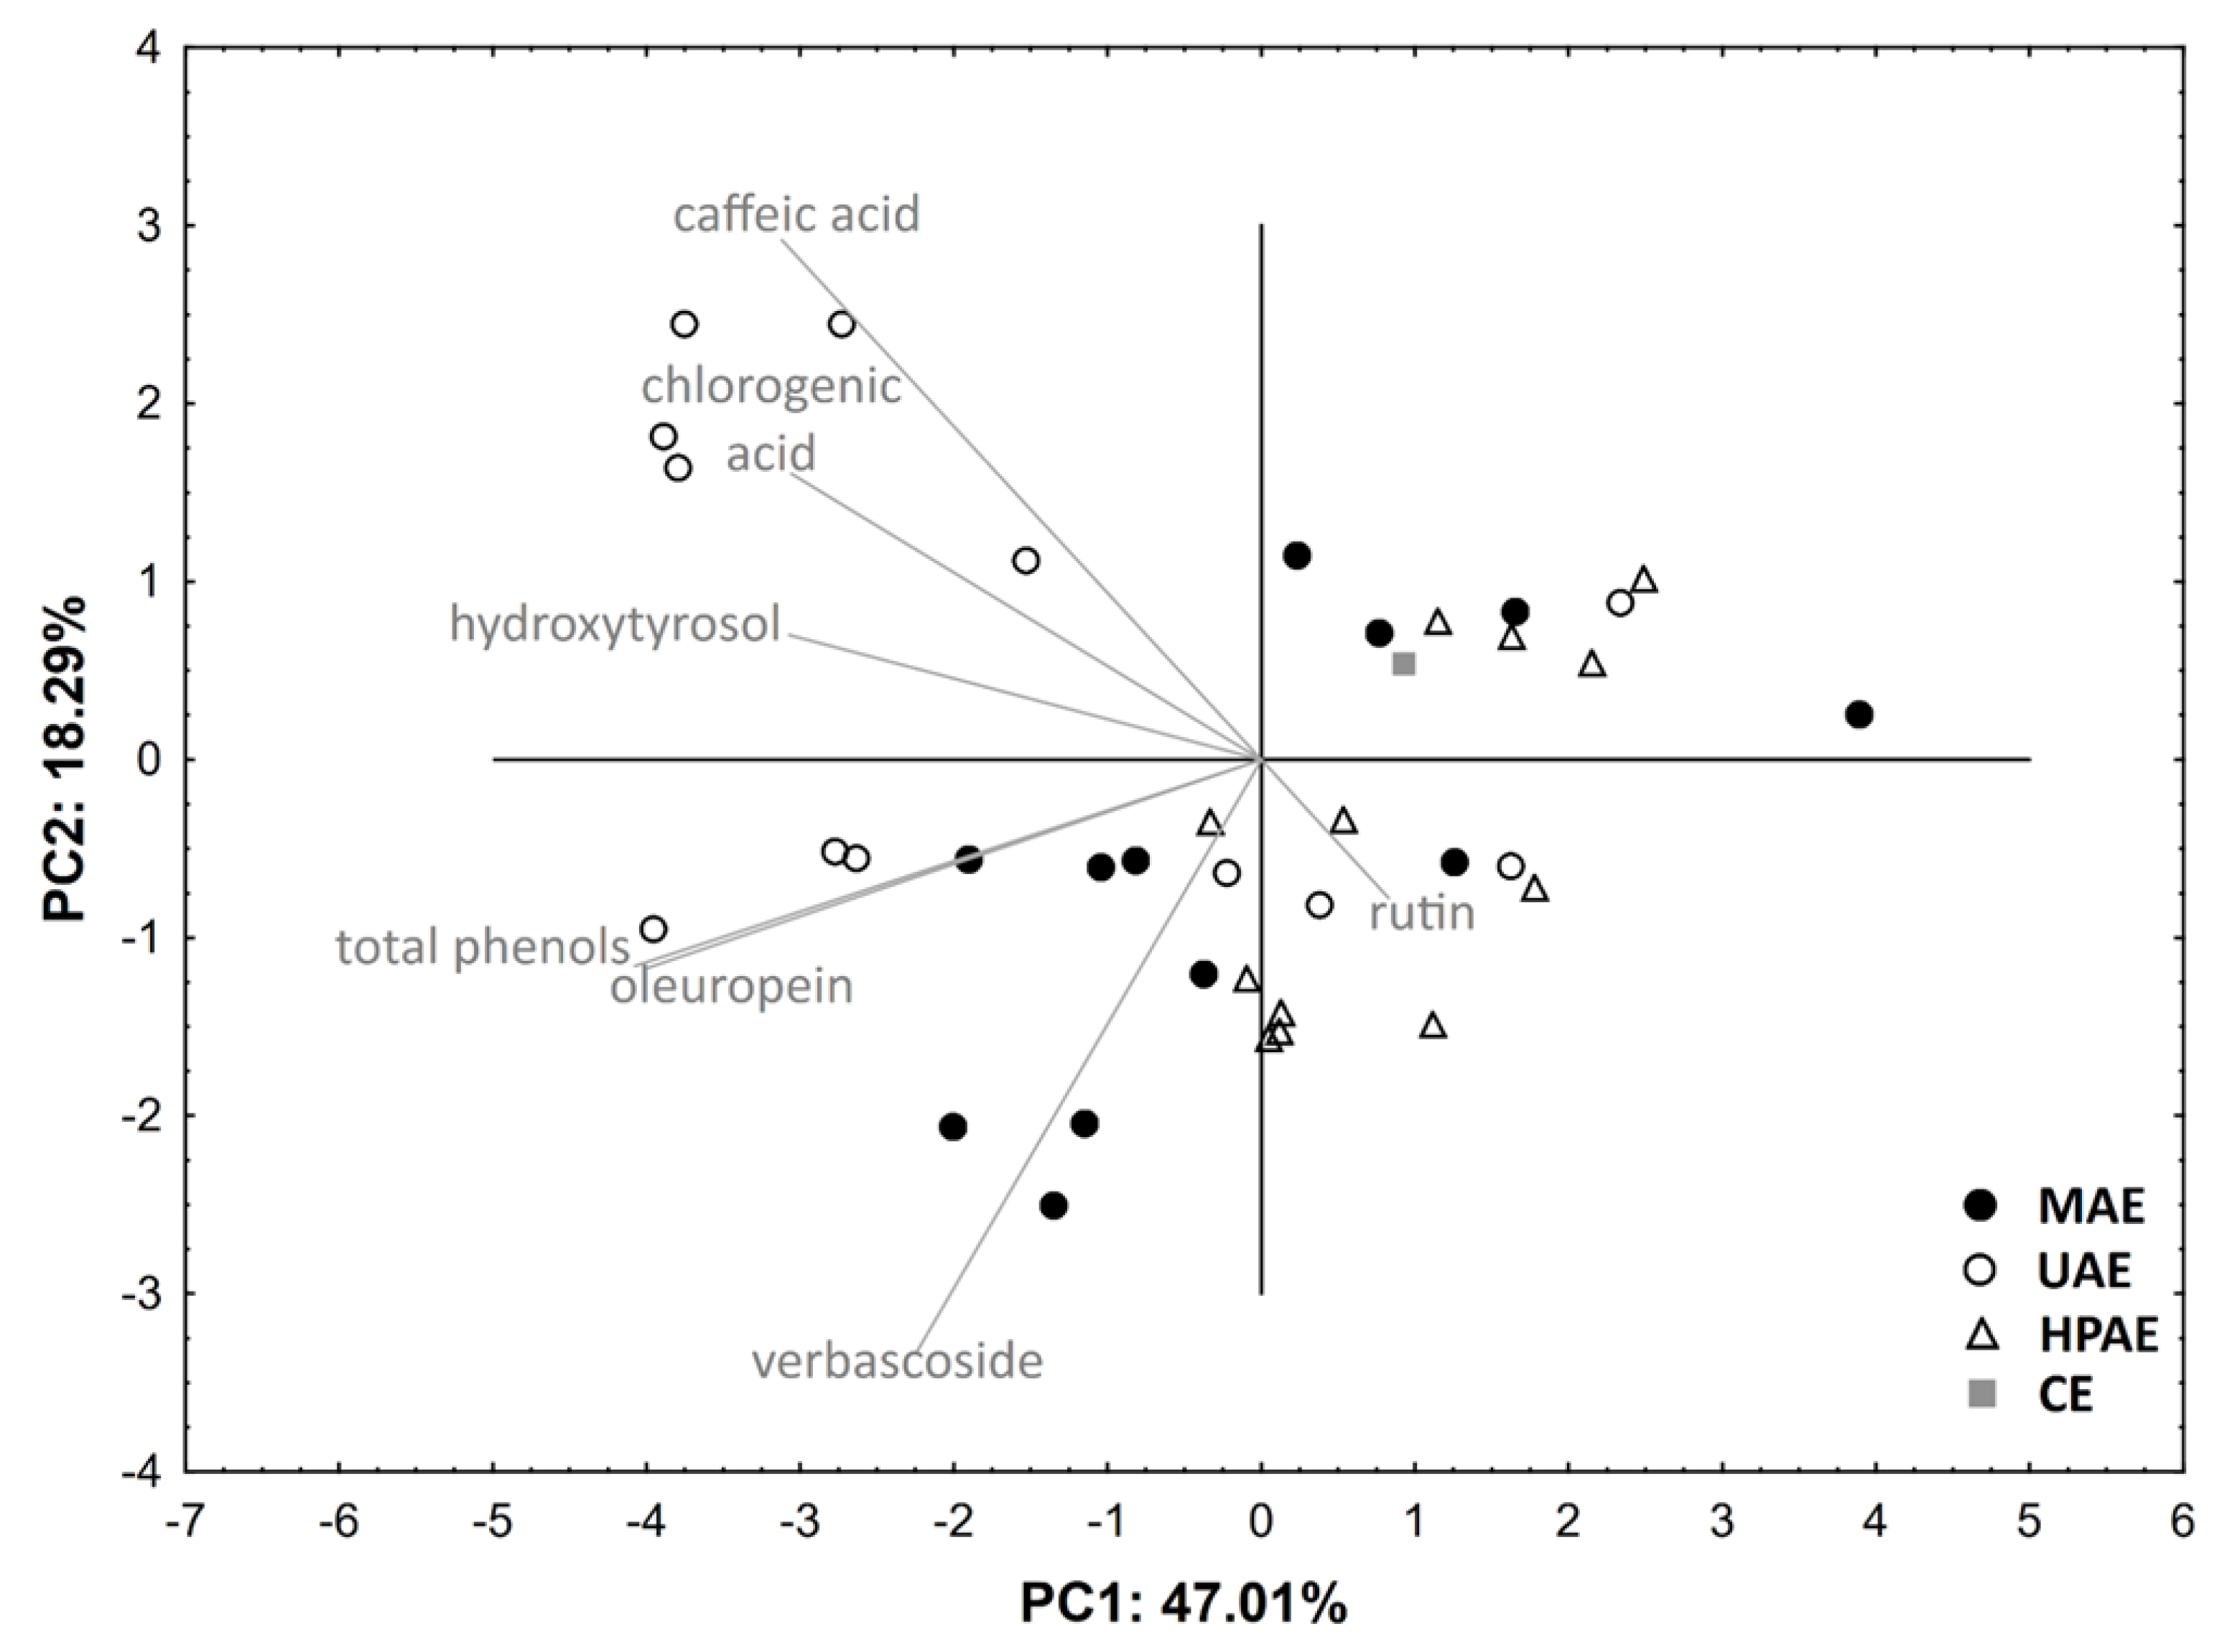
3. Results and Discussion
3.1. Microwave-Assisted Extraction (MAE)
3.2. Ultrasound-Assisted Extraction (UAE)
3.3. High Pressure-Assisted Extraction (HPAE)
3.4. Mutual Comparison of Advanced Extraction Techniques and with Conventional Heat-Reflux
4. Conclusions
Author Contributions
Funding
Conflicts of Interest
References
- Sahin, S.; Şamli, R. Optimization of olive leaf extract obtained by ultrasound-assisted extraction with response surface methodology. Ultrason. Sonochem. 2013, 20, 595–602. [Google Scholar] [CrossRef] [PubMed]
- Ben, S.M.; Abdelmelek, H. Study of phenolic composition and biological activities assessment of olive leaves from different varieties grown in Tunisia. Med. Chem. 2012, 2, 107–111. [Google Scholar] [CrossRef]
- Talhaoui, N.; Gómez-Caravaca, A.M.; León, L.; De la Rosa, R.; Segura-Carretero, A.; Fernández-Gutiérrez, A. Determination of phenolic compounds of “Sikitita” olive leaves by HPLC-DAD-TOF-MS. Comparison with its parents “Arbequina” and “Picual” olive leaves. LWT Food Sci. Technol. 2014, 58, 28–34. [Google Scholar] [CrossRef]
- Taamalli, A.; Arráez-Román, D.; Ibañez, E.; Zarrouk, M.; Segura-Carretero, A.; Fernández-Gutiérrez, A. Optimization of microwave-assisted extraction for the characterization of olive leaf phenolic compounds by using HPLC-ESI-TOF-MS/IT-MS2. J. Agric. Food Chem. 2012, 60, 791–798. [Google Scholar] [CrossRef] [PubMed]
- Mkaouar, S.; Gelicus, A.; Bahloul, N.; Allaf, K.; Kechaou, N. Kinetic study of polyphenols extraction from olive (Olea europaea L.) leaves using instant controlled pressure drop texturing. Sep. Purif. Technol. 2016, 161, 165–171. [Google Scholar] [CrossRef]
- Quirantes-Piné, R.; Lozano-Sánchez, J.; Herrero, M.; Ibáñez, E.; Segura-Carretero, A.; Fernández-Gutiérrez, A. HPLC-ESI-QTOF-MS as a powerful analytical tool for characterising phenolic compounds in olive-leaf extracts. Phytochem. Anal. 2013, 24, 213–223. [Google Scholar] [CrossRef]
- Bouaziz, M.; Sayadi, S. Isolation and evaluation of antioxidants from leaves of a Tunisian cultivar olive tree. Eur. J. Lipid Sci. Technol. 2005, 107, 497–504. [Google Scholar] [CrossRef]
- Mitsopoulos, G.; Hagidimitriou, M.; Papageorgiou, V.; Komaitis, M. Total phenolic content, phenolic profile and antioxidant activity in leaves and drupes of Greek olive cultivars. Acta Hortic. 2011, 924, 425–430. [Google Scholar] [CrossRef]
- Huang, H.W.; Hsu, C.P.; Yang, B.B.; Wang, C.Y. Advances in the extraction of natural ingredients by high pressure extraction technology. Trends Food Sci. Technol. 2013, 33, 54–62. [Google Scholar] [CrossRef]
- Veggi, P.C.; Martinez, J.; Meireles, M.A.A. Fundamentals of Microwave Extraction. In Microwave-Assisted Extraction for Bioactive Compounds: Theory and Practice; Chemat, F., Cravotto, G., Eds.; Springer Science + Business Media: New York, NY, USA, 2013; ISBN 978-1-4614-4829-7. [Google Scholar]
- Hossain, M.; Brunton, N.; Patras, A.; Tiwari, B.; O’Donnell, C.; Martin-Diana, A.B.; Barry-Ryan, C. Optimization of ultrasound assisted extraction of antioxidant compounds from marjoram (Origanum majorana L.) using response surface methodology. Ultrason. Sonochem. 2012, 19, 582–590. [Google Scholar] [CrossRef]
- Xi, J.; Shen, D.; Zhao, S.; Lu, B.; Li, Y.; Zhang, R. Characterization of polyphenols from green tea leaves using a high hydrostatic pressure extraction. Int. J. Pharm. 2009, 382, 139–143. [Google Scholar] [CrossRef] [PubMed]
- Ahmad-Qasem, M.H.; Cánovas, J.; Barrajón-Catalán, E.; Micol, V.; Cárcel, J.A.; García-Pérez, J.V. Kinetic and compositional study of phenolic extraction from olive leaves (var. Serrana) by using power ultrasound. Innov. Food Sci. Emerg. Technol. 2013, 17, 120–129. [Google Scholar] [CrossRef]
- Hannachi, H.; Benmoussa, H.; Saadaoui, E.; Saanoun, I.; Negri, N.; Elfalleh, W. Optimization of ultrasound and microwave-assisted extraction of phenolic compounds from olive leaves by response surface methodology. Res. J. Biotechnol. 2019, 14, 28–37. [Google Scholar]
- Rafiee, Z.; Jafari, S.M.; Alami, M.; Khomeiri, M. Microwave-Assisted extraction of phenolic compounds from olive leaves, A comparison with maceration. J. Anim. Plant Sci. 2011, 21, 738–745. [Google Scholar]
- Spigno, G.; De Faveri, D.M. Microwave-Assisted extraction of tea phenols: A phenomenological study. J. Food Eng. 2009, 93, 210–217. [Google Scholar] [CrossRef]
- Buzrul, S.; Alpas, H.; Largeteau, A.; Bozoglu, F.; Demazeau, G. Compression heating of selected pressure transmitting fluids and liquid foods during high hydrostatic pressure treatment. J. Food Eng. 2008, 85, 466–472. [Google Scholar] [CrossRef]
- Richard, N.; Arnold, S.; Hoeller, U.; Kilpert, C.; Wertz, K.; Schwager, J. Hydroxytyrosol is the major anti-inflammatory compound in aqueous olive extracts and impairs cytokine and chemokine production in macrophages. Planta Med. 2011, 77, 1890–1897. [Google Scholar] [CrossRef]
- Damtoft, S.; Franzyk, H.; Jensen, S.R. Biosynthesis of secoiridoid glucosides in Oleaceae. Phytochemistry 1993, 34, 1291–1299. [Google Scholar] [CrossRef]
- Visioli, F.; Galli, C. The effect of minor constituents of olive oil on cardiovascular disease: New findings. Nutr. Rev. 1998, 56, 142–147. [Google Scholar] [CrossRef]
- Le Tutour, B.; Guedon, D. Antioxidative activities of Olea europaea leaves and related phenolic compounds. Phytochemistry 1992, 31, 1173–1178. [Google Scholar] [CrossRef]
- Benavente-Garcıa, O.; Castillo, J.; Lorente, J.; Ortuño, A.D.R.J.; Del Rio, J.A. Antioxidant activity of phenolics extracted from Olea europaea L. leaves. Food Chem. 2000, 68, 457–462. [Google Scholar] [CrossRef]
- Dekanski, D.; Janicijevic-Hudomal, S.; Tadic, V.; Markovic, G.; Arsic, I.; Mitrovic, D. Phytochemical analysis and gastroprotective activity of an olive leaf extract. J. Serb. Chem. Soc. 2009, 74, 367–377. [Google Scholar] [CrossRef]
- Japón-Luján, R.; Luque-Rodríguez, J.M.; De Castro, M.D.L. Multivariate optimisation of the microwave-assisted extraction of oleuropein and related biophenols from olive leaves. Anal. Bioanal. Chem. 2006, 385, 753–759. [Google Scholar] [CrossRef] [PubMed]
- Mandal, V.; Mohan, Y.; Hemalatha, S. Microwave assisted extraction—An innovative and promising extraction tool for medicinal plant research. Pharmacogn. Rev. 2007, 1, 7–18. [Google Scholar]
- Murakami, M.; Yamaguchi, T.; Takamura, H.; Atoba, T.M. Effects of thermal treatment on radical-scavenging activity of single and mixed polyphenolic compounds. J. Food Sci. 2004, 69, FCT7–FCT10. [Google Scholar] [CrossRef]
- Ioannou, I.; Ghoul, M. Biological activities and effects of food processing on flavonoids as phenolics antioxidants. Adv. Appl. Biotechnol. 2012, 101–124. [Google Scholar] [CrossRef]
- Pacheco-Palencia, L.A.; Mertens-Talcott, S.; Talcott, S.T. Chemical composition, antioxidant properties, and thermal stability of a phytochemical enriched oil from Açai (Euterpe oleracea Mart.). J. Agric. Food Chem. 2008, 56, 4631–4636. [Google Scholar] [CrossRef]
- Chimsook, T.; Wannalangka, W. Effect of ultrasonic-assisted extraction on phenolic content of freshwater macroalgae in northern Thailand. In Proceedings of the MATEC Web of Conferences, Lisbon, Portugal, 23–25 November 2015; Volume 35, p. 04002. [Google Scholar] [CrossRef]
- Elez, G.I.; Zorić, Z.; Pedisić, S.; Brnčić, M.; Dragović-Uzelac, V. UPLC-MS2 profiling of blackthorn flower polyphenols isolated by ultrasound-assisted extraction. J. Food Sci. 2018, 83, 2782–2789. [Google Scholar] [CrossRef]
- Dent, M.; Dragovic-Uzelac, V.; Garofulic, I.E.; Bosiljkov, T.; Ježek, D.; Brncic, M. Comparison of conventional and ultrasound-assisted extraction techniques on mass fraction of phenolic compounds from sage (Salvia officinalis L.). Chem. Biochem. Eng. Q. 2015, 29, 475–484. [Google Scholar] [CrossRef]
- Vu, H.T.; Scarlett, C.J.; Vuong, Q.V. Optimization of ultrasound-assisted extraction conditions for recovery of phenolic compounds and antioxidant capacity from banana (Musa cavendish) peel. J. Food Process. Preserv. 2016, 2016, e13148. [Google Scholar] [CrossRef]
- Chen, R.; Meng, F.; Zhang, S.; Liu, Z. Effects of ultrahigh pressure extraction conditions on yields and antioxidant activity of ginsenoside from ginseng. Sep. Purif. Technol. 2009, 66, 340–346. [Google Scholar] [CrossRef]
- Butz, P.; Koller, W.D.; Tauscher, B.; Wolf, S. Ultra-High pressure processing of onions: Chemical and sensory changes. LWT Food Sci. Technol. 1994, 27, 463–467. [Google Scholar] [CrossRef]
- Prasad, K.N.; Yang, B.; Zhao, M.; Wei, X.; Jiang, Y.; Chen, F. High pressure extraction of corilagin from longan (Dimocarpus longan Lour.) fruit pericarp. Sep. Purif. Technol. 2009, 70, 41–45. [Google Scholar] [CrossRef]
- Corrales, M.; García, A.F.; Butz, P.; Tauscher, B. Extraction of anthocyanins from grape skins assisted by high hydrostatic pressure. J. Food Eng. 2009, 90, 415–421. [Google Scholar] [CrossRef]
- Shouqin, Z.; Junjie, Z.; Changzhen, W. Novel high pressure extraction technology. Int. J. Pharm. 2004, 278, 471–474. [Google Scholar] [CrossRef] [PubMed]
- Afaneh, I.; Yateem, H.; Al-Rimawi, F. Effect of Olive Leaves Drying on the Content of Oleuropein. Am. J. Anal. Chem. 2015, 6, 246–252. [Google Scholar] [CrossRef]
- Briante, R.; La Cara, F.; Febbraio, F.; Barone, R.; Piccialli, G.; Carolla, R.; Mainolfi, P.; De Napoli, L.; Patumi, M.; Fontanazza, G.; et al. Hydrolysis of oleuropein by recombinant b-glycosidase from hyperthermophilic archaeon. J. Biotechnol. 2000, 77, 275–286. [Google Scholar] [CrossRef]
- Xie, P.; Huang, L.; Zhang, C.; Deng, Y.; Wang, X.; Cheng, J. Enhanced extraction of hydroxytyrosol, maslinic acid and oleanolic acid from olive pomace: Process parameters, kinetics and thermodynamics, and greenness assessment. Food Chem. 2019, 276, 662–674. [Google Scholar] [CrossRef]


| Extraction Technique | Extraction Parameters | OL | HT | CA | CF | VB | RT | Total Sum | ||
|---|---|---|---|---|---|---|---|---|---|---|
| MAE | Time (min) | Temperature (°C) | Mass (g) | |||||||
| 2 | 45 | 1.5 | 74.11 ± 0.00 | 1.10 ± 0.42 | 0.44 ± 0.00 | 0.26 ± 0.00 | 0.50 ± 0.00 | 2.57 ± 0.00 | 78.98 ± 0.42 | |
| 2 | 45 | 3.0 | 69.51 ± 0.43 | 0.83 ± 0.00 | 0.45 ± 0.01 | 0.28 ± 0.00 | 0.35 ± 0.01 | 2.23 ± 0.01 | 73.65 ± 0.43 | |
| 2 | 80 | 1.5 | 83.41 ± 0.06 | 0.86 ± 0.00 | 0.42 ± 0.00 | 0.24 ± 0.01 | 0.55 ± 0.01 | 2.70 ± 0.02 | 88.19 ± 0.09 | |
| 2 | 80 | 3.0 | 87.75 ± 0.11 | 0.95 ± 0.03 | 0.46 ± 0.01 | 0.32 ± 0.01 | 0.41 ± 0.00 | 2.30 ± 0.01 | 92.18 ± 0.11 | |
| 8.5 | 45 | 1.5 | 52.14 ± 0.04 | 0.61 ± 0.01 | 0.44 ± 0.00 | 0.20 ± 0.00 | 0.31 ± 0.00 | 8.68 ± 0.06 | 62.38 ± 0.02 | |
| 8.5 | 45 | 3.0 | 65.93 ± 0.10 | 0.80 ± 0.01 | 0.41 ± 0.00 | 0.26 ± 0.01 | 0.33 ± 0.00 | 2.15 ± 0.07 | 69.89 ± 0.20 | |
| 8.5 | 80 | 1.5 | 84.82 ± 0.21 | 0.94 ± 0.00 | 0.45 ± 0.00 | 0.29 ± 0.01 | 0.55 ± 0.00 | 2.43 ± 0.01 | 89.49 ± 0.24 | |
| 8.5 | 80 | 3.0 | 82.44 ± 0.57 | 0.93 ± 0.03 | 0.41 ± 0.02 | 0.29 ± 0.00 | 0.40 ± 0.00 | 2.14 ± 0.27 | 86.61 ± 0.89 | |
| 15 | 45 | 1.5 | 64.03 ± 0.05 | 0.82 ± 0.01 | 0.44 ± 0.01 | 0.24 ± 0.01 | 0.47 ± 0.00 | 2.76 ± 0.01 | 68.75 ± 0.05 | |
| 15 | 45 | 3.0 | 70.88 ± 0.05 | 0.87 ± 0.01 | 0.48 ± 0.03 | 0.33 ± 0.04 | 0.34 ± 0.00 | 2.46 ± 0.00 | 75.36 ± 0.12 | |
| 15 | 80 | 1.5 | 80.66 ± 0.25 | 0.92 ± 0.00 | 0.43 ± 0.03 | 0.26 ± 0.01 | 0.54 ± 0.00 | 2.42 ± 0.03 | 85.23 ± 0.25 | |
| 15 | 80 | 3.0 | 82.01 ± 0.18 | 0.82 ± 0.17 | 0.44 ± 0.00 | 0.30 ± 0.01 | 0.42 ± 0.04 | 2.42 ± 0.00 | 86.41 ± 0.04 | |
| UAE | Time (min) | Amplitude (%) | Mass (g) | |||||||
| 7 | 50 | 1.5 | 79.28 ± 0.26 | 3.10 ± 1.11 | 0.46 ± 0.00 | 0.33 ± 0.00 | 0.50 ± 0.00 | 2.54 ± 0.01 | 86.20 ± 0.86 | |
| 7 | 50 | 3.0 | 76.42 ± 0.05 | 2.11 ± 0.00 | 0.53 ± 0.04 | 0.55 ± 0.04 | 0.39 ± 0.01 | 2.09 ± 0.04 | 82.07 ± 0.06 | |
| 7 | 100 | 1.5 | 67.30 ± 0.28 | 1.96 ± 0.21 | 0.37 ± 0.01 | 0.27 ± 0.01 | 0.49 ± 0.01 | 2.17 ± 0.00 | 72.54 ± 0.08 | |
| 7 | 100 | 3.0 | 84.62 ± 0.61 | 1.69 ± 0.04 | 0.59 ± 0.09 | 0.51 ± 0.16 | 0.42 ± 0.00 | 2.06 ± 0.04 | 89.88 ± 0.86 | |
| 14 | 50 | 1.5 | 60.33 ± 0.52 | 1.83 ± 0.06 | 0.35 ± 0.01 | 0.24 ± 0.01 | 0.47 ± 0.00 | 2.04 ± 0.00 | 65.24 ± 0.58 | |
| 14 | 50 | 3.0 | 56.84 ± 0.08 | 1.44 ± 0.01 | 0.39 ± 0.01 | 0.25 ± 0.01 | 0.37 ± 0.01 | 1.81 ± 0.00 | 61.09 ± 0.04 | |
| 14 | 100 | 1.5 | 66.01 ± 0.66 | 2.21 ± 0.02 | 0.42 ± 0.00 | 0.29 ± 0.01 | 0.52 ± 0.00 | 2.37 ± 0.01 | 71.81 ± 0.63 | |
| 14 | 100 | 3.0 | 81.38 ± 0.23 | 2.59 ± 0.02 | 0.53 ± 0.00 | 0.55 ± 0.00 | 0.44 ± 0.01 | 2.22 ± 0.02 | 87.69 ± 0.28 | |
| 21 | 50 | 1.5 | 85.90 ± 0.04 | 2.61 ± 0.01 | 0.50 ± 0.01 | 0.39 ± 0.01 | 0.56 ± 0.01 | 2.54 ± 0.01 | 92.49 ± 0.04 | |
| 21 | 50 | 3.0 | 74.35 ± 0.77 | 2.32 ± 0.04 | 0.48 ± 0.00 | 0.37 ± 0.01 | 0.39 ± 0.00 | 2.00 ± 0.00 | 79.90 ± 0.82 | |
| 21 | 100 | 1.5 | 77.91 ± 0.23 | 2.52 ± 0.02 | 0.48 ± 0.01 | 0.37 ± 0.01 | 0.54 ± 0.01 | 2.43 ± 0.03 | 84.23 ± 0.23 | |
| 21 | 100 | 3.0 | 80.91 ± 0.92 | 1.95 ± 0.00 | 0.54 ± 0.08 | 0.63 ± 0.00 | 0.42 ± 0.00 | 2.11 ± 0.02 | 86.55 ± 1.02 | |
| HPAE | Time (min) | Pressure (MPa) | Mass (g) | |||||||
| 1 | 300 | 1.5 | 69.76 ± 0.42 | 1.58 ± 1.03 | 0.48 ± 0.01 | 0.27 ± 0.00 | 0.47 ± 0.00 | 2.80 ± 0.06 | 75.35 ± 0.55 | |
| 1 | 300 | 3.0 | 67.76 ± 0.49 | 0.82 ± 0.00 | 0.39 ± 0.01 | 0.22 ± 0.01 | 0.50 ± 0.00 | 2.51 ± 0.06 | 72.19 ± 0.44 | |
| 1 | 500 | 1.5 | 72.19 ± 0.18 | 0.85 ± 0.00 | 0.43 ± 0.01 | 0.25 ± 0.01 | 0.51 ± 0.00 | 2.61 ± 0.05 | 76.82 ± 0.14 | |
| 1 | 500 | 3.0 | 72.26 ± 0.33 | 0.85 ± 0.01 | 0.42 ± 0.01 | 0.25 ± 0.01 | 0.52 ± 0.00 | 2.51 ± 0.01 | 76.80 ± 0.32 | |
| 5.5 | 300 | 1.5 | 73.00 ± 0.83 | 0.85 ± 0.00 | 0.45 ± 0.00 | 0.25 ± 0.04 | 0.50 ± 0.00 | 2.60 ± 0.15 | 77.64 ± 1.02 | |
| 5.5 | 300 | 3.0 | 72.74 ± 0.25 | 0.86 ± 0.01 | 0.42 ± 0.03 | 0.25 ± 0.01 | 0.52 ± 0.00 | 2.54 ± 0.02 | 77.32 ± 0.30 | |
| 5.5 | 500 | 1.5 | 66.64 ± 1.20 | 0.79 ± 0.20 | 0.33 ± 0.16 | 0.35 ± 0.07 | 0.35 ± 0.00 | 2.14 ± 0.03 | 70.60 ± 1.51 | |
| 5.5 | 500 | 3.0 | 71.47 ± 0.21 | 0.85 ± 0.23 | 0.22 ± 0.04 | 0.32 ± 0.01 | 0.38 ± 0.00 | 2.27 ± 0.01 | 75.50 ± 0.45 | |
| 10 | 300 | 1.5 | 66.29 ± 0.49 | 0.95 ± 0.01 | 0.43 ± 0.01 | 0.30 ± 0.01 | 0.36 ± 0.00 | 2.26 ± 0.01 | 70.58 ± 0.50 | |
| 10 | 300 | 3.0 | 74.56 ± 1.98 | 1.04 ± 0.00 | 0.34 ± 0.13 | 0.30 ± 0.00 | 0.39 ± 0.01 | 2.25 ± 0.05 | 78.87 ± 2.05 | |
| 10 | 500 | 1.5 | 60.48 ± 0.95 | 0.77 ± 0.19 | 0.39 ± 0.00 | 0.26 ± 0.00 | 0.33 ± 0.01 | 2.04 ± 0.03 | 64.26 ± 0.73 | |
| 10 | 500 | 3.0 | 63.63 ± 0.18 | 0.65 ± 0.01 | 0.38 ± 0.01 | 0.26 ± 0.00 | 0.35 ± 0.00 | 1.93 ± 0.00 | 67.19 ± 0.20 | |
| Extraction Technique | Source of Variation | OL | HT | CA | CF | VB | RT | Total Sum |
|---|---|---|---|---|---|---|---|---|
| MAE | Time (min) | p < 0.01 * | p = 0.26 ns | p = 0.05 * | p = 0.03 * | p < 0.01 * | p < 0.01 * | p < 0.01 * |
| 2 | 78.69 ± 0.08 c | 0.93 ± 0.05 a | 0.44 ± 0.00 ab | 0.27 ± 0.00 ab | 0.45 ± 0.00 b | 2.45 ± 0.03 a | 83.25 ± 0.12 c | |
| 8.5 | 71.33 ± 0.08 a | 0.82 ± 0.05 a | 0.43 ± 0.00 a | 0.26 ± 0.00 a | 0.40 ± 0.00 a | 3.85 ± 0.03 b | 77.09 ± 0.12 a | |
| 15 | 74.40 ± 0.08 b | 0.86 ± 0.05 a | 0.45 ± 0.00 c | 0.28 ± 0.00 c | 0.44 ± 0.00 b | 2.51 ± 0.03 a | 78.94 ± 0.12 b | |
| Temperature (°C) | p < 0.01 * | p = 0.25 ns | p = 0.21 ns | p < 0.01 * | p < 0.01 * | p < 0.01 * | p < 0.01 * | |
| 45 | 66.10 ± 0.07 a | 66.10 ± 0.04 a | 0.44 ± 0.00 a | 0.26 ± 0.00 a | 0.38 ± 0.00 a | 3.47 ± 0.02 b | 71.50 ± 0.10 a | |
| 80 | 83.51 ± 0.07 b | 83.51 ± 0.04 a | 0.44 ± 0.00 a | 0.28 ± 0.00 b | 0.48 ± 0.00 b | 2.40 ± 0.02 a | 88.02 ± 0.10 b | |
| Mass (g) | p < 0.01 * | p = 0.89 ns | p = 0.53 ns | p < 0.01 * | p < 0.01 * | p < 0.01 * | p < 0.01 * | |
| 1.5 | 73.19 ± 0.07 a | 0.88 ± 0.04 a | 0.44 ± 0.00 a | 0.25 ± 0.00 a | 0.49 ± 0.00 b | 3.59 ± 0.02 b | 78.83 ± 0.10 a | |
| 3.0 | 76.42 ± 0.07 b | 0.87 ± 0.04 a | 0.44 ± 0.00 a | 0.30 ± 0.00 b | 0.37 ± 0.00 a | 2.28 ± 0.02 a | 80.68 ± 0.10 b | |
| UAE | Time (min) | p < 0.01 * | p = 0.16 ns | p < 0.01 * | p < 0.01 * | p < 0.01 * | p < 0.01 * | p < 0.01 * |
| 7 | 76.90 ± 0.17 b | 2.21 ± 0.12 a | 0.48 ± 0.01 b | 0.41 ± 0.02 b | 0.45 ± 0.00 a | 2.21 ± 0.01 b | 82.67 ± 0.21 b | |
| 14 | 66.14 ± 0.17 a | 2.01 ± 0.12 a | 0.42 ± 0.01 a | 0.33 ± 0.02 a | 0.45 ± 0.00 a | 2.11 ± 0.01 a | 71.46 ± 0.21 a | |
| 21 | 79.77 ± 0.17 c | 2.35 ± 0.12 a | 0.50 ± 0.01 b | 0.44 ± 0.02 b | 0.47 ± 0.00 b | 2.27 ± 0.01 c | 85.79 ± 0.21 c | |
| Amplitude (%) | p < 0.01 * | p = 0.55 ns | p = 0.03 * | p < 0.01 * | p < 0.01 * | p < 0.01 * | p < 0.01 * | |
| 50 | 72.18 ± 0.14 a | 2.23 ± 0.09 a | 0.45 ± 0.01 a | 0.35 ± 0.01 a | 0.45 ± 0.00 a | 2.17 ± 0.01 a | 77.83 ± 0.17 a | |
| 100 | 76.35 ± 0.14 b | 2.15 ± 0.09 a | 0.48 ± 0.01 b | 0.43 ± 0.01 b | 0.47 ± 0.00 b | 2.22 ± 0.01 b | 82.12 ± 0.17 b | |
| Mass (g) | p < 0.01 * | p = 0.02 * | p < 0.01 * | p < 0.01 * | p < 0.01 * | p < 0.01 * | p < 0.01 * | |
| 1.5 | 72.79 ± 0.14 a | 2.37 ± 0.09 b | 0.43 ± 0.01 a | 0.31 ± 0.01 a | 0.51 ± 0.00 b | 2.35 ± 0.01 b | 78.75 ± 0.17 a | |
| 3.0 | 75.75 ± 0.14 b | 2.02 ± 0.09 a | 0.51 ± 0.01 b | 0.47 ± 0.01 b | 0.40 ± 0.00 a | 2.05 ± 0.01 a | 81.20 ± 0.17 b | |
| HPAE | Time (min) | p < 0.01 * | p = 0.37 ns | p = 0.16 ns | p = 0.04 * | p < 0.01 * | p < 0.01 * | p < 0.01 * |
| 1 | 68.91 ± 0.29 b | 1.01 ± 0.11 a | 0.35 ± 0.02 a | 0.29 ± 0.01 c | 0.42 ± 0.00 a | 2.43 ± 0.02 b | 73.41 ± 0.31 b | |
| 5.5 | 71.32 ± 0.29 c | 0.92 ± 0.11 a | 0.40 ± 0.02 a | 0.27 ± 0.01 ab | 0.44 ± 0.00 b | 2.40 ± 0.02 b | 75.76 ± 0.31 c | |
| 10 | 67.46 ± 0.29 a | 0.78 ± 0.11 a | 0.41 ± 0.02 a | 0.25 ± 0.01 a | 0.42 ± 0.00 a | 2.27 ± 0.02 a | 71.60 ± 0.31 a | |
| Pressure (MPa) | p < 0.01 * | p = 0.37 ns | p = 0.04 * | p = 0.19 ns | p < 0.01 * | p = 0.01 * | p < 0.01 * | |
| 300 | 68.06 ± 0.23 a | 0.96 ± 0.09 a | 0.42 ± 0.02 b | 0.28 ± 0.01 a | 0.42 ± 0.00 a | 2.41 ± 0.02 b | 72.54 ± 0.25 a | |
| 500 | 70.40 ± 0.23 b | 0.84 ± 0.09 a | 0.36 ± 0.02 a | 0.26 ± 0.01 a | 0.44 ± 0.00 b | 2.33 ± 0.02 a | 74.64 ± 0.25 b | |
| Mass (g) | p < 0.01 * | p = 0.34 ns | p = 0.01 * | p < 0.01 * | p < 0.01 * | p < 0.01 * | p < 0.01 * | |
| 1.5 | 71.28 ± 0.23 b | 0.97 ± 0.09 a | 0.43 ± 0.02 b | 0.25 ± 0.01 a | 0.50 ± 0.00 b | 2.59 ± 0.02 b | 76.02 ± 0.25 b | |
| 3.0 | 67.18 ± 0.23 a | 0.84 ± 0.09 a | 0.35 ± 0.02 a | 0.30 ± 0.01 b | 0.36 ± 0.00 a | 2.15 ± 0.02 a | 71.16 ± 0.25 a | |
| 300 | 68.06 ± 0.23 a | 0.96 ± 0.09 a | 0.42 ± 0.02 b | 0.28 ± 0.01 a | 0.42 ± 0.00 a | 2.41 ± 0.02 b | 72.54 ± 0.25 a |
| Extraction Technique | OL | HT | CA | CF | VB | RT | Total Sum |
|---|---|---|---|---|---|---|---|
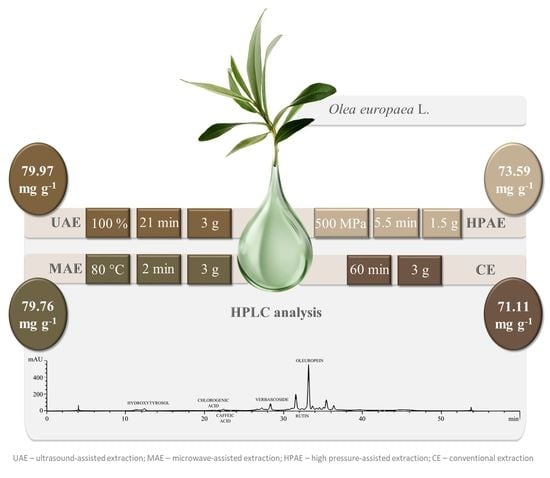
| MAE | 74.81 ± 2.12 | 0.87 ± 0.03 | 0.44 ± 0.00 | 0.27 ± 0.01 | 0.43 ± 0.02 | 2.94 ± 0.36 | 79.76 ± 1.92 |
| UAE | 74.27 ± 1.90 | 2.19 ± 0.10 | 0.47 ± 0.02 | 0.39 ± 0.03 | 0.46 ± 0.01 | 2.20 ± 0.05 | 79.97 ± 2.01 |
| HPAE | 69.23 ± 0.87 | 0.90 ± 0.07 | 0.39 ± 0.02 | 0.27 ± 0.01 | 0.43 ± 0.02 | 2.37 ± 0.05 | 73.59 ± 0.93 |
| CE | 67.05 ± 1.21 | 0.89 ± 0.07 | 0.41 ± 0.01 | 0.27 ± 0.01 | 0.47 ± 0.02 | 2.01 ± 0.06 | 71.11 ± 1.30 |
© 2020 by the authors. Licensee MDPI, Basel, Switzerland. This article is an open access article distributed under the terms and conditions of the Creative Commons Attribution (CC BY) license (http://creativecommons.org/licenses/by/4.0/).
Share and Cite
Dobrinčić, A.; Repajić, M.; Garofulić, I.E.; Tuđen, L.; Dragović-Uzelac, V.; Levaj, B. Comparison of Different Extraction Methods for the Recovery of Olive Leaves Polyphenols. Processes 2020, 8, 1008. https://doi.org/10.3390/pr8091008
Dobrinčić A, Repajić M, Garofulić IE, Tuđen L, Dragović-Uzelac V, Levaj B. Comparison of Different Extraction Methods for the Recovery of Olive Leaves Polyphenols. Processes. 2020; 8(9):1008. https://doi.org/10.3390/pr8091008
Chicago/Turabian StyleDobrinčić, Ana, Maja Repajić, Ivona Elez Garofulić, Lucija Tuđen, Verica Dragović-Uzelac, and Branka Levaj. 2020. "Comparison of Different Extraction Methods for the Recovery of Olive Leaves Polyphenols" Processes 8, no. 9: 1008. https://doi.org/10.3390/pr8091008
APA StyleDobrinčić, A., Repajić, M., Garofulić, I. E., Tuđen, L., Dragović-Uzelac, V., & Levaj, B. (2020). Comparison of Different Extraction Methods for the Recovery of Olive Leaves Polyphenols. Processes, 8(9), 1008. https://doi.org/10.3390/pr8091008