1. Introduction
Elaeocarpus serratus L. are an evergreen plant native to Sri Lanka and India, and have been widely planted in subtropical and tropical Asian regions, tropical Australia [
1,
2], and central and southern Taiwan [
3]. The fruit of
Elaeocarpus serratus L. is rich in carbohydrates, protein, vitamins, and polyphenolic compounds, boding high nutrients beneficial to human health [
2,
4]. Moreover, it is locally prescribed for the treatment of diarrhea and dysentery [
5]. The leaves of
Elaeocarpus serratus L. contain a significant amount of polyphenols and flavonoids, including myricitrin with pharmacological properties, and can be used to treat rheumatism and as an antidote to poison [
5].
Polyphenols and flavonoids have many biological activities and occur in plant materials. In
Elaeocarpus serratus L. leaves, some flavonoids are significantly present, including myricitrin, mearnsitrin, and mearnsetin [
6], among which myricitrin can play important role in human health. Myricitrin was reported to possess antioxidant activity with a stronger free radical scavenging activity than other flavonol rhamnosides or quercetin [
7]. Myricitrin has a number of potential benefits, such as antioxidant, anti-inflammatory, anti-mutagenic, and anti-nociceptive activities. The bioavailability of myricitrin in food occurs in the hydrolysis to release its aglycone in the small intestine [
8]. In animal models, myricitrin displayed an antipsychotic-like effects, antidepressant-like effect, and a significant hepatoprotective activity [
7,
9,
10]. Therefore, the extract of
Elaeocarpus serratus L. leaves can be considered an economic source of polyphenols, flavonoids, and myricitrin. Hence, an effective and sustainable method applied in the extraction of
Elaeocarpus serratus L. leaves would be useful.
Ultrasounds are regarded as a non-thermal green technology and have been applied in various fields to enhance either chemical reactions or unit operations, including food processing. Specifically, the mechanisms involved in the extraction process using ultrasounds are due to the cavitation effect (i.e., fragmentation, destruction, erosion, capillary action, local shear stress, and sonoporation) [
11]. Thus, the extraction of polyphenols, polysaccharides, and functional compounds solubilizing into the appropriate solvent can be facilitated [
12,
13,
14,
15,
16].
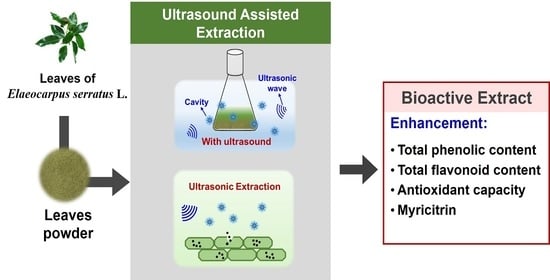
Since Elaeocarpus serratus L. leaves are usually used as compost in situ or processing waste after a fruit harvest, further valorization of the leaves would be advantageous via antioxidant constituent extraction for potential use in food as a nutrient supplement. Thus, an efficient method that can process Elaeocarpus serratus L. leaves is needed. In this study, we investigated an extraction method for bioactive compounds from Elaeocarpus serratus L. leaves and evaluated the antioxidant capacity of the extract. The total phenolic compounds, flavonoids, myricitrin, and antioxidant capacity between shaking-assisted extraction (SAE) and ultrasound-assisted extraction (UAE) at different frequencies, as well as the solvent effect, were compared. Moreover, the kinetic model of extraction was proposed to correlate the extraction coefficient and limiting concentration of myricitrin extracted in the solvent to identify the rate of extraction using UAE for future development.
2. Materials and Methods
2.1. Materials
The leaves of Elaeocarpus serratus L. were collected in October 2018 from the Elaeocarpus serratus L. orchard (23°29′18.1″ N 120°28′15.7″ E) in Chiayi City, Taiwan (R.O.C.). The leaves were obtained from more than three plants with a tree age of about 30 years. The leaves were oval, acute at base, obtuse at apex, with serrated edges and a dark green surface. The old leaves (orange or bright red) and young leaves (pale red) were not used, and only the dark green leaves were selected as the test material.
The Folin–Ciocalteu’s reagent, gallic acid, rutin, ferrous sulfate heptahydrate, and myricitrin were used as the standards in the analysis and purchased from Sigma-Aldrich (St. Louis, MO, USA). Other chemical reagents purchased were acetonitrile from Merck (Darmstadt, Germany), n-hexane from BIONOVAS biotechnology (Toronto, CA, USA), ferric chloride, aluminium chloride, sodium carbonate, and methanol from Sigma-Aldrich (St. Louis, MO, USA), and 95% ethanol from Genestar (Taiwan).
2.2. Preparation of Leaves Powder
The selected leaves were rinsed with deionized water several times to thoroughly remove dust and adhered objects from the surface of leaves. After that, leaves were freeze-dried to remove water and crushed to small pieces by conditioning. Then, they were ground to fine particles that were screened with 60-mesh sieves to obtain powder. Finally, they were stored at 4 °C for use. The proximate composition of the leaves’ powder was analyzed for water [
17], ash [
18], crude protein [
19], and crude fat [
20]. The results were 49.81 ± 0.71% of water (
n = 4), 2.57 ± 0.06% of ash (
n = 4), 1.21 ± 0.07% of crude fat (
n = 3), and 7.80 ± 0.16% of crude protein (
n = 8).
For the solvent extraction of bioactive compounds from the leaves, the efficiency is not only influenced by the physical properties and solubility of the components in the solvent, as well as the interaction between compounds but also affected by the ease of contacting the material with the solvent. It is favorable to the extraction efficiency when the processes facilitated the diffusion and affinity of bioactive compounds in the solvent within the matrix of the leaves. Prior to the extraction operation, the leaves’ powder was first pretreated with n-hexane at room temperature for 1 h to reduce the resistance of solvent transporting through the waxy surface into the matrix of the solid particles. Then, n-hexane was separated via filtration and dried to get the defatted leaves (denoted as DL), which were used as raw material to extract the bioactive compounds.
2.3. Extraction of Bioactive Compounds by Using UAE and SAE
The UAE of the DL was performed using the bath system equipped with the frequency/electric power at 40 kHz/300 W or 120 kHz/300 W (LEO-3002S, LEO-3002H, LEO Ultrasonic Co., Taiwan), and the power density of the system was 0.028 W/mL.
With the setting of solvent to solid ratio, one gram of the DL was added into the solvent in a round-bottomed flask. Methanol, water, and different concentrations of aqueous ethanol solution (95%, 75%, and 50% ethanol) were tested as the extraction solvent. The UAE was operated with ultrasound (40 kHz/300 W or 120 kHz/300 W) at 30 °C for different times (30, 60, 120, 180, 240, and 300 min). The SAE using 120 rpm of shaking without ultrasound was carried out for comparison.
After completing the extraction operation at the sampling time, the solid–liquid mixture was centrifuged at 4000 rpm for 10 min to obtain the supernatant containing the leaf extract. The solvent was removed from the supernatant under a vacuum to obtain the extract concentrate, which was subsequently purified by freeze-drying and storing in an opaque bottle at 4 °C for analysis. The yield of extract based on DL was estimated using Equation (1),
2.4. Determination of Total Phenolic Content
The total phenolic content (TPC) of the extract was determined according to the Folin–Ciocalteu method with a slight modification [
21], and expressed as a gallic acid equivalent (GAE). To determine the TPC, the dried extract was re-dissolved in 75% aqueous ethanol to prepare the extract sample. Next, 500-µL of the extract sample was mixed with 500 µL of Folin–Ciocalteu reagent (1 N), and the mixture was set still for 5 min. One milliliter of sodium carbonate solution (20%) was added into the mixture and stored in a dark place for 8 min. Then, the solution was centrifuged at 12,000 rpm for 10 min to get the supernatant for analysis. The absorbance of the supernatant at 730 nm was measured using a spectrophotometer (Hitachi, double-beam spectrophotometer UH5300, Tokyo, Japan) to determine the TPC from the calibration curve. The TPC was expressed as mg-GAE/g-DL by multiplying mg-GAE/mg-extract with mg-extract/g-DL.
2.5. Determination of Total Flavonoid Content
The total flavonoid content (TFC) of the extract was measured using the rutin equivalent (RE) according to the method of Khemakhem et al. (2017) with some modifications [
22]. The extract sample was prepared as described above. Next, 250-µL of the extract sample was mixed with 150 µL of 5% sodium nitrite and 1 mL of de-ionized water in a 15-mL test tube, and the mixture was set still at room temperature for 5 min. Then, 75 µL of aluminum chloride (10%) and 1 mL of sodium hydroxide (1 M) were, in succession, added into the mixture. Finally, the distilled water was introduced into the mixture to make up a total volume of 2.5 mL for analysis. The absorbance of the mixture at 510 nm was measured using a spectrophotometer to determine TFC and the TFC was expressed as mg-RE/g-DL by multiplying mg-RE/mg-extract with mg-extract/g-DL.
2.6. HPLC Analysis of Myricitrin
Following the method of Ahmad-Qasem et al. (2013) with a slight modification [
23], the content of myricitrin in the extract sample was determined with a myricitrin standard (Sigma-Aldrich, USA) using a high performance liquid chromatography (HPLC) system, which was equipped with the diode array-detector set at 350 nm (SpectraSYSTEM UV1000, Thermo Fisher Scientific, San Jose, CA, USA), and a Mightysil RP-18 GP column (5 µm, 250 mm × 4.6 mm, Kanto Chemical Co., Tokyo, Japan). The mobile phase at 1 mL/min of flow rate was composed of solvent A (0.1% trifluoroacetic acid) and solvent B (acetonitrile), and the gradient was set as the following: for solvent B, 10 to 20% at 0 to 10 min, 20 to 40% at 10 to 35 min, 40 to 100% at 35 to 40 min, 100% maintained at 40 to 45 min, and finally 100 to 10% at 45 to 46 min. The content of myricitrin in the DL was expressed as mg/g-DL by multiplying mg/mg-extract with mg-extract/g-DL.
2.7. Determination of Ferric Reducing Antioxidant Power
Following the method of Shirzad et al. (2017) [
24], the reagent for the analysis of ferric reducing antioxidant power (FRAP) was prepared and kept at 37 °C for use. The FRAP reagent (285 μL) was mixed with 15 μL of the extract sample in a test tube. Next, 500-µL of deionized water was added into the mixture and maintained at 4 °C for 4 min. The absorbance of the sample at 593 nm was measured with a spectrophotometer using ferrous sulfate heptahydrate equivalent (FSE) for the determination of FRAP, which was expressed as mg-FSE/g-DL by multiplying mg-FSE/mg-extract with mg-extract/g-DL.
2.8. Statistical Analysis
Each experiment was performed in triplicate with three independent samples and the experimental data were expressed as mean ± standard deviation. Statistical analysis was evaluated using a one-way ANOVA with Duncan’s multiple range test using IBM SPSS Statistics 20 (IBM SPSS Statistics for Windows, Version 20.0, IBM Corp, Armonk, NY, USA). The significant difference was determined at p < 0.05.
3. Results and Discussion
3.1. Comparison of Bioactive Compounds and Myricitrin between UAE and SAE for Various Solvents
The comparison of total phenolic compounds, flavonoids, and myricitrin from
Elaeocarpus serratus L. was explored for various polarities of solvent (95% ethanol, water, and methanol) between using UAE at 40 kHz/300 W of ultrasound (UAE-40), UAE at 120 kHz/300 W of ultrasound (UAE-120), and SAE at 120 rpm of shaking (SAE-120) in the conditions of DL/solvent = 1/10 (g/mL), 30 °C of temperature, and 4 h of duration. The yield of extract, TPC, TFC, and myricitrin using 95% ethanol, water, and methanol are shown in
Figure 1a–c respectively.
As shown in
Figure 1a, using 95% ethanol as the solvent, the yield of extract, TPC, TFC, and myricitrin of UAE-40 were higher than that by SAE-120 and UAE-120. The TPC with UAE-40 (92.35 mg-GAE/g-DL) was 1.53 folds of that using SAE-120 (60.30 mg-GAE/g-DL). Similarly, the TFC of UAE-40 (53.14 mg-RE/g-DL) was 1.44 folds of that with SAE-120 (36.91 mg-RE/g-DL). Moreover, the content of myricitrin of UAE-40 was 4.41 mg/g-DL, which was 1.4 folds of that using SAE-120 (3.15 mg/g-DL) and 1.49 folds of that using UAE-120 (2.95 mg/g-DL). Further, using 95% ethanol, the extraction efficiencies of yield of extract, TFC, and myricitrin were similar for SAE-120 and UAE-120 with insignificant differences, showing similar impact on the internal structure of leaves between UAE-120 and SAE-120, demonstrating that the cavitation effect by 120 kHz of ultrasound and with the hydraulic effect by 120 rpm of shaking displayed the similar impact on the changing of internal structure of leaves to make similar extraction efficiency of bioactive compounds from the leaves.
When using water as the solvent, the largest yield of extract, TPC, TFC, and content of myricitrin were obtained using UAE-40, all with significant differences to that using UAE-120 and SAE-120, as shown in
Figure 1b. It was observed that the extraction efficiency of bioactive compounds was more effectively enhanced with UAE-40 than UAE-120 and SAE-120, due to the more intensified cavitation effect generated by 40 kHz of ultrasound, so as to increase the affinity of bioactive compounds in the solvent. As shown in
Figure 1c, when using methanol as the solvent, the highest extraction efficiency was obtained with UAE-40 among the tested extraction modes. The TPC, TFC, and myricitrin with UAE-40 were 74.77 mg-GAE/g-DL, 47.30 mg-RE/g-DL, and 4.41 mg/g-DL, respectively, which were in order by 1.45, 1.45, and 1.38 folds of that using SAE-120. Moreover, the content of myricitrin via UAE-40 was 1.30 folds of that using UAE-120 (3.38 mg/g-DL). This showed that UAE-40 was more preferable than UAE-120 and SAE-120 in extracting bioactive compounds using methanol.
In addition, for a solvent effect using UAE-40, the largest TPC, TFC, and myricitrin were obtained with 95% ethanol, while methanol had almost equivalent efficiency on the extraction of flavonoids and myricitrin, but with a lower extractive capability on phenolic compounds than 95% ethanol. This showed that the extraction efficiency is not only dependent on the properties of the solvent (e.g., polarity, viscosity) and bioactive compounds (e.g., hydrophilicity, solubility, diffusivity) but also on the interaction of the plant material and solvent under specific extraction mode.
3.2. Effect of Concentration of Aqueous Ethanol on the Extraction Efficiency by UAE
The hydrophilic property of the compounds existing in the plant materials varied significantly, such that the compounds extracted from the plant materials and antioxidant activity of the extract were dependent on the polarity and viscosity of the solvent and the interaction of the solutes in the solvent.
Table 1 shows the effect of concentration of aqueous ethanol (95% ethanol, 75% ethanol, and 50% ethanol) on the extraction of bioactive compounds and antioxidant activity using UAE.
The polarity of the aqueous ethanol increased with the decrease of ethanol concentration [
25]. At conditions of 1/10 (g/mL) of DL to solvent ratio, 30 °C and 4 h of duration, the largest TPC, TFC, and myricitrin content were obtained using 95% ethanol as the solvent. All the orders of TPC, TFC, myricitrin, and FRAP for different concentrations of aqueous ethanol were 95% > 75% > or ≈ 50% ethanol. However, 75% ethanol showed slightly higher mean extraction efficiencies of TPC, TFC, myricitrin, and FRAP than 50% ethanol, but with insignificant differences. These results revealed that the phenolic compounds and flavonoids existing in the
Elaeocarpus serratus L. leaves were largely more hydrophobic, so as to make the hydrophobic phenolic compounds and flavonoids much more extracted with higher concentration of aqueous ethanol.
3.3. Comparison of Antioxidant Capacity of Extract between UAE and SAE
Phenolic compounds are the secondary metabolites of plants and exhibit biological effects to defend against free radicals. As described above,
Elaeocarpus serratus L. leaves are rich in phenolic compounds and have significant antioxidant activity. However, the extraction processes using various solvents and extraction modes would result in different profiles and amounts of bioactive compounds, thus possibly leading to the antioxidant capacity of the extracts varied between each mode. The comparisons of FRAP antioxidant capacity using UAE-40, UAE-120, and SAE-120 with different solvents are displayed in
Table 2.
As shown in
Table 2, for 95% ethanol, the FRAP values were insignificantly different for UAE-40 (199.75 mg-FSE/g-DL) and SAE-120 (204.48 mg-FSE/g-DL), but both were larger than that for UAE-120 (174.48 mg-FSE/g-DL). By using methanol as the solvent, the largest FRAP value occurred in UAE-40 (184.09 mg-FSE/g-DL), but with insignificant differences to that of SAE-120 and UAE-120. While for water, the FRAP by SAE-120 was a little higher than that by UAE-40 and UAE-120, but the differences were not much. This might be because the chemical profile extracted with water by UAE was substantially different from SAE, including the interaction and synergism effect between the antioxidants in the mixture [
26].
It was found that the profile of antioxidants that could be extracted significantly depended on the specific solvent employed. Either for SAE-120 or for UAE-40 and UAE-120, the order of FRAP value was 95% ethanol > methanol > water. This demonstrated that the polyphenols and flavonoids existing in Elaeocarpus serratus L. leaves were dominated in hydrophobic behavior. From the overall results on the yield of extract, TPC, TFC, myricitrin, and FRAP, the combination of UAE at 40 kHz/300 W and 95% ethanol showed the production of preferable extract from Elaeocarpus serratus L. leaves for further potential application in foods.
3.4. Kinetic Modelling for Extraction of Myricitrin and Effect of Extraction Time on TPC and TFC
In the solid–liquid extraction of substances from the plant materials, the factors influencing the extraction rate and affinity of the target compounds in the solvent were complex, including swelling of the solid material in the solvent, diffusion of the solvent into the interior of the solid material, dissolution of the compounds into the solvent in the solid-liquid interface, transport of the compounds to the outer surface of the solid particle, and the mass-transfer of the compounds to the bulk liquid [
12]. In the present system, an extraction model that combines such complex factors as an overall effect would be useful in evaluating the extraction efficiency in different conditions. Hence, the first-order kinetic model using the observed extraction rate coefficient was applied to describe the extraction kinetics of myricitrin in the solvent. The rate of change of myricitrin in the solvent is as follows:
where
Cm (mg/mL) is the concentration of myricitrin extracted into the solvent at the time
t (min),
Cm∞ (mg/mL) is the limiting concentration of myricitrin in the solvent as
t approaching infinity, and
km,obs (min
−1) is the observed extraction rate coefficient for myricitrin. Using the initial condition
Cm = 0 at
t = 0, Equation (2) is solved to give:
The observed extraction rate coefficient km,obs and the limiting concentration Cm∞ can be correlated by the nonlinear least-square method using Equation (3).
The results for kinetic modelling of extraction of myricitrin with 95% ethanol and water are shown in
Figure 2, in which the experimental conditions were 1/10 (g/mL) of DL to solvent ratio and 30 °C with UAE at 40 kHz/300 W. The concentration of myricitrin was estimated from myricitrin with the DL to solvent ratio. It was observed that, in 30 min, the yields of extract were 26.38 ± 0.66% and 18.08 ± 0.33% by 95% ethanol and water, respectively, and the corresponding contents of myricitrin in the extract were 3.49 ± 0.06 mg/g-DL for 95% ethanol and 2.54 ± 0.06 mg/g-DL for water, with which the concentrations of myricitrin were estimated as 0.349 mg/mL in 95% ethanol and 0.254 mg/mL in water. Obviously, using 95% ethanol was able to dissolve more myricitrin when using water, showing that, in this multicomponent extraction system, the solvent 95% ethanol had a larger capability to solubilize myricitrin from the internal structure of the leaves than water had. Thus, limiting concentration of myricitrin in the solvent could be evaluated.
As shown in
Figure 2, when the extraction time was longer than 120 min, the concentration of myricitrin gradually approached to the limiting concentration. A similar trend was also observed by Nayak et al. (2018) [
27]. The kinetic parameters of extraction of myricitrin in 95% ethanol and water were correlated by using Equation (3), and the results are shown in
Table 3.
As displayed in
Table 3, the observed extraction rate coefficient using water (0.0818 min
−1) was higher than that using 95% ethanol (0.0566 min
−1). This was due to myricitrin having more hydrophilic properties, so that the initial affinity of myricitrin in water was larger than that in 95% ethanol. While the
Cm∞ of myricitrin was larger in 95% ethanol (0.416 mg/mL) than in water, showing that the cavitation effect of ultrasound (40 kHz/300 W) was more severe in 95% ethanol than in water to promote the dissolution of myricitrin, leading to much enhancement of myricitrin extracted in 95% ethanol solvent.
Besides, in order to verify the extraction limits of the total phenolic compounds and total flavonoids by 95% ethanol and water, the variations of TPC and TFC against the extraction time of UAE-40 were evaluated. The results are displayed in
Figure 3a,b for TPC and TFC, respectively.
As shown in
Figure 3, the trends for the variations of TPC and TFC against time were all similar to the myricitrin concentration of 95% ethanol and water. The contents of total phenolic compounds and flavonoids obtained were gradually approached to their extraction limits under ultrasound (40 kHz/300 W) when the extraction time was longer than 120 min, showing that UAE-40 exhibited high efficiency in the extraction of
Elaeocarpus serratus L. leaves.
4. Conclusions
In this study, the valorization of Elaeocarpus serratus L. leaves was explored using ultrasound to assist in the extraction of total phenolic compounds, total flavonoids, and myricitrin. Using 40 kHz of ultrasound and 95% ethanol, the high contents of bioactive compounds and myricitrin from the leaves was achieved, and the high antioxidant activity of the extract was observed for UAE at 40 kHz. In addition, the kinetic model for the solid–liquid extraction was proposed and successfully applied to correlate the observed extraction rate coefficient and limiting concentration of myricitrin in the multicomponent system. In summary, the extract of Elaeocarpus serratus L. leaves can serve as an economical source of myricitrin and bioactive compounds via the UAE process. This study proposes an effective and sustainable method to provide bioactive extracts that can potentially be applied in foods for human health benefits.


