Article

Using CFD Simulations to Guide the Development of a New Spray Dryer Design

Drying and Process Technology Research Group, School of Chemical and Biomolecular Engineering, The University of Sydney, Sydney, NSW 2006, Australia
*
Author to whom correspondence should be addressed.
Processes 2020, 8(8), 932; https://doi.org/10.3390/pr8080932
Submission received: 18 June 2020 / Revised: 24 July 2020 / Accepted: 25 July 2020 / Published: 2 August 2020

Abstract

:
A new spray-drying system has been designed to overcome the limitations caused by existing designs. A key feature of the approach has been the systematic use of Computational Fluid Dynamics (CFD) to guide innovation in the design process. An example of an innovation is the development of a box-shaped transitional feature between the bottom of the main drying chamber and the entrance to the secondary chamber. In physical experiments, the box design performed better in all three representative operating conditions, including the current conditions, a higher feed solids concentration (30% solids rather than 8.8%), and a higher inlet drying temperature (230 °C rather than 170 °C). The current conditions showed a 3% increase in yield (solids recovery) while the 30% feed condition improved the yield by 7.5%, and the higher temperature test increased the yield by 13.5%. Statistical analysis showed that there were significant reductions in the wall flux at the high solids feed concentration. The observed deposition in the box was primarily from the predicted particle impacts by an inertial deposition process on the base of the box, which underwent little degradation due to lower temperatures. There is therefore evidence that the box design is a better design alternative under all operating conditions compared with other traditional designs.

Graphical Abstract

1. Introduction

Spray drying is a unit operation with an optimistic future, because it has been suggested [1] that spray drying for pharmaceutical products will increase by 17% between 2018 and 2028. Being a continuous and one-step drying and particle production process, it may be described as a robust technique that avoids a significant amount of manual handling, in contrast to freeze drying, which is a batch and manual process [2,3].
The continuous nature of spray drying has significant economic benefits, with the cost of spray drying being reported to be around one-sixth of that for freeze drying [4]. Chávez and Ledeboer [4] state that “Spray drying is the most popular and widely studied alternative to freeze drying because it is cost effective, readily available, easy to operate, and can be implemented for large-scale throughputs. Spray drying is 4 to 7 times cheaper and it is more energy efficient than freeze drying.” Santivarangkna, et al. [5] also state that the fixed costs involved in spray drying are 12% of those for freeze drying, and the manufacturing costs involved in spray drying are 20% of those for freeze drying.
Keshani, et al. [6], Masters [7], and Woo, et al. [8] have reviewed the traditional challenges in spray drying from the deposition of particles on the dryer walls, but the wall deposition challenge may be somewhat more subtle, as noted by Francia, et al. [9]. The practical problem [9] is that droplets and particles deposit on the walls of spray dryers, where they stay for some time, and then are sometimes lifted and re-entrained into the gas. The effect of this practical problem is to increase the particle residence time in spray dryers by an order of magnitude. This increase in residence time is a very large problem in several areas, most critically in the food and pharmaceutical areas where many chemical components are very heat-sensitive. An example includes coffee, where aroma loss in spray drying due to this extended residence time in spray drying means that more expensive freeze-dried coffee has a higher quality than the cheaper spray-dried coffee materials [10,11]. Another example is the poor solubility of spray-dried proteins and protein coatings that arise due to protein denaturation in spray dryers from this extended residence time [12,13].
There are a considerable number of studies where Computational Fluid Dynamics has been used to assess the flow patterns inside spray dryers [14,15,16,17,18,19,20,21,22]. The subtlety of the wall deposition and re-entrainment challenge for spray dryers means that there may be scope for redesigning spray dryers, as reviewed by Huang, Sormoli and Langrish [22]. Key previous works that have utilized Computational Fluid Dynamics (CFD) to redesign different parts of spray dryers include Southwell, et al. [23] for the inlet air (plenum) chamber, Huang and Mujumdar [14], Huang and Mujumdar [24] for a horizontal spray dryer, and Huang, et al. [25,26] for different cylindrical chamber designs. The need for experimental comparison is essential for high-quality CFD outcomes, as the choice of the most appropriate turbulence models is still an evolving process.
Francia, et al. [27] concluded that the shapes and forms of the air inlets and the outlet air pipe (equipment design) were critical in creating the air and particle flow fields, which then affect the wall deposition patterns and amounts. They worked in a full-scale countercurrent spray dryer with direct observations through inspection doors, and with sonic anemometry being used to measure the air velocities and turbulence levels. The fates and trajectories of rebounding particles may also be affected by the wall roughness, as found by Ali, et al. [28]. Francia, Martin, Bayly and Simmons [9] further studied the dynamic wall deposition process using the same equipment by placing detachable plates on the inspection doors at different heights in the chamber. Samples of the deposits, including tracer particles, were extracted at different time intervals, so that the residence time and the source of the particles (airborne or wall-borne) were determined. The work found that the product contained up to 20% of re-entrained particles from wall deposits and that the deposition and re-entrainment rates depends on the drying stage of the particle/droplet, the shear stress on the deposits, and the morphologies of the deposition layers.
Many of the design alternatives for spray dryers have been found to have limited effects upon the wall deposition problem. Design modifications such as horizontal operation have been found to have negative effects by increasing the wall deposition rate [6]. These have been largely caused by the lack of understanding of internal flows prior to the increased accuracy of CFD. Through the combination of experimental observations and CFD models, the possibility of finding suitable design alternatives is much higher.
Design improvements have been made through minor alterations from the vertical design. The simplest design modification has involved removing the straight edged conical funnel at the outlet and replacing it with a parabolic-shaped curved piece [29]. This was shown to reduce the wall deposition rate in this unit of the spray dryer. Papers have often focused upon the plenum design [23], because improving the air flow pattern at the start of the dryer usually improves the performance of the whole dryer. Following from these works, there is a need to examine the other design elements of spray dryers such as the chamber rather than just the nozzle unit. This research focus was not feasible until more recent advances in the understanding of the complications within spray dryer operation, however it was identified as a necessary research area in the earliest papers [30,31].
In this work, the aim is to use CFD analysis to assess the probable trends in wall deposition that would be expected in several design alternatives, thereby guiding the design process. These alternatives were then constructed and tested in physical experiments at the pilot scale. The key aim of the paper was to use approximate CFD simulations to guide changes in the experimental design.

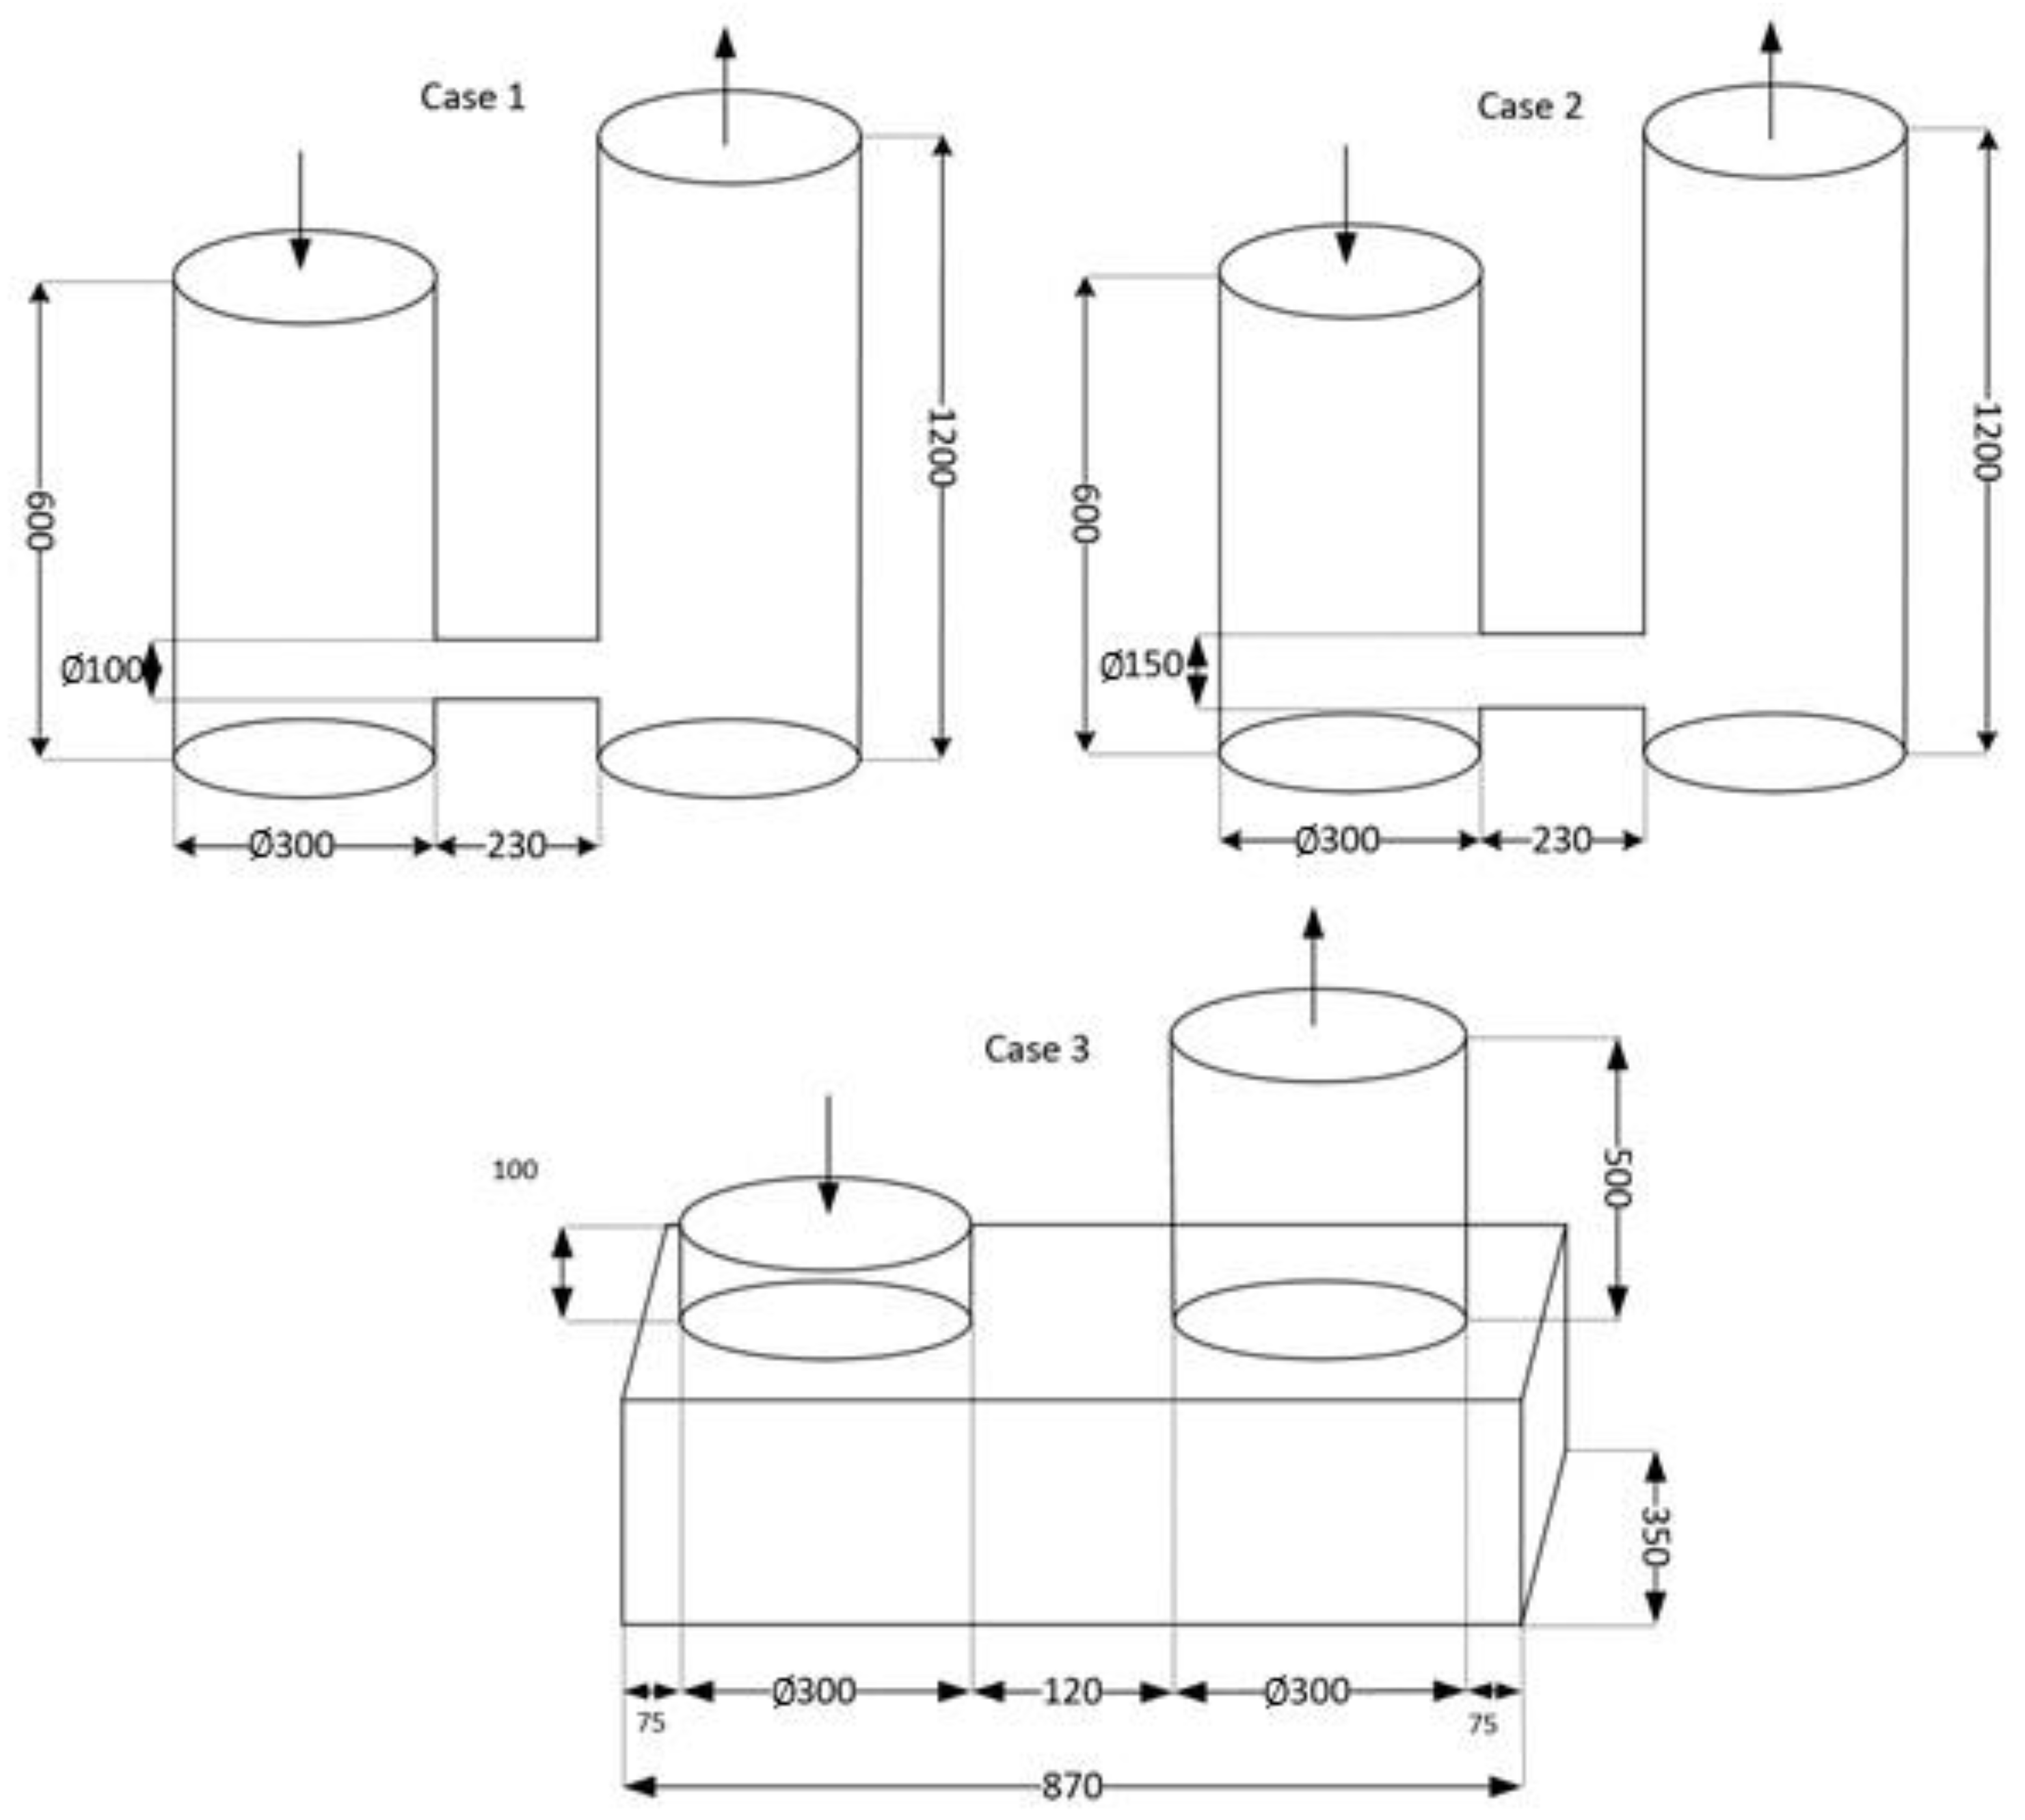
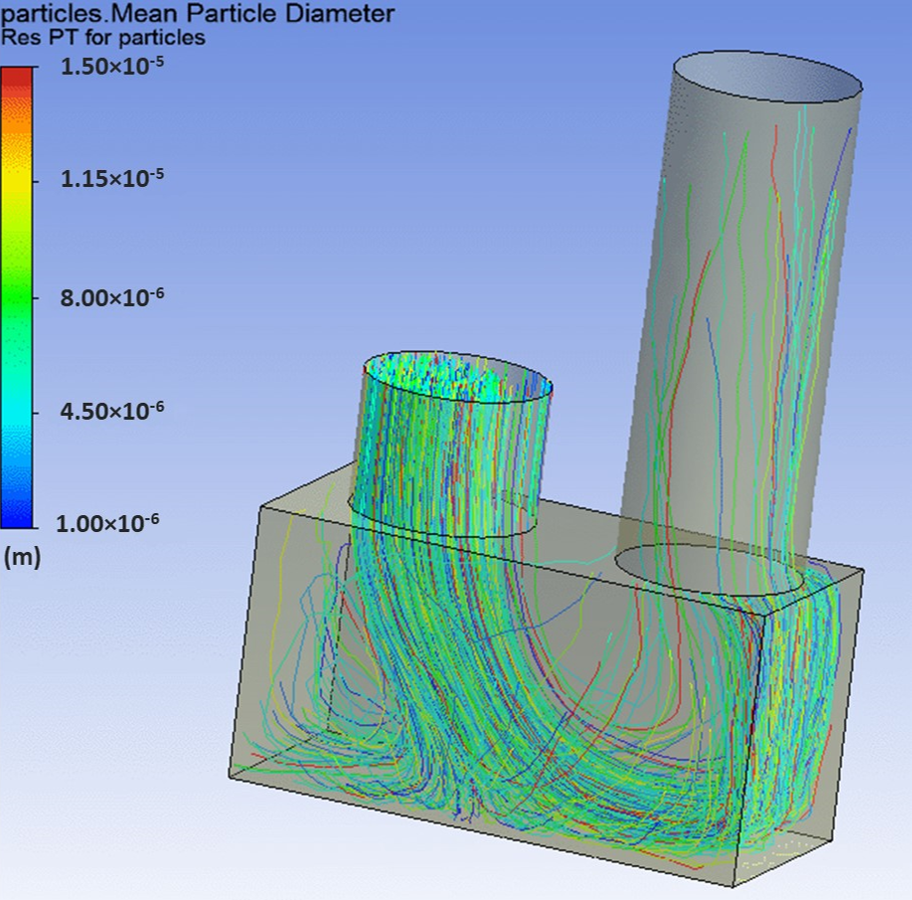
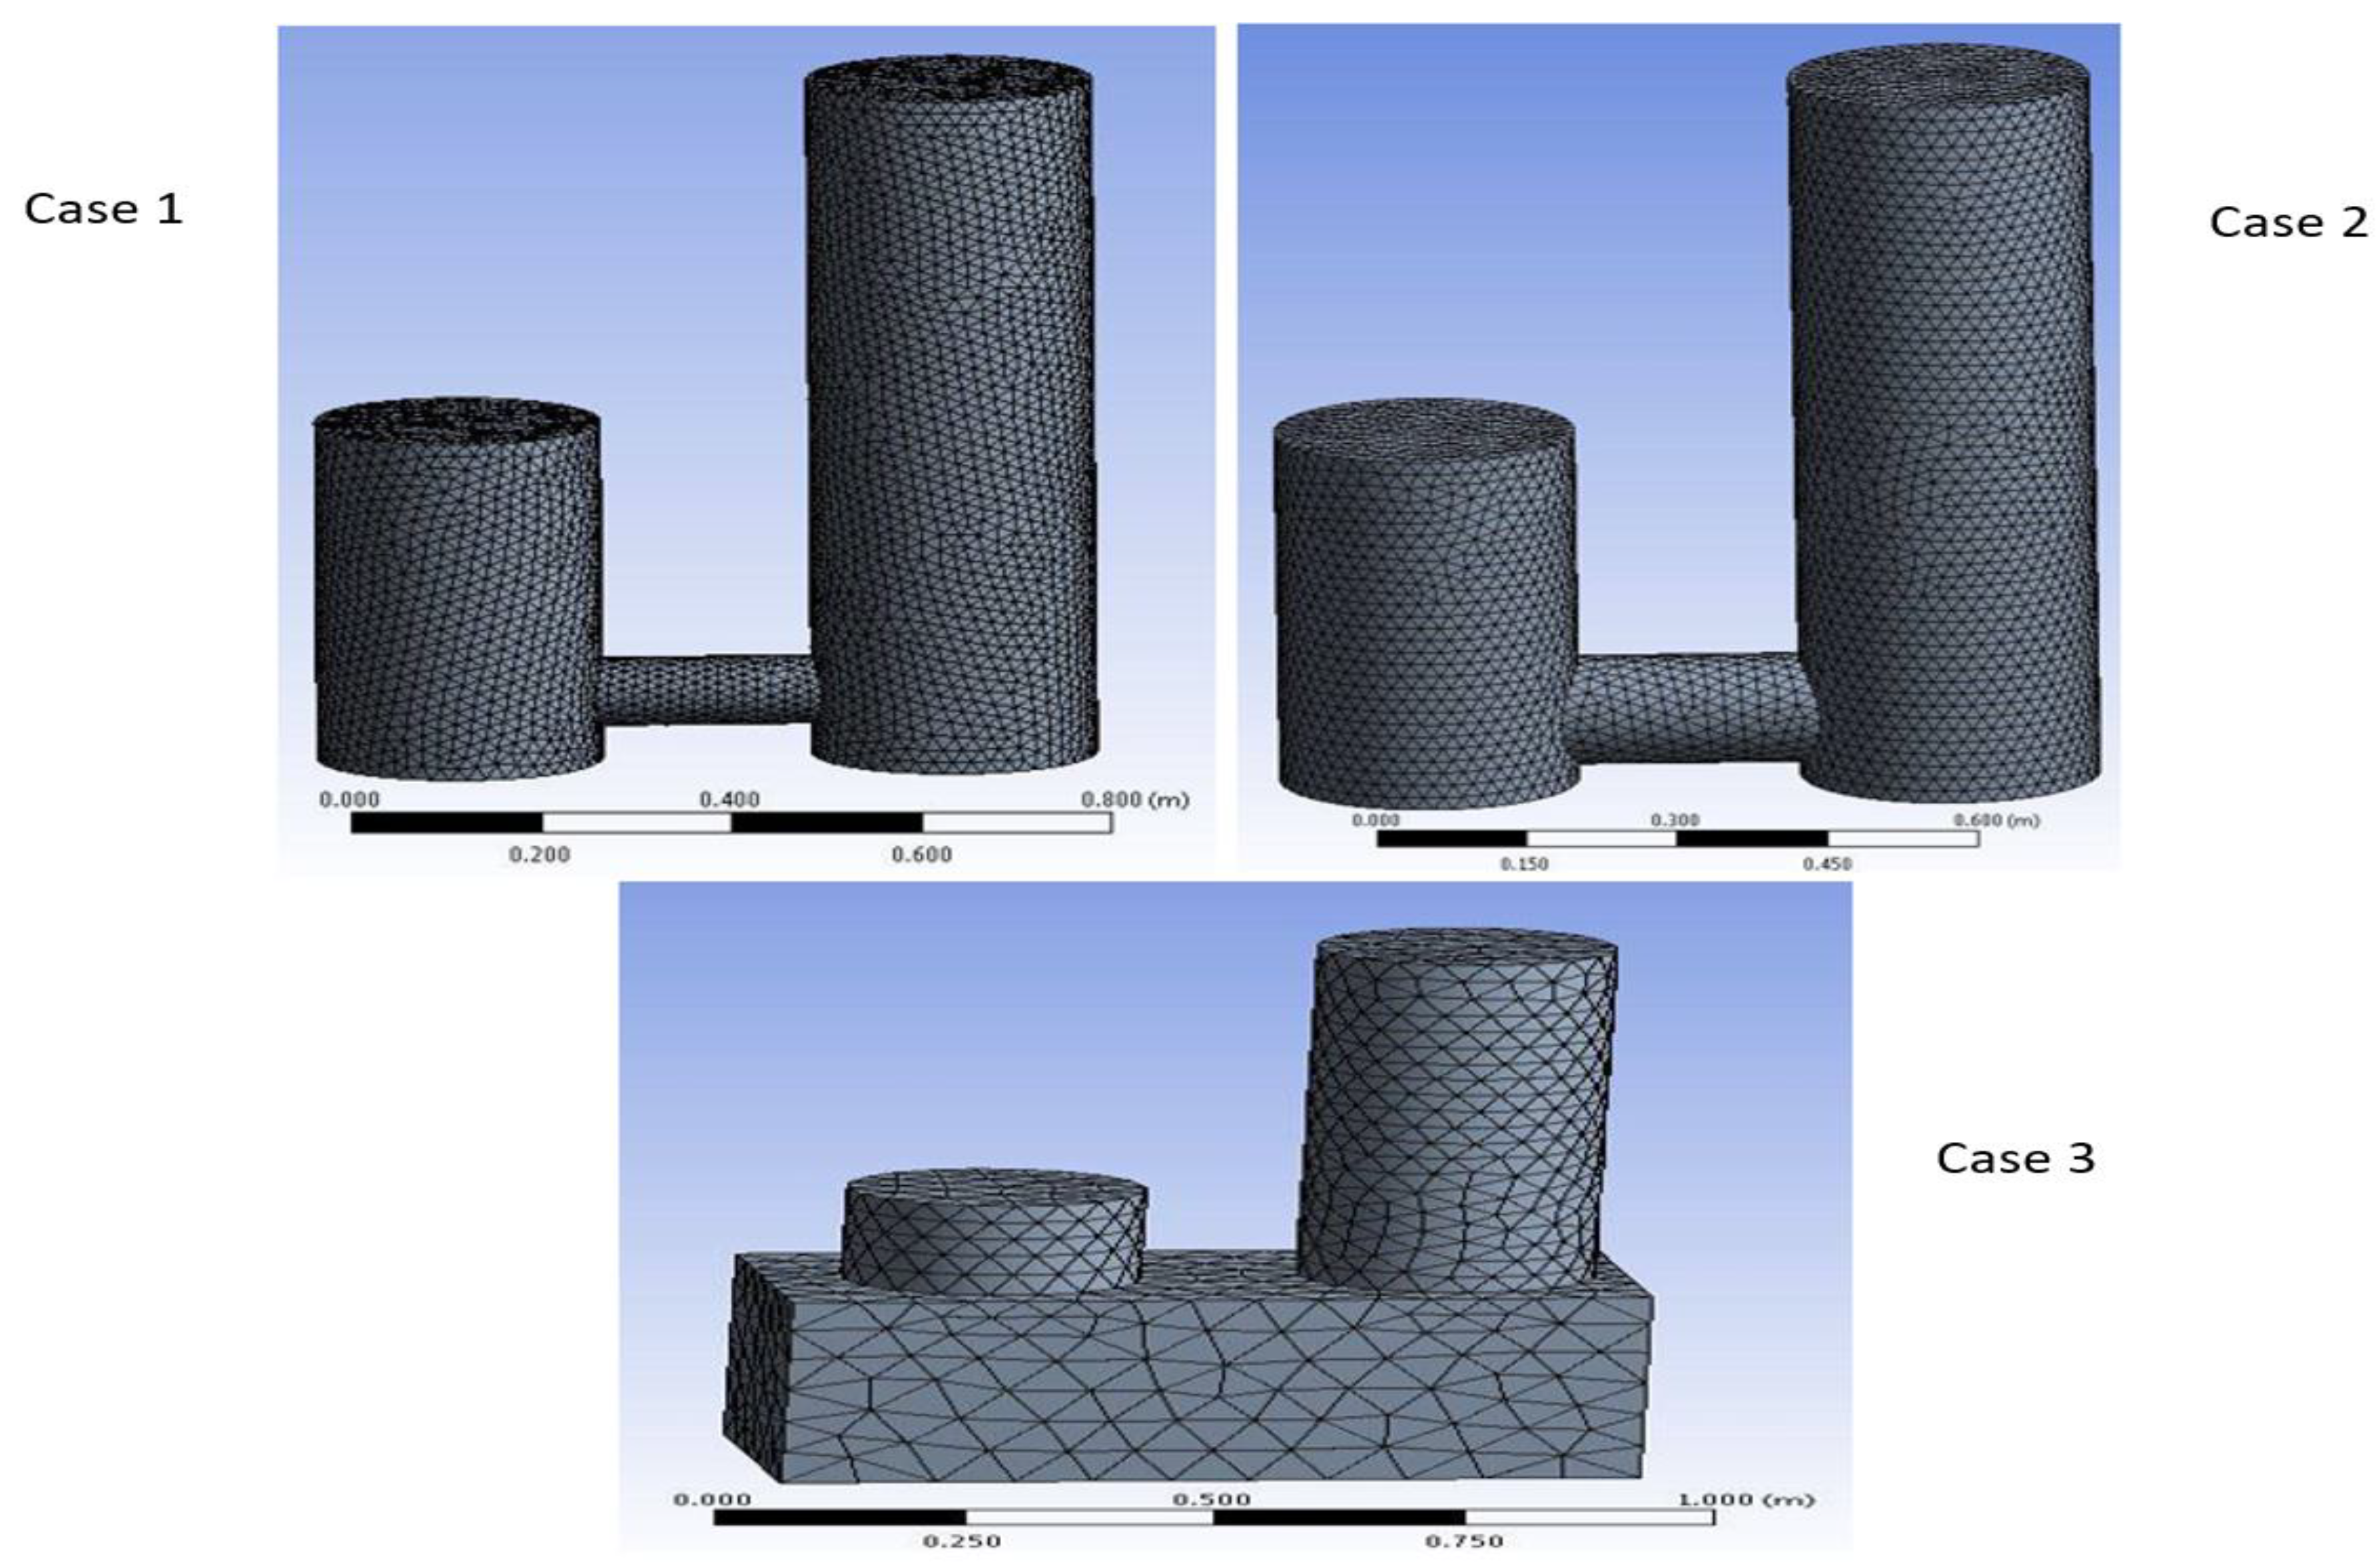
2. Preliminary CFD Assessment

Numerical experimentation has been performed using ANSYS Fluent software V9 (ANSYS workbench, 2018). The purpose of the simulations was to approximately assess the fate of particles and specifically the rate of particle impacts with the walls, and no heat or mass transfer was simulated. Following the same approach as used by Jaskulski, et al. [32], the standard Navier–Stokes equations were solved with the standard k-ε turbulence model, using a control volume CFD approach. The particles were tracked, using a standard discrete phase model with Newtonian equations of motion and standard drag coefficients, and the gas–particle interaction was also performed as described by Jaskulski, Tran and Tsotsas [32]. For all equations, the final residuals were below normalized values of 10−3.
Inlet and boundary conditions: Each simulation used the inlet and boundary conditions as follows; a humidity of 0.2 kg water/kg air, a particle mass flow rate of 1 g/s, an air flow rate of 200 kg/h, and air and particle temperatures of 80 °C. The particle size distribution is shown in Table 1. These conditions closely follow those given in Sormoli and Langrish [33]. Particles were distributed uniformly across the inlet of this simulation domain, being over one meter below the nozzle location. For the air flow, a mass flow inlet boundary was set up. At the beginning, calculations were made for 5 s with 0.5 s time steps. For the analysis of the particle–wall impacts, the simulation time for each numerical experiment was 10 s, with a time step of 0.1 s. Given the typical frequency scale for the most significant flow oscillations in spray dryers of ~1 Hz [34,35], 10 s of simulation time is adequate to capture the average behavior of the particles. All the particles that hit the wall were assumed, for this approximate assessment, to stick to the wall. It was clearly understood that this approach (all particles that hit would deposit) would result in a greater amount of wall deposition than found experimentally, but the approach was considered to be still useful for assessing the trends between design options.
The flow geometries were varied in these simulations between the arrangements shown in Figure 1.
Meshing: Figure 2 shows the automatically-generated mesh (ANSYS Meshing software, ANSYS Workbench, 2018) for each case. Case 3 required a less dense mesh to converge (100,000 elements) whilst Cases 1 and 2 required a finer mesh arrangement due to having more extensive flow direction changes (over 200,000 elements). Changing the number of elements by 50% resulted in less than a 5% change in the predicted deposition rate, which was considered to have sufficient accuracy to guide any design changes. As described by Jaskulski, Tran and Tsotsas [32], mesh quality was carefully considered to ensure that the skewness ratio was less than 0.95 (0.9 maximum), and the maximum aspect ratio was 5.1, indicating a reasonable mesh quality. Each condition had the same inlet and outlet diameter, and for each case the outlet region was extended to allow for recirculation regions to be captured. The results from the CFD case studies were the velocity tracks for the air flows, the particle tracks of the particles that contacted the walls, and the number of particles contacting each unit within the geometry. The velocities and particle tracks were graphical outputs from the ANSYS package, while the number of particle impacts was assessed from the mathematical convergence report. As will be discussed in the experimental sections, the wall deposition fluxes are driven mainly by inertial mechanisms. As such, wall refinement was not required when using the CFD simulation to guide the selection of different options for design changes.
Although highly accurate, converged and rigorous CFD simulations are appropriate for uncovering underlying mechanisms and details of the flow fields [36]; it is suggested that these types of CFD simulations may not always be most appropriate for making the types of design changes made in this work because of the substantial computational times involved, which are typically significantly longer than the time required to actually build and test the equipment. In addition, Howard, Gupta, Abbas, Langrish and Fletcher [36] have also shown that the predictions of well-converged simulations with the standard k–ε model and those with zonal LES (Large Eddy Simulation) are very different, highlighting the continuing uncertainties in the results of turbulence modeling.
We are trying to select new options for design changes, and the success of this guidance can be assessed from the experimental results in following sections.

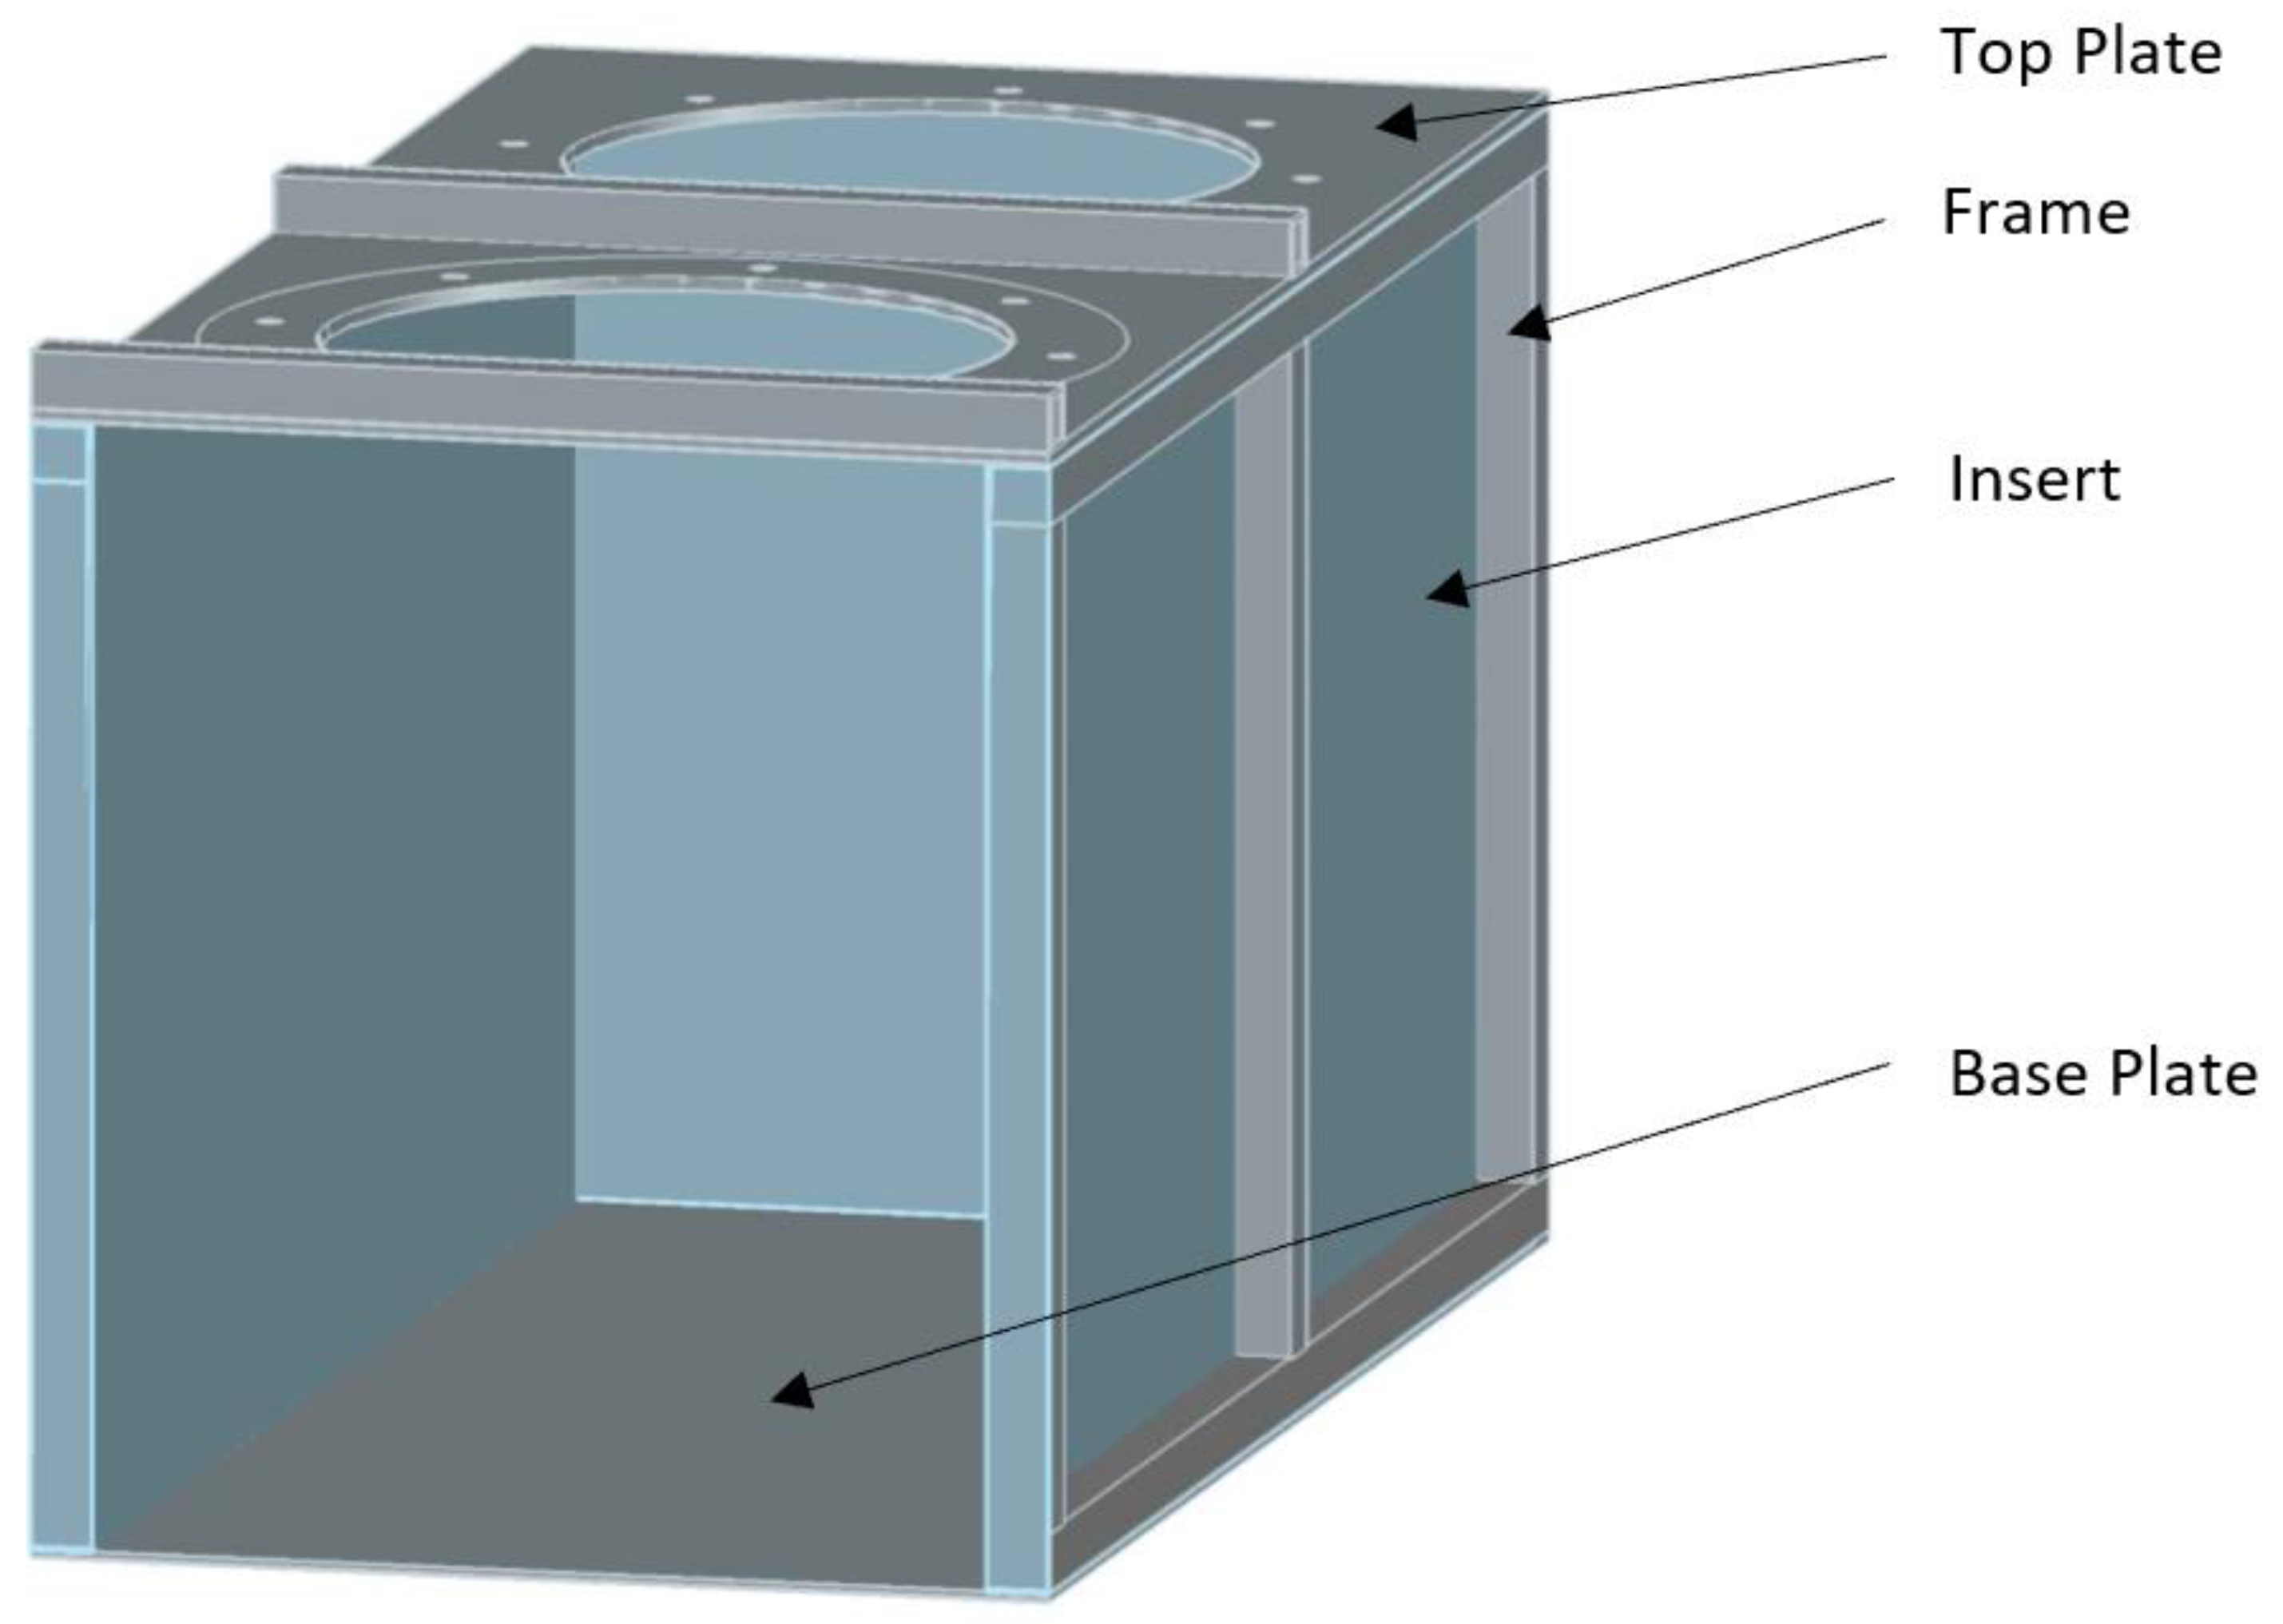
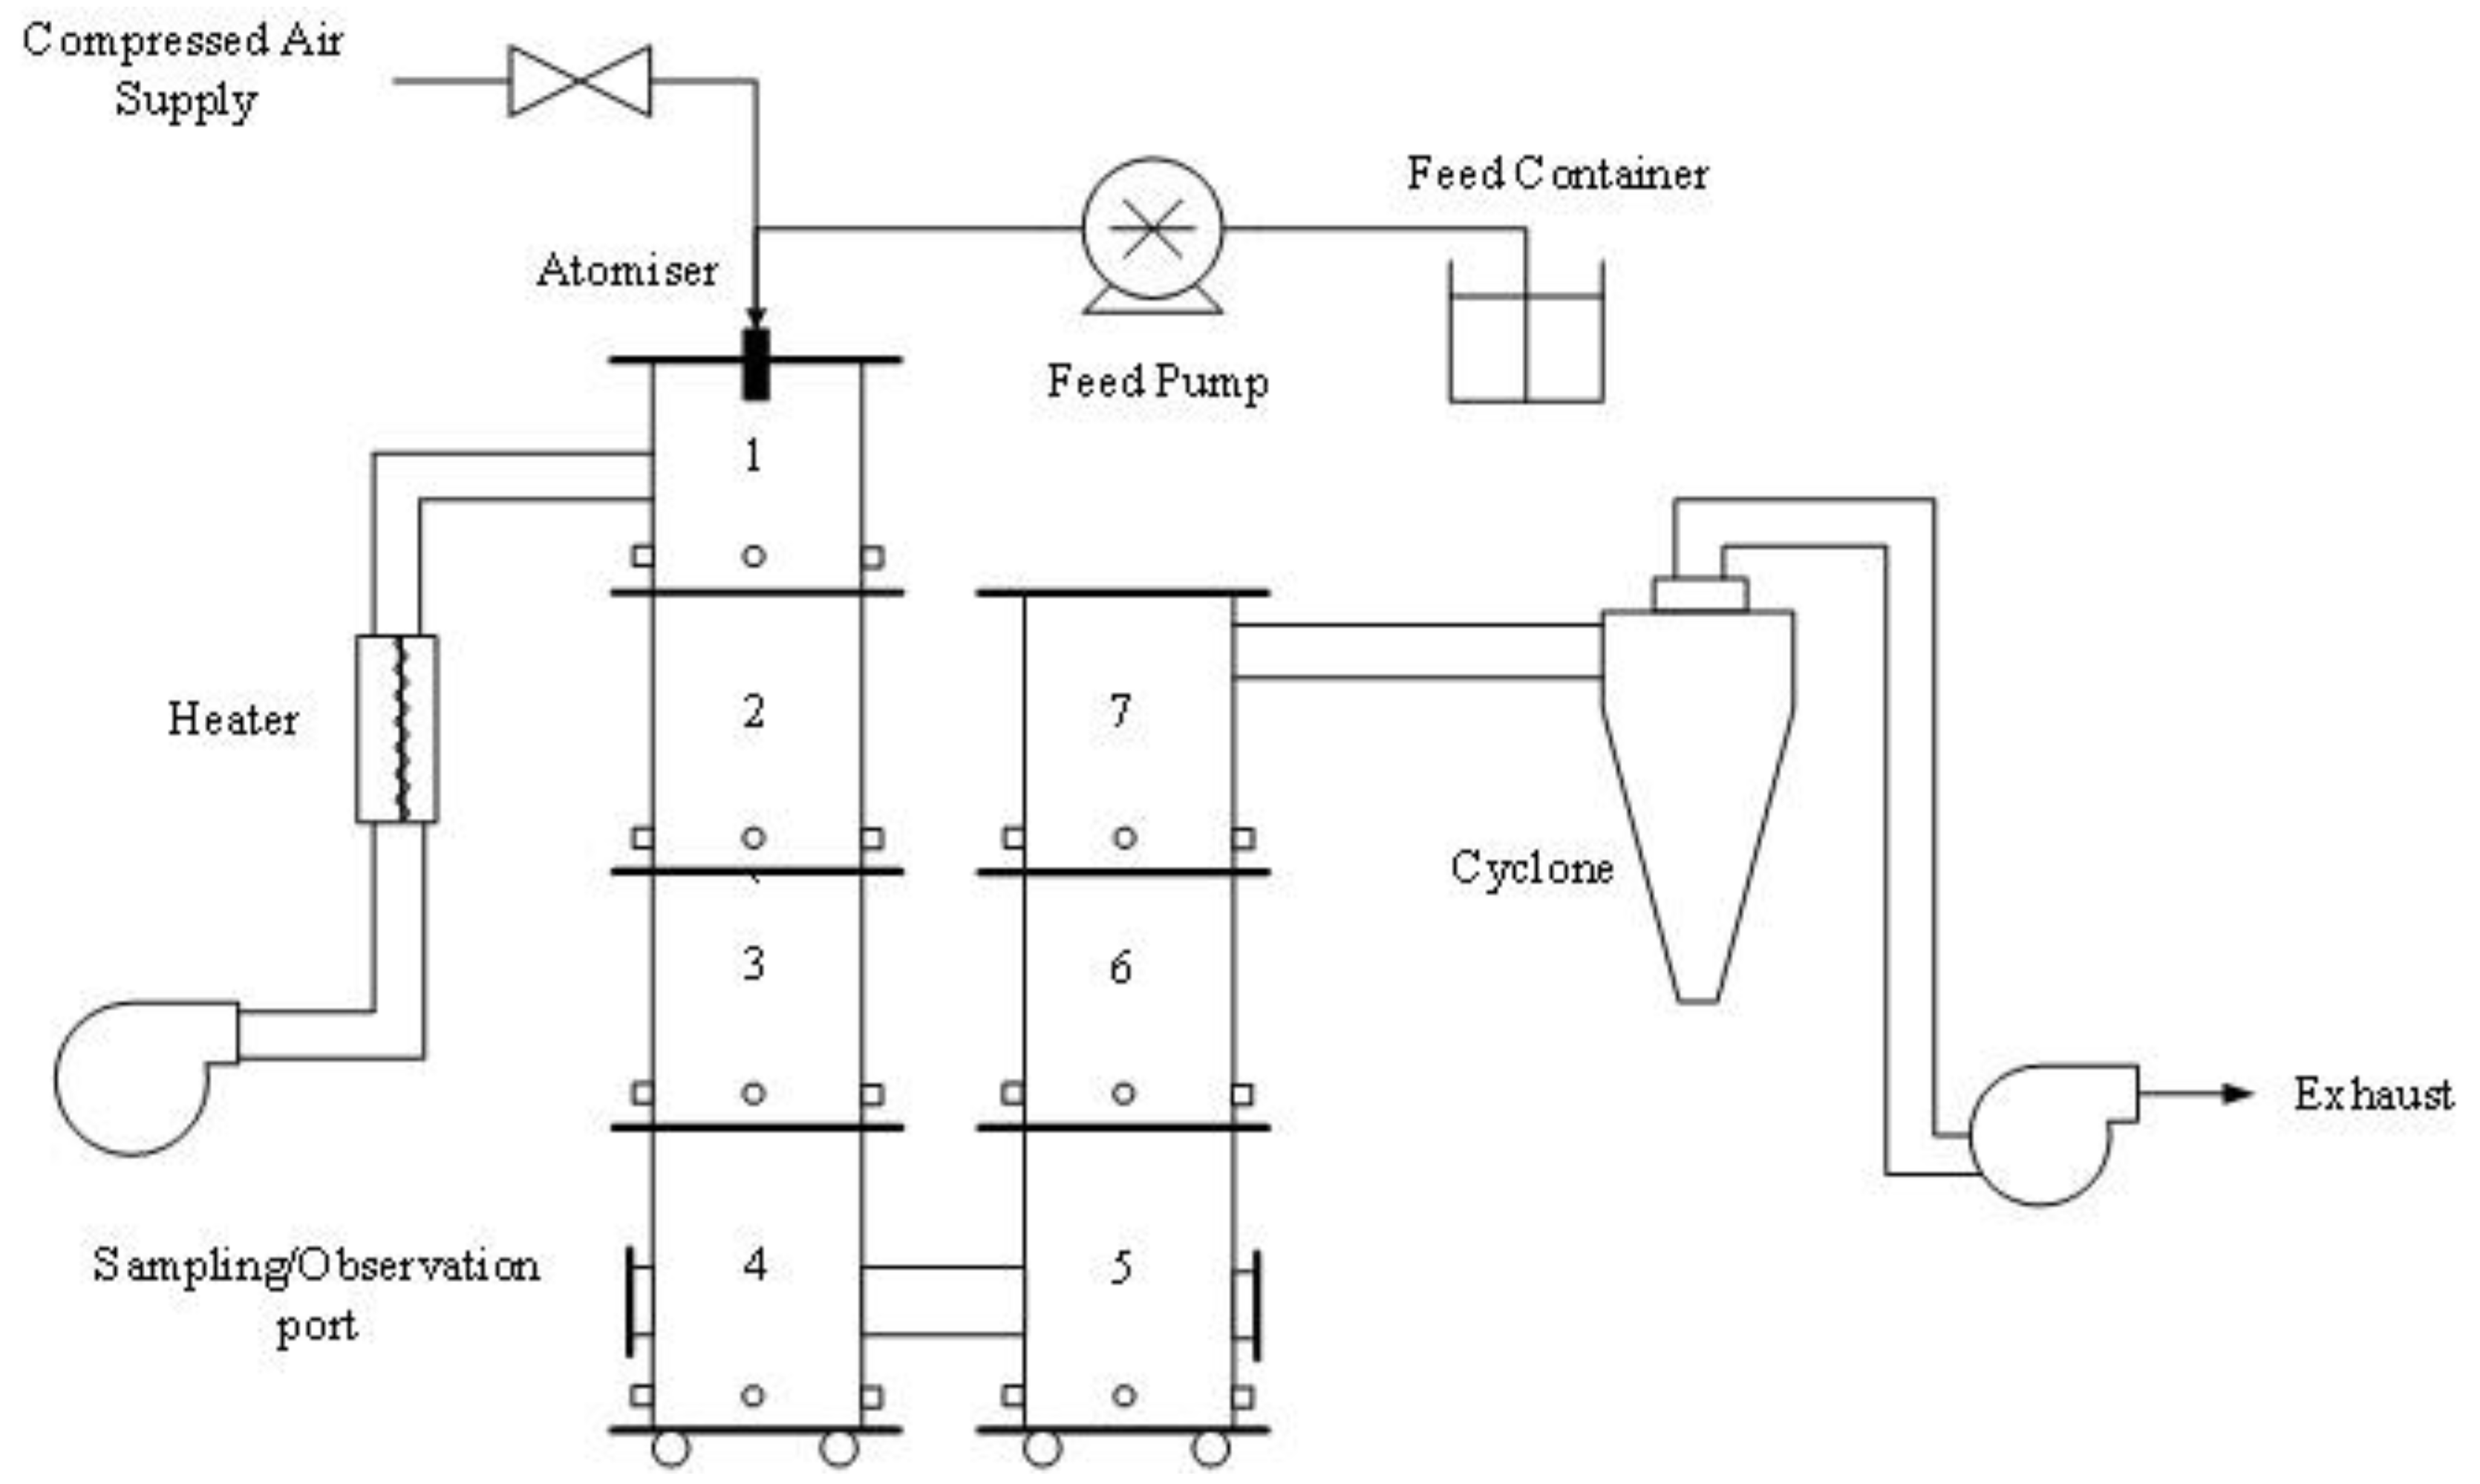
3. Experimental Equipment

The overall layout of the pilot-scale spray dryer is given in Figure 3. This arrangement has been previously described by Huang, Sormoli and Langrish [22]. There are inlet and outlet fans, an air heater at the inlet, and a cyclone at the outlet for gas-particle separation. The modifications to the design were done according to the results of the approximate CFD simulations that are described in Section 5 of this paper, so the modifications to the equipment are described in Section 6.

4. Experimental Procedure

The physical experimentation aimed to analyze the particle wall interactions and the amount of sprayed material that adheres to the walls compared with the predictions of the CFD modeling. These variables were tested through the mass differences of plates stuck to the walls, as well as the total mass of the powder stuck to the walls. The air flow rate was constant for each test; three fans supplied an air flow rate of 280–290 m3/h and the atomizing air flow rate was 10 L/min (0.000167 m3/s).
During assembly of the dryer, 20 stainless steel plates of size 0.1 m × 0.1 m (approximately) were placed inside the dryer, and the area of each plate was carefully measured. The plates were distributed to so that more plates were located in higher deposition areas to capture the behavior patterns of the deposition. Reviewing Figure 3, there were eight plates on the bottom of the box, four on the sides of the box, and four on Unit 3. Unit 6 had two plates and Units 2 and 7 each had a single plate. This arrangement was reviewed by visual inspection to ensure the plates were in an area that would be representative of the deposition within that region. These plates were weighed using a Mettler Toledo AB204-s scale (±0.0001 g) before and after the experimental run to measure the mass collected on each plate. The cyclone collector was weighed before the experimental run and afterwards to measure the amount of product recovered by the system. The feed beaker was weighed three times: empty, with the feed solution, and after the experiment, to get the mass of solution fed into the system. These measurements were taken using a Mettler Toledo PL6001-s scale (±0.1 g).
The experimental start-up was the same for every experimental condition. All three fans were turned on to ensure that the spray dryer was sealing correctly with minimal air leakage. Once completed, the heating elements were turned on. At the point where the inlet temperature had reached the testing condition, the inlet pump was started with water alone. Once the temperature in Unit 3 had stabilized, the feed pump was swapped to the inlet beaker containing the milk solution. At this point, the timer was started and stopped when the inlet line was switched back to the water to push the last of the milk through the pipe. The temperature in the spray dryer was controlled by four thermocouples in the heating elements, placed at the inlet in Unit 1, in Unit 3, and at the top of the cyclone. This maintained control of the inlet temperatures at the testing conditions. At the end of the run, the equipment was allowed to cool using air flow to ensure that the particles adhering to the walls did no undergo further Maillard reactions. At the point, when all the temperatures were reading under 50 °C (safe working temperature), the cyclone collector was removed and weighed. Immediately after this a Petri dish was weighed using Mettler Toledo AB204-s scale (±0.0001 g), then approximately 10 g of powder from the cyclone was placed into the dish. After weighing, it was put into an oven at 80 °C for 24 h so that the mass differences could be measured as the water evaporated within this time. When cleaning the apparatus, the water used to wash and remove the deposits within chambers 1 (Units 1–4) and 2 (Units 5–7), the box, and the cyclone were collected within beakers. The mass of milk was found using Petri dishes (after evaporation in a drying oven at 80 °C for over 24 h), and the mass differences of the sample from each location were measured after 24 h of drying.

5. Physical Experimentation

The simulations were performed for a worst-case environment, which assumed that all particles that contacted the walls would stick. Therefore, the purpose of the deposition analysis is to model the particle and wall interaction sites, rather than to provide a precise model of deposition behavior. The aim of this modeling environment set-up was to ensure that any variation in design would improve the air flow patterns and reduce the number of wall impacts. The cases have been examined individually to understand the air flow patterns and the particle behaviors. The particle tracks through the unit that stick to the wall and any other features affecting which particles impact on the walls have been analyzed. The three cases have been numerically compared with the previous arrangement.

5.1. Model Comparison, Case 1

ANSYS Fluent has been used to model the flow in Units 4 and 5 of the spray dryer, and the computational results have been used to guide the development of new designs, which have then been assessed using physical experiments. The observed deposition patterns within the current set-up, Case 1, have been visually compared to assess if the observed deposition patterns support the use of the model for further design recommendations.
As shown in Figure 4, there are currently significant deposits in the area around the inlet of the second unit. This behavior is a key concern that the design modifications are aiming to eliminate. Qualitative agreement between these observations and the model predictions is necessary for using the model to provide meaningful design recommendations.
From Figure 5, the qualitative behavior seen in the actual experiments has been replicated by the model. The primary difference between the experimental and model results is the extent of the deposits. In the physical experiments Figure 4, the deposits have been established over 40 min causing the deposits to occur further around the unit from the connection outlet. This situation has led to them becoming far more established around the entire unit, which is slightly different to the model prediction. The model only simulates 10 s of time in which 1000 particles pass through the system, and therefore the deposits are likely to be less developed than the actual physical experiment. The computational load required to carry out actual modeling runs of high accuracy is not feasible. The model has correctly predicted the deposition in a ring around the inlet. This result demonstrates the ability for the model to capture the actual behavior within the unit. Furthermore, the upwards spiral pattern in the outlet unit (right) indicates that the cause of the deposition towards the upward end of the unit is due to the turbulence caused by the sudden expansion. The matching behavior between the real unit and the model indicates that further modeling has a good chance of predicting of the internal flow patterns and particle patterns reasonably for design purposes.

5.2. Alternate Design—Case 2 Model Results

The proposed benefit of the Case 2, or alternate design, is a wider connecting pipe. By increasing the diameter of the pipe by 50%, lower velocities between the chambers should cause less inertial deposition on the far wall and less turbulence, causing a lower amount of diffusional deposition. Therefore, it would be expected that the alternate design would show smoother fluid flow behaviors and fewer particle impacts.
Case 2 indicates significant improvement in the predicted particle tracks from CFD. The main benefit is associated with a halving of the velocity in the connection tube, as well as a lower gap between the bottom of the connection and the floor of the second chamber. The effect of increasing the diameter is shown below.
V r a t i o = ( D C a s e   1 D C a s e   2 ) 2 = ( 4 6 ) 2 = 4 9
Therefore, the increase in pipe diameter has reduced the gas velocity by slightly less than half. The smaller gap prevents the formation of a major recirculation zone that entraps particles in separated regions associated with high deposition rates. Furthermore, the gas flow in column two shows less recirculation despite the swirling behavior. This behavior is preferred, compared with the greater amount of recirculation in the original design. This fluid flow behavior indicates that there is likely to be less wall deposition in Case 2 than in the existing Case 1 design.
Figure 6 shows that, despite the better air flow patterns than Case 1, there is still significant deposition on the far wall in this Case 2, which then spreads upwards and in a circular pattern from the impingement point. This pattern is identical to Case 1, but the density of the particle tracks in this area is far lower than that of Case 1. Therefore, with a 50% increase in the connection diameter, the fact that the predicted behavior was still present indicated that the design with two columns joined near the base is a suboptimal design solution. Therefore, the deposition behavior on the far wall from the connection must be reduced. This situation can be achieved by reducing the sudden changes in velocity by means of a wider connection. This change is proposed in the Case 3 box design, which aims to reduce these sudden changes in velocity further.

5.3. Box Base Design—Case 3 Model Results

The results from Case 3 suggest that removing the connecting pipe between the chambers and the consequent sudden velocity changes (and sudden acceleration through a greater bend radius) may reduce the amount of wall deposition. Figure 7 shows that the velocities change less suddenly, as the velocity range is much less than the previous two cases. The notable behaviors predicted here are found on the left-hand side, where low pressure zone causes flow recirculation; nevertheless, the rest of the flow maintains a very similar velocity throughout the flow geometry. The next area of potential improvement is reducing the lip pinch point at the far right, which is causing a small amount of acceleration in the air flow near the base of the second column. However, the smoother and less twisted velocity tracks within the second column are promising, with no obvious recirculation zones, thus reducing the likelihood of wall impacts.
Visual inspection of Figure 8 indicates that there are significantly lower deposition fluxes due to fewer particle tracks being shown to hit the walls. In addition, the particle deposits are more spread out, meaning that cohesion of particles to other particles on the wall will not occur as frequently. The major deposition areas within this model are around the top surface due to the lip between the box and column Unit 6. The deposition within the outlet column is also significantly lower due to the smoother air flow patterns. Therefore, this design, while also giving less deposition itself, is also likely to improve the operability of later units within the dryer. Therefore, the Case 3 design is likely to give flow pattern benefits within the local flow geometry and also overall unit efficiency improvements.

5.4. Comparison of Cases 1, 2, and 3

To ascertain the relative benefits of the three primary case studies, the particle fluxes were taken from the prediction in key areas to allow for numerical comparison (Table 2).
Comparing the particle flux at the outlet, the significant limitations associated with Cases 1 and 2 are evident. Both cases have very low recovery rates of 7% and 13.5%, respectively. While these figures are pessimistic due to the modeling environment assumptions, they demonstrate the negative effects of the air flows caused by the connection region of the two columns. There are significant predicted benefits for Case 3, with a 4.5× predicted improvement in the outlet flux. This increase in flux represents a significant predicted improvement in the dryer operation.
A somewhat unexpected result is the low predicted deposition rate on the base of the box in Case 3, as with the vertical flow it was expected to be higher due to the behavior seen within Case 1, where the flow hits the far wall. This result occurred due to creation of sufficient room for the particles to follow the fluid flow due to the air changing direction more gradually around the bottom of the chamber. This reinforces the principle that a two-column drying chamber needs to be designed to provide a more gradual fluid flow bend radius. From the particle tracks, there was no evidence that there was any variation in the predicted deposition likelihood with different particle sizes. The particle tracks were colored according to the relative particle sizes, and it was found that the particles paths were almost entirely determined by the air flow patterns despite the size distribution. Therefore, the air flows appeared to be the main causes of the differing results between the three case studies.

6. Prototype Development

A combined approach has been taken here, using CFD and physical testing, due to the variations in the outcomes of using different turbulence models in CFD for sudden expansions, such as those that are found in spray dryers. Comparisons of relatively rigorous CFD simulations of sudden expansions using different turbulence closure models show significant differences in predictions with different models, showing that even rigorous CFD simulations with long simulation times give different outcomes [36]. As such, a pilot scale unit needed to be operational and evaluated using realistic operating conditions. This required a complete design and construction process, starting with AutoCAD drawings and moving through to collaboration with fabrication teams. Then, the finished units needed to be evaluated to assess how well the construction met the operational requirements.
The design aim was to create a new box unit to be constructed from separable units to aid in cleaning and in assisting further modifications. This consideration led to a design that was made up of a top plate, bottom plate, structural frame, and an “insert” unit. The design needed to be able to support five units above it while being capable of being moved around within the laboratory space. To meet the requirements of a food production prototype and strength requirements, the unit needed to be constructed from stainless steel.
Two types of AutoCAD drawings were required for visualization and construction. First, an assembly view was required to show the whole constructed product that would demonstrate the way in which the different units would be assembled (Figure 9). This view also allowed the bolt holes to be standardized in location given multiple measurements from edges. The second drawing form was the individual part drawings with detailed measurements and material specifications. Of the units, the insert unit was the most complex as it had to be designed so that air would flow through it with no leakage. This feature also combined with having to be bolted to the frames and plates meant that it had the least error tolerance.

7. Results and Discussion: Experimental Comparisons

7.1. Comparison of Designs

The average inlet velocities at the entrance to the dryer were measured to compare the three viable designs from the CFD indications, which were 9.5 m/s for the four-inch design, 10.9 m/s for the six-inch design, and 10.8 m/s for the box design. Considering that the four-inch design changed the cross-sectional area of the flow path with a sudden contraction and expansion and thus caused a restriction to the overall flow, it was expected that these changes (from four-inch to six-inch) would increase the velocity and overall flow rate through the system.

7.2. Wall Deposition Fluxes from the Literature and Those in the Four-Inch Configuration

The conventional chamber design of a cylinder attached to a conical unit has been extensively tested in the literature using wall deposition tests, and the results of these tests are shown in Table 3. These documented experiments were compared with results from the new design. The main conditions were that the feed concentration, temperature, and feed rate were kept constant. The two benchmark concentrations used are the use of feed conditions with 8.8% (solids content in water) skim milk liquid [37] and 30% solids skim milk liquid [38]. The third condition of a higher temperature inlet air flow of 230 °C used 8.8% skim milk [37], and 170 °C for both 18% and 30% skim milk powder [38]. These papers each provide a benchmark for evaluation and analysis of new spray dryer designs and determine the key testing conditions.
For the four-inch design (Case 1), experimental values of the wall deposition fluxes are shown in Table 4.
Comparing the results in Table 3 and Table 4, the four-inch design has reduced the wall deposition fluxes compared with previous cylinder-on-cone designs. The location of the deposits is also important, with deposits near the hot gas inlet being very prone to degradation and fires. Table 4 demonstrates the rationale for the design modification and redesign of Units 3 and 5, in that there are significant wall deposition fluxes in these units due to inertial deposition of particles on the walls. The total wall deposition rate for both chambers one and two has also been measured through the collection of the cleaning water from these chambers, and then measuring the milk concentration and amount in those samples, as shown in Table 5.
These percentages do not add up to 100%, due to the cyclone not capturing all the fine particles, which was evident from observations. Given the results in Table 5, it appears that 170°C and 8.8% skim milk feed concentration are the best operating conditions (of the options studied here) for the four-inch configuration.

7.3. Comparisons with the New Box Design

The terminology for the locations noted in the box design results is similar to the four-inch configuration, as shown in Figure 10.

7.3.1. Condition 1: 8.8 wt% Solids Concentration Feed at 170 °C Inlet Air Temperature

The first comparison is the wall deposition flux values in each unit, which are directly comparable in each design (Table 6). As with the previous conditions, this comparison is important to assess any differences between the box design and the existing four-inch design. Where possible, the same numbers of wall deposition plates for each design have been used in each experiment to ensure consistency in the experimental methods. The tests showed no statistically significant differences compared with the existing four-inch design for either deposition mechanism.
Considering the deposition percentages in Table 7, there is an overall reduction in the wall deposition percentage by up to 1.7% when comparing the experimental averages of the repeated runs in the box design and the existing four-inch design. The previous authors’ work [37] provides many comparable experimental results. These conditions (170 °C and 8.8% skim milk powder feed) provided good comparison points to the results in the other literature. A full factorial analysis of variance has been used here, together with paired t-tests to compare experimentally measured wall deposition fluxes between different designs and operating conditions.
When compared with the literature, the average flux in the new design (Figure 10, Case 3) of 5.94 g/m2/h (as averaged over the units in the whole box design) is below the recorded fluxes from the literature in Table 8. This is evidence that the new box design is an improvement upon the traditional conical design.

7.3.2. Condition 2: 30 wt% Solids Concentration Feed at 170 °C Inlet Air Temperature

As the solids concentration is increased in the feed, it is reasonable to expect the deposition rate to increase. These higher feed concentrations are more normal industrial practice [40] and give higher throughputs and capacities, as well as larger deposition rates.
The different deposition mechanisms for these regions (inertial deposition in unit 3 and the box base and diffusional deposition in the rest of the equipment) have different implications, which therefore need to be treated separately. Table 9 shows that there are very similar deposition behaviors in Units 2 and 3 between the four-inch and the box designs. However, from this point onwards, there is substantially less deposition on all side walls of the dryer for the box design. At the same time, the base of the box on the right side, equivalent to the bottom of Unit 5, gives over double the flux for the old four-inch design. This increase is outweighed by the reduction in fluxes on all the other walls. The visual inspection of the deposits suggested that the particles have undergone inertial deposition, because there is a layer of relatively uniform thickness that forms at the point that the air flow would have directly impacted on the base of the box.
Table 10 confirms the behavior shown from the plate fluxes (Table 9 in that the new box design reduces the amount of wall deposition significantly. While the recovery rate is not the only performance indicator, when combined with the other data, it appears that the box wall deposition behavior with a higher solid loading is significantly better than with the four-inch connection design, particularly for these higher and more industrially-relevant solids feed concentrations.

7.3.3. Condition 3: 8.8 wt% Solids Concentration Feed at 230 °C Inlet Air Temperature

The reason for using a higher inlet air temperature is to assess the behavior of the unit with faster particle drying rates and more particles that are likely to be above the sticky point temperature, where the sticky point temperature is explained in [39,41]. This condition, just like the 30 wt% solids feed situation, gave larger amounts of wall deposits in the original four-inch design, and therefore any reduction in the wall deposition fluxes in the box design would allow more flexible operation.
Table 11 shows that there has been the same or a reduced wall flux in all units, for these experimental conditions where there was a higher likelihood of sticky particles. There has been a very similar deposition performance for all the unit wall deposition fluxes, apart from Unit 7 which increased from a zero flux. As seen from the other tests, the box appears to have a lower wall deposition flux, but in this case, has shown no increase in the deposition flux on the base unlike the other tests. The flux analysis here shows that, for these conditions with higher proportions of particles in the sticky point region, there appears to be less adhesion to the walls and therefore probably fewer wall interactions overall.
When examining the differences between the two tested temperatures in Table 12, the behavior seems counterintuitive compared with a superficial interpretation of the theory for sticky point temperatures, which suggests that the higher temperature would cause more deposition. This behavior has been seen in the literature, where higher temperatures tend to increase the deposition fluxes overall [39]. For these results, with the box design, the trend between the two temperatures does follow sticky point theory overall. This result has probably happened because the drying kinetics are causing the particle surface to dry more rapidly, reducing deposits in the first two units (Units 2 and 3). However, later, in the dryer, the particles have reached a more uniform moisture content (internal and surface), so coupled with the reduction in the mass transfer rate, the thermal energy pushes the particles above the sticky line. This situation can be seen through the reduced wall deposition fluxes in Units 2, 3, the Box, and Unit 6 (lower deposition flux at the higher temperature). At the exit of the drying chambers, in Unit 7, the sticky point behavior increases the deposition flux when the particles move above the sticky point curve (Figure 11). This change was also coupled with an increase in the cyclone deposition percentage from 1.9 to 3.5%, which indicates that the increased gas temperature causes particle temperatures above the sticky point curve. Nevertheless, the results of Figure 11 in the present experiments suggest that the temperature of your particles is already in the sticky region even at low moisture content. Above 120 °C the particles are in a rubbery state, for spray drying experiments at 170 °C and 230 °C. This implies that there may be different deposition mechanism like liquid bridge formation of lactose in skim milk [42]. As these results show that the moisture content of the particles was lower for particles in the 230 °C experiments (1.9% and 0.3% for 170 °C and 0.5% for 230 °C), it is possible that the wall–particle and particle–particle interactions might have been lower, allowing for less deposition in units 6 and 7, and the base of the box. This situation could be true since moisture content increases as particle temperature decreases (higher moisture content at 170 °C and being at the bottom of the box). Higher inlet temperatures may result in lower moisture contents and lower wall deposition [37].
The results in Table 13 support the wall flux data in that the box design reduces the overall amount of deposition and improves the deposition patterns. The most significant result is a total wall deposition rate that is less than half of that seen from the existing four-inch design (Figure 1, Case 1). Further reinforcing this data is a significantly higher recovery rate, particularly under these more severe conditions. For each criterion of importance, the box design has outperformed the existing design.

7.4. Overall Discussion

For all the results, there is a standard pattern that most of the deposition occurs at the bottom of the dryer, and then the highest amounts of wall deposits are on the sides of Unit 3. The new box design could be considered, at worst, to have the same level of wall deposition behavior under the best operating conditions (of the options studied here, 8.8% solids concentration at an inlet air temperature of 170 °C). However, with an increased solids concentration and temperature, there are clear benefits with the smoother flow pattern in the box design, which minimizes wall impacts. Through minimization of the wall impacts in problem areas, the design is more useful for more thermally-sensitive products and is also more economically viable.
When considering that the existing four-inch connection design has shown some advantages compared with standard spray dryer designs reported in the literature [8,37,38,39,43], the box design has continued to make a significant improvement (reduction) in wall deposition behavior and given major benefits in the reduction of wall deposition. In terms of the testing conditions, the case with a 8.8 wt% feed solids concentration and an inlet air temperature of 170 °C has remained the best set of operating conditions (of the options studied here).
The CFD results were used to guide the design methodology for the new box design. CFD needs to be considered as a design tool that has significant uncertainties and difficulties. This situation is due to the large computational loads to model the entire dryer in a fully three-dimensional and time-resolved manner, as required for highly accurate predictions of air flow patterns [44]. The particle fate behavior is also significantly uncertain, because the particle behavior upon impact is still not completely understood, in terms of the effects of velocity and composition of particles, the drying rates of particles, the heterogeneity of the moisture content and temperature within particles, the properties of the wall, and the number of different adhesion forces. While these elements are not fully understood, a CFD model, even if fully converged and temporarily and spatially well resolved, can only indicate the particle behavior approximately. This guidance ability of CFD is where the results may become more useful, because the particle tracks through the dryer are helpful as a guide to assessing pinch or design limitations. For the box design, the particle tracks followed what was seen within experiments, in that the particles had high velocity paths towards the bottom of the unit. This situation leads to the higher deposition flux in this area. The CFD results did not exactly predict the high flux on the base due to these particles being predicted to be cushioned by the airflow at the bottom, instead of sticking like the actual experimental observations.
The time for the experimentation of 40 min was necessary to obtain sufficient samples to measure the deposition fluxes with reasonable accuracy. The difference between this time scale and the time scale for the simulation is therefore not very relevant to the purpose of getting guidance from the simulations for redesigning the system. The fact that the system redesign was successful points to the value of the CFD simulations, which suggested some non-obvious flow features and key deposition zones.
However, the critical analysis of the particle tracks and flow patterns make CFD a powerful design tool. The limitations of using CFD as an exact method for design verification are evident through the observed box side wall fluxes, which were significantly lower than the predictions from the CFD results. The overall particle trends predicted by CFD guided the physical design changes in this study, which on a macroscopic scale were seen in the physical experimentation. The way in which the CFD results are utilized is essential to ensure the utility of CFD as a design guide, through understanding that CFD cannot fully resolve all physical behavior yet, and therefore CFD can usefully predict overall flow patterns and trends. Therefore, the simplified approach was appropriate, rather than implementing a full dryer model, as CFD was used as a guide for design changes. Section 5.1 shows that the observed deposition patterns are sufficient to give meaningful experimental comparisons with the predictions. In addition, the improved performance of the actual design changes supports the trends predicted by the CFD predictions. Without the approximate CFD simulations, these successful design changes would not have been made.

8. Conclusions

The existing dryer design involving two columns was modeled for two potential arrangements, including four-inch and six-inch connections. The flow constriction was suggested to be causing the high deposition fluxes within Units 4 and 5. For both these cases, the model predicted significant velocity variations from the inlet to the pipe unit (either four-inch or six-inch) to the start of the connecting pipe. This situation created problems in real operation due to the inertial deposition of particles on the walls. Particles that did not hit the wall were caught within high turbulence zones that increased the likelihood of wall interactions. The model conditions were set such that any particle interactions were considered to adhere to the walls to emphasize the effects of wall impacts. From Case 1 (four-inch connection) to Case 2 (six-inch connection), approximately half the number of particles were predicted to experience wall interactions. Between Case 1 and Case 3 (Box), particles not interacting with the walls were predicted to increase over sixfold. These predictions were attributed to the smoother flow patterns and therefore less turbulent flows in the box design. The predicted deposition patterns within the box were mostly on the sides and top plate of the box. This led to prototyping based on the box design to evaluate if the predicted wall deposition outcomes would occur in physical testing.
The experimental tests evaluated the effects of the box design on three conditions: best operating conditions (of the options studied here), a higher feed solids concentration in the feed liquid, and a higher inlet air temperature. The optimized case suggested lower wall deposition fluxes, with a 3% higher solids yield, but this was not statistically significant. For the higher solids concentration in the feed, 13% less of the feed solids stuck to the walls. The majority of this deposition was on the base of the box design, but this amount was less than the overall deposition fluxes of units 4 and 5. The higher inlet temperature conditions showed significant potential, with a decrease of 5% in the amount of feed solids that stuck to the walls. Paired t tests found that the only statistically significant change was a wall flux reduction in the 30 wt% solids concentration in the feed. The other results were statistically similar to the previous four-inch design tests. For all the tests, it was observed that most of the deposits were on the bottom of the box. These deposits were found to be caused by inertial forces with very little apparent denaturation even at high inlet air temperatures. The other area with consistently high deposition rates was Unit 3, which gave higher fluxes that adhered to the walls under all conditions.

Author Contributions

Conceptualization, T.A.G.L.; Methodology, T.A.G.L., J.H., X.H., and C.Z.; Software, T.A.G.L. and J.H.; Comparisons, J.H., X.H., and C.Z.; Formal Analysis, J.H. and T.A.G.L.; Investigation, J.H. and C.Z.; Resources, T.A.G.L.; Data Curation, J.H. and T.A.G.L.; Writing—Original Draft Preparation, J.H.; Writing—Review and Editing, T.A.G.L., J.H., and C.Z.; Visualization, J.H.; Supervision, T.A.G.L.; Project Administration, T.A.G.L.; Funding Acquisition, T.A.G.L. All authors have read and agreed to the published version of the manuscript.

Funding

This research was funded by the Australian Research Council under grant number IC140100026.

Acknowledgments

Technical support from the workshops and technical staff in the Schools of Chemical and Biomolecular Engineering and Civil Engineering at the University of Sydney are greatly appreciated, particularly Garry Towell, Sandor Farago, Jeffrey Shi, Tino Kausmann, and Rachel Zhong. Advice on the CFD from Adjunct Professor David Fletcher is also gratefully acknowledged.

Conflicts of Interest

The authors declare no conflicts of interest.

References

  1. Tzvetanov, G. Pharmaceutical Spray Drying Market, (2nd Edition), 2018-2028, 2nd ed.; 2018. [Google Scholar]
  2. Haseley, P.; Oetjen, G.-W. Freeze-Drying; John Wiley & Sons: Hoboken, NJ, USA, 2017. [Google Scholar]
  3. Teixeira, P.; Castro, M.; Kirby, R. Death kinetics of Lactobacillus bulgaricus in a spray drying process. J. Food Prot. 1995, 58, 934–936. [Google Scholar] [CrossRef]
  4. Chávez, B.; Ledeboer, A. Drying of probiotics: Optimization of formulation and process to enhance storage survival. Dry. Technol. 2007, 25, 1193–1201. [Google Scholar] [CrossRef]
  5. Santivarangkna, C.; Kulozik, U.; Foerst, P. Alternative drying processes for the industrial preservation of lactic acid starter cultures. Biotechnol. Prog. 2007, 23, 302–315. [Google Scholar] [CrossRef]
  6. Keshani, S.; Daud, W.R.W.; Nourouzi, M.; Namvar, F.; Ghasemi, M. Spray drying: An overview on wall deposition, process and modeling. J. Food Eng. 2015, 146, 152–162. [Google Scholar] [CrossRef]
  7. Masters, K. Current market-driven spray drying development activities. Dry. Technol. 2004, 22, 1351–1370. [Google Scholar] [CrossRef]
  8. Woo, M.; Daud, W.R.W.; Tasirin, S.M.; Talib, M.Z.M. Controlling food powder deposition in spray dryers: Wall surface energy manipulation as an alternative. J. Food Eng. 2009, 94, 192–198. [Google Scholar] [CrossRef]
  9. Francia, V.; Martin, L.; Bayly, A.E.; Simmons, M.J.H. The Role of Wall Deposition and Re-Entrainment in Swirl Spray Dryers. AiChE J. 2015, 61, 1804–1821. [Google Scholar] [CrossRef] [Green Version]
  10. Petersen, E.E.; Lorentzen, J.; Flink, J. Influence of freeze-drying parameters on the retention of flavor compounds of coffee. J. Food Sci. 1973, 38, 119–122. [Google Scholar] [CrossRef]
  11. Judson King, C. Spray drying: Retention of volatile compounds revisited. Dry. Technol. 1995, 13, 1221–1240. [Google Scholar] [CrossRef]
  12. Anandharamakrishnan, C.; Rielly, C.; Stapley, A. Effects of process variables on the denaturation of whey proteins during spray drying. Dry. Technol. 2007, 25, 799–807. [Google Scholar] [CrossRef]
  13. Haque, M.A.; Chen, J.; Aldred, P.; Adhikari, B. Denaturation and physical characteristics of spray-dried whey protein isolate powders produced in the presence and absence of lactose, trehalose, and polysorbate-80. Dry. Technol. 2015, 33, 1243–1254. [Google Scholar] [CrossRef]
  14. Huang, L.; Mujumdar, A.S. Development of a new innovative conceptual design for horizontal spray dryer via mathematical modeling. Dry. Technol. 2005, 23, 1169–1187. [Google Scholar] [CrossRef]
  15. Jaskulski, M.; Wawrzyniak, P.; Zbiciński, I. CFD simulations of droplet and particle agglomeration in an industrial counter-current spray dryer. Adv. Powder Technol. 2018, 29, 1724–1733. [Google Scholar] [CrossRef]
  16. Jubaer, H.; Afshar, S.; Xiao, J.; Chen, X.D.; Selomulya, C.; Woo, M.W. On the effect of turbulence models on CFD simulations of a counter-current spray drying process. Chem. Eng. Res. Des. 2019, 141, 592–607. [Google Scholar] [CrossRef]
  17. Mujumdar, A.S.; Huang, L.-X.; Chen, X.D. An overview of the recent advances in spray-drying. Dairy Sci. Technol. 2010, 90, 211–224. [Google Scholar] [CrossRef] [Green Version]
  18. Wawrzyniak, P.; Jaskulski, M.; Zbiciński, I.; Podyma, M. CFD modelling of moisture evaporation in an industrial dispersed system. Adv. Powder Technol. 2017, 28, 167–176. [Google Scholar] [CrossRef]
  19. Xiao, J.; Li, Y.; George, O.A.; Li, Z.; Yang, S.; Woo, M.W.; Wu, W.D.; Chen, X.D. Numerical investigation of droplet pre-dispersion in a monodisperse droplet spray dryer. Particuology 2018, 38, 44–60. [Google Scholar] [CrossRef]
  20. Yang, X.; Xiao, J.; Woo, M.-W.; Chen, X.D. Three-dimensional numerical investigation of a mono-disperse droplet spray dryer: Validation aspects and multi-physics exploration. Dry. Technol. 2015, 33, 742–756. [Google Scholar] [CrossRef]
  21. Zbicinski, I. Modeling and scaling up of industrial spray dryers: A review. J. Chem. Eng. Jpn. 2017, 50, 757–767. [Google Scholar] [CrossRef] [Green Version]
  22. Huang, X.; Sormoli, M.E.; Langrish, T.A. Review of some common commercial and noncommercial lab-scale spray dryers and preliminary tests for a prototype new spray dryer. Dry. Technol. 2018, 36, 1900–1912. [Google Scholar] [CrossRef]
  23. Southwell, D.B.; Langrish, T.A.G.; Fletcher, D.F. Use of Computational Fluid Dynamics Techniques to Assess Design Alternatives for the Plenum Chamber of a Small Spray Dryer. Dry. Technol. 2001, 19, 257–268. [Google Scholar] [CrossRef]
  24. Huang, L.; Mujumdar, A. Numerical study of two-stage horizontal spray dryers using computational fluid dynamics. Dry. Technol. 2006, 24, 727–733. [Google Scholar] [CrossRef]
  25. Huang, L.; Kumar, K.; Mujumdar, A. Use of computational fluid dynamics to evaluate alternative spray dryer chamber configurations. Dry. Technol. 2003, 21, 385–412. [Google Scholar] [CrossRef]
  26. Huang, L.; Kumar, K.; Mujumdar, A. A parametric study of the gas flow patterns and drying performance of co-current spray dryer: Results of a computational fluid dynamics study. Dry. Technol. 2003, 21, 957–978. [Google Scholar] [CrossRef]
  27. Francia, V.; Martín, L.; Bayly, A.E.; Simmons, M.J. Agglomeration during spray drying: Airborne clusters or breakage at the walls? Chem. Eng. Sci. 2017, 162, 284–299. [Google Scholar] [CrossRef]
  28. Ali, M.; Mahmud, T.; Heggs, P.; Ghadiri, M.; Bayly, A.; Crosby, M.; Ahmadian, H.; Martindejuan, L.; Alam, Z. Residence time distribution of glass ballotini in isothermal swirling flows in a counter-current spray drying tower. Powder Technol. 2017, 305, 809–815. [Google Scholar] [CrossRef]
  29. Keshani, S.; Montazeri, M.H.; Daud, W.R.W.; Nourouzi, M.M. CFD Modeling of Air Flow on Wall Deposition in Different Spray Dryer Geometries. Dry. Technol. 2015, 33, 784–795. [Google Scholar] [CrossRef]
  30. Oakley, D.; Bahu, R. Computational modelling of spray dryers. Comput. Chem. Eng. 1993, 17, S493–S498. [Google Scholar] [CrossRef]
  31. Oakley, D. Scale-up of spray dryers with the aid of computational fluid dynamics. Dry. Technol. 1994, 12, 217–233. [Google Scholar] [CrossRef]
  32. Jaskulski, M.; Tran, T.T.H.; Tsotsas, E. Design study of printer nozzle spray dryer by computational fluid dynamics modeling. Dry. Technol. 2019, 38, 211–223. [Google Scholar] [CrossRef]
  33. Sormoli, M.E.; Langrish, T.A. The use of a plug-flow model for scaling-up of spray drying bioactive orange peel extracts. Innov. Food Sci. Emerg. Technol. 2016, 37, 27–36. [Google Scholar] [CrossRef]
  34. Southwell, D.; Langrish, T. The effect of swirl on flow stability in spray dryers. Chem. Eng. Res. Des. 2001, 79, 222–234. [Google Scholar] [CrossRef]
  35. Langrish, T.; Fletcher, D. Prospects for the modelling and design of spray dryers in the 21st century. Dry. Technol. 2003, 21, 197–215. [Google Scholar] [CrossRef]
  36. Howard, C.; Gupta, S.; Abbas, A.; Langrish, T.A.; Fletcher, D.F. Proper Orthogonal Decomposition (POD) analysis of CFD data for flow in an axisymmetric sudden expansion. Chem. Eng. Res. Des. 2017, 123, 333–346. [Google Scholar] [CrossRef]
  37. Ozmen, L.; Langrish, T.A.G. An Experimental Investigation of the Wall Deposition of Milk Powder in a Pilot-Scale Spray Dryer. Dry. Technol. 2003, 21, 1253–1272. [Google Scholar] [CrossRef]
  38. Kota, K.; Langrish, T. Fluxes and patterns of wall deposits for skim milk in a pilot-scale spray dryer. Dry. Technol. 2006, 24, 993–1001. [Google Scholar] [CrossRef]
  39. Keshani, S.; Daud, W.R.W.; Woo, M.W.; Nourouzi, M.M.; Talib, M.Z.M.; Chuah, A.L.; Russly, A.R. Reducing the deposition of fat and protein covered particles with low energy surfaces. J. Food Eng. 2013, 116, 737–748. [Google Scholar] [CrossRef]
  40. Písecký, J. Handbook of Milk Powder Manufacture; GEA Process Engineering A/S: Copenhagen, Denmark, 2012. [Google Scholar]
  41. Ozmen, L.; Langrish, T.A.G. Comparison of Glass Transition Temperature and Sticky Point Temperature for Skim Milk Powder. Dry. Technol. 2002, 20, 1177–1192. [Google Scholar] [CrossRef]
  42. Woo, M.W.; Daud, W.R.W.; Tasirin, S.M.; Talib, M.Z.M. Amorphous particle deposition and product quality under different conditions in a spray dryer. Particuology 2008, 6, 265–270. [Google Scholar] [CrossRef]
  43. Keshani, S.; Daud, W.R.W.; Woo, M.W.; Talib, M.Z.M.; Chuah, A.L.; Russly, A.R. Artificial Neural Network Modeling of the Deposition Rate of Lactose Powder in Spray Dryers. Dry. Technol. 2012, 30, 386–397. [Google Scholar] [CrossRef]
  44. Fletcher, D.F.; Langrish, T.A.G. Scale-Adaptive Simulation (SAS) Modelling of a Pilot-Scale Spray Dryer. Chem. Eng. Res. Des. 2009, 87, 1371–1378. [Google Scholar] [CrossRef]
Figure 1. Flow geometry outlines for the CFD case studies (the diameters of both columns for all cases were 300 mm).
Processes 08 00932 g001
Figure 2. Wall mesh arrangement using tetrahedral configurations used in ANSYS v9 (Case 1, existing 4” pipe; Case 2, new 6” connection; Case 3, box design).
Processes 08 00932 g002
Figure 3. Schematic diagram of the spray-drying system, four-inch (100 mm) configuration.
Processes 08 00932 g003
Figure 4. Current deposition pattern in unit 5 when running 8.8% milk powder at 170 °C.
Processes 08 00932 g004
Figure 5. Predicted particle tracks from ANSYS Fluent that stick to side walls in the case 1 simulation.
Processes 08 00932 g005
Figure 6. Predicted particle tracks from ANSYS Fluent that stick to side walls in the case 2 simulation.
Processes 08 00932 g006
Figure 7. Case 3 box design velocity tracks.
Processes 08 00932 g007
Figure 8. Case 3 box design showing tracks of particles that deposit on the wall.
Processes 08 00932 g008
Figure 9. Case 3 box design, complete assembly, and actual construction.
Processes 08 00932 g009
Figure 10. Numbering of units in the new box design.
Processes 08 00932 g010
Figure 11. Sticky point schematic diagram of a hypothetical particle undergoing drying from tests at inlet air temperatures of 170 °C and 230 °C [41].
Processes 08 00932 g011
Table 1. Particle size distribution for the Computational Fluid Dynamics (CFD) simulations.
Particle Size (µm)123456789101112
Cumulative volume fraction undersize0.0560.1310.2240.3340.4530.5700.6760.7650.8350.8860.9230.949
Table 2. Fates of particles predicted by CFD simulation.
Location of DepositCase 1—ExistingCase 2—AlternateCase 3—Box
Inlet100010001000
Outlet70135459
Base1157073
Sides828796201
Top plate/tubes--208
Front plate--33
Back plate--24
Table 3. Typical wall deposition fluxes in spray dryers from the literature, based on previous authors’ research on a previous, modified Niro Minor, pilot-scale spray dryer.
PaperConcentration (%)Temperature (°C)Average Deposition Flux (g h−1m−2)
Ozmen and Langrish [37]8.817013
Ozmen and Langrish [37]8.823012.8
13.1
Kota and Langrish [38]30180Top 74
Middle 105
Bottom 205
Table 4. Experimental overall values of wall deposition fluxes (kg m−2 h−1) in the four-inch design of the spray dryer.
Side WallChamber Bottom
Unit 2Unit 3Unit 4Unit 5Unit 6Unit 712
170 °C average
(5 runs) 8.8%
021920513
230 °C
average
(3 runs) 8.8%
051310811
170 °C
average
(5 runs) 30%
1257178315511058
Table 5. Deposition percentages (relative to the feed) in each part of the four-inch configuration.
TestsChamber 1%Chamber 2%Cyclone %Total %Recovery Rate %
170 °C average (5 runs) 30%10.77.70.518.967.5
170 °C average (5 runs) 8.8%1.62.41.65.778
230 °C average (3 runs) 8.8%4.04.43.712.058
Table 6. Wall deposition fluxes (g/m2/h) for an 8.8 wt% solids concentration feed at an inlet air temperature of 170 °C (RR1 = repeated run 1, RR2 = repeated run 2, RR3 = repeated run 3), comparing the existing (previous) four-inch design with the results from the new box design; no air leakage.
Location4” DesignLocationRR1RR2RR3RR Ave
Unit 2 flux0Unit 2 flux1.81.00.51.1
Unit 3 flux2Unit 3 flux5.72.92.73.8
Unit 4 Wall flux1Column 1 side of box walls flux0.90.80.60.8
Unit 5 Wall flux9Column 2 Side of box walls flux1.51.50.91.3
Unit 6 flux2Unit 6 flux5.92.61.53.3
Unit 7 flux0Unit 7 flux3.25.52.13.6
Table 7. Wall deposition percentages for repeated experimental runs at 8.8 wt% solids concentration and an inlet air temperature of 170 °C (RR1 = run 1, RR2 = run 2, RR3 = run 3). The standard error for the deposition percentages was 0.19%.
Location4” DesignLocationRR1RR2RR3RR Average
Column 1 Wall deposition (%)1.6Column 1 Wall deposition (%)0.81.00.50.8
Column 2 Wall deposition (%)2.4Column 2 Wall deposition (%)0.30.40.30.4
Box Wall deposition (%)0.80.60.70.7
Cyclone wall deposition (%)1.6Cyclone wall deposition (%)2.12.02.42.2
Recovery rate (yield, %)78Recovery rate (yield, %)80.880.380.980.7
Moisture content (100 kg water/kg dry solids)2.71.41.61.9
Total wall deposition (%)5.7Total wall deposition (%)4.04.13.94.0
Table 8. Literature wall fluxes in spray dryers for an inlet gas temperature of 170 °C and an 8.8% skim milk powder feed.
PaperConcentration
(%)
Temperature
(°C)
Average Deposition Flux
(g/m2/h)
Ozmen and Langrish [37]8.817013
Ozmen and Langrish [37]8.823012.8
13.1
Kota and Langrish [38]30170Top 74
Middle 105
Bottom 205
Woo, Daud, Tasirin and Talib [8]20% Sucrose Maltodextrin170Top 53.3
Middle 68.4
Bottom 63
Keshani, et al. [39]Skim milk (8.8%)180Top 20
Middle 4
Bottom 15
Table 9. Wall deposition fluxes (g/m2/h) for a 30 wt% solids concentration feed at an inlet air temperature of 170 °C (RR1 = run 1, RR2 = run 2, RR3 = run 3). The standard errors were 13 g/m2/h for Unit 3 and the base of the box and 2 g/m2/h for all other fluxes.
Location4” DesignLocationRR1RR2RR3Average
Unit 2 flux12Unit 2 flux2.08.14.95.0
Unit 3 flux57Unit 3 flux57665961
Unit 4 Wall flux17Column 1 side of box walls flux4.75.25.04.9
Unit 5 Wall flux83Column 2 side of box walls flux4.96.54.85.4
Unit 6 flux15Unit 6 flux8.53.85.45.9
Unit 7 flux5Unit 7 flux2.10.03.71.9
Unit 4 base flux110Base of box left side (C1) flux97130120120
Unit 5 base flux58Base of box right side (C2) flux110140120120
Table 10. Overall deposition percentages for a 30 wt% solids concentration feed at an inlet air temperature of 170 °C (RR1 = run 1, RR2 = run 2, RR3 = run 3). The standard error for the deposition percentages is 1%.
Description4” DesignDescriptionRR1RR2RR3Average
Column 1 Wall deposition (%)10.7Column 1 Wall deposition (%)2.22.33.22.6
Column 2 Wall deposition (%)7.7Column 2 Wall deposition (%)0.20.10.20.2
Box Wall deposition (%)1.82.12.02.0
Cyclone wall deposition (%)0.5Cyclone wall deposition (%)1.80.90.71.1
Recovery rate (yield, %)71Recovery rate (yield, %)79.375.977.477.5
Moisture content (100 kg water/kg dry solids)0.75Moisture content (100 kg water/kg dry solids)0.20.20.50.3
Total wall deposition (%)18.9Total wall deposition (%)6.15.46.25.9
Table 11. Wall deposition fluxes (g/m2/h) for a 8.8 wt% solids concentration feed at an inlet air temperature of 230 °C (RR1 = run 1, RR2 = run 2, RR3 = run 3). The standard errors were 1.87 g/m2/h for Unit 3 and the base of the box and 0.53 g/m2/h for all other fluxes.
Location4” DesignLocationRR1RR2RR3Average
Unit 2 flux0Unit 2 flux0.00.00.40.1
Unit 3 flux5Unit 3 flux3.91.65.73.7
Unit 4 Wall flux1Column 1 side of box walls flux2.20.31.51.3
Unit 5 Wall flux3Column 2 Side of box walls flux2.70.40.81.3
Unit 6 flux1Unit 6 flux2.11.30.81.4
Unit 7 flux0Unit 7 flux0.21.22.51.3
Unit 4 base flux8Base of box left side (C1) flux9.06.510.48.6
Unit 5 base flux11Base of box right side (C2) flux8.26.59.68.1
Table 12. Comparison of sticky effects between 170 and 230 °C (experimental averages using repeated runs with no air leaks). Fluxes are given in units of g/m2/h.
LocationBox 170 °CBox 230 °C
Unit 2 flux1.10.1
Unit 3 flux3.83.7
Column 1 side of box walls flux0.81.3
Column 2 side of box walls flux1.31.3
Unit 6 flux3.31.4
Unit 7 flux3.61.3
Base of box left side flux11.58.6
Base of box right side flux10.78.1
Table 13. Overall deposition percentages for an 8.8 wt% solids concentration feed at an inlet air temperature of 230 °C (RR1 = run 1, RR2 = run 2, RR3 = run 3). The standards error for the deposition percentages is 0.6%.
DescriptionExistingDescriptionRR1RR2RR3Average
Column 1 Wall deposition %4.0Column 1 Wall deposition%0.60.40.90.6
Column 2 Wall deposition %4.4Column 2 Wall deposition%0.60.40.60.5
Box Wall deposition%0.60.40.60.5
Cyclone wall deposition %3.7Cyclone wall deposition%2.24.54.03.5
Recovery rate58.0Recovery rate70.271.273.171.5
Moisture content moisture ratio0.30.70.40.5
Total wall deposition %12.0Total wall deposition%4.05.66.15.2

