Evolution of Specific Heat Capacity with Temperature for Typical Supports Used for Heterogeneous Catalysts


 ,
, 


Abstract
:
1. Introduction
2. Materials and Methods
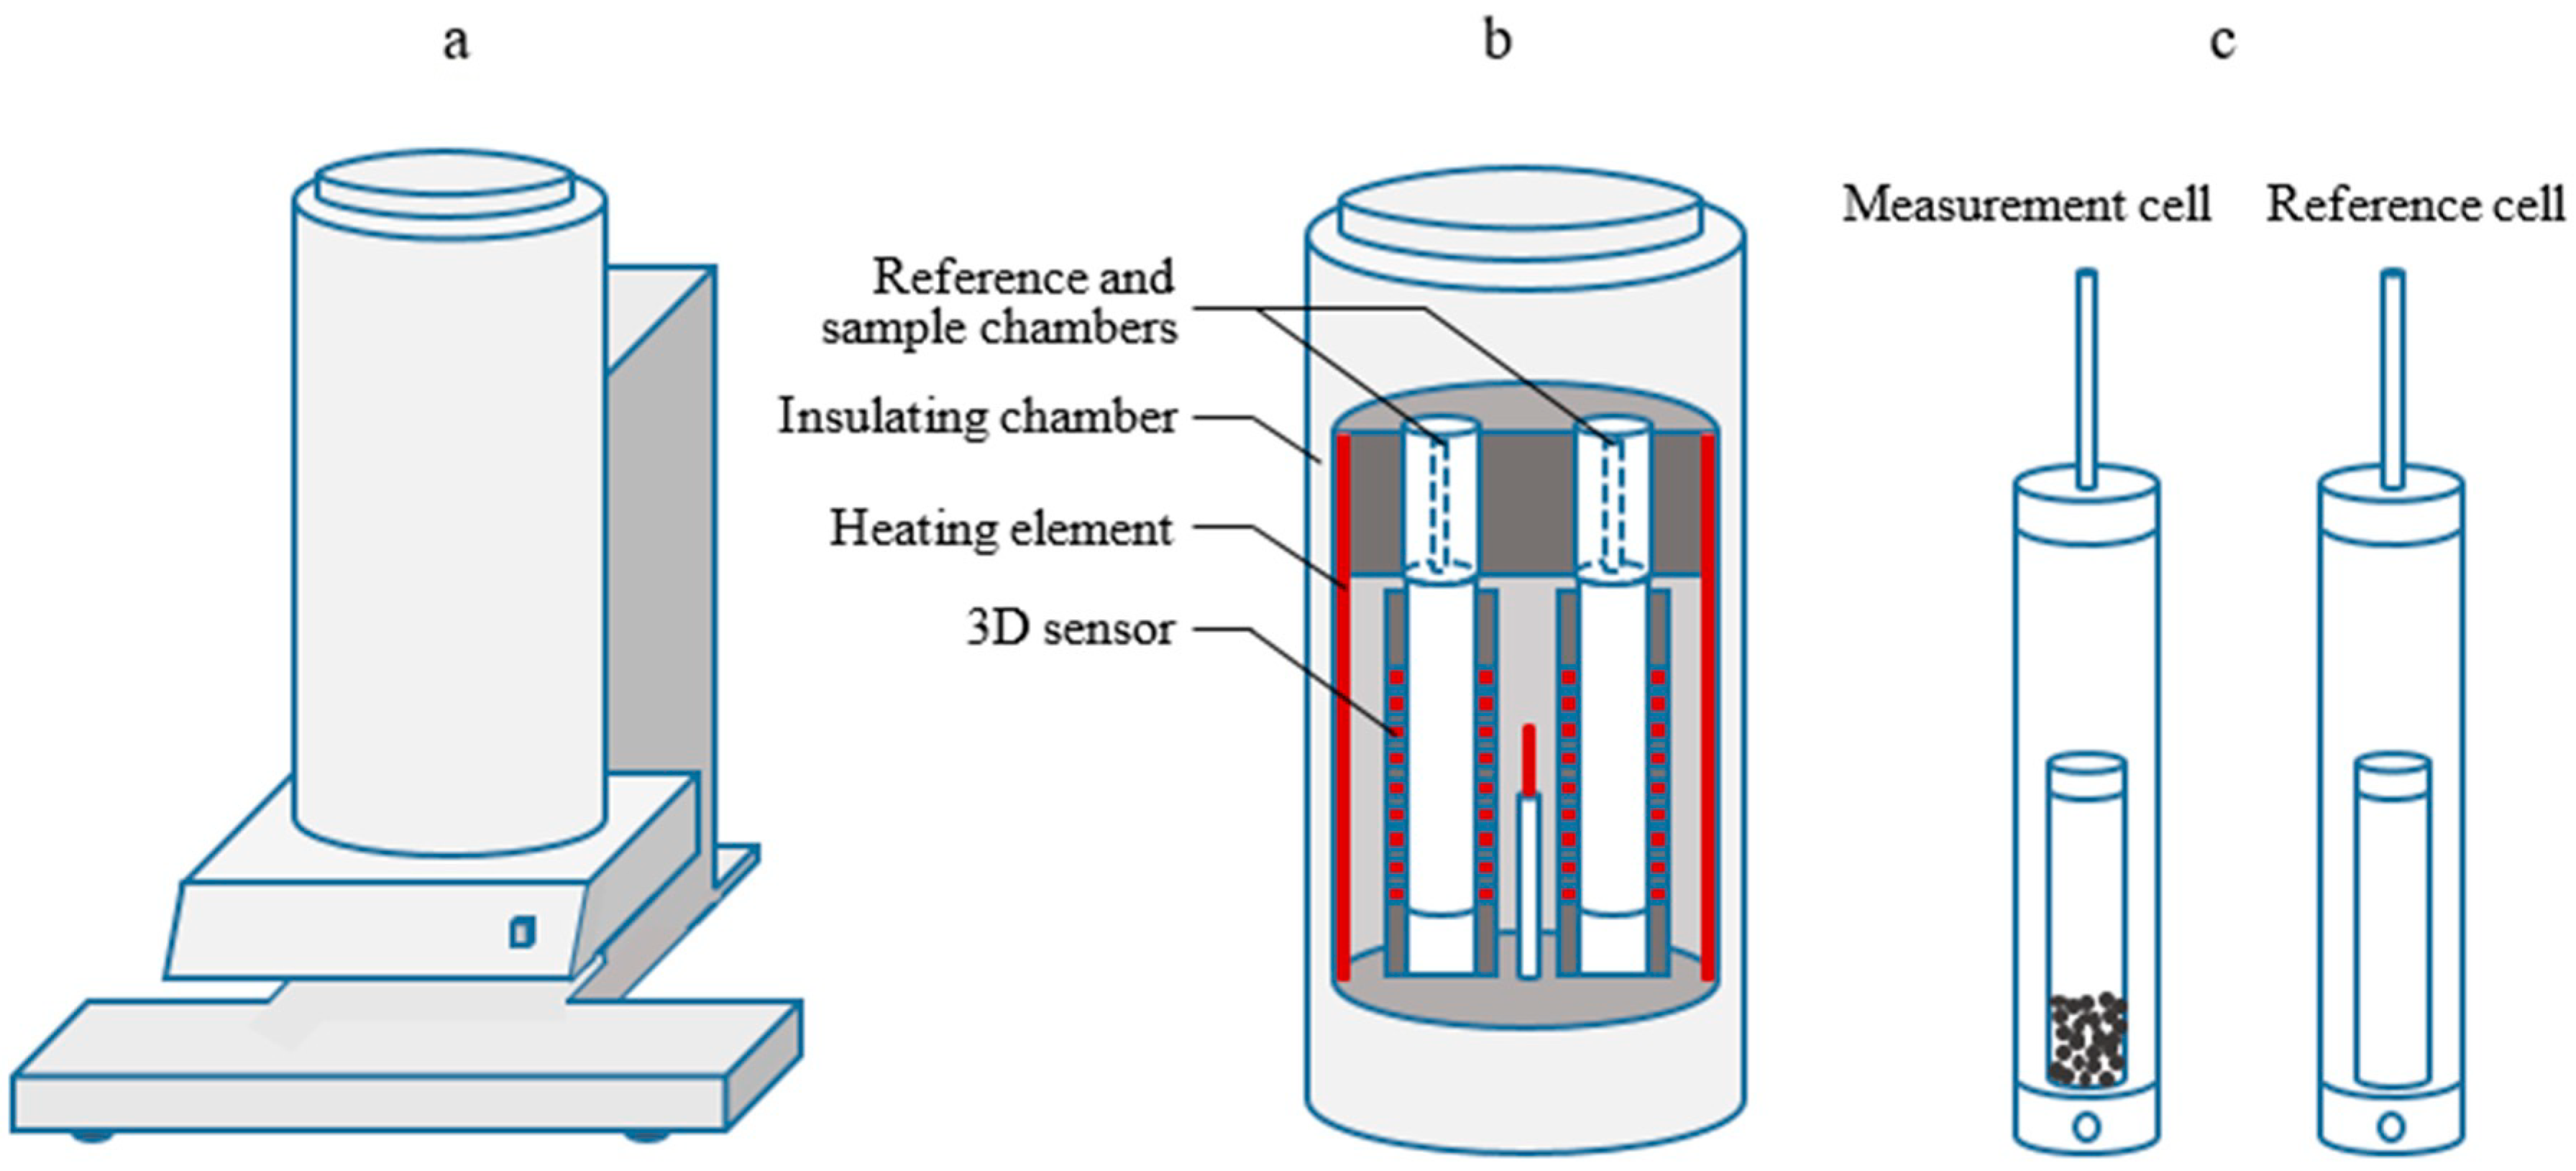
2.1. Calorimetric Reactor Rystem
2.2. Materials
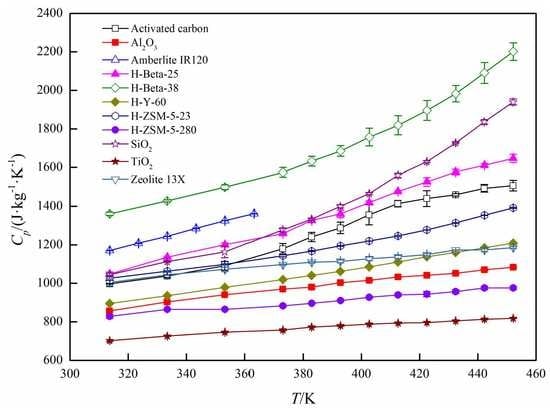
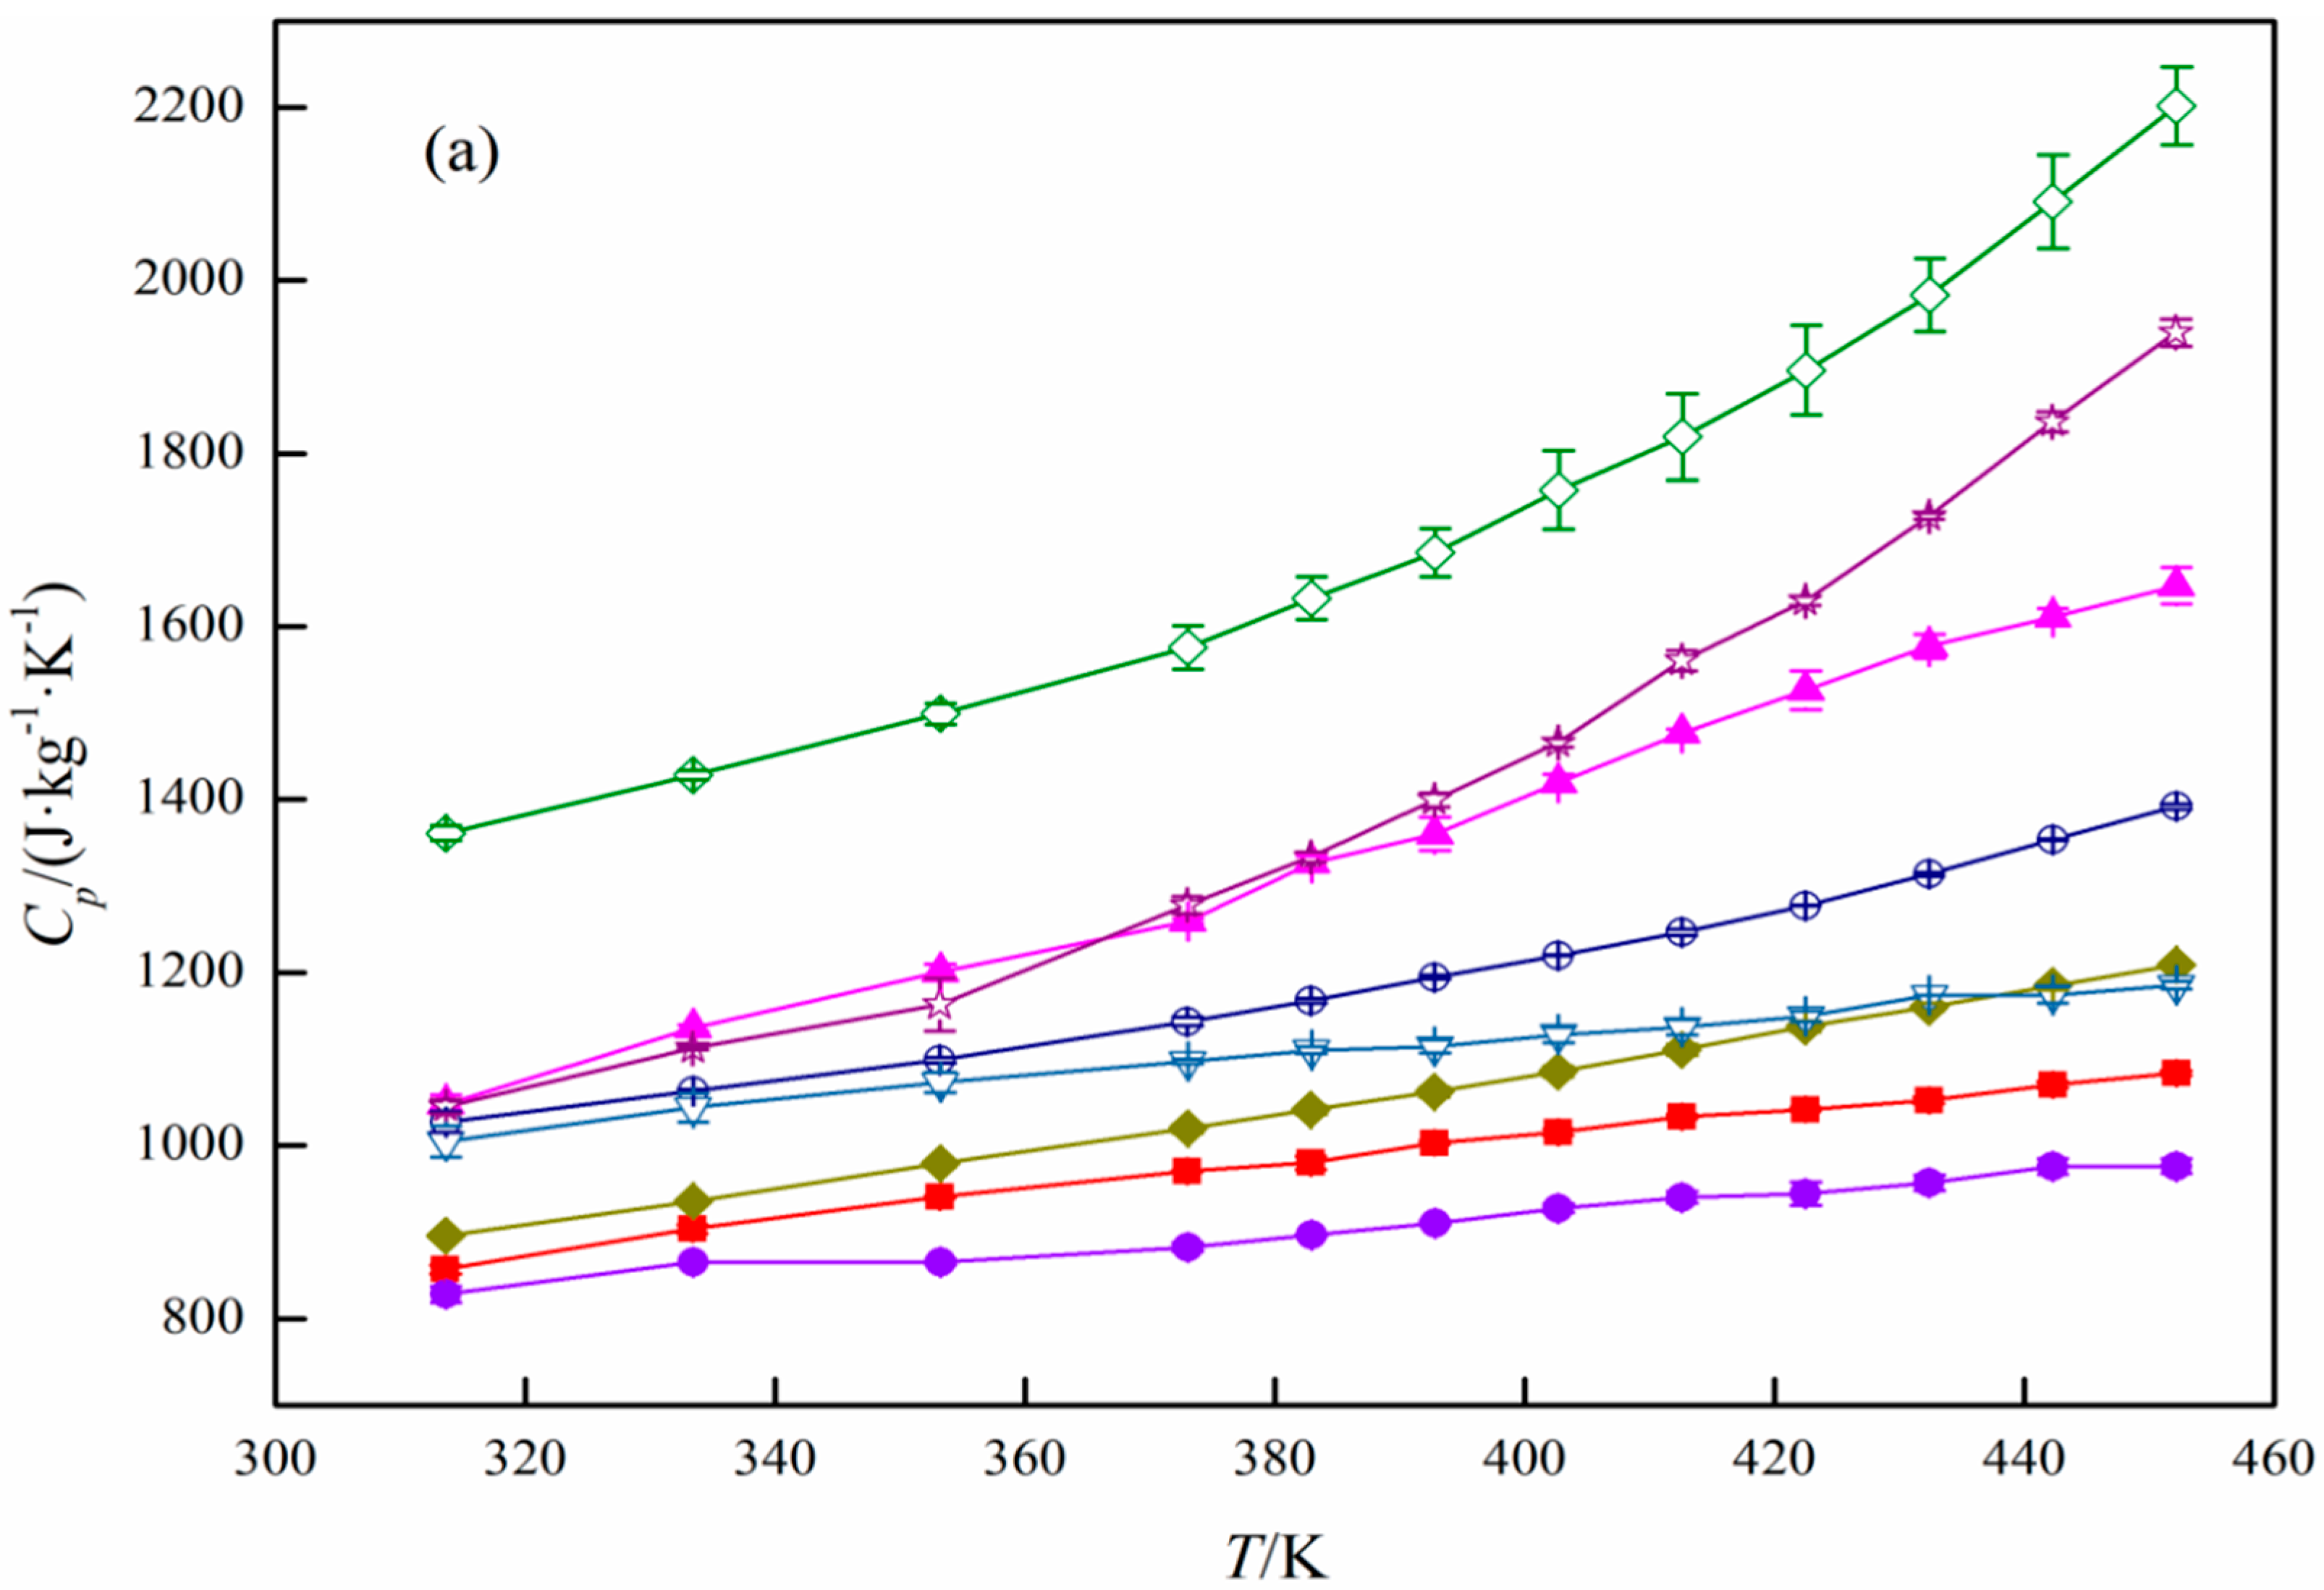
3. Results and Discussion
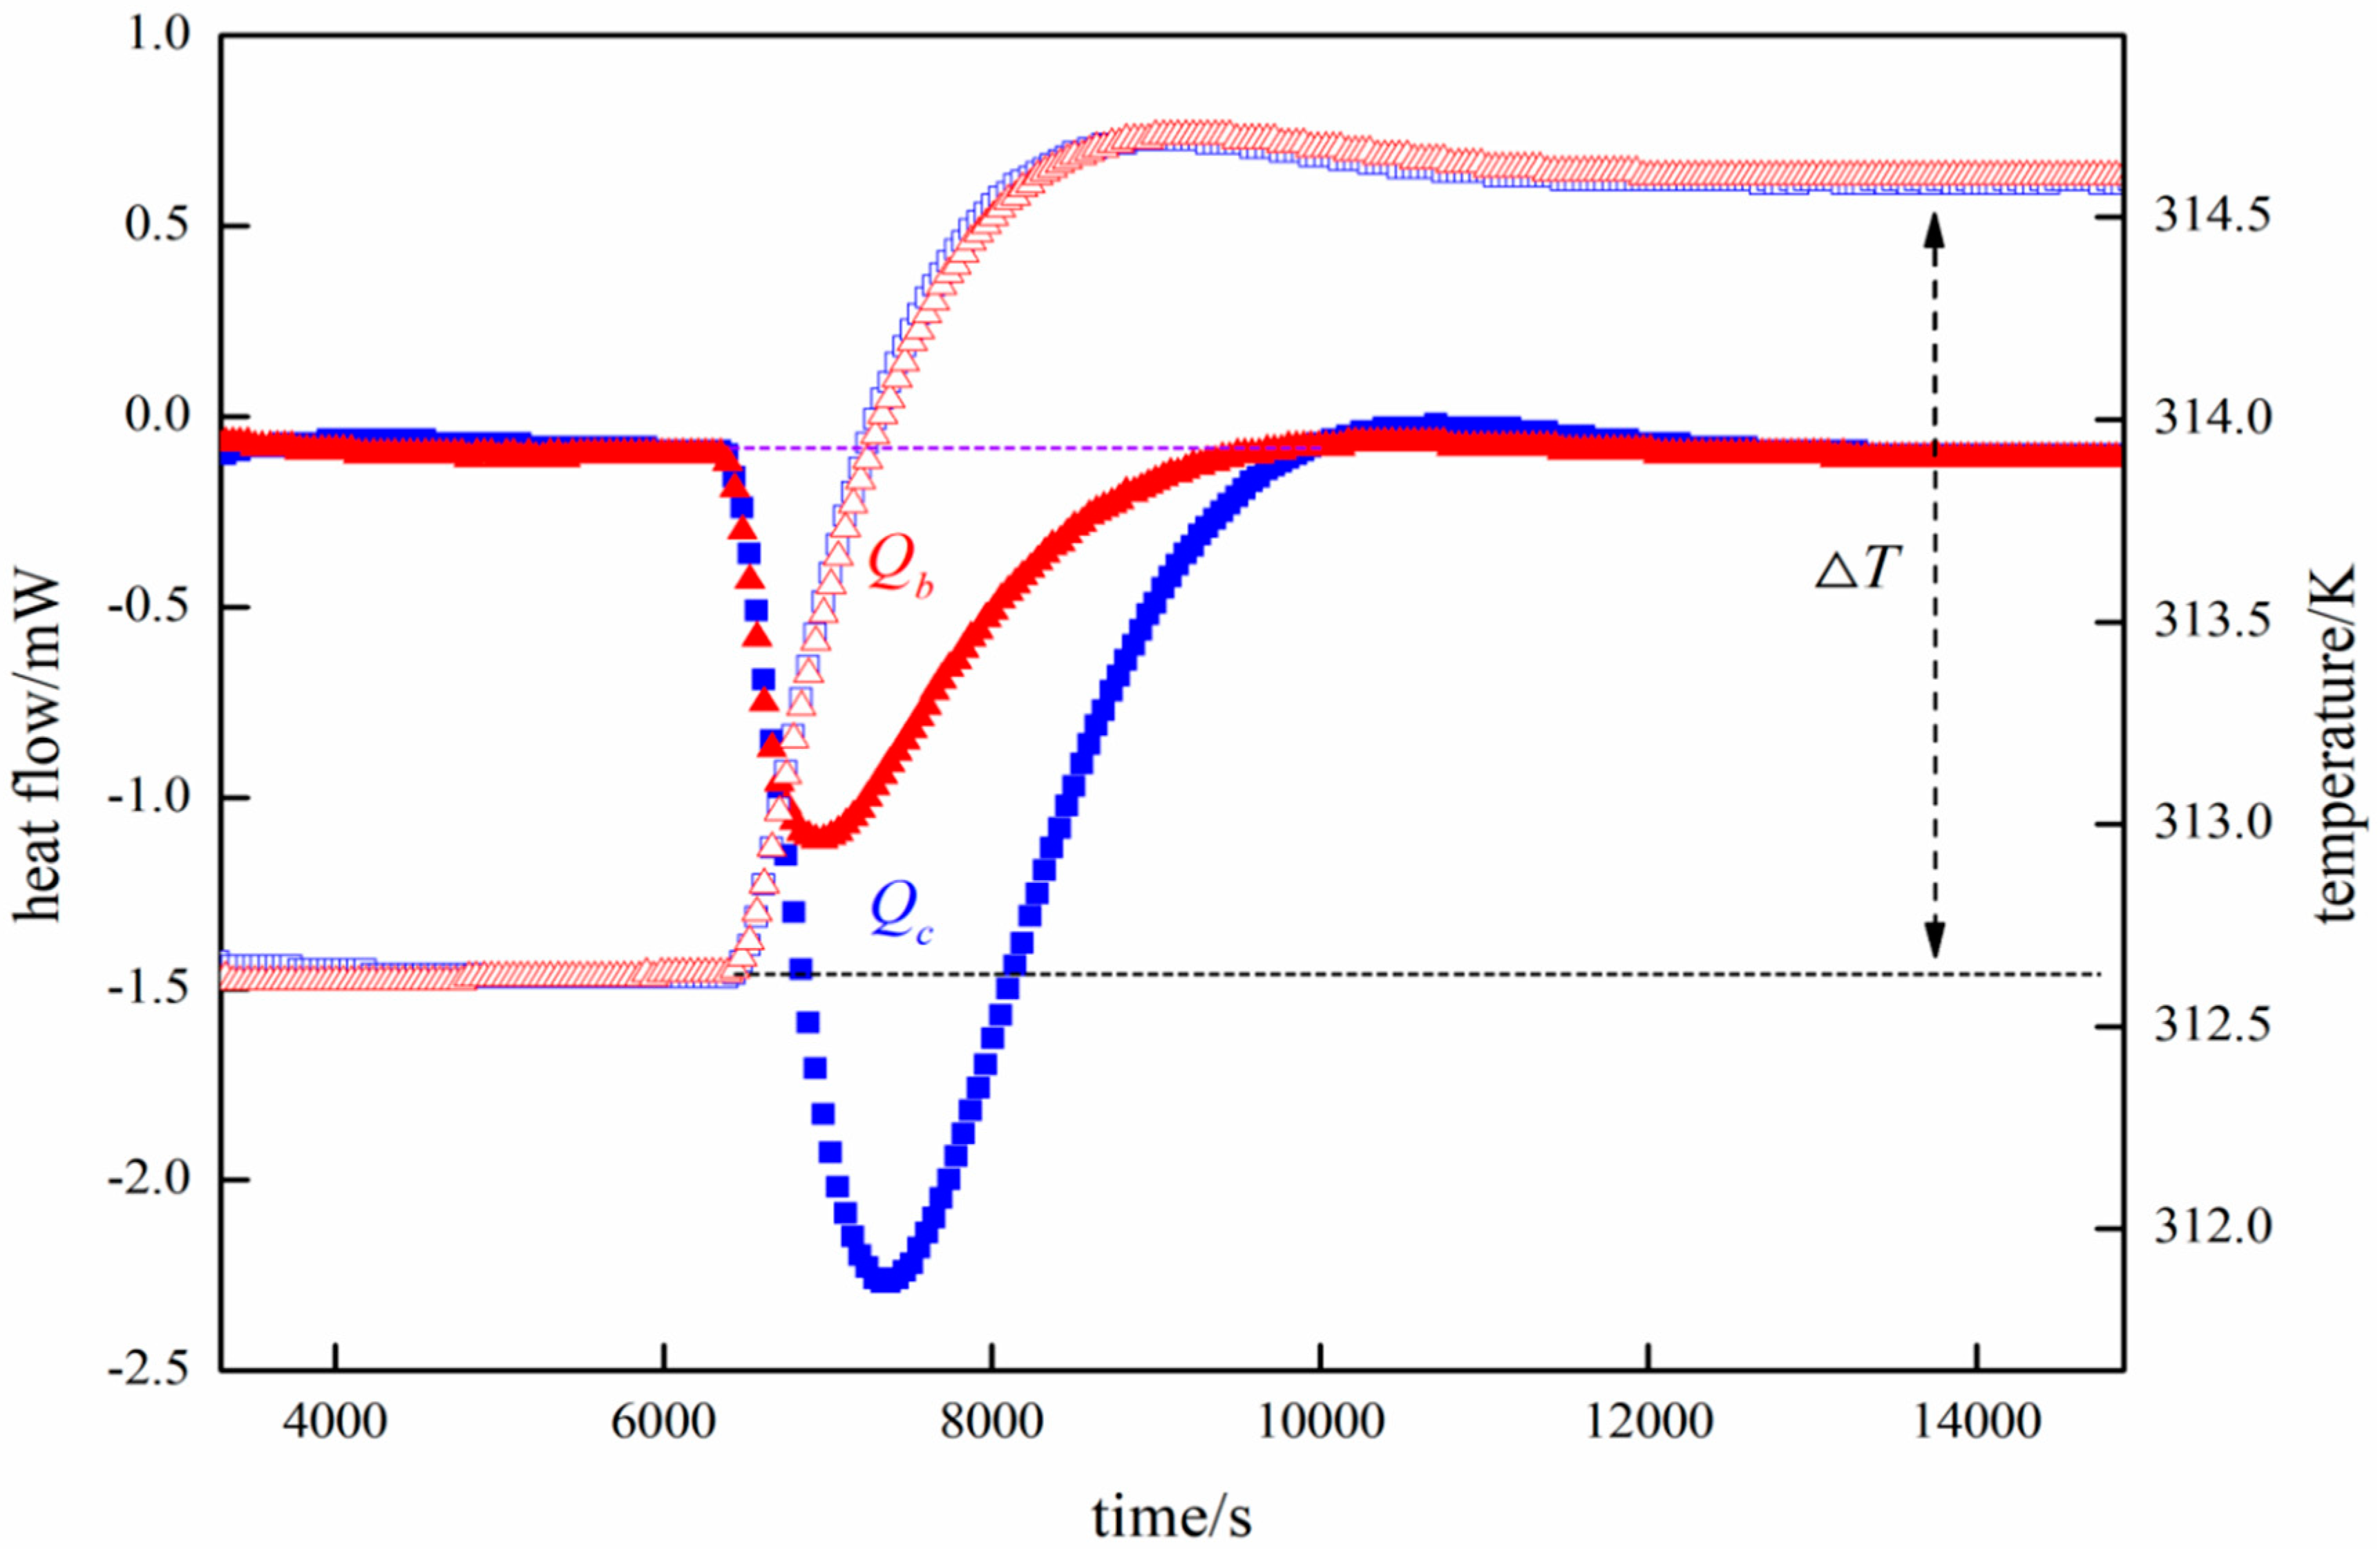
Specific Heat Capacity Calculation
4. Conclusions
Author Contributions
Funding
Conflicts of Interest
References
- Talukdar, K.; Helmly, S.; Schulze, M.; Sanchez, D.G.; Handl, M.; Hiesgen, R.; Kraut, J.; Friedrich, K.A. Enveloping of catalyst powder by ionomer for dry spray coating in polymer electrolyte membrane fuel cells. J. Power Sources 2019, 424, 82–90. [Google Scholar] [CrossRef]
- Bossion, A.; Heifferon, K.V.; Meabe, L.; Zivic, N.; Taton, D.; Hedrick, J.L.; Long, T.E.; Sardón, H. Opportunities for organocatalysis in polymer synthesis via step-growth methods. Prog. Polym. Sci. 2019, 90, 164–210. [Google Scholar] [CrossRef]
- Xie, J.; Zhang, X.; Xie, J.; Xu, J.; Pan, L.; Zou, J.-J. Acid-catalyzed rearrangement of tetrahydrotricyclopentadiene for synthesis of high density alkyl-diamondoid fuel. Fuel 2019, 239, 652–658. [Google Scholar] [CrossRef]
- Givirovskiy, G.; Ruuskanen, V.; Ojala, L.S.; Lienemann, M.; Kokkonen, P.; Ahola, J. Electrode material studies and cell voltage characteristics of the in situ water electrolysis performed in a pH-neutral electrolyte in bioelectrochemical systems. Heliyon 2019, 5, e01690. [Google Scholar] [CrossRef] [Green Version]
- Bengyella, L.; Iftikhar, S.; Nawaz, K.; Fonmboh, D.J.; Yekwa, E.L.; Jones, R.C.; Njanu, Y.M.T.; Roy, P. Biotechnological application of endophytic filamentous bipolaris and curvularia: A review on bioeconomy impact. World J. Microbiol. Biotechnol. 2019, 35, 69. [Google Scholar] [CrossRef] [PubMed]
- Sudarsanam, P.; Zhong, R.; Bosch, S.V.D.; Coman, S.M.; Parvulescu, V.I.; Sels, B.F. Functionalised heterogeneous catalysts for sustainable biomass valorisation. Chem. Soc. Rev. 2018, 47, 8349–8402. [Google Scholar] [CrossRef] [Green Version]
- De Clercq, R.; Dusselier, M.; Sels, B.F. Heterogeneous catalysis for bio-based polyester monomers from cellulosic biomass: Advances, challenges and prospects. Green Chem. 2017, 19, 5012–5040. [Google Scholar] [CrossRef]
- Lee, A.; Bennett, J.; Manayil, J.C.; Wilson, K. Heterogeneous catalysis for sustainable biodiesel production via esterification and transesterification. Chem. Soc. Rev. 2014, 43, 7887–7916. [Google Scholar] [CrossRef] [Green Version]
- Zhong, Q.; Dong, X.; Zhao, Y.; Zhang, H.; Wang, J.; Guo, H.; Shen, J.; Gong, M. Thermodynamic properties of (R1234yf + R290): Isochoric pρTx and specific heat capacity c measurements and an equation of state. J. Chem. Thermodyn. 2019, 129, 36–43. [Google Scholar] [CrossRef]
- Ma, B.; Kumar, N.; Kuchibhotla, A.; Banerjee, D. Experimental Measurement of the Effect of Particle Concentration on the Specific Heat Capacity of Silica Nanofluids. In Proceedings of the 2018 17th IEEE Intersociety Conference on Thermal and Thermomechanical Phenomena in Electronic Systems (ITherm), San Diego, CA, USA, 29 May–1 June 2018; pp. 246–251. [Google Scholar]
- Lv, S.; Zhao, X.; Liu, Y. Measurements for isobaric specific heat capacity of ethyl fluoride (HFC-161) in liquid and vapor phase. Fluid Phase Equilibria 2016, 427, 429–437. [Google Scholar] [CrossRef]
- Calvin, J.; Asplund, M.; Zhang, Y.; Huang, B.; Woodfield, B.F. Heat capacity and thermodynamic functions of γ-Al2O3. J. Chem. Thermodyn. 2017, 112, 77–85. [Google Scholar] [CrossRef] [Green Version]
- Voskov, A.L.; Voronin, G.F.; Kutsenok, I.B.; Kozin, N.Y. Thermodynamic database of zeolites and new method of their thermodynamic properties evaluation for a wide temperature range. Calphad 2019, 66, 101623. [Google Scholar] [CrossRef]
- O’Neill, M.J. Measurement of Specific Heat Functions by Differential Scanning Calorimetry. Anal. Chem. 1966, 38, 1331–1336. [Google Scholar] [CrossRef]
- Chen, F.; Zhao, T.; Liang, J.; Cao, W.; Jiang, Y.; Xu, X. Specific Heat Capacity Measurements of Frying Oil Using Modulated Differential Scanning Calorimetry. J. Am. Oil Chem. Soc. 2019, 96, 1011–1018. [Google Scholar] [CrossRef]
- Kuprava, A.; Saenko, I.; Fabrichnaya, O. Heat capacity measurement of C14–ZrMn2 and thermodynamic re-assessment of the Mn–Zr system. Calphad 2020, 68, 101745. [Google Scholar] [CrossRef]
- Losada-Pérez, P.; Tripathi, C.S.P.; Leys, J.; Cordoyiannis, G.; Glorieux, C.; Thoen, J. Measurements of Heat Capacity and Enthalpy of Phase Change Materials by Adiabatic Scanning Calorimetry. Int. J. Thermophys. 2011, 32, 913–924. [Google Scholar] [CrossRef] [Green Version]
- Quick, C.; Schawe, J.; Uggowitzer, P.; Pogatscher, S. Measurement of specific heat capacity via fast scanning calorimetry—Accuracy and loss corrections. Thermochim. Acta 2019, 677, 12–20. [Google Scholar] [CrossRef]
- Coulier, Y.; Tremaine, P.R. Standard partial molar heat capacities and enthalpies of formation of aqueous aluminate under hydrothermal conditions from integral heat of solution measurements. J. Chem. Thermodyn. 2014, 78, 79–92. [Google Scholar] [CrossRef]
- Schrödle, S.; Königsberger, E.; May, P.M.; Hefter, G. Heat capacities of aqueous sodium hydroxide/aluminate mixtures and prediction of the solubility constant of boehmite up to 300 °C. Geochim. Cosmochim. Acta 2010, 74, 2368–2379. [Google Scholar] [CrossRef] [Green Version]
- Roháč, V.; Růžička, V.; Růžička, K.; Poledníček, M.; Aim, K.; Jose, J.; Zábranský, M. Recommended vapour and sublimation pressures and related thermal data for chlorobenzenes. Fluid Phase Equilibria 1999, 157, 121–142. [Google Scholar] [CrossRef]
- Reichmann, T.L.; Li, D.; Cupid, D.M. Heat capacities and an updated thermodynamic model for the Li-Sn system. Phys. Chem. Chem. Phys. 2018, 20, 22856–22866. [Google Scholar] [CrossRef] [PubMed]
- Niu, H.; Chen, S.; Jin, S.; Li, B.; Li, X.; Wang, J.; Ma, X.; Bao, F.; Li, L. Preparation, nonisothermal decomposition kinetics, heat capacity, and safety parameters of TKX-50-based PBX. J. Therm. Anal. Calorim. 2017, 131, 3193–3199. [Google Scholar] [CrossRef]
- Wilcock, E.; Rogers, R. A review of the phi factor during runaway conditions. J. Loss Prev. Process. Ind. 1997, 10, 289–302. [Google Scholar] [CrossRef]
- Cai, X.; Aissa, K.A.; Estel, L.; Leveneur, S. Investigation of the Physicochemical Properties for Vegetable Oils and Their Epoxidized and Carbonated Derivatives. J. Chem. Eng. Data 2018, 63, 1524–1533. [Google Scholar] [CrossRef]
- Ariba, H.; Wang, Y.; Devouge-Boyer, C.; Stateva, R.P.; Leveneur, S. Physicochemical Properties for the Reaction Systems: Levulinic Acid, Its Esters, and γ-Valerolactone. J. Chem. Eng. Data 2020, 65, 3008–3020. [Google Scholar] [CrossRef]
- Tan, Z.-C.; Zhang, J.-B.; Shang-He, M. A Low-temperature Automated Adiabatic Calorimeter Heat Capacities of High-purity Graphite and Polystyrene. J. Therm. Anal. Calorim. 1999, 55, 283–289. [Google Scholar] [CrossRef]
- Kowalski, B. Determination of specific heats of some edible oils and fats by differential scanning calorimetry. J. Therm. Anal. Calorim. 1988, 34, 1321–1326. [Google Scholar] [CrossRef]
- Stewart, W.E.; Caracotsios, M. Athena Visual Studio. Available online: www.athenavisual.com (accessed on 10 June 2020).


| Type | Physical Form | SiO2/Al2O3 (mol/mol) | Manufacturer | |
|---|---|---|---|---|
| Activated carbon | activated carbon | powder | - | Chemviron |
| Al2O3 | aluminum oxide | powder | - | Acros Organics |
| Amberlite IR120, H-form(53.0–58.0% moisture) | Ion-exchange resin | bead | - | Acros Organics |
| H-Beta-25 | zeolite | powder | 25 | Zeolyst International |
| H-Beta-38 | zeolite | powder | 38 | Zeolyst International |
| H-Y-60 | zeolite | powder | 60 | Alfa Aesar |
| H-ZSM-5-23 | zeolite | powder | 23 | Zeolyst International |
| H-ZSM-5-280 | zeolite | powder | 280 | Zeolyst International |
| SiO2 | silicon dioxide | powder | - | Merck |
| TiO2 | titanium dioxide | pellet | - | Degussa |
| Zeolite 13X | zeolite | powder | 1.8 | Fluka |
| m/g | T/K | |
|---|---|---|
| Activated carbon | 0.98 | 313–453 |
| Al2O3 | 2.00 | 313–453 |
| Amberlite IR120, H-form | 1.95 | 313–363 |
| H-Beta-25 | 0.48 | 313–453 |
| H-Beta-38 | 1.28 | 313–453 |
| H-Y-60 | 0.65 | 313–453 |
| H-ZSM-5-23 | 1.09 | 313–453 |
| H-ZSM-5-280 | 1.55 | 313–453 |
| SiO2 | 1.37 | 313–453 |
| TiO2 | 3.09 | 313–453 |
| Zeolite 13X | 1.41 | 313–453 |
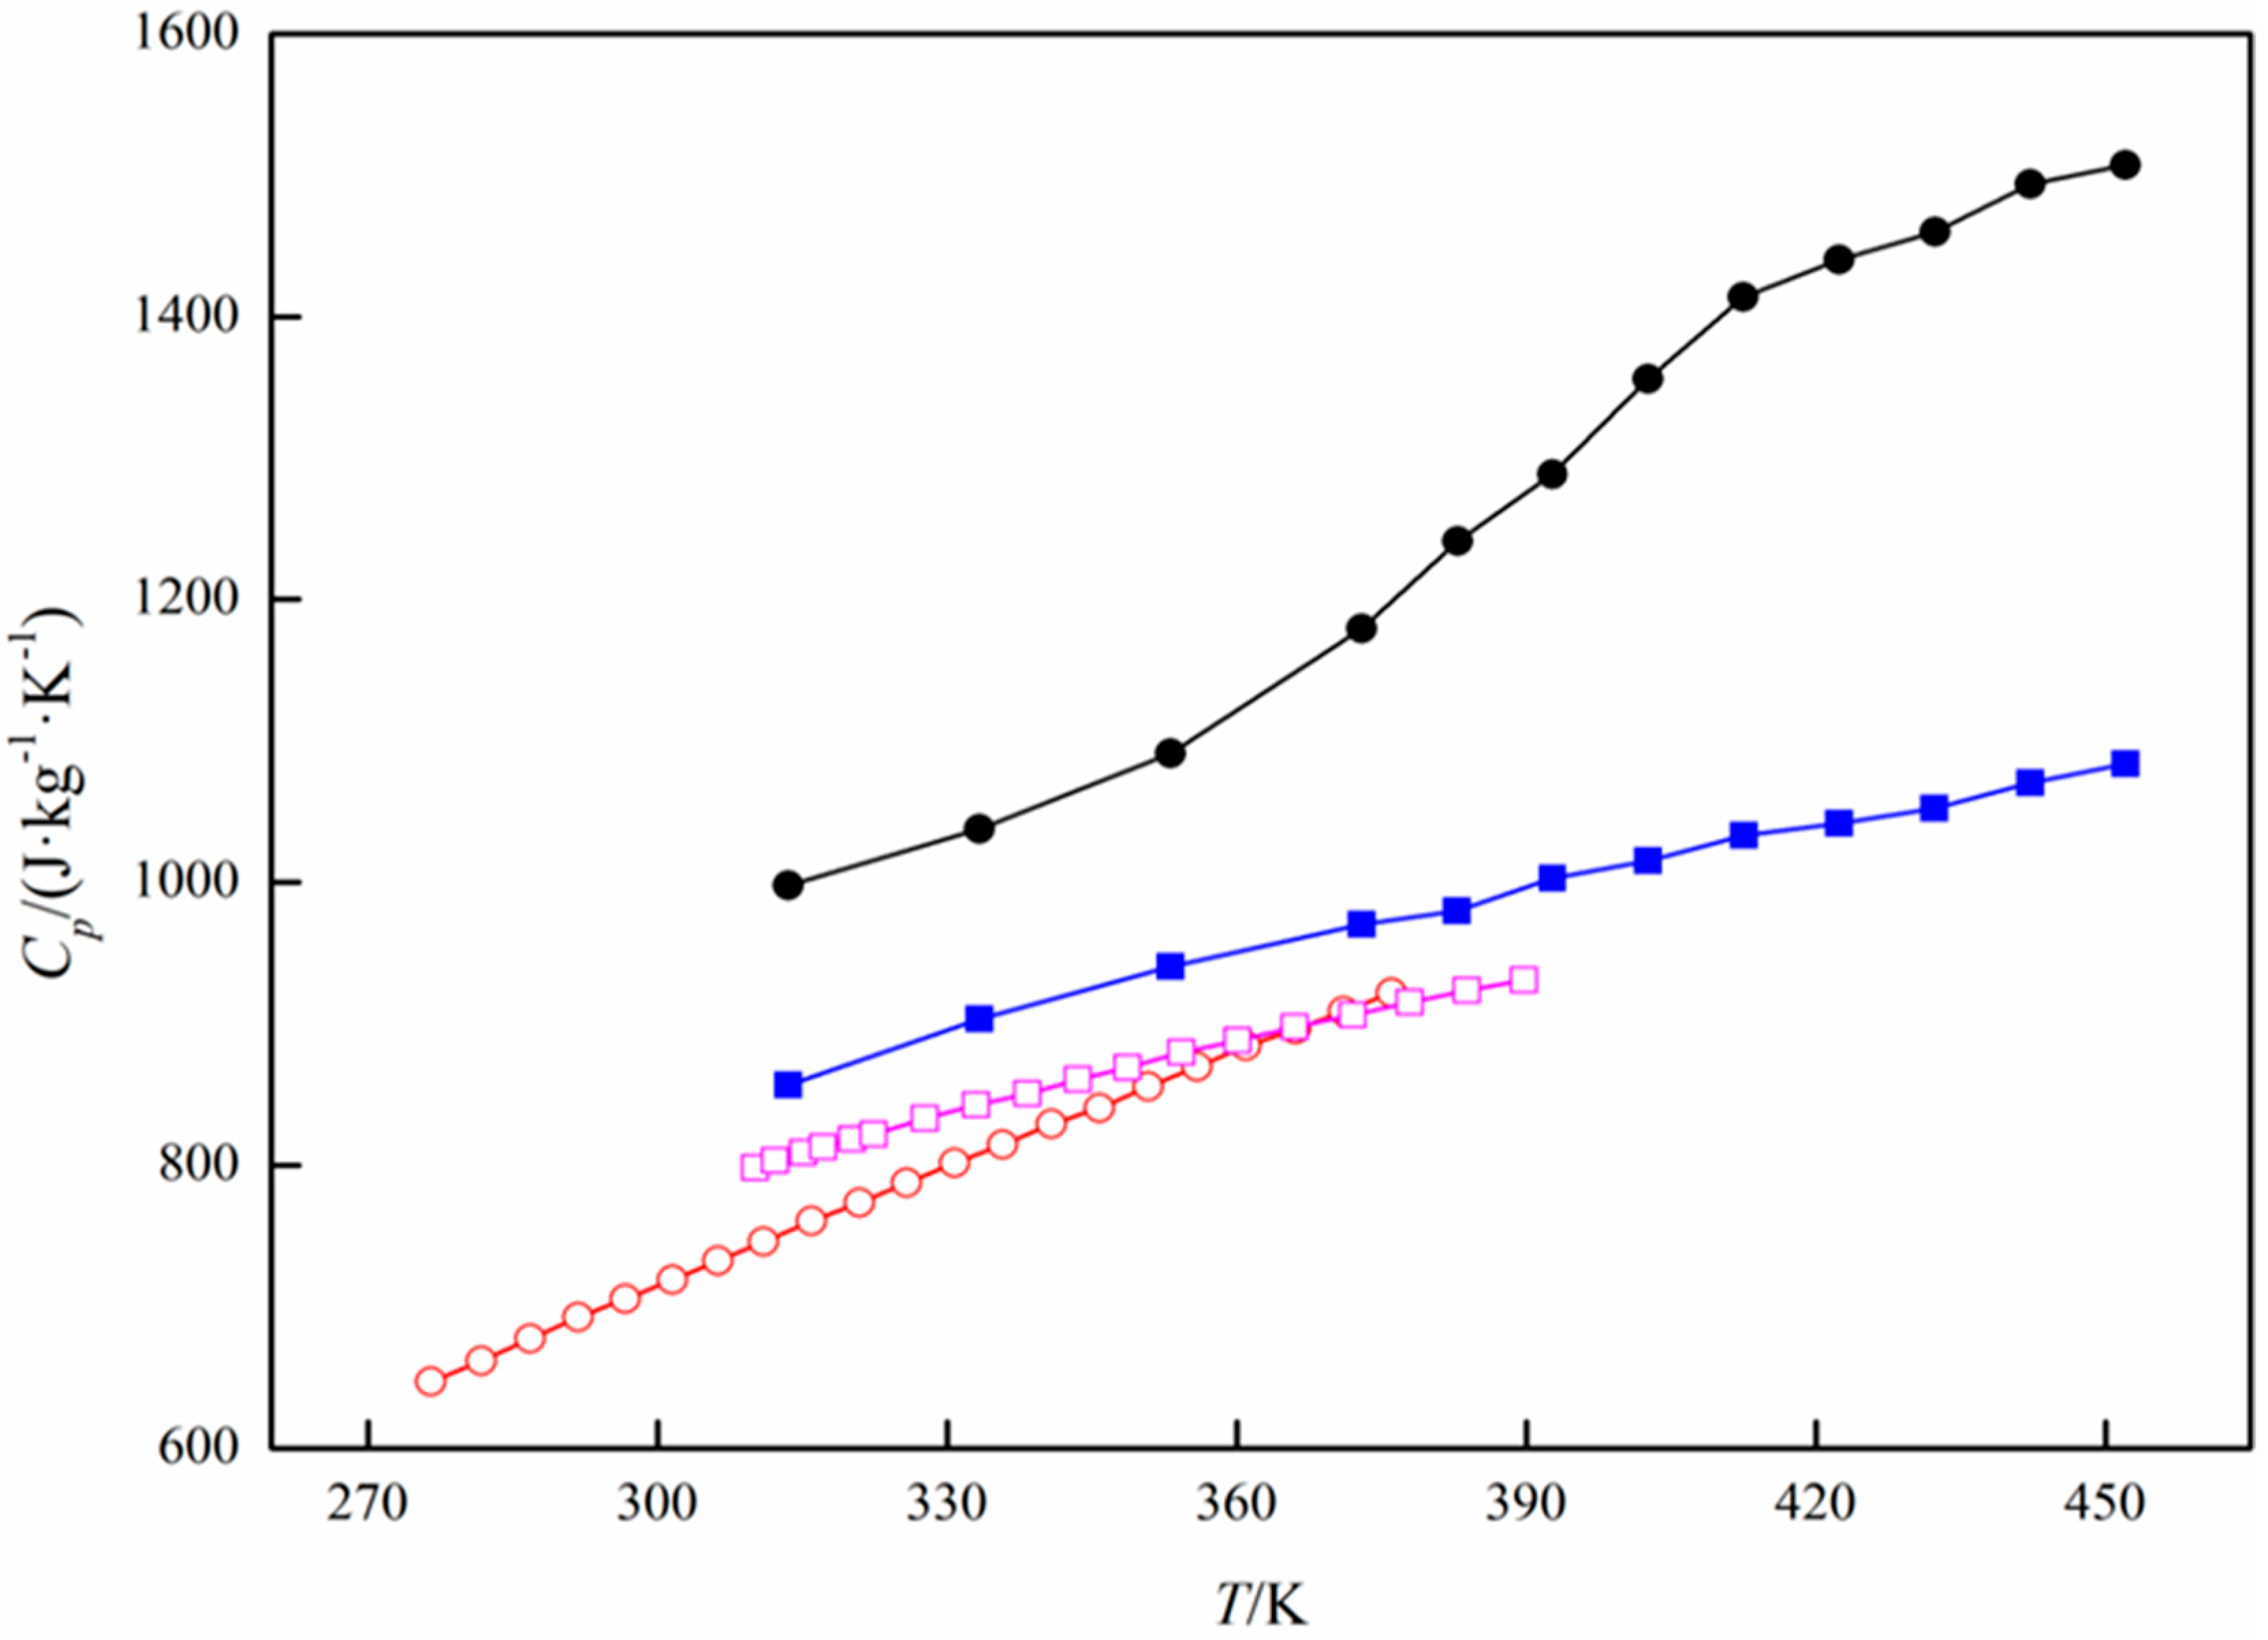
| T/K | Cpb/(J·kg−1·K−1) | T/K | Cp/(J·kg−1·K−1) | T/K | Cp/(J·kg−1·K−1) |
|---|---|---|---|---|---|
| Activated carbon | |||||
| 313.59 | 997.75 | 382.88 | 1241.17 | 422.42 | 1440.42 |
| 333.36 | 1037.55 | 392.74 | 1288.34 | 432.34 | 1459.99 |
| 353.13 | 1091.18 | 402.60 | 1355.75 | 442.21 | 1493.63 |
| 372.96 | 1179.32 | 412.49 | 1413.87 | 452.10 | 1506.95 |
| Al2O3 | |||||
| 313.57 | 857.01 | 382.84 | 980.10 | 422.40 | 1041.78 |
| 333.36 | 903.54 | 392.73 | 1003.09 | 432.31 | 1052.30 |
| 353.15 | 940.53 | 402.62 | 1015.48 | 442.22 | 1070.46 |
| 372.93 | 970.32 | 412.51 | 1033.37 | 452.10 | 1083.82 |
| Amberlite IR120, H-form | |||||
| 313.60 | 1170.74 | 333.40 | 1244.29 | 353.21 | 1325.63 |
| 323.50 | 1208.66 | 343.31 | 1285.37 | 363.09 | 1361.98 |
| H-Beta-25 | |||||
| 313.62 | 1048.08 | 382.91 | 1326.90 | 422.47 | 1526.61 |
| 333.41 | 1135.92 | 392.78 | 1360.29 | 432.38 | 1577.30 |
| 353.20 | 1200.45 | 402.67 | 1419.67 | 442.25 | 1611.05 |
| 373.01 | 1259.04 | 412.56 | 1476.82 | 452.14 | 1647.16 |
| H-Beta-38 | |||||
| 313.63 | 1361.17 | 382.93 | 1632.81 | 422.50 | 1896.06 |
| 333.42 | 1428.30 | 392.81 | 1685.38 | 432.41 | 1983.12 |
| 353.22 | 1499.17 | 402.70 | 1757.74 | 442.28 | 2090.75 |
| 373.03 | 1575.57 | 412.59 | 1819.02 | 452.17 | 2201.44 |
| H-Y-60 | |||||
| 313.59 | 895.66 | 382.86 | 1041.12 | 422.46 | 1137.74 |
| 333.38 | 935.65 | 392.75 | 1061.84 | 432.34 | 1160.56 |
| 353.18 | 979.14 | 402.64 | 1085.68 | 442.22 | 1184.64 |
| 372.97 | 1019.52 | 412.55 | 1110.76 | 452.12 | 1209.15 |
| H-ZSM-5-23 | |||||
| 313.60 | 1027.35 | 382.87 | 1167.70 | 422.44 | 1277.33 |
| 333.39 | 1063.39 | 392.77 | 1194.68 | 432.36 | 1313.73 |
| 353.18 | 1098.71 | 402.65 | 1219.61 | 442.25 | 1353.51 |
| 372.97 | 1143.54 | 412.54 | 1246.26 | 452.13 | 1392.11 |
| H-ZSM-5-280 | |||||
| 313.62 | 828.34 | 382.90 | 896.44 | 422.47 | 944.23 |
| 333.41 | 864.92 | 392.79 | 910.64 | 432.38 | 956.91 |
| 353.21 | 865.08 | 402.68 | 927.66 | 442.26 | 975.72 |
| 373.00 | 882.80 | 412.58 | 940.17 | 452.15 | 976.01 |
| SiO2 | |||||
| 313.59 | 1045.04 | 382.85 | 1333.53 | 422.43 | 1629.69 |
| 333.38 | 1112.58 | 392.75 | 1399.71 | 432.34 | 1727.41 |
| 353.15 | 1163.06 | 402.65 | 1465.91 | 442.21 | 1836.38 |
| 372.95 | 1277.84 | 412.54 | 1560.48 | 452.10 | 1939.65 |
| TiO2 | |||||
| 313.61 | 702.41 | 382.88 | 773.06 | 422.45 | 796.51 |
| 333.40 | 725.88 | 392.77 | 780.21 | 432.35 | 805.09 |
| 353.20 | 746.42 | 402.66 | 788.29 | 442.24 | 813.76 |
| 372.99 | 757.83 | 412.57 | 793.80 | 452.13 | 818.09 |
| Zeolite 13X | |||||
| 313.61 | 1004.46 | 382.89 | 1110.27 | 422.48 | 1149.40 |
| 333.41 | 1043.91 | 392.77 | 1114.40 | 432.37 | 1173.65 |
| 353.20 | 1072.98 | 402.67 | 1128.13 | 442.25 | 1174.02 |
| 373.00 | 1097.44 | 412.58 | 1136.84 | 452.14 | 1185.55 |
| Tref/K | Cp(Tref)/(J·kg−1·K−1) | A/(J·kg−1·K−2) | Estimated Error of A/(J·kg−1·K−2) | B/(J·kg−1·K−3) | Estimated Error of B/(J·kg−1·K−3) | R2 | |
|---|---|---|---|---|---|---|---|
| Activated carbon | 392.74 | 1288.34 | 2.89 | 5.57 | 0.0016 | 0.0072 | 0.9992 |
| Al2O3 | 392.73 | 1003.09 | 4.37 | 0.79 | −0.0036 | 0.0010 | 0.9971 |
| Amberlite IR120, H-form | 353.21 | 1325.63 | 3.94 | 0.09 | 0.9992 | ||
| H-Beta-25 | 402.67 | 1419.67 | 4.42 | 0.28 | 0.9910 | ||
| H-Beta-38 | 392.81 | 1685.38 | −19.39 | 2.47 | 0.0329 | 0.0032 | 0.9981 |
| H-Y−60 | 372.97 | 1019.52 | 0.42 | 0.35 | 0.0024 | 0.0004 | 0.9998 |
| H-ZSM-5-23 | 392.77 | 1194.68 | -3.87 | 0.75 | 0.0084 | 0.0010 | 0.9991 |
| H-ZSM-5-280 | 392.79 | 910.64 | 1.08 | 0.12 | 0.9729 | ||
| SiO2 | 392.75 | 1399.71 | −1.94 | 1.58 | 0.0337 | 0.0021 | 0.9994 |
| TiO2 | 402.66 | 788.29 | 2.92 | 0.62 | −0.0027 | 0.0008 | 0.9944 |
| Zeolite 13X | 373.00 | 1097.44 | 3.44 | 1.24 | −0.0029 | 0.0016 | 0.9907 |
© 2020 by the authors. Licensee MDPI, Basel, Switzerland. This article is an open access article distributed under the terms and conditions of the Creative Commons Attribution (CC BY) license (http://creativecommons.org/licenses/by/4.0/).
Share and Cite
Lu, X.; Wang, Y.; Estel, L.; Kumar, N.; Grénman, H.; Leveneur, S. Evolution of Specific Heat Capacity with Temperature for Typical Supports Used for Heterogeneous Catalysts. Processes 2020, 8, 911. https://doi.org/10.3390/pr8080911
Lu X, Wang Y, Estel L, Kumar N, Grénman H, Leveneur S. Evolution of Specific Heat Capacity with Temperature for Typical Supports Used for Heterogeneous Catalysts. Processes. 2020; 8(8):911. https://doi.org/10.3390/pr8080911
Chicago/Turabian StyleLu, Xiaojia, Yanjun Wang, Lionel Estel, Narendra Kumar, Henrik Grénman, and Sébastien Leveneur. 2020. "Evolution of Specific Heat Capacity with Temperature for Typical Supports Used for Heterogeneous Catalysts" Processes 8, no. 8: 911. https://doi.org/10.3390/pr8080911