Article

Performance Evaluation of Elimination of Stagnation of Solar Thermal Systems

Department of Process Technique, Technical University of Košice, 08 001 Prešov, Slovakia
*
Author to whom correspondence should be addressed.
Processes 2020, 8(5), 621; https://doi.org/10.3390/pr8050621
Submission received: 24 April 2020 / Revised: 15 May 2020 / Accepted: 20 May 2020 / Published: 22 May 2020
(This article belongs to the Special Issue Thermal Safety of Chemical Processes)

Abstract

:
The study deals with the possibility of elimination of stagnation of thermal systems. The state of stagnation of thermal systems leads to overheating and evaporation of the heat transfer medium, which increases pressure and can lead to damage to the solar thermal system. Stagnation can occur due to a fault and stopping of the circulation pump, which causes the circulation of the heat transfer medium to stop. Another possibility is to achieve thermal saturation in the system, which can be affected by low heat consumption from the system. Elimination of stagnation is possible by various construction designs of collectors or by using other technical means. This study describes an experiment verifying the usability of a thermal collector’s tilting system to eliminate thermal stagnation of the system. The system is fully automatic, and when recording the limit values, ensures that the panel is rotated out of the ideal position, thus reducing the amount of received energy. In this way, the temperature of the medium in the system can be reduced by up to 10% in one hour. In the case of thermal saturation of the system, the solution is the automatic circulation of heat-transfer fluid through the system during the night and the release of thermal energy to the outside. These results suggest that the methods used actively eliminate stagnation of thermal systems.

1. Introduction

Modern solar thermal systems have the potential to achieve very high energy conversion efficiency, even at average solar radiation values, and thus achieve high output temperatures [1,2,3]. This effect is multiplied by the way the panels are connected [4]. On one hand, the serial connection of the panels enables the required temperatures of the panels to be reached even at times with reduced energy input or energy consumption (allows for an increase in the dynamics of the system). On the other hand, it is sensitive to the way heat is being consumed. As stated by [5,6], current technologies make it possible to maximize the thermal performance of collectors of various absorber designs. This performance is ensured mainly by improving the material properties of the absorbers as well as by using new selective materials applied in multiple layers. Technical practice points to the use of multilayer applications in up to thirteen layers.
In the case of a decrease in power consumption due to a short-term change in system load—or in the case of a drop in the fluid flow or during interruption of the energy supply to the circulator or during routine shutdowns—the average temperature of the medium of flat collectors may reach values in excess of 170 °C [7]. These temperatures mean a sharp increase in operating pressure. Moreover, phase changes also occur in critical situations, and the resulting vapor causes a further increase in pressure, thus leading to permanent damage to the components. Energy-saturation of the system also causes serious problems. As stated by [8], the energy-saturation of the system occurs when the system reaches its energy capacity and begins to overheat and approach stagnation by further energy intake. When a saturation temperature of 100 °C is reached, steam begins to form in the collector and enters the system. The saturation temperature and system pressure increase only slightly. When the stagnation temperature is reached, this condition lasts approximately 10 minutes. These issues occur mainly due to oversizing of the solar thermal system during the summer season [8]. In these conditions, referred to as stagnation, significant damage to the solar thermal system as a whole or to its individual parts (mainly collectors) may occur [9,10]. At the same time, stagnation greatly accelerates the degradation of materials and heat-transfer fluid. The heat-transfer fluid can act highly corrosive, resulting in accelerated clogging of the collectors and other system components [7,11]. Research results [10,12] show that stagnation also has a negative effect on the resulting heat loss of the collectors due to the degradation of the insulating materials and thus their characteristic coefficients.
However, the stagnation process is difficult to control and difficult to manage. In principle, there are two ways to control collector stagnation temperature: reduce solar energy input into the collector or remove excess heat from the collector [7].
Stagnation processes according to [8,9,13] can be divided into five basic phases. In the first phase, the heat transfer medium is heated until the evaporation temperature is reached. The temperature of the medium rises below the boiling point, causing it to expand and increase the pressure. In the second phase, when the boiling point is reached, the heat transfer medium is evaporated. A smaller part of the medium evaporates and pushes a larger part of the liquid medium in the collector until the inlet and outlet pipes are immersed in saturated steam. A large amount of liquid medium is pushed into the expansion vessel, causing the pressure to rise rapidly. In simple hydraulic systems (horizontal or rising pipes), a larger proportion of the medium flows through the outlet pipe and a smaller proportion flows through the inlet pipe. With more complex collector hydraulic systems (a combination of horizontal, rising and falling pipe sections), the behavior of the medium is more complicated. The pressure in the system rises sharply and the boiling point rises in the saturated steam area. The second phase lasts only a few minutes. If there is only steam in the area from the inlet to the outlet pipe, this phase ends. In the third phase, the pressure growth slows. The remaining liquid in the collector also evaporates and the steam reaches other parts of the system. The energy transferred from the collector is released into the components (e.g., heat exchanger) and the surrounding environment through the formation of condensate. At the end of the third phase, the steam volume and system pressure will reach maximum values. In the next phase, the steam in the collector becomes overheated and cooling becomes more difficult. The amount of steam in the collector is constantly decreasing and the collector gradually becomes drier. The efficiency of the collectors decreases and the amount of energy to be removed by steam is lower. This fourth phase may take several hours on a cloudless day and only ends when irradiance diminishes. The fifth phase occurs only after the fall of the incident energy on the collector, then the temperature drops below the boiling point and gradual condensation of the heat transfer medium begins.
In the case of fixed installation of panels, this process is dependent on the change of the position of the sun and usually the last phase is reached only in the evening, when the angle of incident solar radiation on the collector is significantly unfavorable. In this case, however, there may occur permanent mechanical damage to the collectors or other technological parts [14,15].
According to [16] one of the technical options is the application of thermochromic absorber coatings which enables a significant reduction in collector and solar circuit temperature during stagnation. However, this principle of elimination of stagnation could be used only with new technological equipment. Another way to avoid overheating is to apply new smart coatings as described by [17].
As shown by the results of [7], stagnation conditions were evaluated in relation to parameters such as temperature dependence on the input and output of thermal panels, flow opening size, module tilt angle from 0° to 90° and operating conditions, with particular emphasis on emissivity. The research has focused on plate-type air-cooled panels, which significantly change the possibilities for conventional panel systems.
Another option is to use butane as the heat transfer medium as described by [18]. The results showed that butane as a heat transfer medium can limit the maximum temperature in the solar circuit of the system to 120 °C or lower, allowing high collector performance. The disadvantage is that the heat transfer capacity with butane in the operating range for a typical heat pipe geometry is lower compared to other organic media, like, e.g., acetone. This is mainly caused by butanes’ comparatively low values for thermal conductance and enthalpy of vaporization. Thus, optimization of butane heat-pipes is essential to reach a high thermal conductance. Experimental investigations show that the thermal conductance of butane heat pipes with collector-typical dimensions (lcond = 80 mm) is significantly lower, compared to acetone heat pipes. By increasing the condenser area five-fold the butane hat pipe exhibits a thermal conductance, which is in the same range to that of an acetone heat pipe with the same dimensions [18].
As stated by [19], the solution in terms of overheating of the solar thermal system is to insert an aluminum layer between the absorption plate and the glass cover. This protection can be complete or partial and the overheating problem is eliminated even at 50% overlap.
The prototype presented [20] represents a new technology of aluminum heat pipes with minimal use of copper. With this new type of pipe, stagnation temperature is lower at a maximum stagnation temperature reaches 140 °C.
According to [21], the use of thermotropic glazing is effective in lowering stagnation temperature. Glass and absorber temperatures during stagnation revealed that the developed thermotropic glazing is a powerful component that prevents overheating in solar collectors and decreased the absorber temperatures by 29 K when compared to the reference collector.
As reported by [9], although various approaches are currently being applied in the research and practice to minimize the effects of a stagnation state, some proposed methods are not suitable for all system designs and applications. Factors such as storage and system capacity, load, distribution requirements, temperature and frost protection affect the choice of stagnation control.
When tilting the collectors, it is possible to significantly increase the efficiency of obtaining thermal energy from solar radiation [22]. A tracker construction with different designs can be used to tilt the collectors [23]. Control algorithm is important for the best use of tracker construction [24,25]. These systems can also be optimized and improved, as reported by [26,27,28]. As a result, a series of experiments and simulations was conducted to investigate the possibilities of eliminating the stagnation state using the collector field rotation system with the tracker construction.
The thermal risks of the process represent the achievement of working medium temperatures above the phase transition values of the working substance. Directly with increasing temperature, the pressure of the working medium increases sharply. The generated vapors continue to increase the working pressure, which in many cases leads to unavoidable damage to components. Safety elements in the form of safety valves are installed in the system, but these will only ensure a pressure drop in the system but will eliminate the problem of temperature rise. At the same time, further circulation of the liquid is disabled due to its lack in the system by its evaporation and i tis still thermally significantly stressed. During further vapors generation, the circulation pump is unable to ensure its operation with the generated vapors. Such thermal stress leads to permanent degradation of the components as well as the solar thermal panels themselves. In the proposed method of eliminating stagnation in iterations proportional to the time constant, the value of temperature of medium in the storage tank as well as at the outlet and inlet to the solar thermal system is evaluated. By changing the position of the panels using the tracker construction and the control system, there is a decrease in the irradiated area as well as a significant increase of angle towards the incident sunlight. The result is a significant decrease in the efficiency of the panels and thus another significant increase in temperature. Subsequently, this effect is manifested only by a slight increase in temperature in the system. Synergically, the temperature at the outlet of the collectors decreases due to the natural balancing of the energy balance of surrounding environment and panels.

2. Materials and Methods

To eliminate thermal stagnation, the collector tilting system was used. Verification of the operation of the system took place using a laboratory thermal system consisting of a panel array consisting of four flat solar panels HERZ CS 100F located at the workplace of the Department of Process Engineering. The total area of the collectors is 8.28 m2 and the absorption area of the collector is 7.56 m
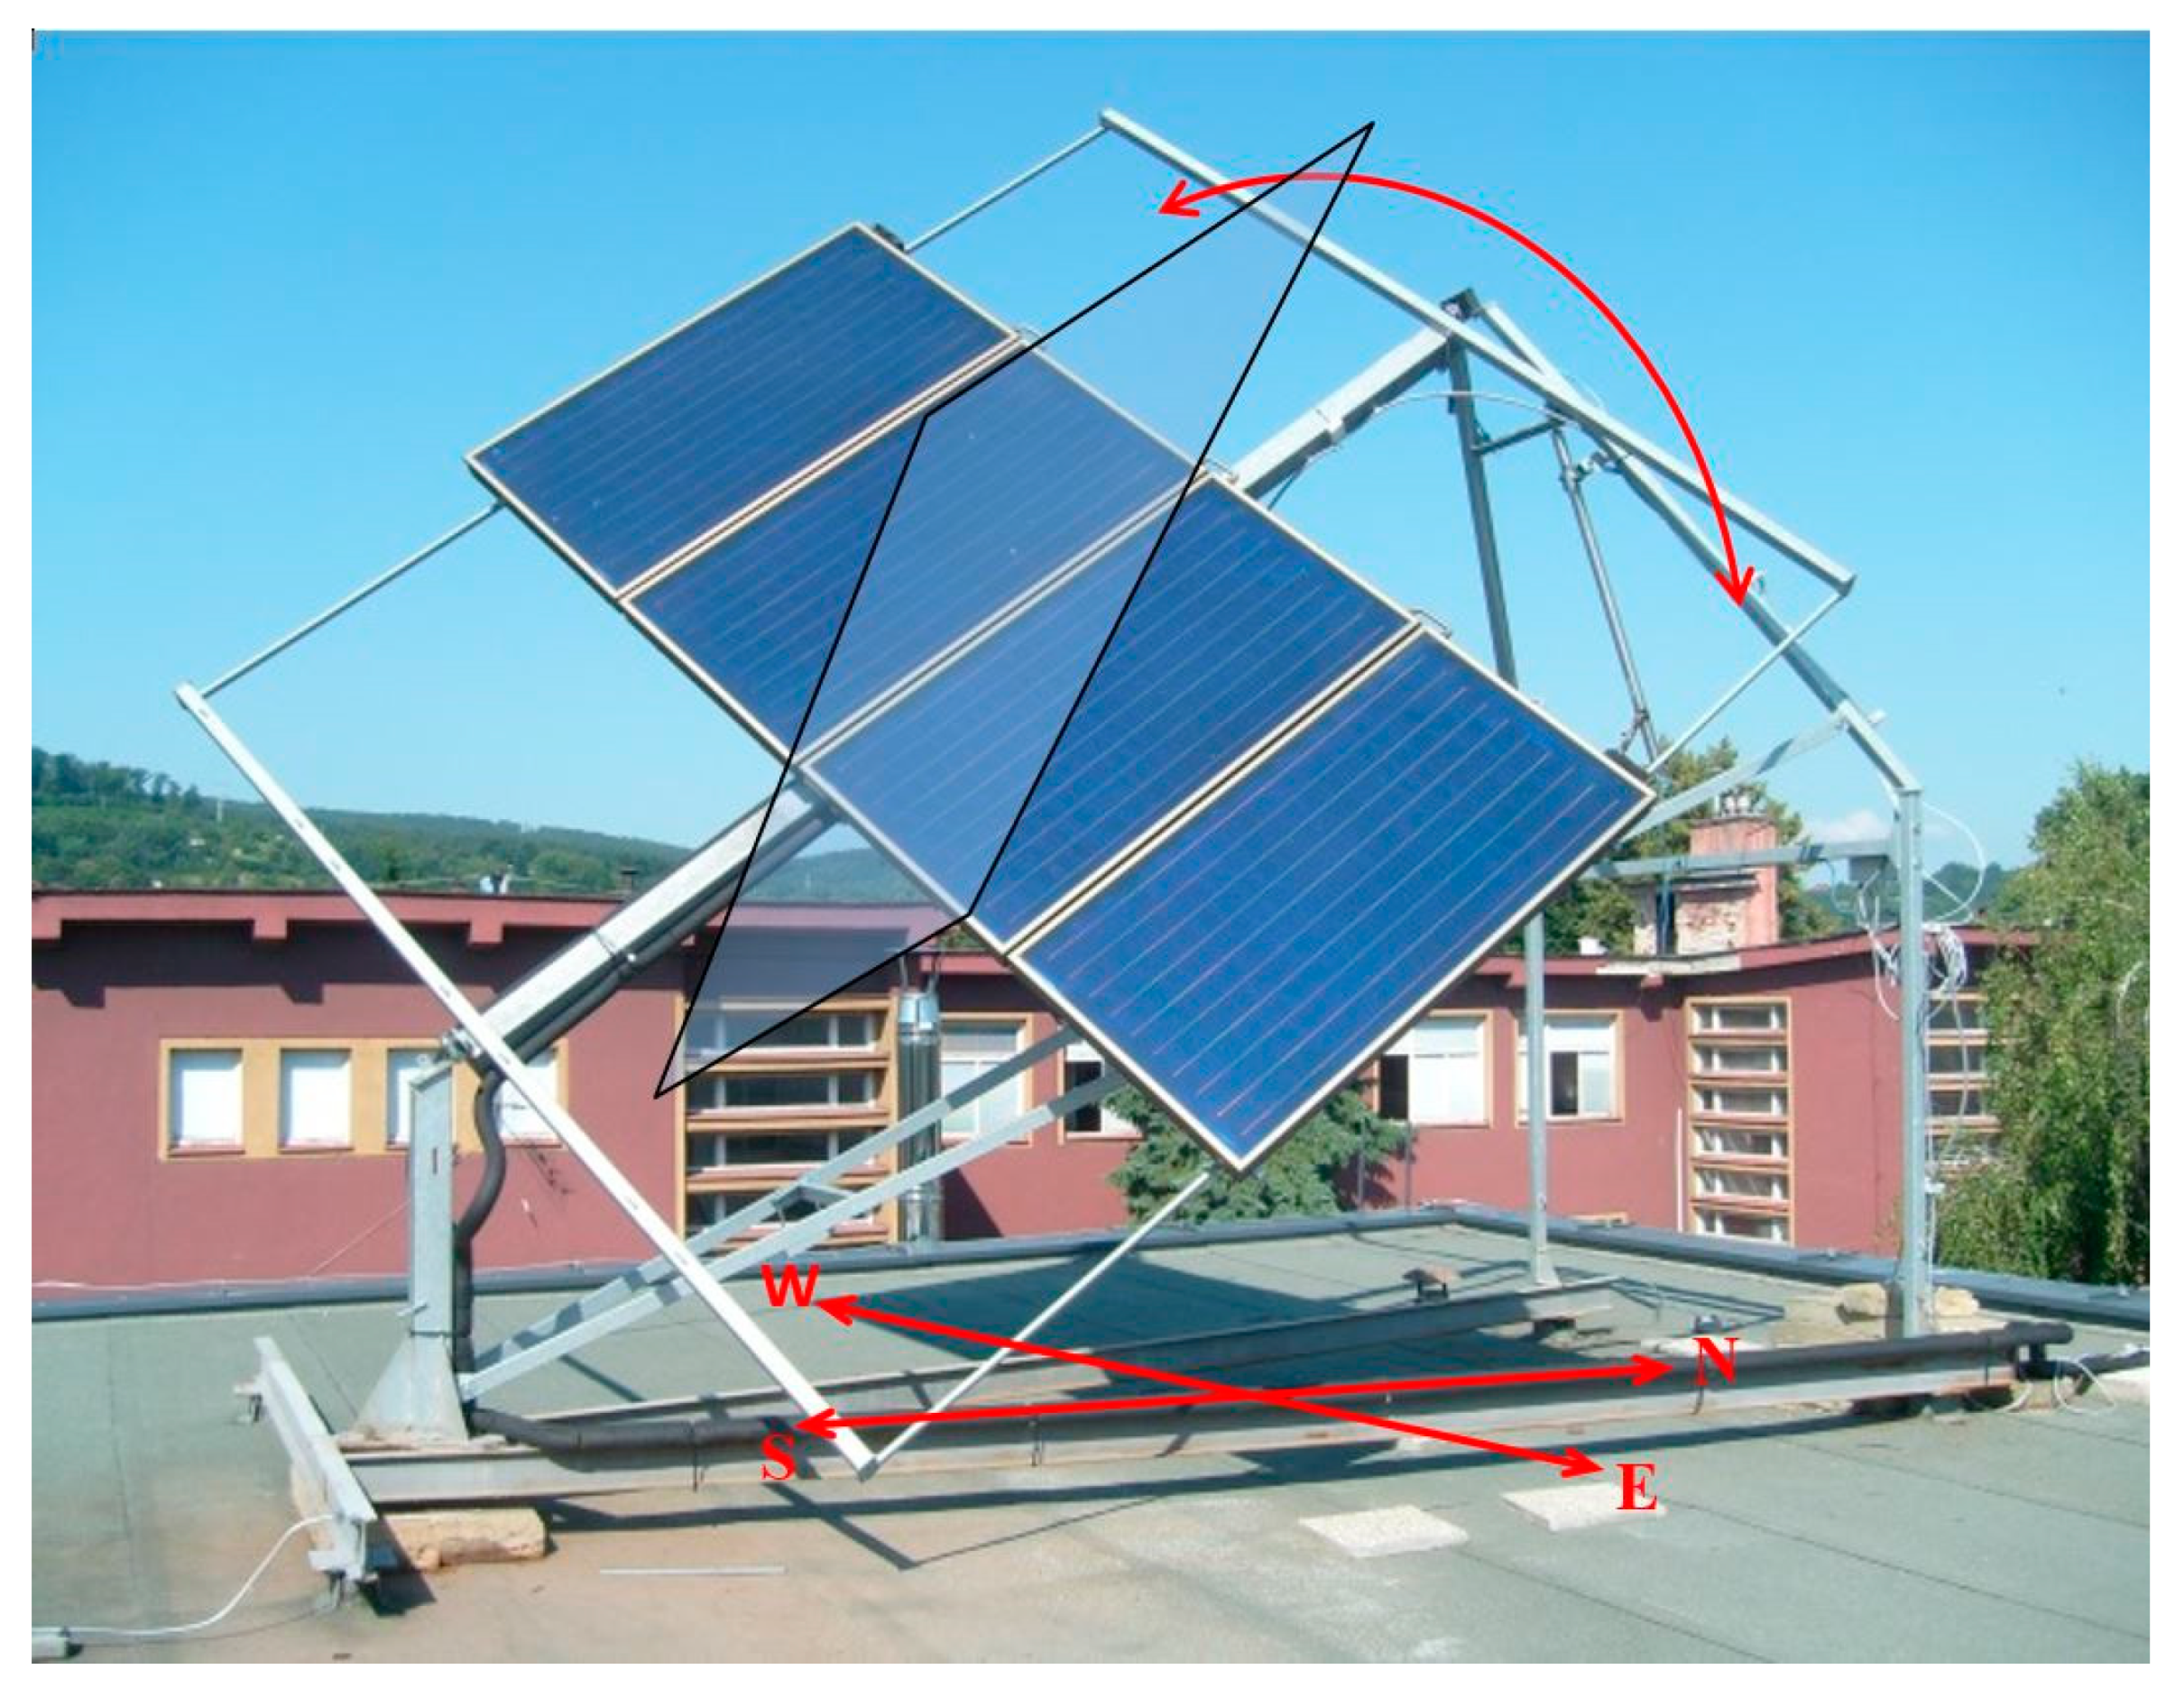
2, which means that 91.3% of the total area is actively used. A maximum of seven panels can be placed in one collector array as stated by (Hafez et al., 2018). The collector frame features a double-chamber made of anodized aluminum with insulation consisting of mineral wool with a temperature resistance up to 300 °C mounted in the lower part of the frame. In order to obtain the best possible conditions and the most ideal angle between the incident solar radiation and the absorption surface of the collectors, the collectors were placed on a structure that allows the entire surface to be automatically tilted according to the current position of the sun controlled by the Siemens Desigo Insight system. 
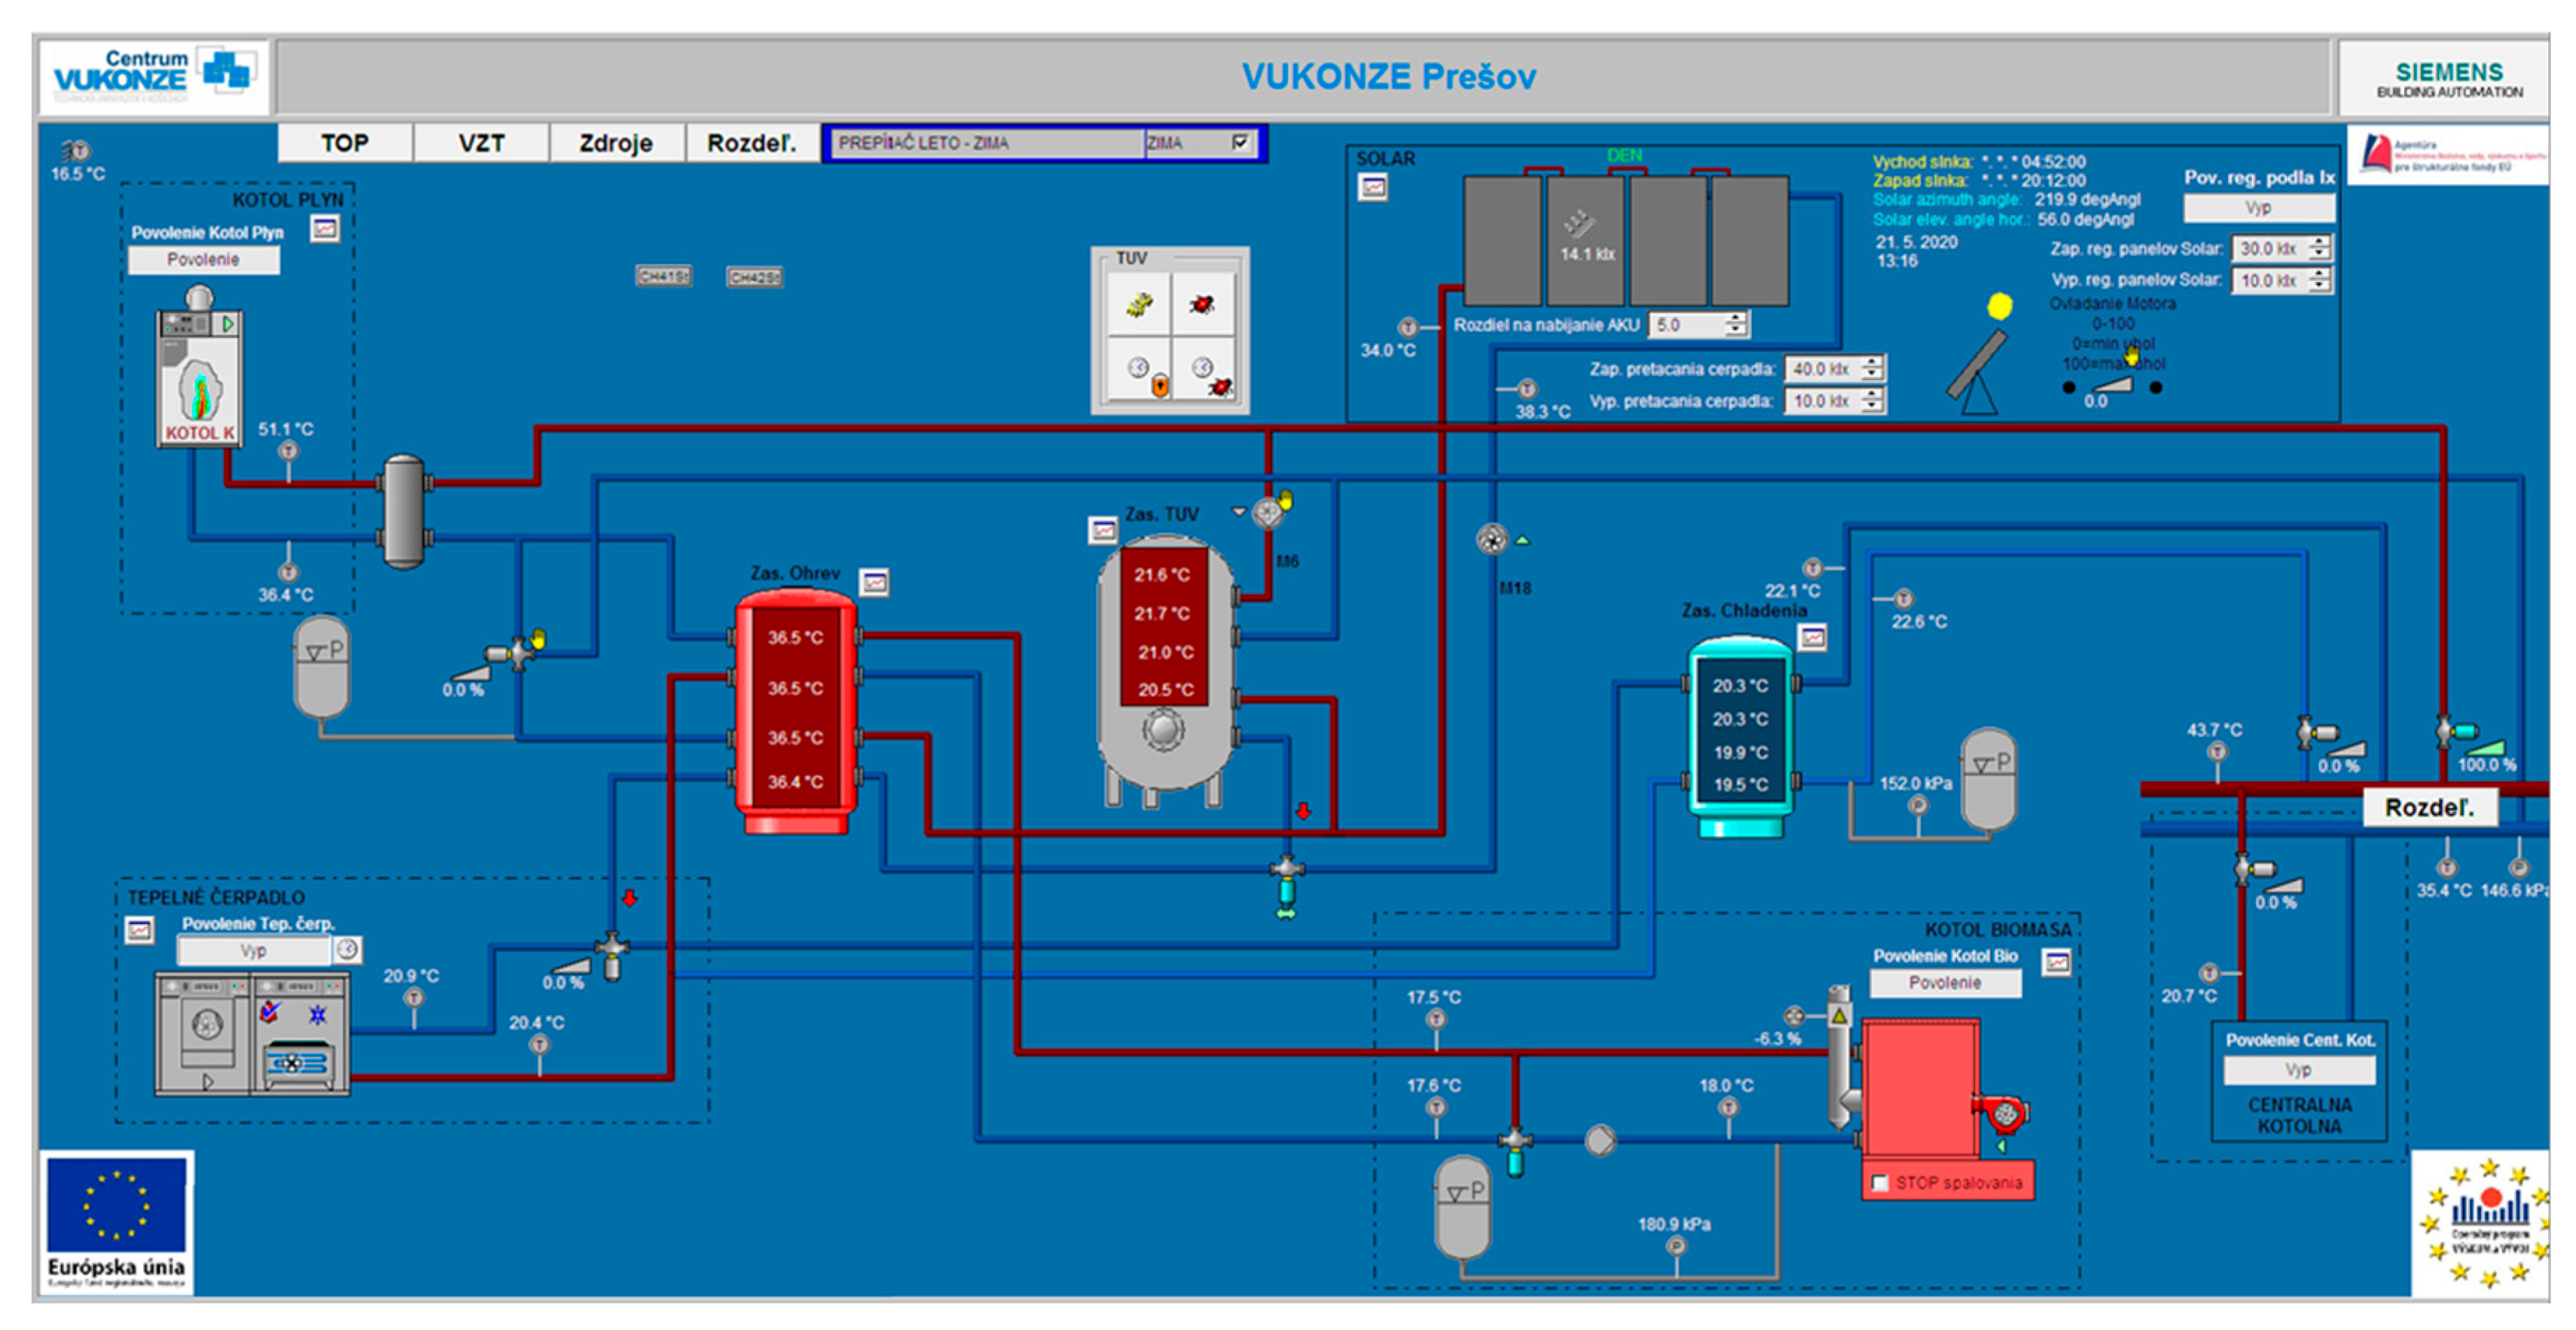
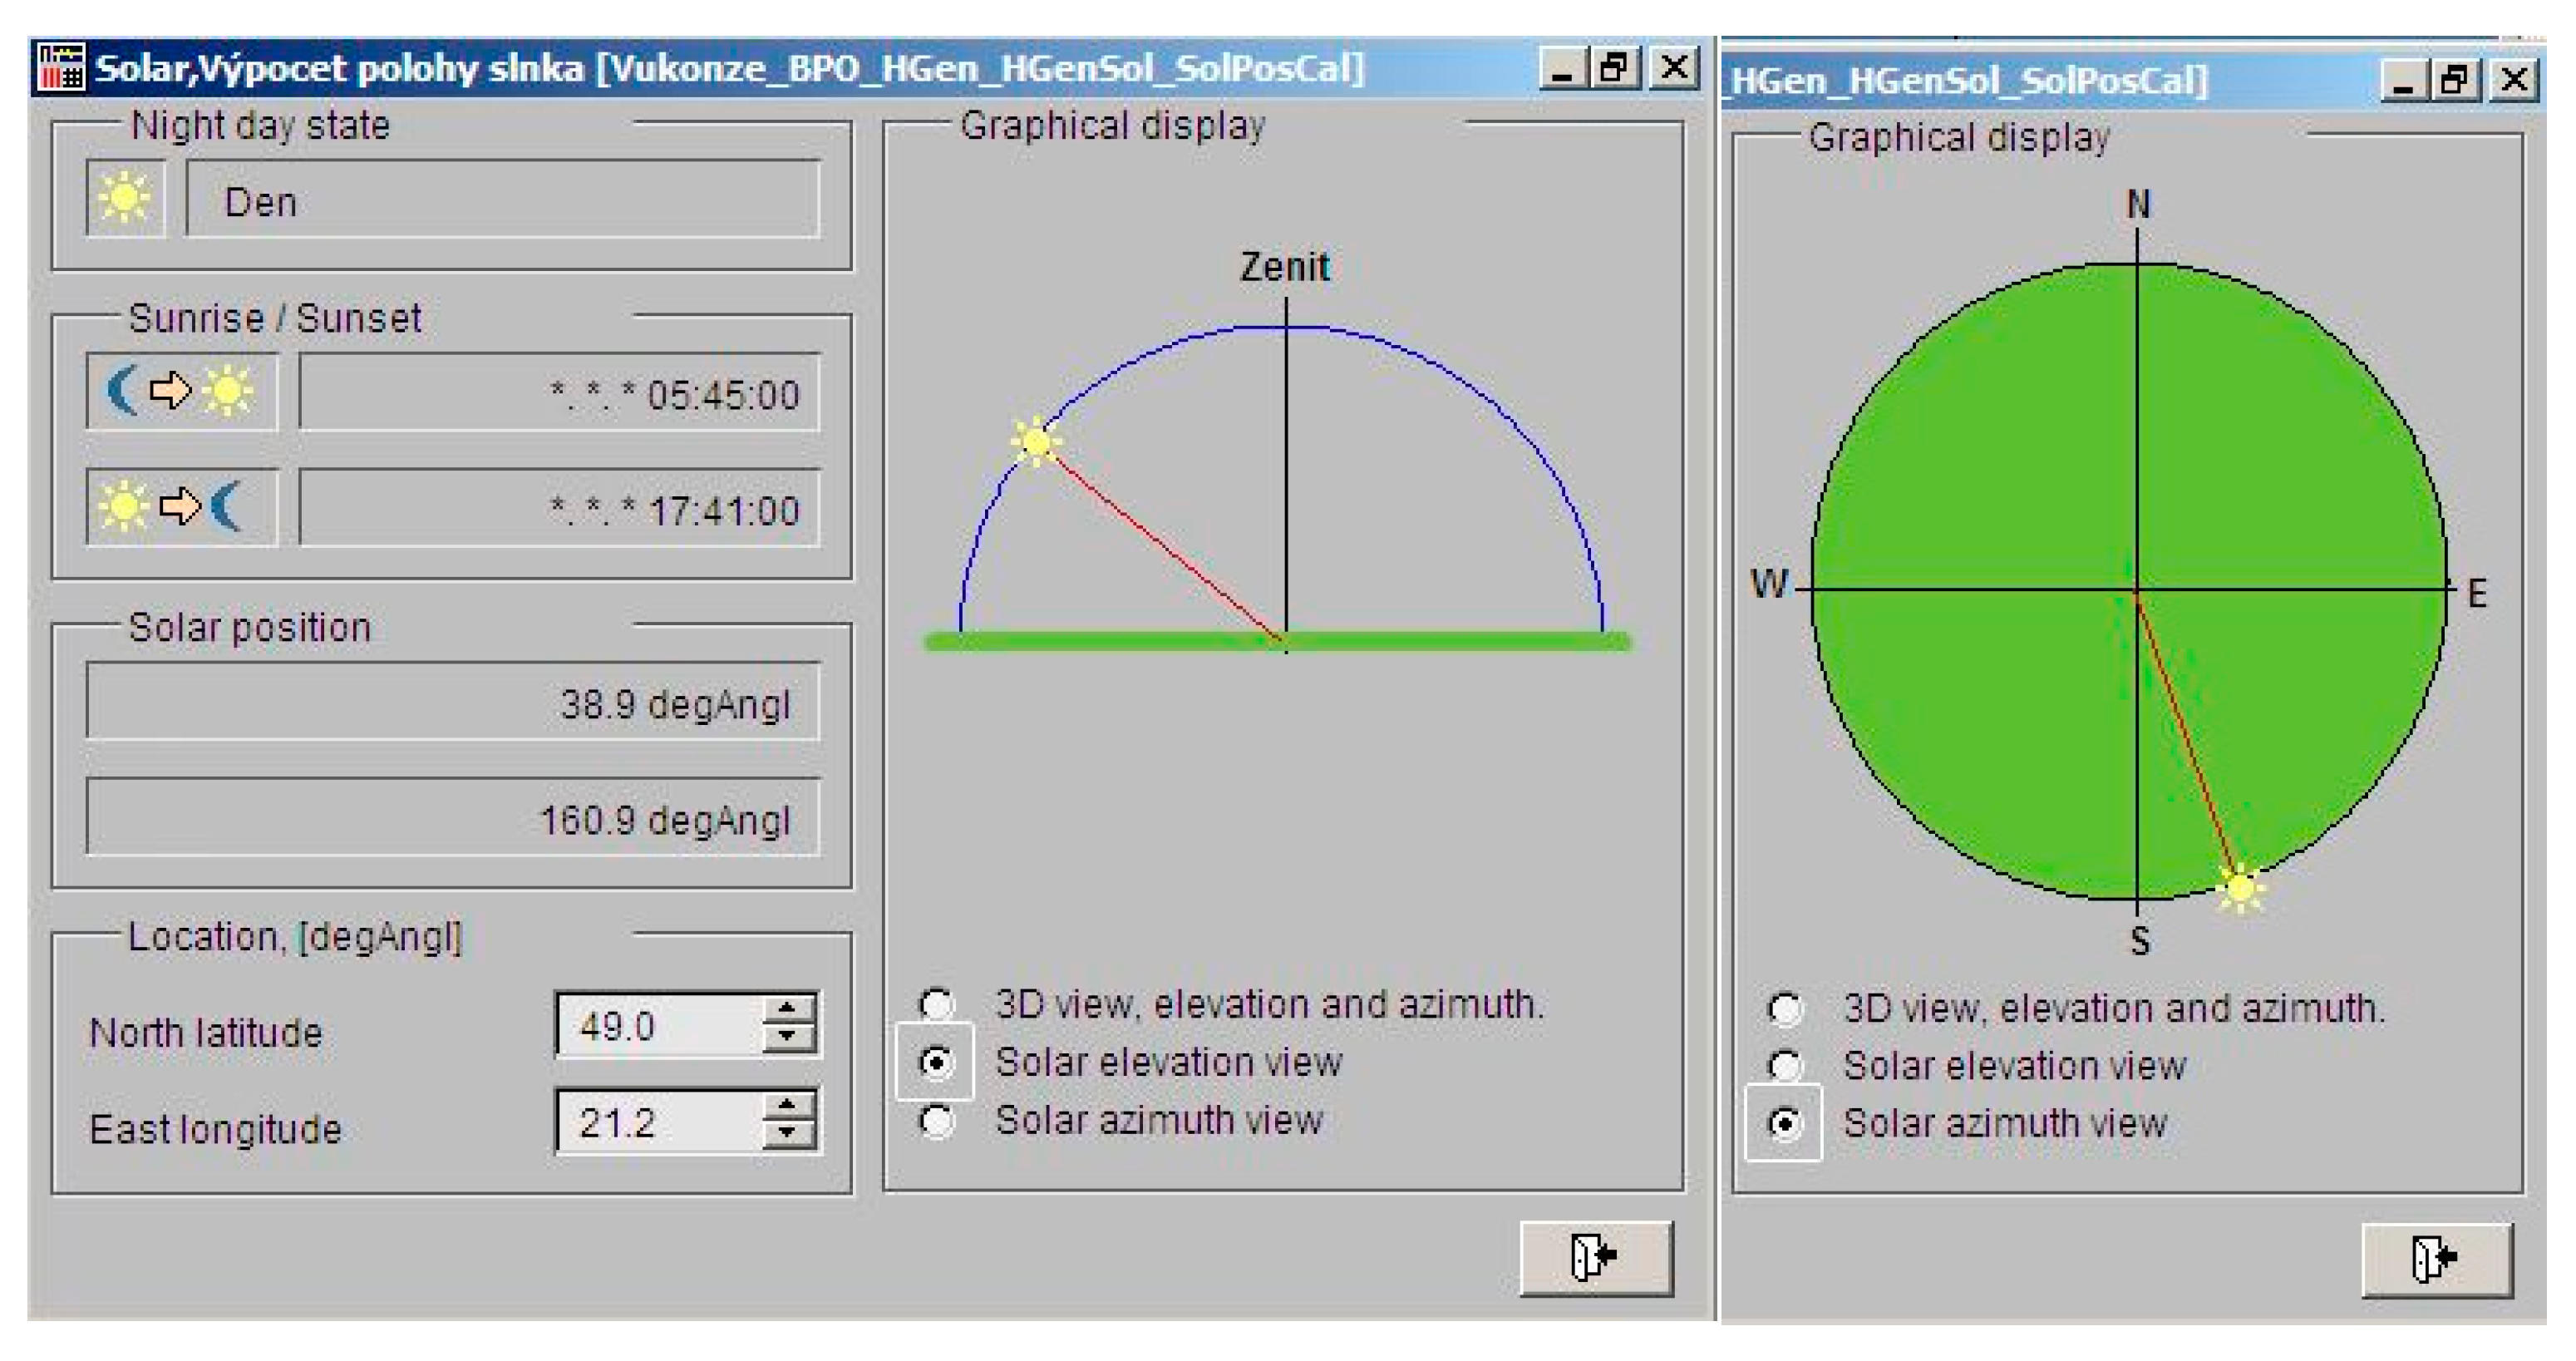
Figure 1 shows the tracker construction enabling the collector tilting.. The Siemens Desigo Insight control system (Figure 2) is used for correct and automatic collector tilting.

2.1. Sun Radiation

For the most effective heat recovery in terms of incident solar radiation, it is necessary to calculate the optimal angle of incidence of solar radiation. Calculations of the optimum angle of incidence of solar radiation on an inclined surface are described by a number of studies [29,30,31,32,33,34,35,36,37,38] According to [39], the global solar irradiation (G) incident on an inclined surface is composed of direct (Gb), diffuse (Gd) and reflected (Gr) radiation:
G   =   G b + G d + G r
The radiation incident on the illuminated part of the surface is inversely proportional to the area illuminated by the beam, and the illuminated surface depends on the angle of incidence of the beam. Irradiation above the tilted surface (Gbt) at an angle of incidence θ is:
G bt   =   cos θ · G bn
Gbn—normal irradiation (perpendicular to surface.
On a horizontal surface, the angle of incidence is equal to that of the solar zenith and the horizontal irradiance is:
G b =   cos θ z · G bn
Irradiation above the tilted surface (Gbt) can be expressed by a combination of Equations (2) and (3):
G bt = cos θ cos θ z G b
Assuming that the diffuse radiation is the same at all times and in all directions from the half-space above the horizontal surface, we can conclude that it is isotropic. Irradiation on an inclined surface, due to only diffuse radiation, can then be defined as:
G dt   = 1 + cos β 2 G d
β—tilt angle.
The reflected radiation depends on the global radiation (G) and the reflectance of the surfaces (R). The reflected radiation is isotropic at the given place and time, the same in all directions from the half-space below the horizontal surface. Irradiation on an inclined surface due to reflected radiation is calculated as:
G rt = 1 cos β 2   RG
The calculation of the position of the sun relative to the panel is based on DIN 5034-2 [
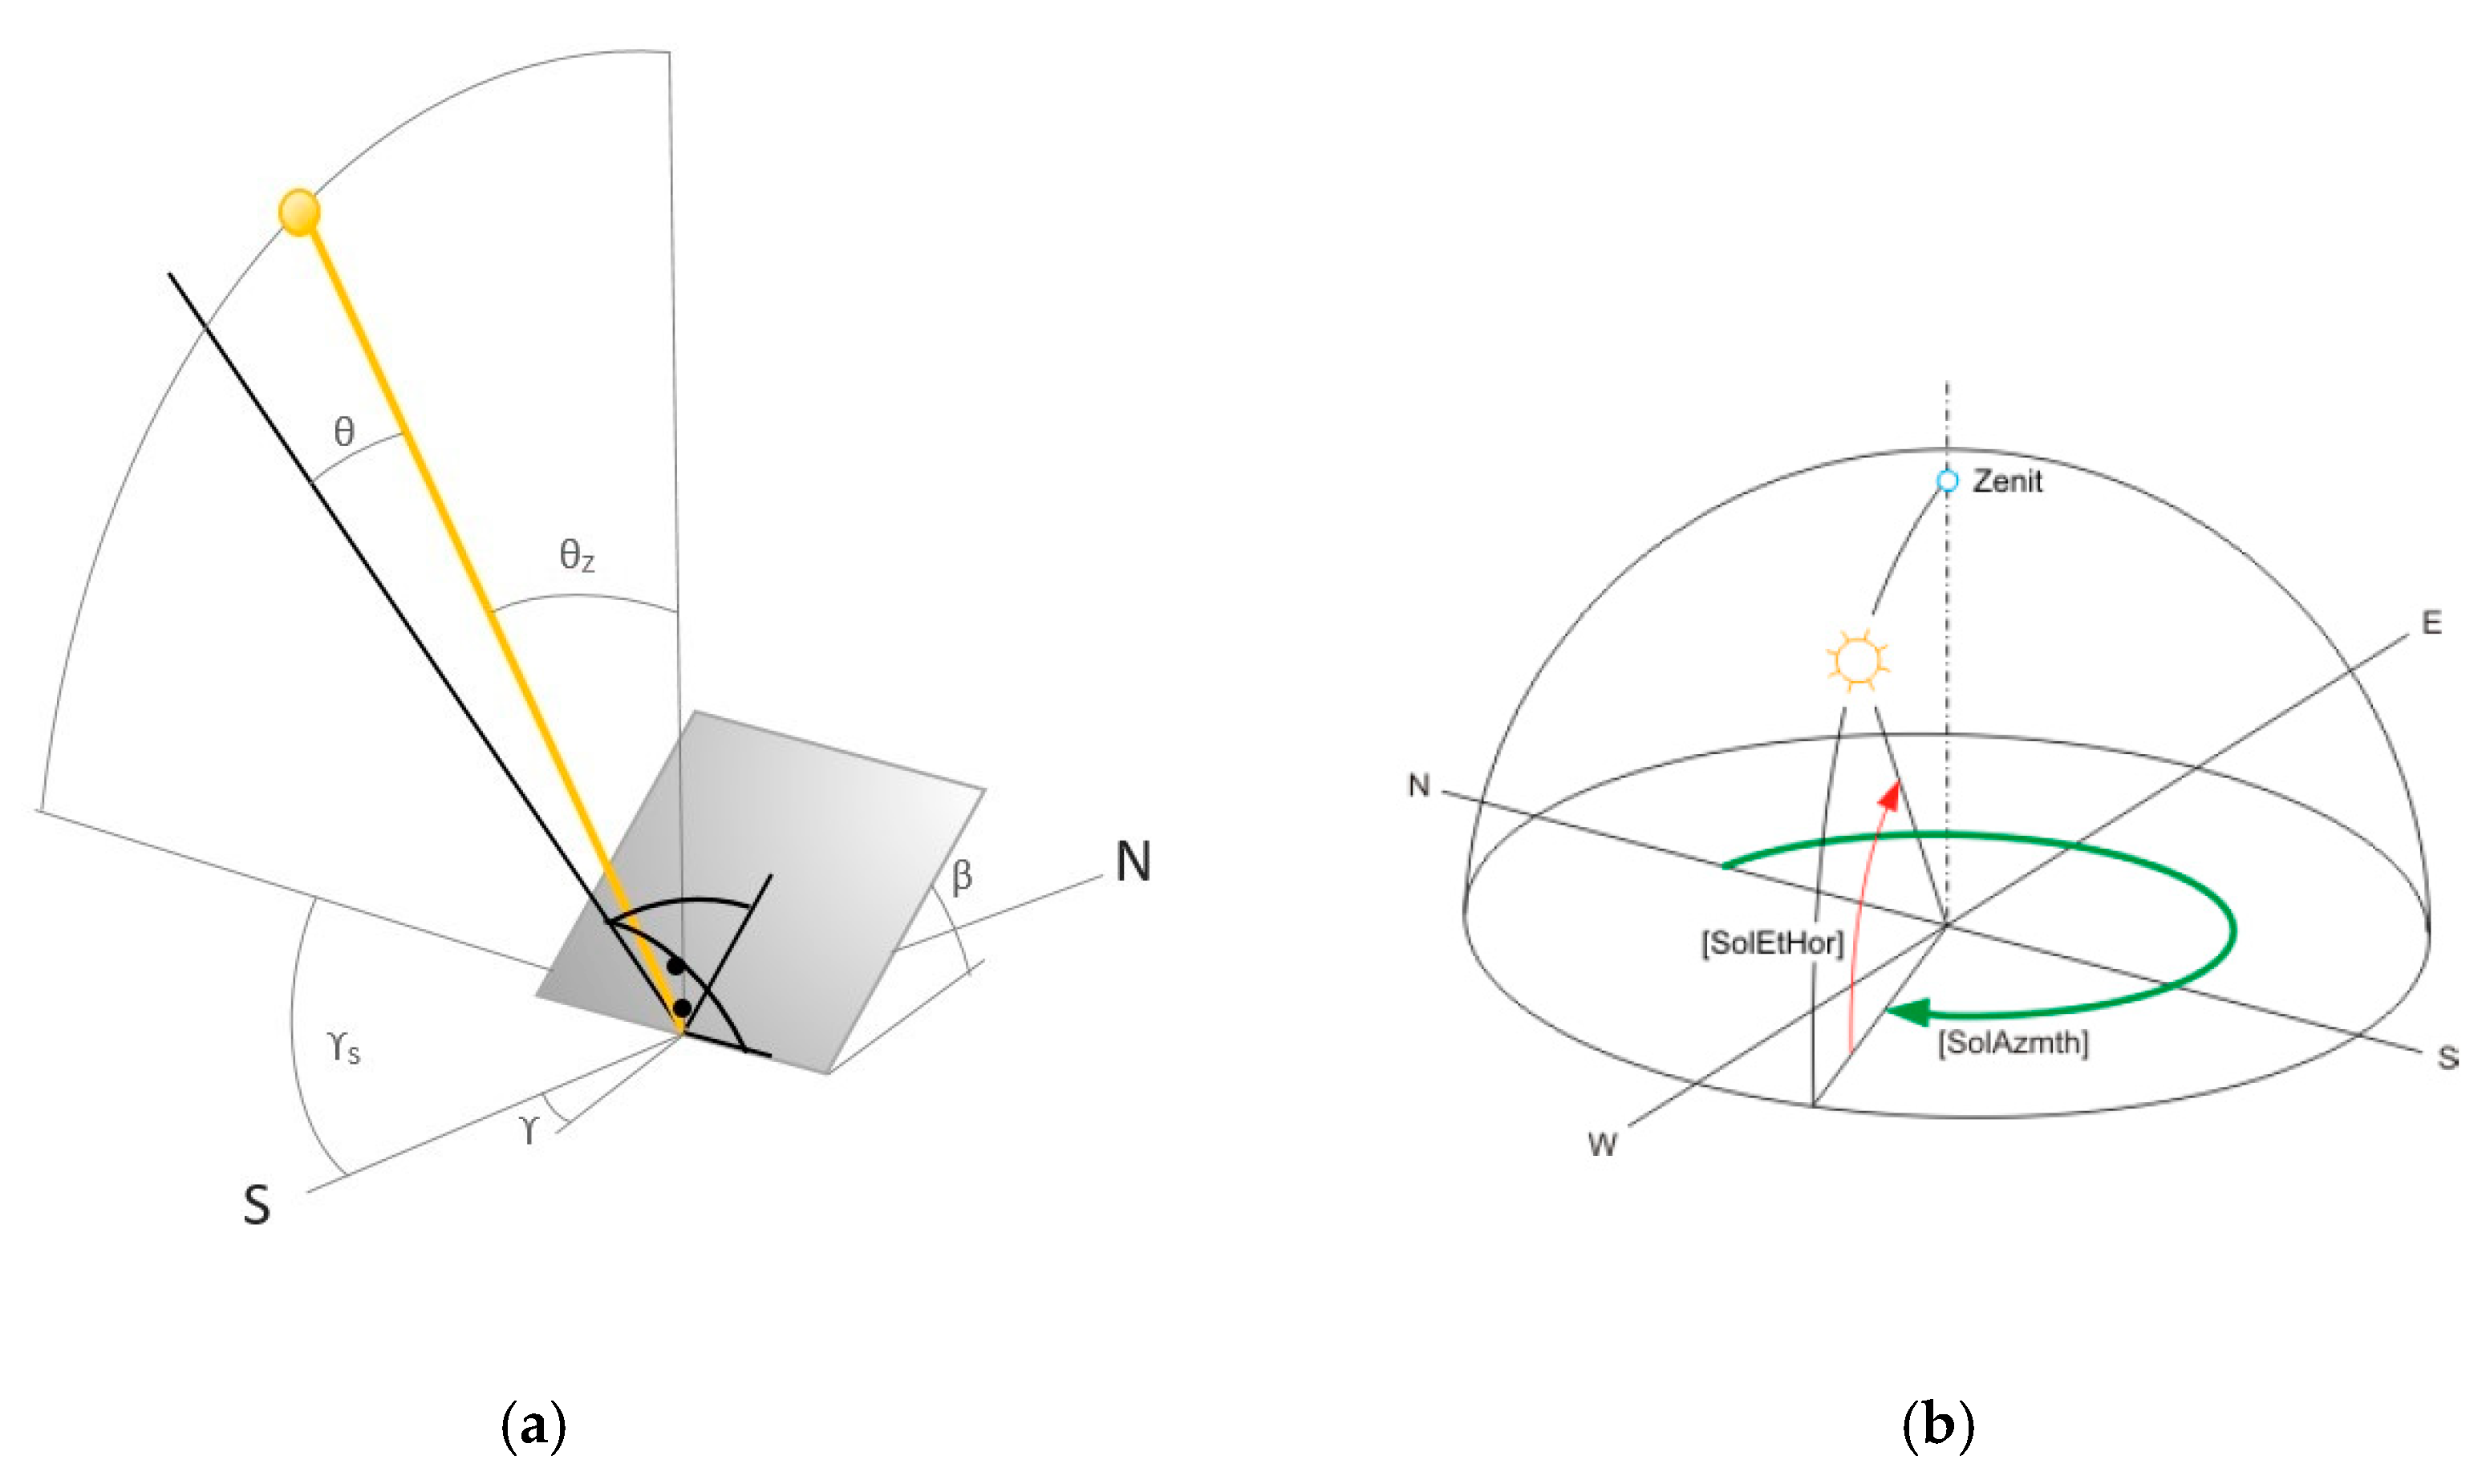
40] The particular parameters are shown in Figure 3, which shows solar radiation incident on a titled plane. The first step is to define the variable J’ that represents the average angular movement of the earth around the sun. With the variable J’, the height and position of the sun can be calculated.
J = 360 ° · day   of   the   year number   of   days   per   year
The declination δ is determined by the equation:
δ ( J ) = 03.948 23.559 · cos ( J + 9.1 ° ) 03.915 · cos ( 2 · J + 5.4 ° ) 01.764 · cos ( 3 · J + 26 ° )
To calculate the position of the sun for a specific place, it is necessary to know the altitude γs and the sun azimuth αs as those depend on the day and the season. The height of the sun is calculated as follows:
γ s =   arc   sin ( cos ω · cos φ · cos δ · sin δ )
The solar azimuth is given by the equation:
α s = 180 ° arc   cos sin γ s · sin φ sin δ cos γ s · cos φ   for   RLT 12   p . m .
or
α s   = 180 ° + arc   cos sin   γ s · sin φ sin δ cos γ s · cos φ   for   RLT > 12   p . m .
RLT—real local time, φ = latitude.
The solar radiation on an inclined south-facing surface with a tracker structure is described in [23] as follows. Declination is the angular position of the sun at noon with respect to the equator and is expressed by the equation:
δ   = 23 , 45 sin ( 360 284 + n 365 )
The solar hour angle (ω) is the angle of the sun east or west of the local meridian. The hour angle is positive in the morning, zero at noon and negative in the afternoon. Hourly angle is calculated as:
ω   = number   of   minutes   before   noon 4
The altitude angle (γs) is the angle between the sun rays and the horizontal surface, which is calculated as:
γ s =   sin 1   ( [ cos ω · cos φ · cos δ ] ) + [ sin φ · sin δ ]
The solar azimuth angle is the horizontal angle measured from north to the horizontal projection of the sun’s rays. The azimuth angle is given as:
α s = cos 1 ( [ sin γ s · sin φ ] sin δ cos γ s · cos φ )
The angle of the sun zenith is the angular distance of the sun from the local vertical and depends directly on the angle of the sun:
θ z = 90 γ s
The surface azimuth angle γ is the angle between the normal surface of the panel and the local meridian:
γ = 0 for south-facing surfaces
γ = 180−αs for surfaces with a biaxial tracker system.
The angle of incidence of solar radiation θ is the angle between the normal of the panel and solar radiation. This angle can be expressed by the equation:
θ   =   cos 1   ( sin δ · sin φ · cos β ) ( sin δ · cos φ · sin β · cos γ ) + ( cos δ · cos φ · cos β · cos ω ) + ( cos δ · sin φ · sin β · cos γ · cos ω ) + ( cos δ · sin β · sin γ · sin ω )
For a south-facing surface, γ = 0 and for the tracker system, the angle of incidence of solar radiation is θ = 0. The angle of the inclined plane of the tracker system (β) is given by the equation:
β   = 90 α s =   θ z

2.2. Solar Collector Efficiency and Causes of Stagnation

Harrison et al. [9] describe stagnation conditions as any situation in which a solar collector must receive heat from solar radiation and pass it on to the heat-transfer fluid, causing the solar collector and its components to rise in temperature above the maximum allowable level. Stagnation conditions may arise during the exposure to solar radiation when the flow of heat-transfer fluid in the system is interrupted due to technical faults such as power outages, component failures, system maintenance and repair and pump controller interventions due to capacity storage limitations or any other reason for temporary low heat consumption.
Stagnation behavior is crucial for long-term, reliable and low level of maintenance operation of solar thermal systems. This is particularly important in industrial applications where the entire installed thermal capacity of a solar system cannot be fully utilized. This may be due to technical failures (e.g., circulator pump failure), lack of heat consumption (e.g., weekends, holidays, maintenance, repairs) or power outages. This operating state causes all components in the solar system to be under high stress, which is different from normal operating conditions [41].
When the stagnation temperature is reached, the thermal output of the Qcoll solar thermal collector drops to zero. The heat output of a solar thermal collector can be approximated by the following equation:
Q coll =   A · G · ( η 0 a 1 · ( T m , f T a   ) G a 2 · ( T m , f T a ) 2 G )
Qcoll—thermal output of the collector [W]
A—area of the collector [m2]
η0—peak efficiency (conversion factor) [−]
a1—heat transfer coefficient at (Tm − Ta) = 0 [Wm−2 K−1]
a2—temperature-dependent heat transfer coefficient [Wm−2 K−2]
Tm,f—mean liquid temperature in the collector [°C]
Ta—ambient temperature [°C]
G—hemispherical solar radiation on the collector [Wm−2]
A temperature that reaches ηcoll = 0 gives a stagnant temperature Tstag each collector and can be calculated from the efficiency curve equation (Tm,f = Tstag):
T stag = G · η 0 · a 2 + ( a 1 2 ) 2 a 1 a 2 + T a
Tstag equilibrium (stagnant) temperature [°C].
The efficiency of a solar collector under steady conditions is defined as the ratio of the heat output dissipated by the heat transfer medium from the collector field to the incident solar radiation.
η   = Q k G · A k
η—efficiency of solar collector, Qk—heat output, G—amount of solar radiation [W/m2], Ak—reference surface of the collector [m2].
The reference surface for evaluating the efficacy may be the absorber area, the aperture area or the thick area. The efficiency of the solar collector is evaluated and reported as a curve depending on the climatic and operating conditions.
η   = Q k G · A k =   η 0 a 1 t m t e G a 2 ( t m t e ) 2 G
G—amount of solar radiation [W/m2], Ak—reference surface of the collector [m2], η0—solar collector efficiency at zero heat loss (optical collector efficiency), a1—linear heat loss coefficient [W/(m2.K)], a2—quadratic coefficient of heat loss of collector (expresses temperature dependence).

2.3. Experimental Details

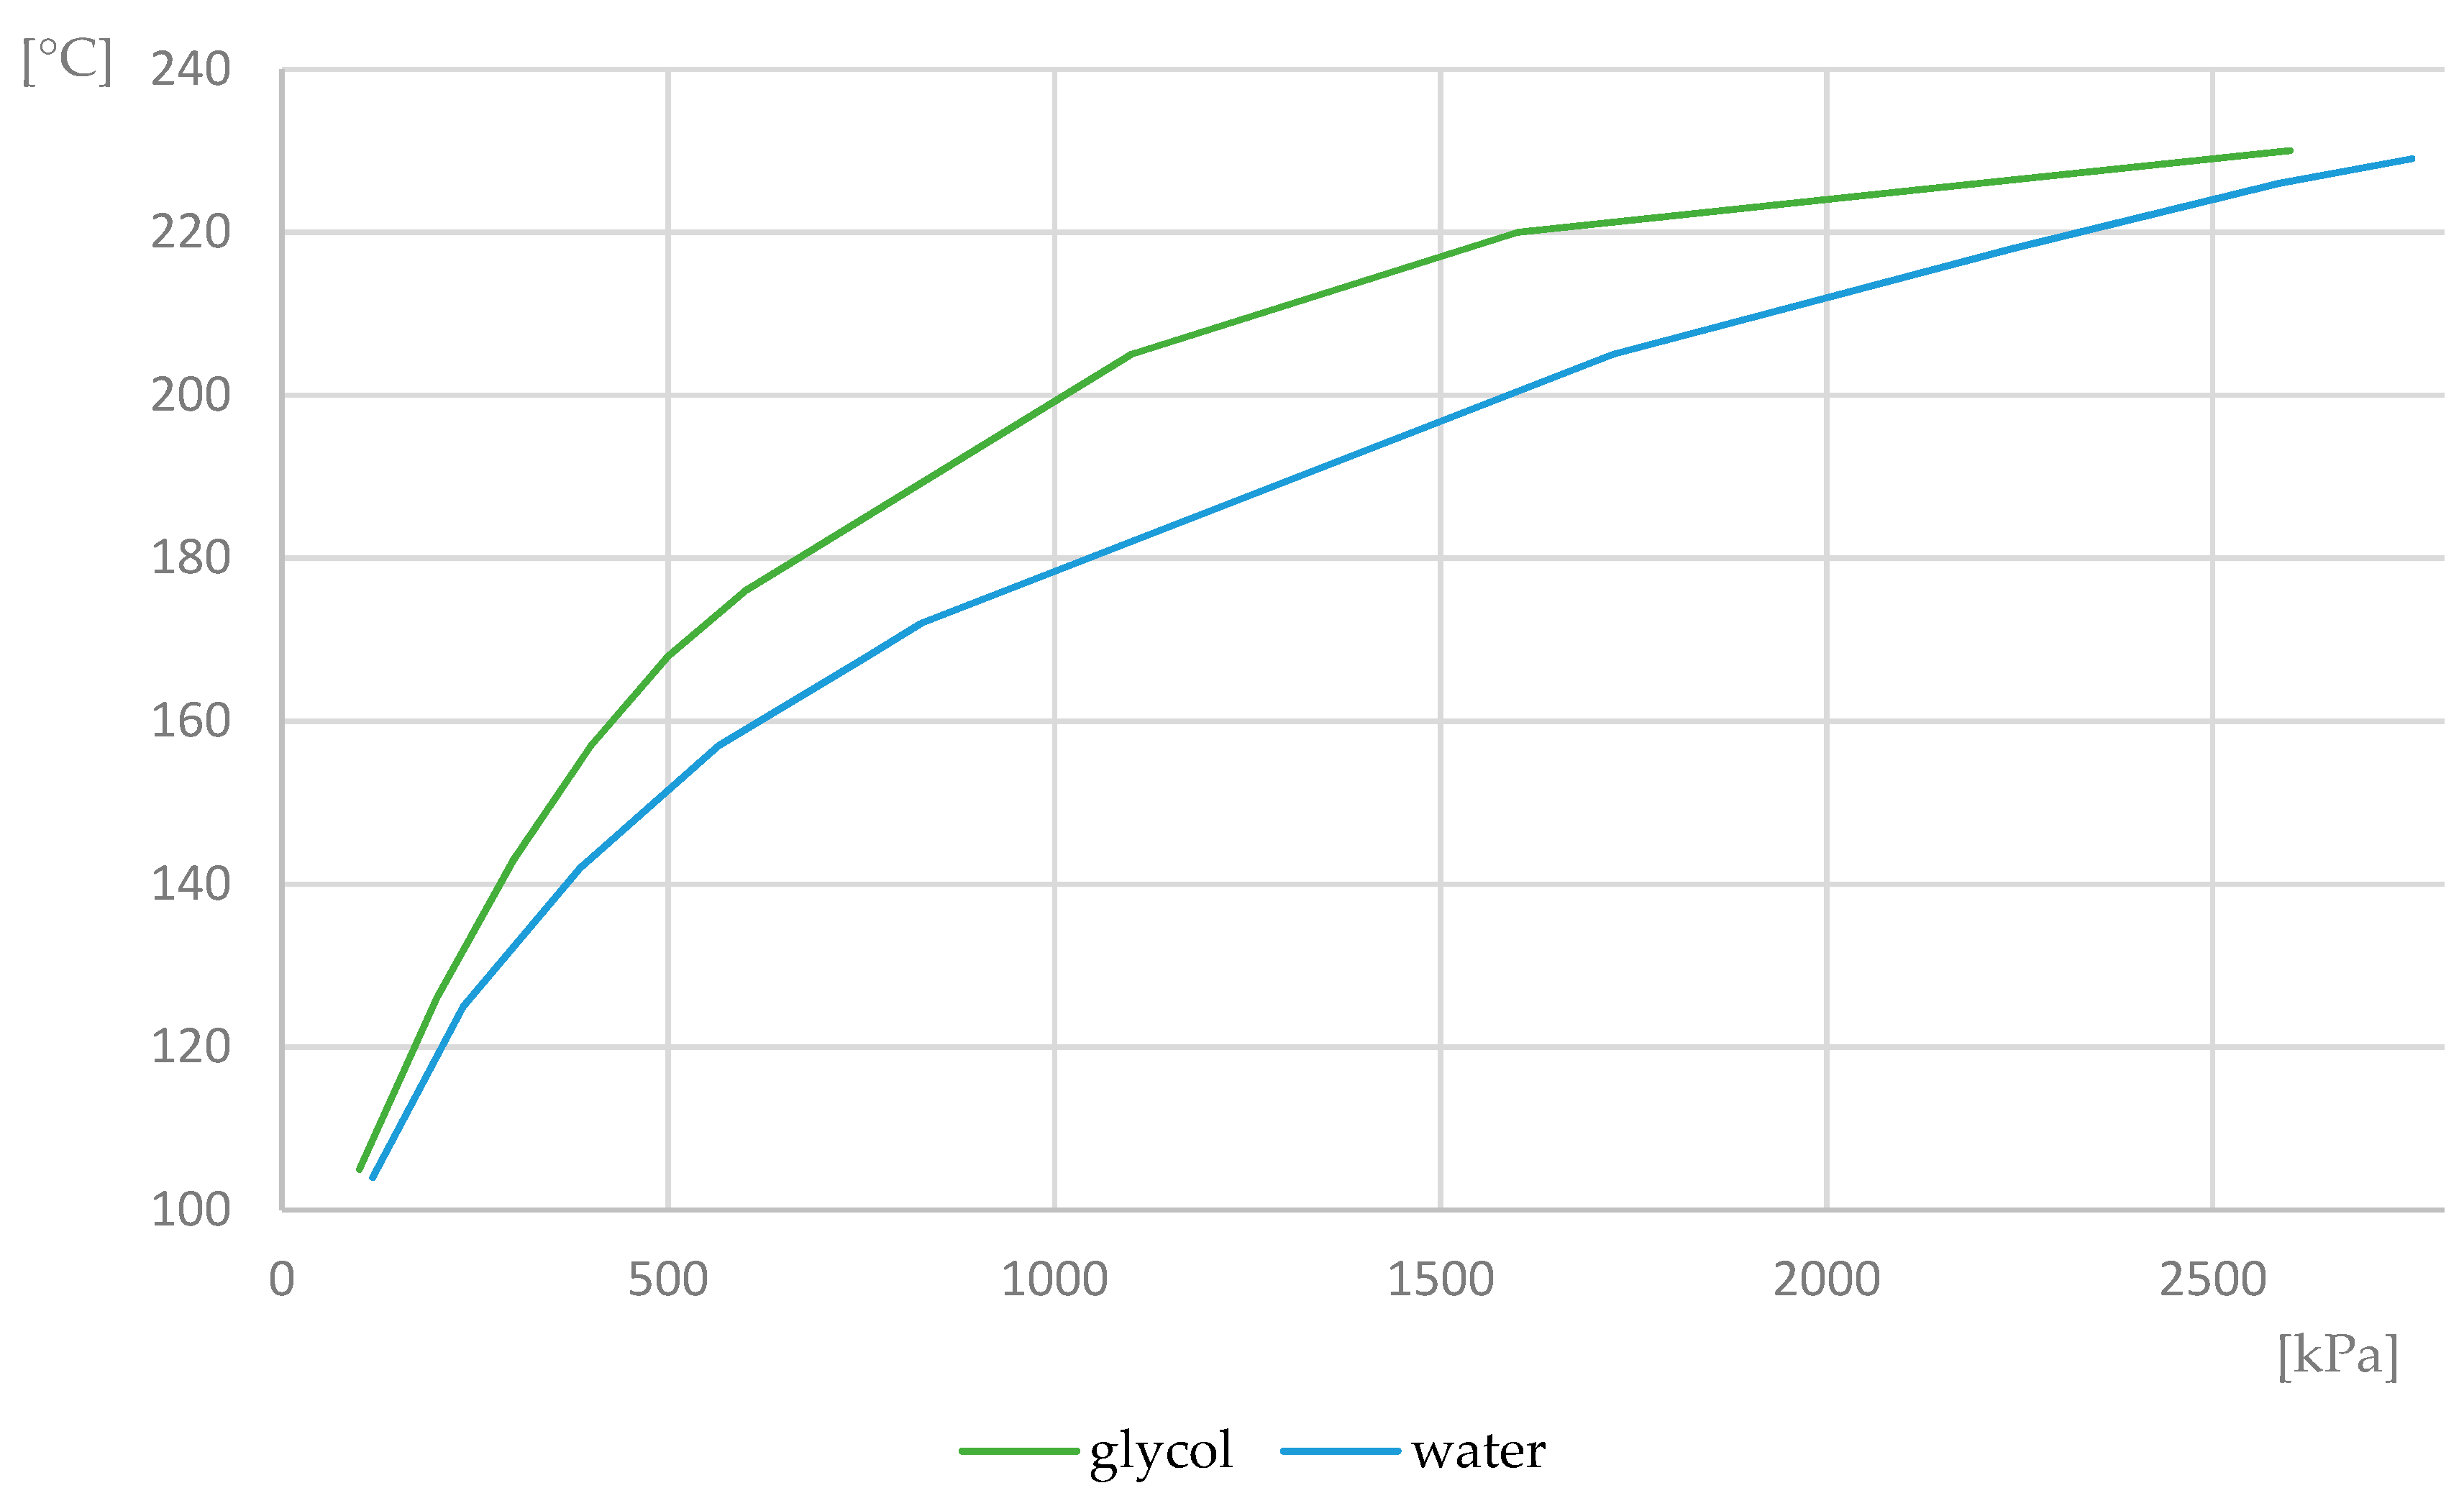
Heat-transfer fluid with a volume of 5.2 L flows through the collector with a flow rate of 4.6 L.min−1. It is a heat-transfer fluid Agrimex Collector P super with a low pour point suitable for all types of collectors. The liquid is based on monopropylene glycol (1,2-propanediol) with the addition of non-toxic corrosion inhibitors and stabilizer to achieve increased thermal stability and extended life. The heat-transfer fluid has a freezing temperature of −30 °C, which is necessary for local climatic conditions. The fluid can be short-term overheated up to 300 °C and has constant heat conductivity and pH. In addition, the heat capacity and density of the fluid are only slightly variable at different temperatures. The temperature pressure diagram is shown in Figure 4. These properties have a high stability and are suitable for performing experiments and measurements. The heat-transfer fluid is described in Table 1.
Fluid life expectancy in professionally operated systems is 10 years. The manufacturer recommends checking the fluid for freezing temperature and pH once every 2 years. Table 2 shows the parameters of the heat-transfer fluid in temperature regimes of −30 °C to 100 °C.

2.4. Tilting of Collectors

Tilting of collectors is carried out thanks to the construction solution that tilts around one axis. Azimuth extrapolation is used to determine the correct position of the collector. Due to the size of the whole multivalence system of the experimental laboratory, a part with a gas boiler and thermal panels was used and the resulting scheme of the part of the system used in the experiments is shown in Figure 5. This system consists of the control system, a three-way changeover valve with actuator and a fluid flowmeter with calorimetric counter. The thermal energy that is obtained from the panels is transmitted in the DHW cylinder VT-S 1000 FRMR with a capacity of 970 L and then in the PSR 800 with the capacity of 800 L.
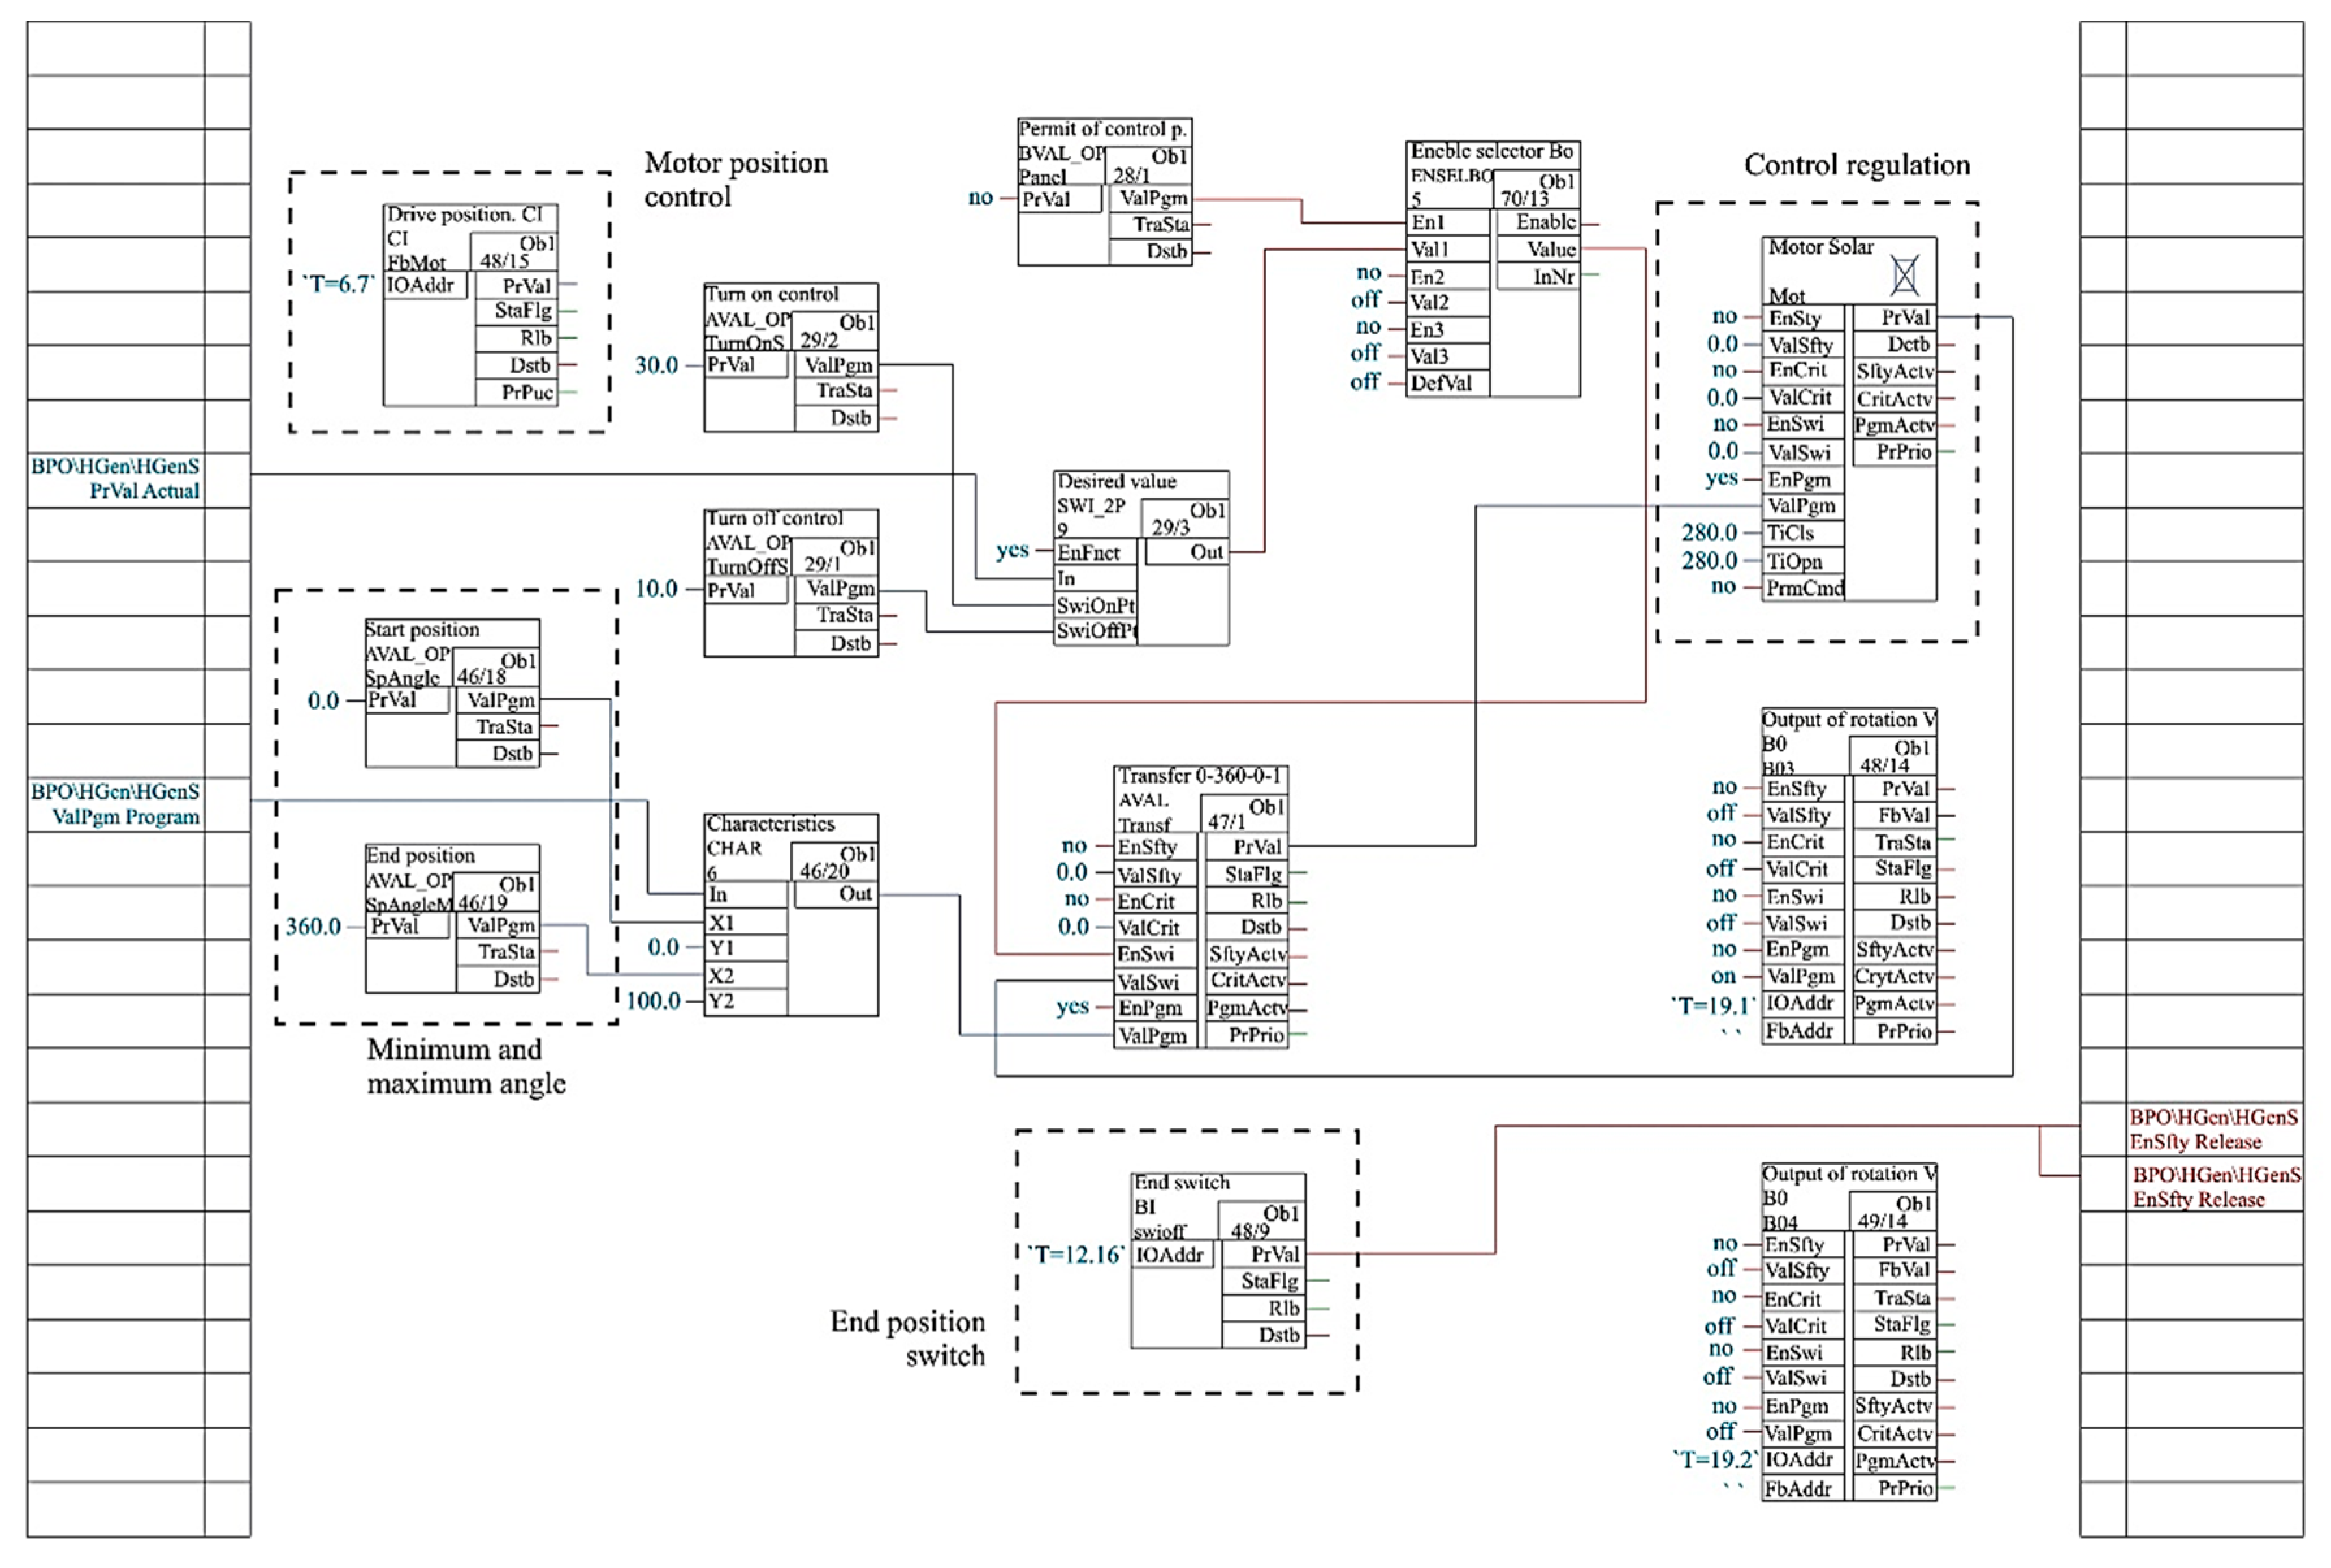
Position control (Figure 6) transfers the signal to two binary outputs with three degrees: open–close–stop; in this case it is a right–left–stop. This signal is determined by evaluating the solar radiation intensity. In case of sufficient solar radiation intensity, the structure is tilted according to the current recalculated position of the sun. If the intensity falls below the critical solar radiation intensity, the engine stops. Subsequent triggering occurs only after the solar radiation intensity has increased again. To ensure the rotation of the structure, the end position sensors are located in the end positions (Figure 7), which also serve as zero points for the calculation of end positions in the interval 0–100.
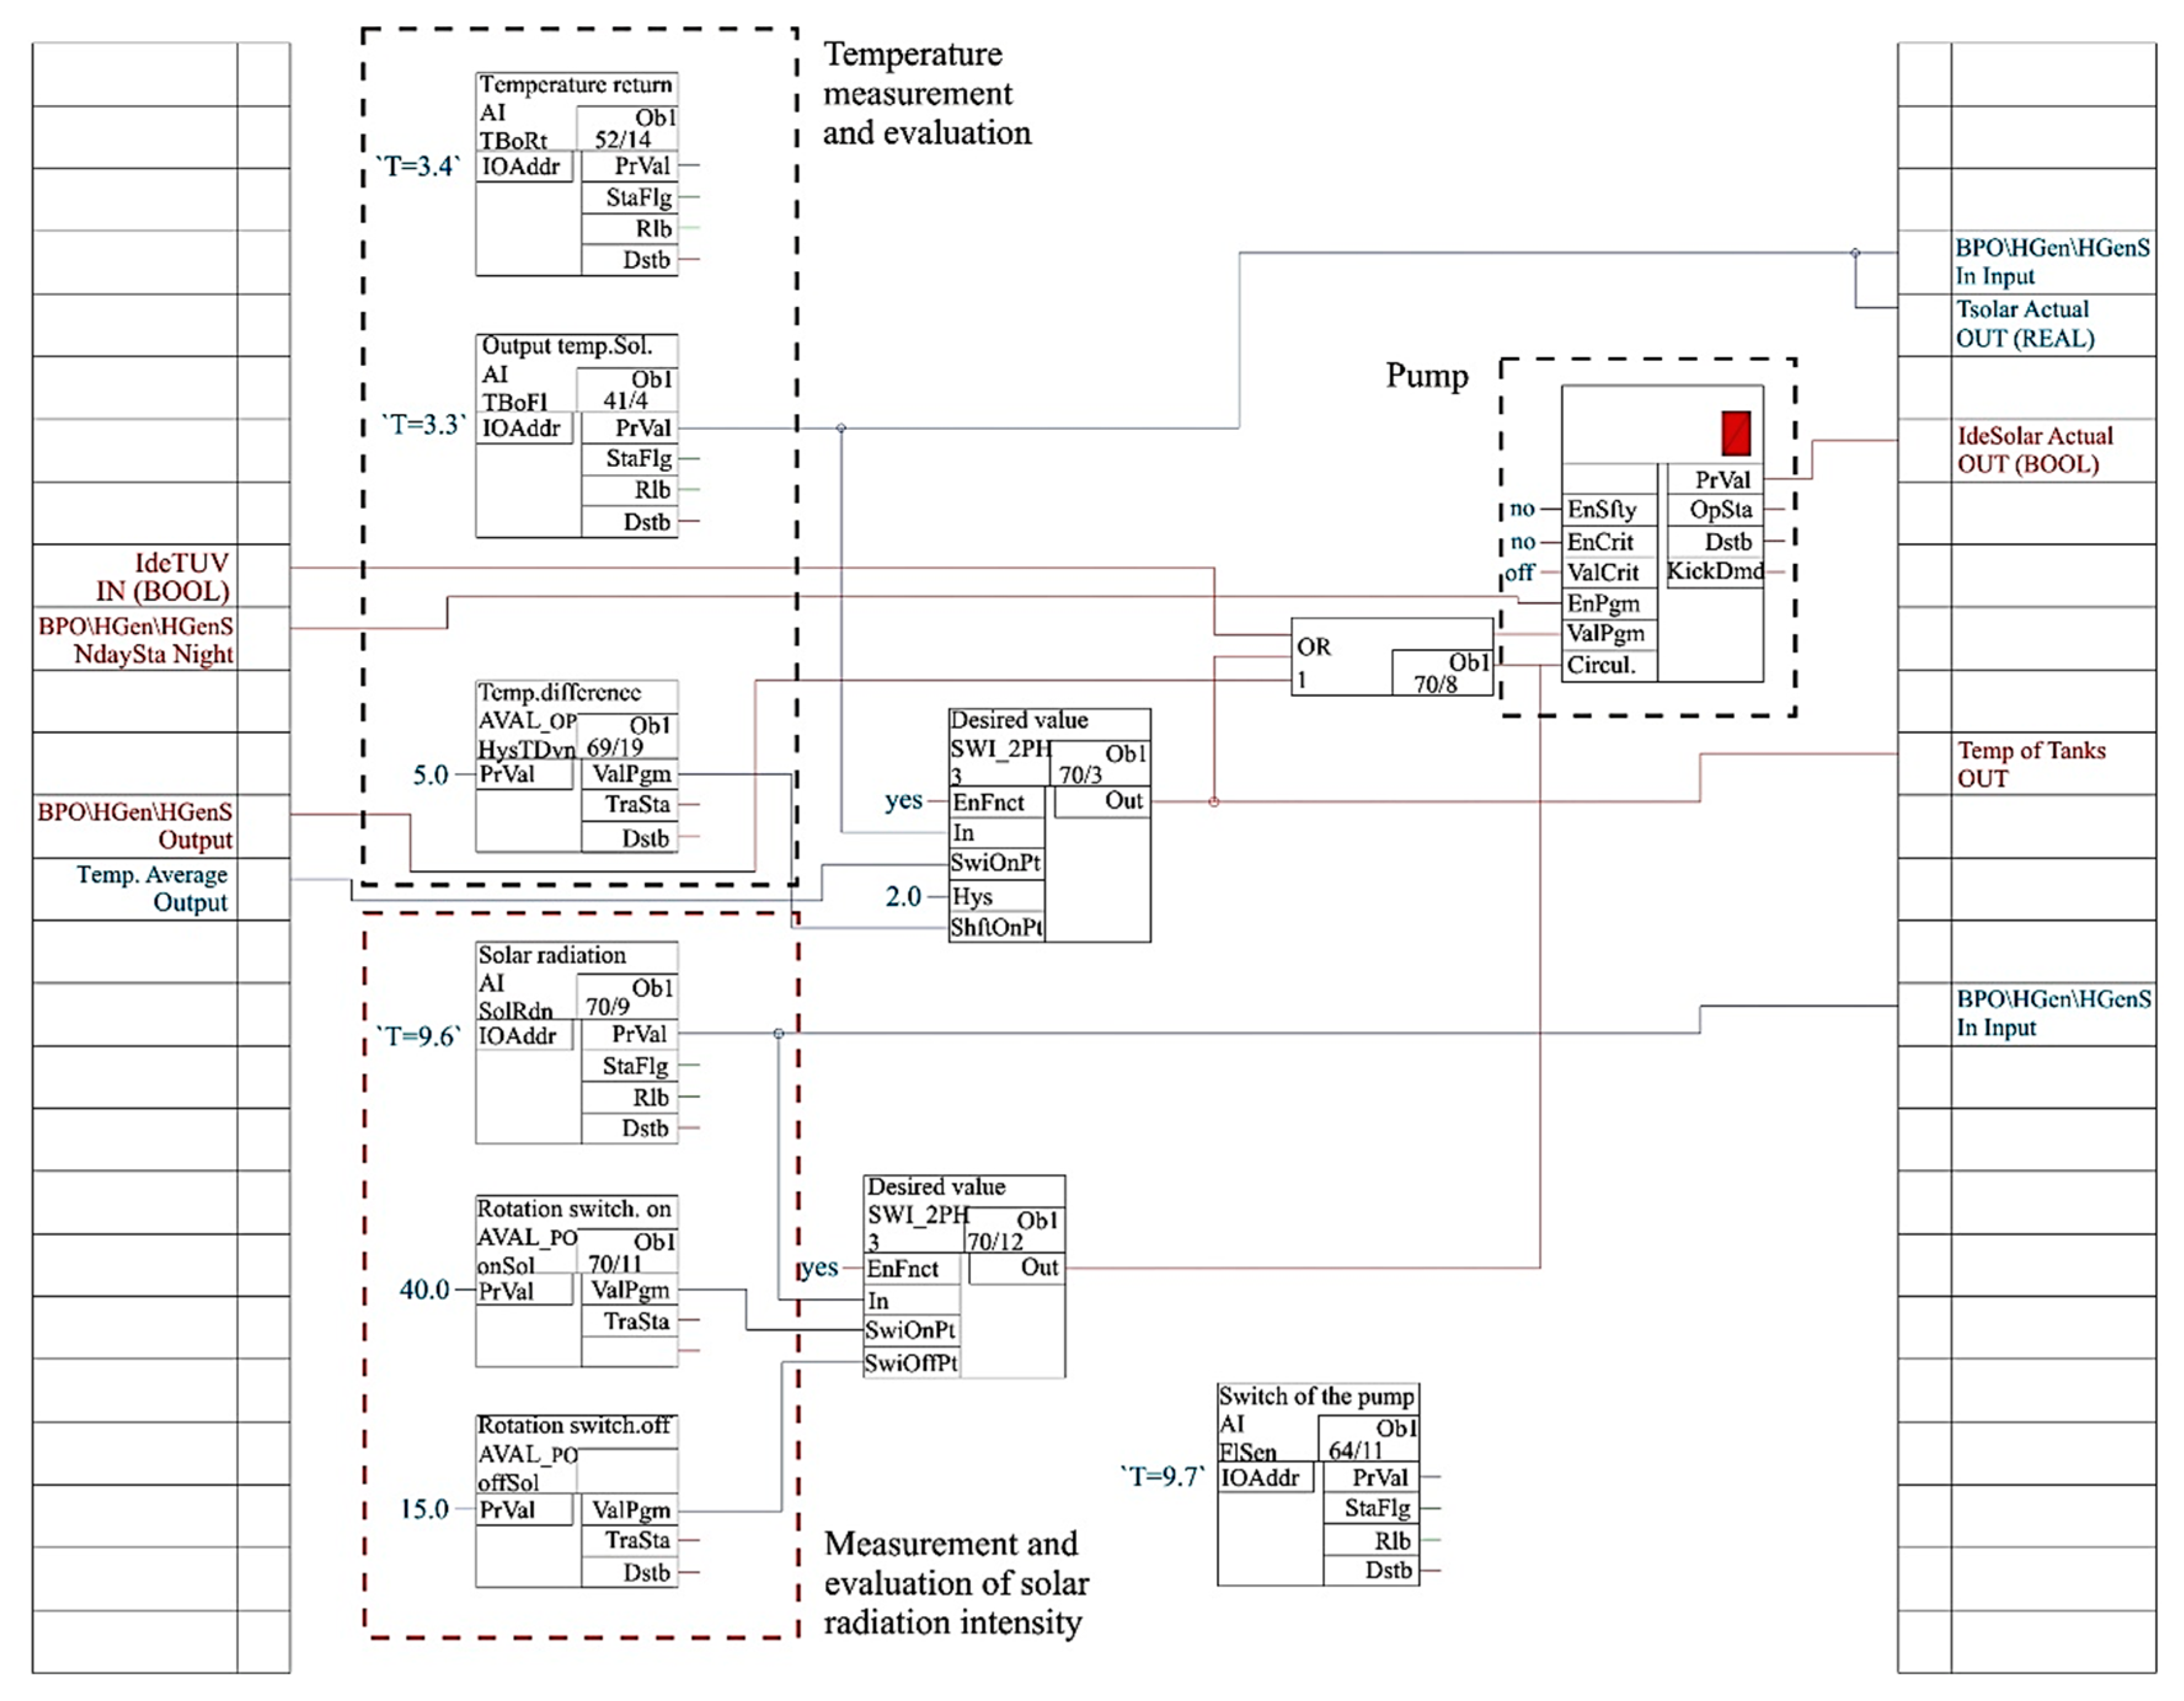
The pump operation (Figure 8) is conditional upon the achievement of the defined difference of the measured temperature values at the output of the solar panels and the temperature values in the accumulation tanks.

3. Results

3.1. Climatic Conditions during Measurements

In terms of location, the laboratory is located in the city of Prešov (Slovakia). In terms of climatic conditions, the city is located in the northern temperate zone, which is characterized by four seasons. Prešov region belongs to a slightly warmer area, where the average annual temperature ranges from 4 to 8 °C. Wind conditions are complicated not only due to the complex orography (land relief), but also due to the great variability of weather during the year. The homogeneity of the active surface, which determines its roughness, also plays an important role. The average annual wind speed ranges from 2 to 3 m s−1. In terms of precipitation, 40% of precipitation is projected for the summer (June–August), 25% for the spring, 20% for the autumn and 15% for the winter (the prevalence of precipitation in the summer is obvious). The most rainy months are June or July, with the least rainfall in January to March. In winter, much of the rain falls in the form of snow.
The average amount of sunlight during the monitored period ranged from 100 W/m2 to a daily average of over 500 W/m2. It can be seen from Figure 9 that days with average values of about 500 W/m2 are those during which suitable conditions for stagnation due to the high values of incident solar radiation may occur. These days represented 40% of the total number of days measured in the given period. In summer, there may also be a long-lasting series of sunny and steady days, when the solar system can overheat and then approach or reach a stagnant temperature. Therefore, the solar system must be properly designed and properly sized to prevent the entire system from overheating even in the case of low hot water demand in summer.

3.2. Experimental Verification of the Operation of the Tilting System in Relation to Stagnation

3.2.1. Simulation of Incident Solar Radiation on the Solar Thermal Collector

The tilting is automatically controlled with using a control system Siemens Desigo Insight and due to the position of the sun, the panel tilts from east to west during the day. Figure 10 and Figure 11 show the tilting of the panel. By tilting the panel in the direction of incident solar radiation, we effectively increase the amount of solar radiation obtained and hence the efficiency of the solar system. The maximum amount of incident solar radiation during the noon is up to 1000 W/m2. By tilting the panel according to the current position of the sun, high solar gains are achieved even in the morning and afternoon, when the amount of incident solar radiation is around 800 W/m2.
Figure 12 shows the panel tilting eastward at noon and in the afternoon. This tilting is a convenient way to reduce solar radiation intake and avoid further stagnation in the event of stagnation processes, thereby protecting the entire solar system. By tilting the panel at noon to the east position, the amount of incident solar radiation is reduced by approximately 200 W/m2, which produces an immediate reduction of 20% in the amount of energy received. When the panel is tilted eastward in the afternoon, the reduction in the amount of solar radiation received is dramatically lower. The amount of incident solar radiation will be thus reduced by up to 62.5%. By suitable tilting of collectors, it is possible to significantly increase the amount of incident solar radiation, and, if necessary, to reduce the amount of incident solar radiation in order to protect the solar system from the adverse effects of overheating.

3.2.2. Results

Measurements were performed using the Siemens Desigo Insight control system. In one window of the experiment it was possible to measure 10 parameters and 604,800 values. The data were recorded for up to 7 days and 20 experiments can be performed in parallel. The measurements time can be set with an increment of 1 s, 10 s, 1 min, 10 min and 1 h. Data export was realized in database software for further processing and evaluation. A backup radiation intensity meter was also available and the entire system was protected by a pressure safety system.
Measurements and simulations were performed in summer. Under the conditions of Slovakia, the amount of incident solar radiation in the summer increases by 2/3 and together with temperatures exceeding 30 °C in the summer months there was a risk of stagnation processes. According to Figure 13, it can be said that the illumination intensity has a great influence on the amount of incident solar radiation and that these two quantities were closely related. On sunny days, solar radiation values exceeding 900 W/m2 were measured. The intensity of illumination exceeded 75 klx on a sunny day.
Figure 14 shows the temperatures in different parts of the system and their changes over a sunny day. The measurement was performed on 6 October 2019. The measurements show the courses of output temperature, inlet temperature, ambient temperature as well as the temperatures in the tank measured at four measuring points according to Figure 5. Measurements were performed continuously with adjustable increment 1 s, 10 s, 1 min, 10 min and 1 h. An increment of 1 min was used for the given measurements in order to maintain the accuracy. The Siemens Desigo Insight was used as the control system. After sunrise and the panel field illumination, the working fluid flowing through the collectors begins to heat up and rapidly increases its temperature. The figure shows the temperature fluctuations in the morning, which was caused by a brief shading of the panel by the surrounding trees in close proximity. The shading takes place in the early morning hours and lasts briefly, so its impact on the amount of incident radiation was negligible. The outlet temperature of the system continuously increases and reaches its maximum at noon. The outlet temperature rises from 26 °C to 82 °C. Together with the flow temperature, the tank temperature increases. In the tank, the temperature was measured in four layers and it can be seen that the temperatures in the tank were not the same, but in the upper parts were up to 10 degrees higher. As the temperature in the collectors increases, the temperature in the storage tank increases and the individual layers of the storage tank heat up. Along with decreasing amount of incident solar radiation, the temperature in the system and in the lower layers of the container decreases too.
During the measured period, several simulations were carried out in which the circulation pump was stopped and the temperature in the solar system increased. Simulations also included tracking of the panel tilting and its effect on the system temperature. Figure 15 and Figure 16 show a simulated failure of the circulation pump, where at 12:43:30 the pump was switched off and a significant temperature rise follows. At 12:43:30 the outlet water temperature was 81.3 °C and at 12:47:35, when the circulation pump was restarted, the temperature reaches 92.7 °C. The temperature rose by 11.4 °C during 4 min pump failure. If the circulation pump fails on a sunny day, such a condition was highly undesirable and creates a risk of damage to the entire system. One possibility in the event of a pump failure was to tilt the panel away from the incident solar radiation. In another simulation, the panel was tilted to the end position and the circulation pump was switched off at 12:49:00. After the pump has stopped, the temperature of the panel continues to drop to a minimum of 79.8 °C at 12:51:45. In the following minutes the temperature rises and reaches 86.7 °C at 12:55:50. The temperature rose by 6.9 °C during 4 min pump failure while the tilted towards the east. The temperature increase was considerably slower (by up to 39.5%) compared to the temperature rise during pump failure when the panel was not tilted.
Figure 17 and Figure 18 show the effect of the panel tilting to the end position and subsequent cooling of the water in the tank overnight. At high liquid temperatures, these could be lowered by tilting the structure. The figures show that the output temperature of the solar system responds sensitively to the tilting of the panel. At 13:45, when the panels were tilted to the end position, the outlet temperature reached 80.3 °C. After 60 min, the outlet temperature dropped by 8.1 °C to 72.2 °C, and water also cooled in the tank where the mean temperature dropped by 2.2 °C. When the tracker structure returned to the automatic position, the temperature in the solar system rose by 5.4 °C to 77.6 °C in 15 min. The next time the panels were turned to the east, the system temperature drops again to 71.3 °C. In case of high temperatures in the system, tilting the panel was a great way of reducing the temperature. One of the causes of overheating of the solar system may be high temperatures in the storage tank. The temperature in the tank can be reduced by circulating water in the system during the night, when the solar system receives no sunlight and therefore no heat. Thus, by circulating the medium, the thermal energy stored in the storage tank was transferred to the colder external environment. The cooling of the storage tank was not even, but rather successive (layer by layer). When the water was circulated throughout the system overnight, the water temperature in the tank can drop by tens of degrees. Figure 6 shows the discharge of the storage tank during the night, where the effect of stratification was visible as the storage tank cools in the bottom. This method was suitable in high accumulation of storage tanks and low hot water consumption.
Elimination of stagnation can be done in several ways that can effectively lower temperatures throughout the system. The above-mentioned studies [16,17,18,19,20,21] dealing with solutions to alleviate and prevent stagnation focus on measures dealing with the technical adaptation of collectors such as the deployment of cooling systems, protective layers or replacement of the heat transfer medium. The limitation of the system is its high cost of tracker construction and control system. Individual use of the system in houses is unprofitable. The system is suitable for high-rise buildings where the area for the location of solar thermal collectors is limited. Automatic control ensures smooth operation and protection of the entire system.

4. Conclusions

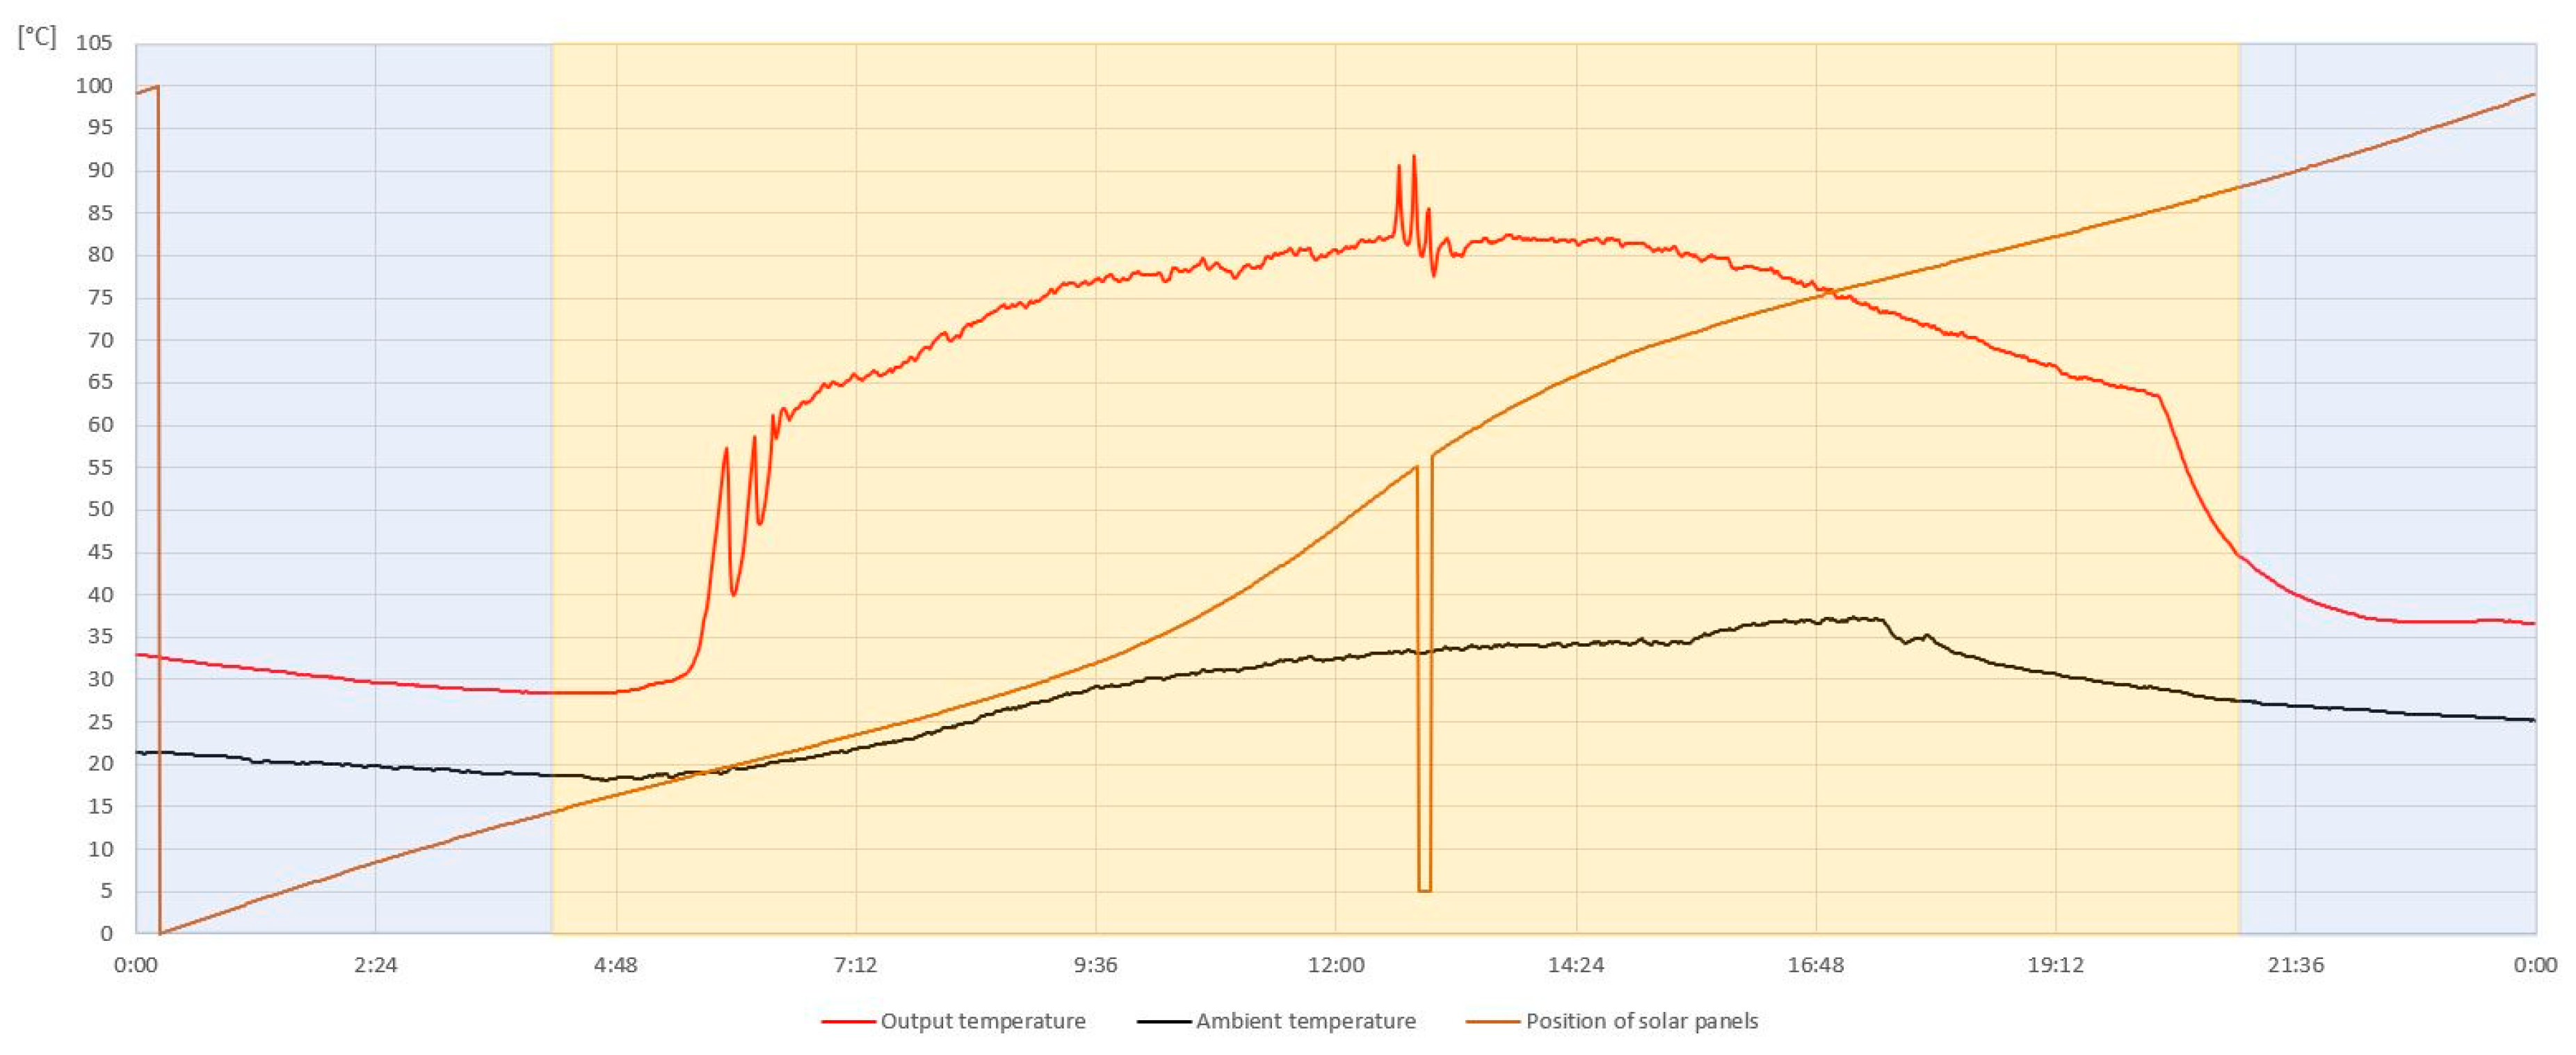
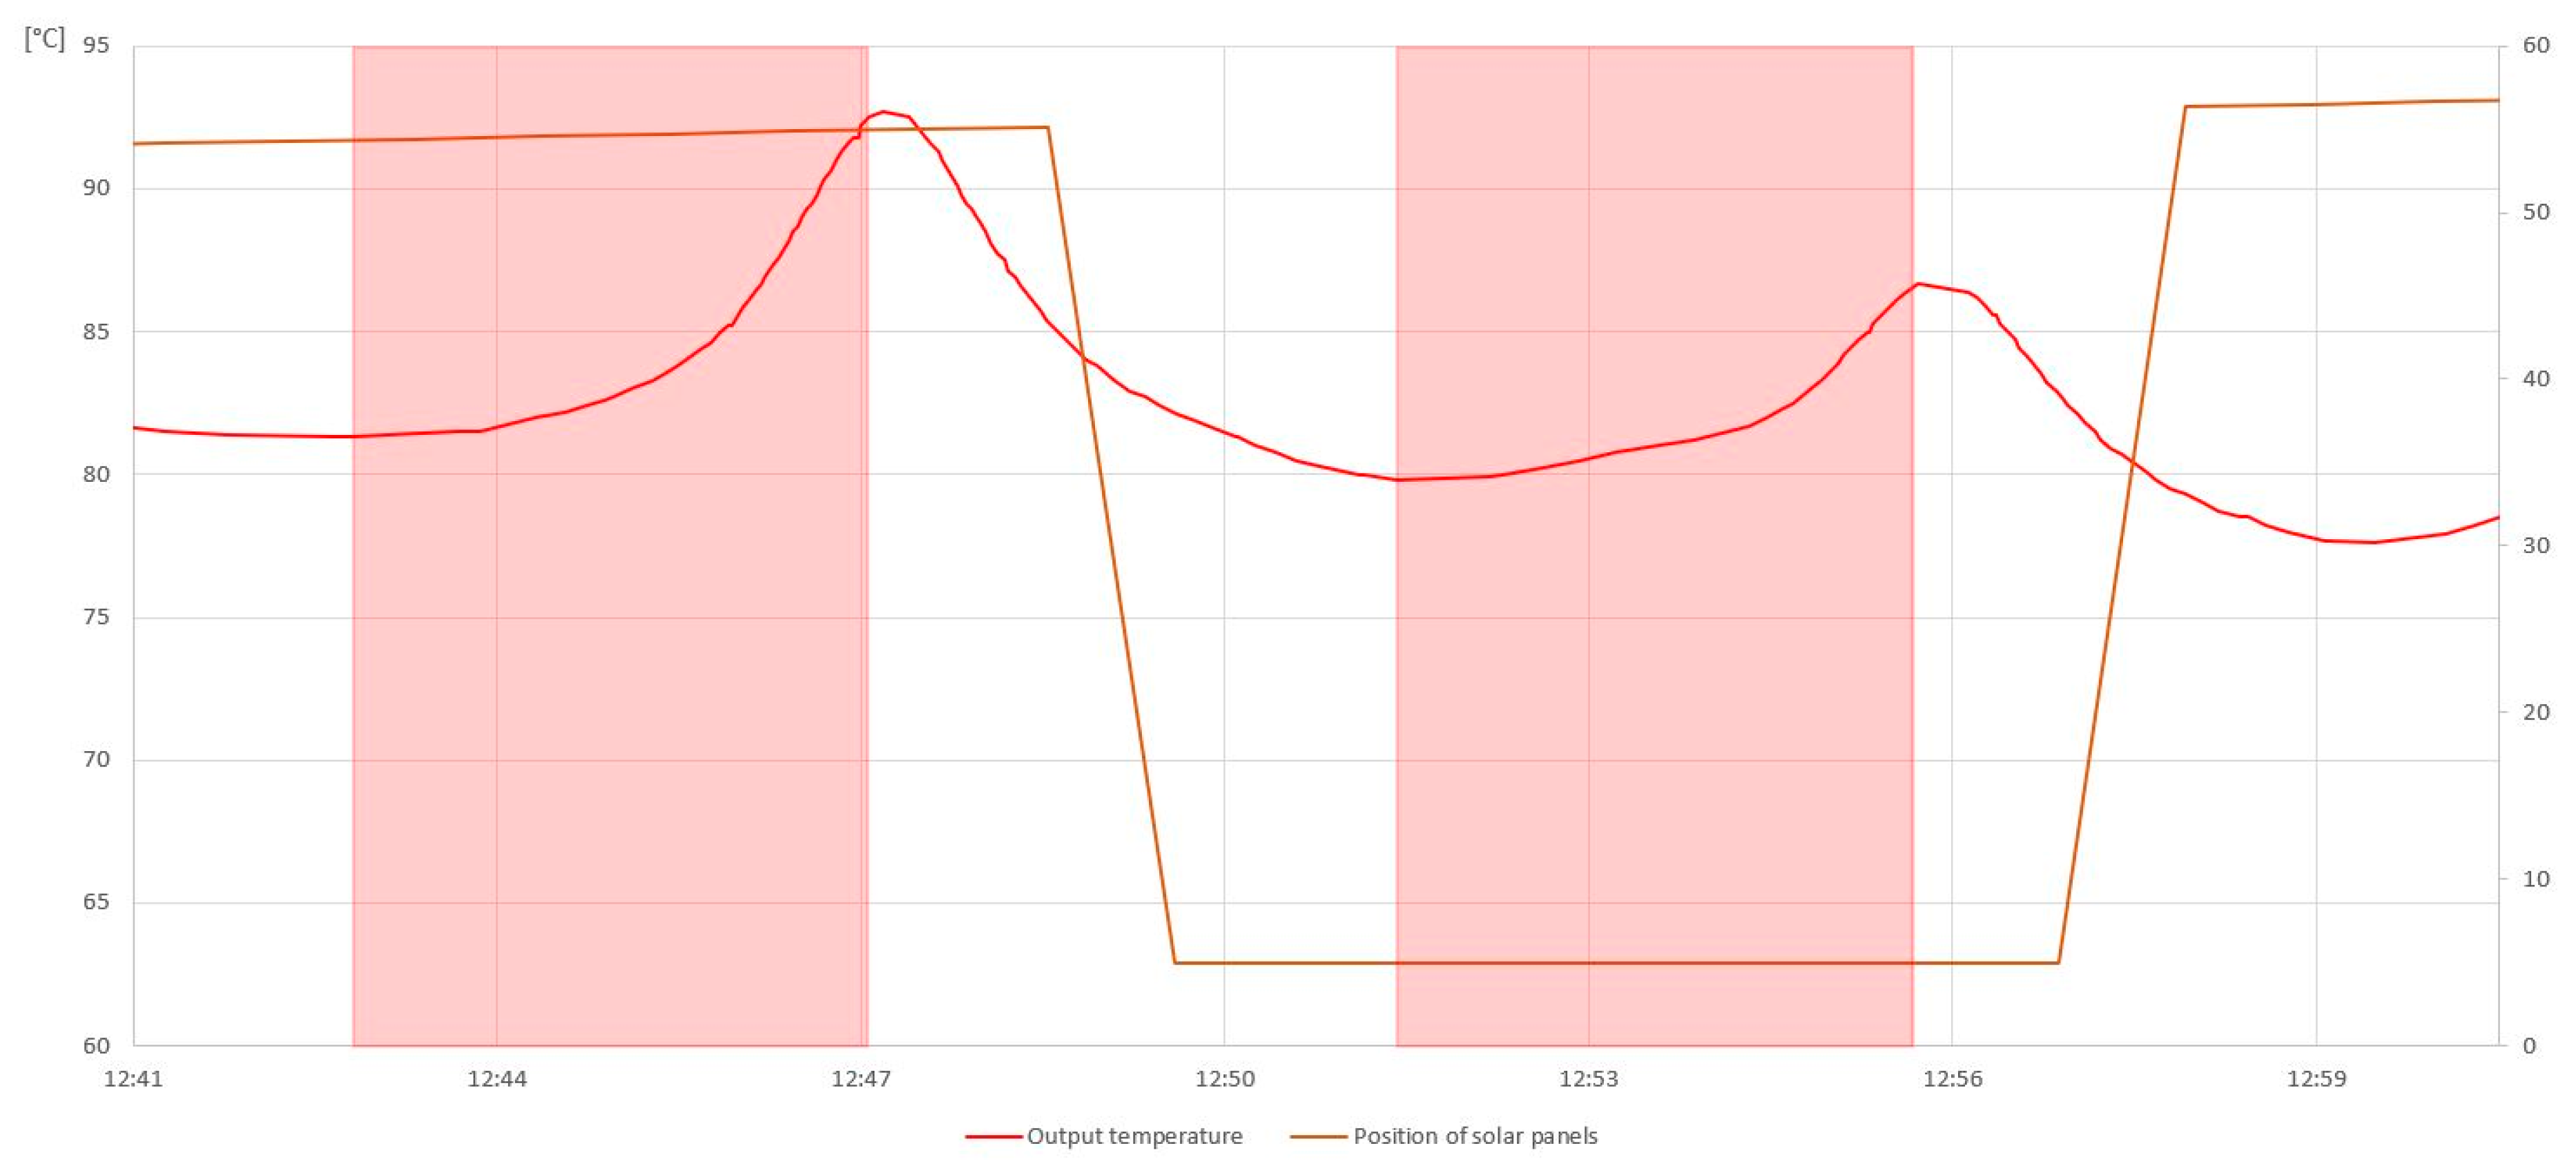
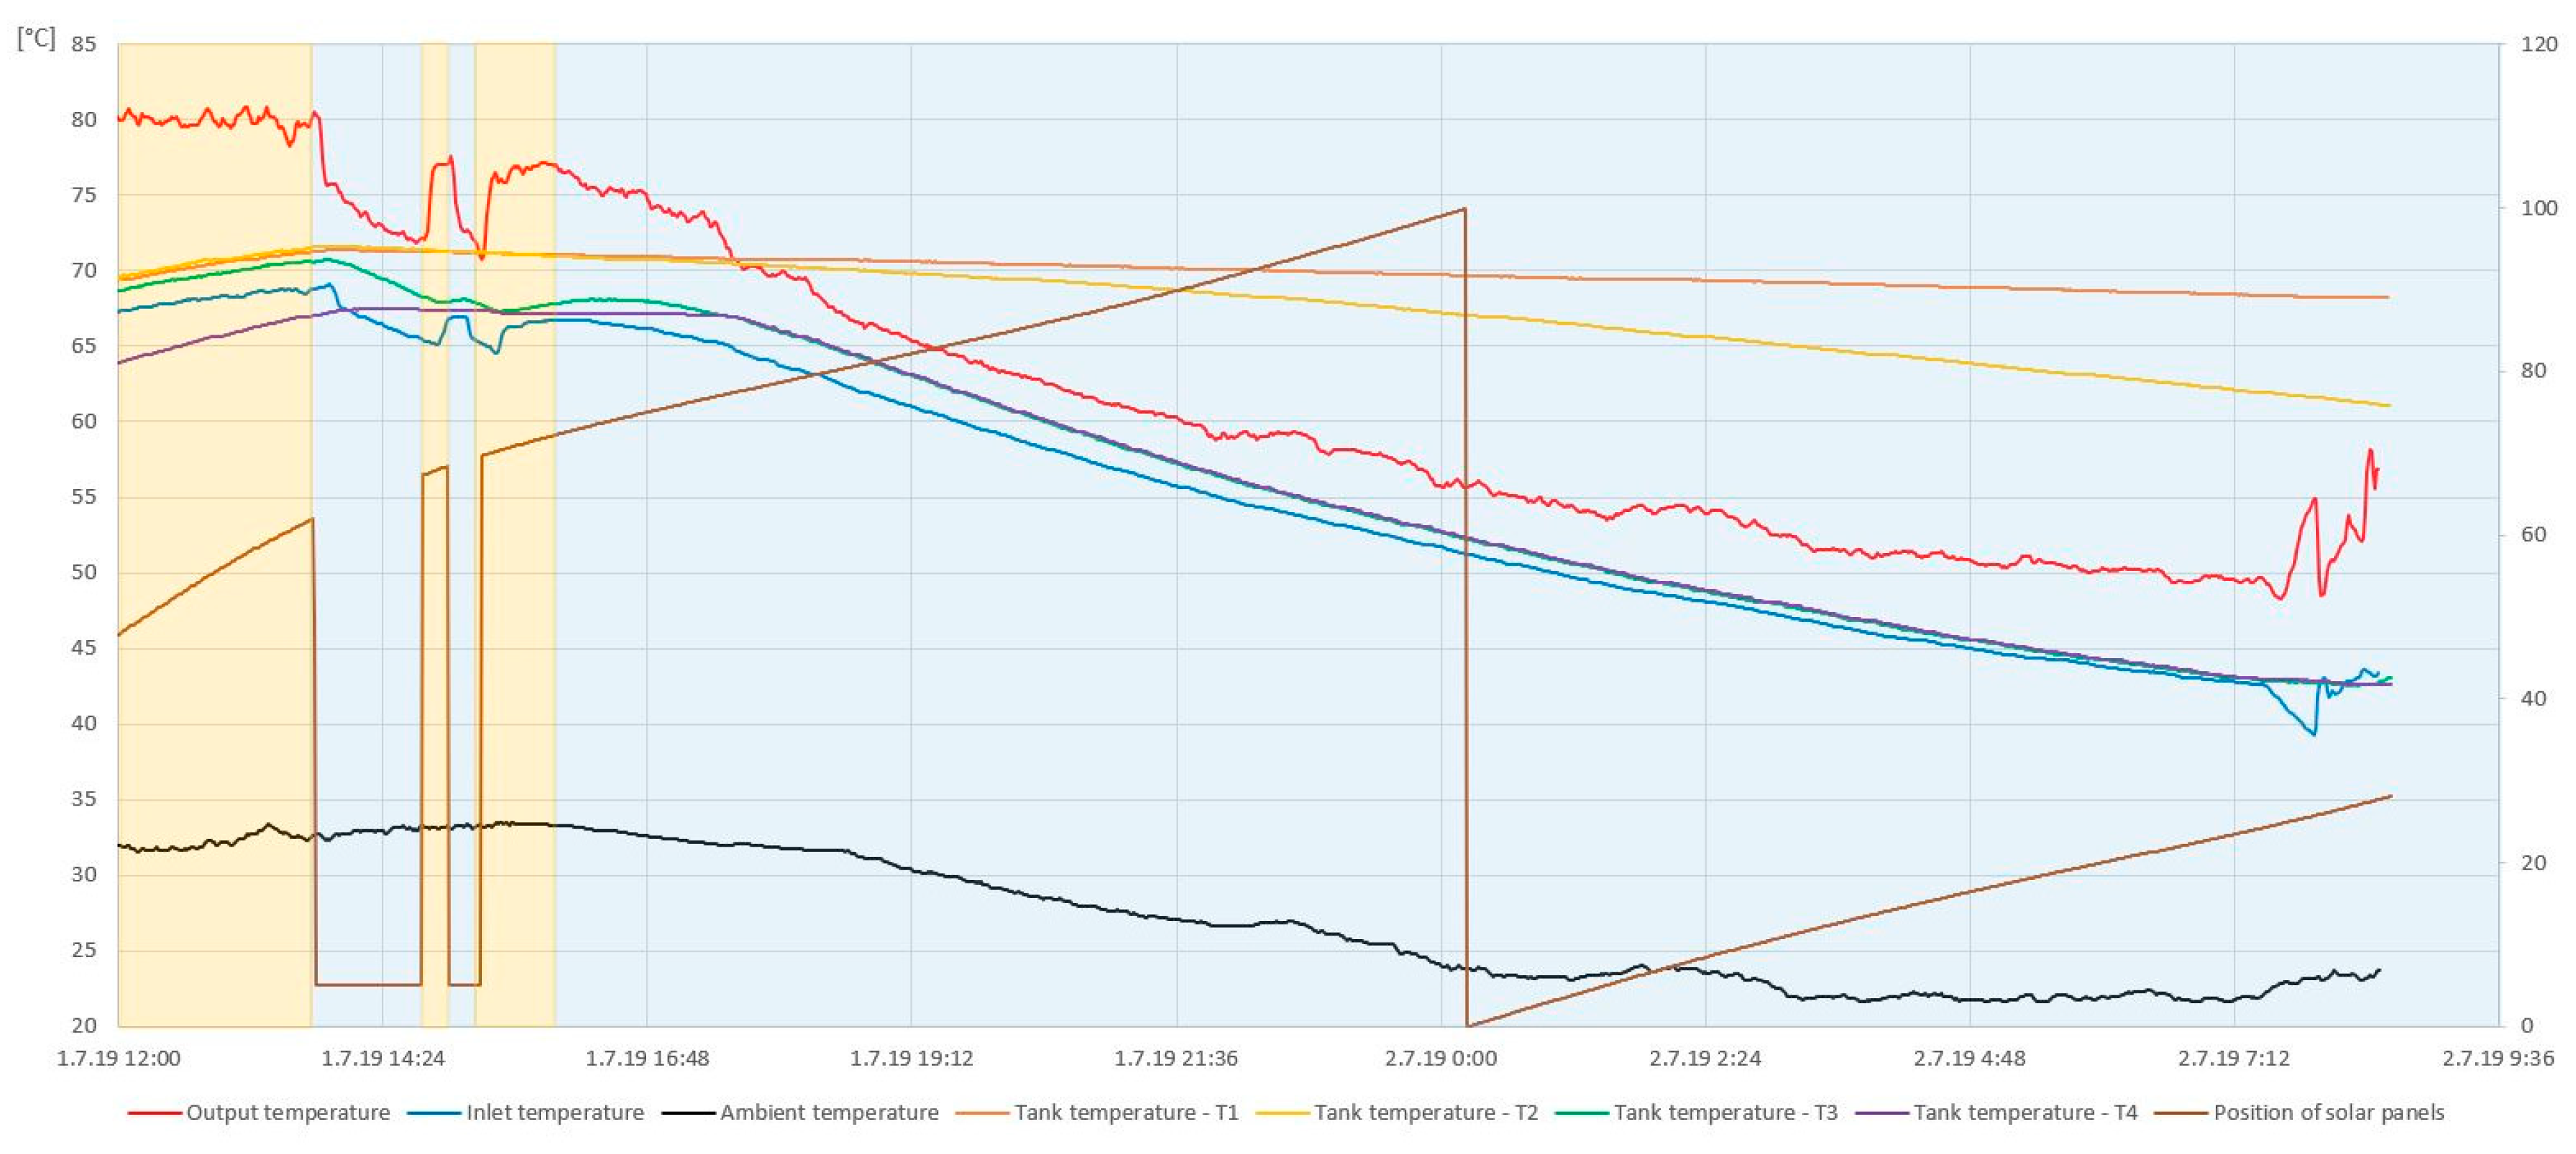
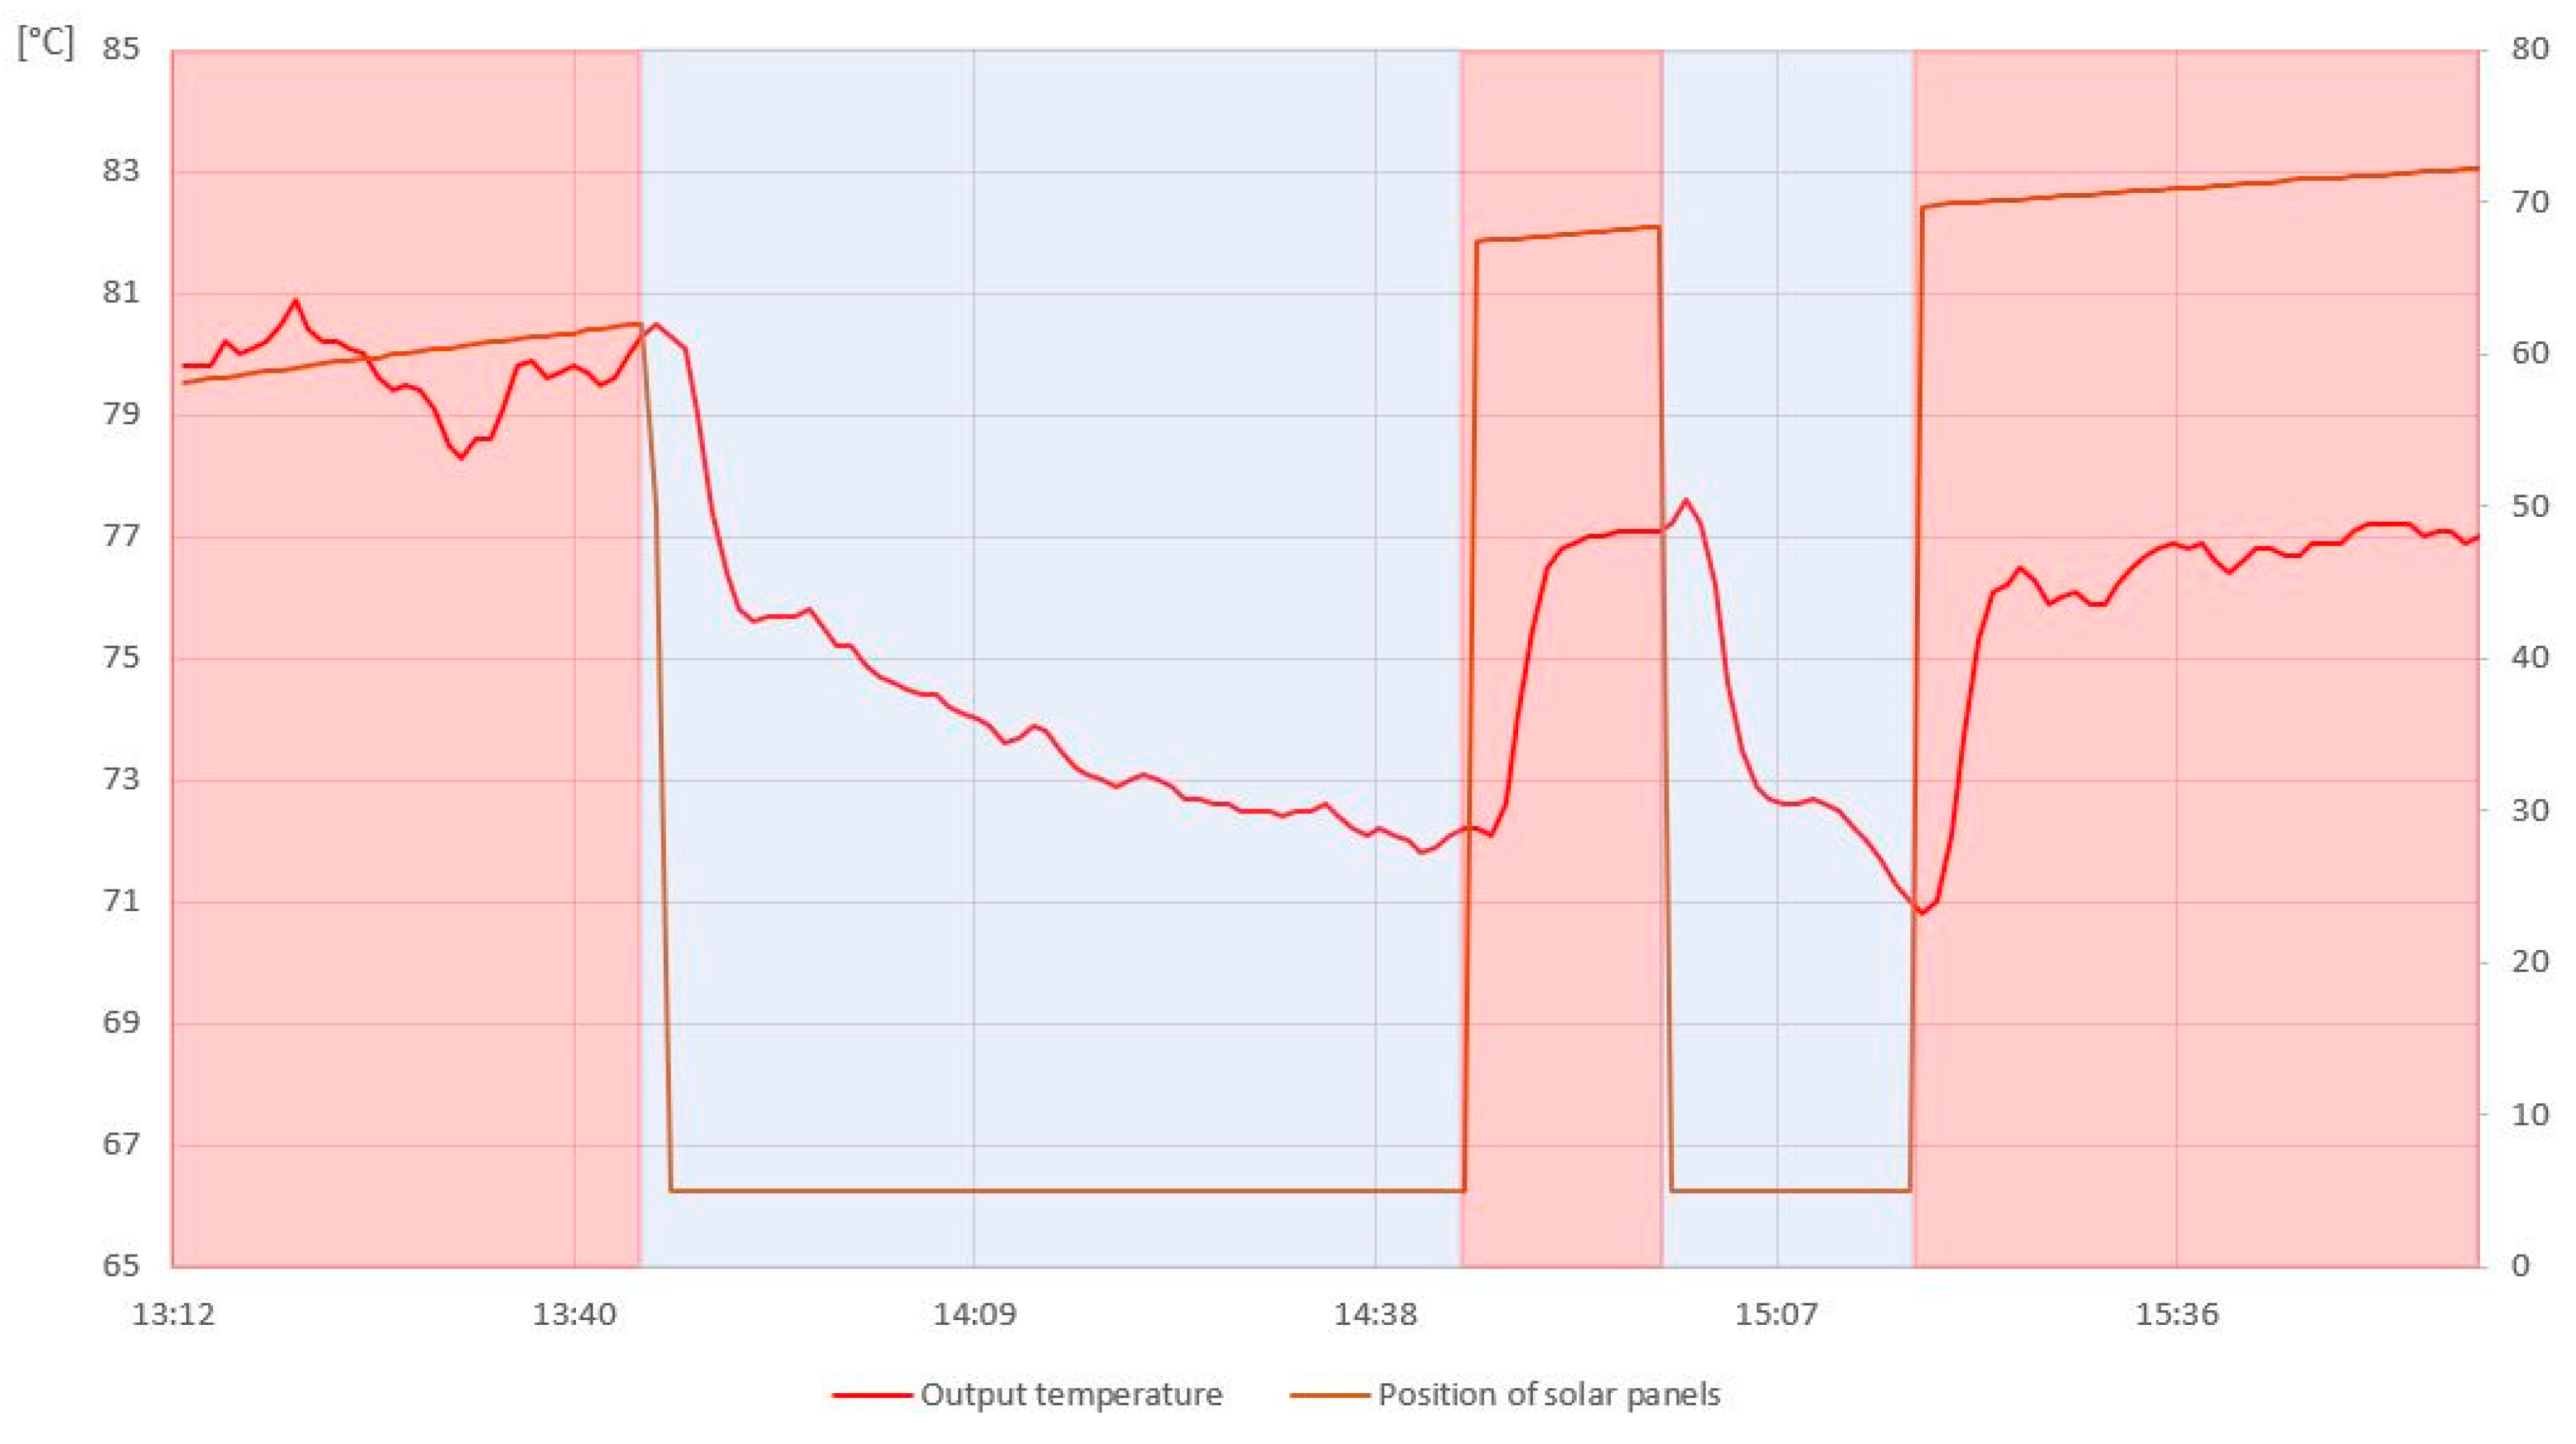
There were several options to streamline and maximize the use of the solar potential in solar systems. One possibility is to mount the collector on the tracker construction. This design allows the collector to move and monitor the current position of the sun, making it possible to use more of the incident solar radiation. An important aspect is also to determine the ideal angle of incidence of the sun’s rays on the collector surface. With the ideal tilting and inclination of the collector towards solar radiation, higher temperature gains can be achieved than with a poorly optimized and static system. The threat to any solar system is overheating of the system as a result of a failure or energy saturation when the system may overheat, and stagnation processes may take place. Stagnation can most often occur due to a failure of the circulation pump or insufficient hot water consumption. High temperatures can severely damage the entire solar system and protection systems must be provided to prevent stagnation. In the proposed solar system placed on the tracker construction, no modification of collectors and heat transfer medium is necessary. A suitable option to protect the solar system from stagnation processes is to tilt the collector and reduce the amount of incident solar radiation, thereby lowering the temperature of the medium in the collector. By tilting the collectors, the system temperature decreased by 10% in one hour. Using this process, it is possible to intervene in the already existing stagnation process and lower the temperatures in the system. However, it is more effective to prevent the system from overheating and stagnation. When approaching the critical temperature, the panels tilt away from the incident solar radiation, thus reducing their performance and lowering the system temperature. The advantage of the proposed system is full automation of control and independent decision-making of the system according to the current conditions. The system selects the most appropriate variant of operation for a given time and user intervention is not necessary. In the case of energy saturation of the system, excess heat must be removed from the system, which means that in case of significant accumulation of thermal energy in the storage tanks and assuming a low consumption of hot water, the option is to cool the storage tank. This cooling is carried out by circulating the heat transfer medium throughout the system during the year, thus extracting thermal energy from the storage tank and releasing it to the outside. Measurements have shown that the storage tank can be cooled by circulating the heat transfer medium in the system at night. By doing so, the water temperature in the tank will drop significantly. This preventive solution can be deployed in case of a low hot water consumption during the summer or holiday season. This option is more demanding in terms of time, but it is highly effective in the case of low hot water consumption.

Author Contributions

Conceptualization, M.R.; methodology, M.F.; software, A.K.; validation, P.O.; formal analysis, O.K.; investigation J.V.; resources, M.F.; data curation, P.O.; writing—original draft preparation, J.V.; writing—review and editing, M.R. and M.F.; visualization, M.S. and M.K. All authors have read and agreed to the published version of the manuscript.

Funding

The authors disclosed receipt of the following financial support for the research, authorship, and/or publication of this article: This work was supported by the Slovak Research and Development Agency under the contract no. APVV-16-0192.

Conflicts of Interest

The authors declared no potential conflict of interest with respect to the research, authorship, and/or publication of this article.

References

  1. Pandey, M.K.; Chaurasiya, R. A review on analysis and development of solar flat plate collector. Renew. Sustain. Energy Rev. 2017, 67, 641–650. [Google Scholar] [CrossRef]
  2. Kalogirou, A.S. Solar thermal collectors and applications. Prog. Energy Combust. Sci. 2004, 30, 231–295. [Google Scholar] [CrossRef]
  3. Colangelo, G.; Favale, E.; Miglietta, P.; De Risi, A. Innovation in flat solar thermal collectors: A review of the last ten year experimental results. Renew. Sustain. Energy Rev. 2016, 57, 1141–1159. [Google Scholar] [CrossRef]
  4. Koussa, M.; Saheb, D.; Belkhamsa, H.; Lalaoui, A.M.; Hakem, A.S.; Sami, S.; Zoubir, B.; Mustapha, H. Effect of parallel and serie connection configuration of solar collector on the solar system performances. In Proceedings of the 6th International Renewable Energy Congress (IREC), Sousse, Tunisia, 24–26 March 2015. [Google Scholar] [CrossRef]
  5. Tripanagnostopoulos, Y.; Souliotis, M.; Nousia, T.H. Solar collectors with colored absorbers. Sol. Energy 2000, 68, 343–356. [Google Scholar] [CrossRef]
  6. Kalogirou, S.; Tripanagnostopoulos, Y.; Souliotis, M. Performance of solar systems employing collectors with colored absorber. Energy Build. 2005, 8, 824–835. [Google Scholar] [CrossRef]
  7. Hussain, S.; Harrison, J.S. Experimental and numerical investigations of passive air cooling of a residential flat-plate solar collector under stagnation conditions. Sol. Energy 2015, 122, 1023–1036. [Google Scholar] [CrossRef]
  8. Streicher, W. Minimising the risk of water hammer and other problems at the beginning of stagnation of solar thermal plants—A theoretical approach. Sol. Energy 2000, 69, 187–196. [Google Scholar] [CrossRef]
  9. Harrison, S.; Cruickshank, A. A review of strategies for the control of high temperature stagnation in solar collectors and systems. Energy Procedia 2012, 30, 793–804. [Google Scholar] [CrossRef] [Green Version]
  10. Xinyu, Z.; Shijun, Y.; Wei, X.; Xuejing, Z.; Tao, H.; Zhulian, H.; Lei, Z.A.; Deng, Y. Test result analysis of the stagnation effect on the thermal performance of solar collector. Energy Procedia 2012, 30, 824–828. [Google Scholar] [CrossRef] [Green Version]
  11. Cihelka, J. Sluneční Vytápěcí Systémy; SNTL: Praha, Czech Republic, 1984. [Google Scholar]
  12. Hillerns, F.; Tyforop, C. The behaviour of heat transfer media in solar active thermal systems in view of the stagnation conditions. In Proceedings of the IEA-SHC Task 26 Industry Workshop, Borlänge, Sweden, 3 April 2000. [Google Scholar]
  13. Hausner, R.; Fink, C. Stagnation behaviour of solar thermal systems. In A Report of IEA SHC—Task 26; IEA: Paris, France, 2002. [Google Scholar]
  14. Panda, A. Monitorovanie a Hodnotenie Procesov; FVT TU: Prešov, Slovakia, 2014. [Google Scholar]
  15. Rimár, M.; Kuna, Š.A.; Fedák, M. Energy yield of solar panels in the system of their position control. Appl. Mech. Mater. 2014, 521, 37–40. [Google Scholar] [CrossRef]
  16. Föste, S.; Pazidis, A.; Reineke-Koch, R.; Hafner, B.; Mercs, D.; Delord, C.H. Flat plate collectors with thermochromic absorber coatings to reduce loads during stagnation. Energy Procedia 2016, 91, 42–48. [Google Scholar] [CrossRef] [Green Version]
  17. Mercs, D.; Didelot, A.; Capon, F.; Pierson, J.; Hafner, B.; Pazidis, A.; Föste, S.; Reineke-Koch, R. Innovative Smart Selective Coating to Avoid Overheating in Highly Efficient Thermal Solar Collectors. Energy Procedia 2016, 91, 84–93. [Google Scholar] [CrossRef] [Green Version]
  18. Föste, S.; Schiebler, B.; Giovannetti, F.; Rockendorf, G.; Jack, S. Butane Heat Pipes for Stagnation Temperature Reduction of Solar Thermal Collectors. Energy Procedia 2016, 91, 35–41. [Google Scholar] [CrossRef] [Green Version]
  19. Amiche, A.; El Hassar, K.M.S.; Larabi, A.; Khan, Z.; Aguilar, J.F.; Quiles, V.P. Innovative overheating solution for solar thermal collector using a reflective surface included in the air gap. Renew. Energy 2019, 151, 355–365. [Google Scholar] [CrossRef]
  20. Jack, F.; Parzefall, J.; Luttman, T.; Janßen, P.; Giovannetti, F. Flat Plate Aluminium Heat Pipe Collector with Inherently Limited Stagnation Temperature. Energy Procedia 2014, 48, 105–113. [Google Scholar] [CrossRef] [Green Version]
  21. Resch-Fauster, K.; Weber, A.; Holper, S.; Grobbauer, M. Thermotropic overheating protection for facade-integrated solar thermal collectors. Sol. Energy Mater. Sol. Cells 2017, 170, 39–47. [Google Scholar] [CrossRef]
  22. Neagoe, M.; Visa, I.; Burduhos, G.B.; Moldovan, D.M. Thermal load based adaptive tracking for flat plate solar collectors. Energy Procedia 2014, 48, 1401–1411. [Google Scholar] [CrossRef] [Green Version]
  23. Hafez, A.Z.; Yousef, A.M.; Harag, N.M. Solar tracking systems: Technologies and trackers drive types—A review. Renew. Sustain. Energy Rev. 2018, 91, 754–782. [Google Scholar] [CrossRef]
  24. Rizal, Y.; Wibowo, S.H. Application of Solar Position Algorithm for Sun-Tracking System. Energy Procedia 2013, 23, 160–165. [Google Scholar] [CrossRef] [Green Version]
  25. Stamatescu, I.; Fagarasan, I.; Stamatescu, G.; Arghira, N.; Iliescu, S.S. Design and Implementation of a Solar-tracking Algorithm. Procedia Eng. 2014, 69, 500–507. [Google Scholar] [CrossRef] [Green Version]
  26. Bhattacharya, P.; Mukhopadhyay, S.; Ghsoh, B.B.; Bose, P.K. Optimized Use of Solar Tracking System and Wind Energy. Procedia Technol. 2012, 4, 834–839. [Google Scholar] [CrossRef] [Green Version]
  27. Huang, B.; Huang, Y.; Chen, G.; Hsu, P.; Li, K. Improving Solar PV System Efficiency Using One-Axis 3-Position Sun Tracking. Energy Procedia 2013, 33, 280–287. [Google Scholar] [CrossRef] [Green Version]
  28. Minor, M.A.; García, P.A. High-Precision Solar Tracking System. In Proceedings of the World Congress on Engineering 2010, London, UK, 30 June–2 July 2010; Volume II, pp. 844–846. [Google Scholar]
  29. Ibrahim, D. Optimum tilt angle for solar collectors used in Cyprus. Renew. Energy 1995, 6, 813–819. [Google Scholar] [CrossRef]
  30. Benghanem, M. Optimization of tilt angle for solar panel: Case study for Madinah, Saudi Arabia. Appl. Energy 2011, 88, 1427–1433. [Google Scholar] [CrossRef]
  31. Kacira, M.; Simsek, M.; Babur, Y.; Demirkol, S. Determining optimum tilt angles and orientations of photovoltaic panels in Sanliurfa, Turkey. Renew. Energy 2004, 29, 1265–1275. [Google Scholar] [CrossRef]
  32. Demain, C.; Journée, M.; Bertrand, C. Evaluation of different models to estimate the global solar radiation on inclined surfaces. Renew. Energy 2013, 50, 710–721. [Google Scholar] [CrossRef]
  33. Jafarkazemi, F.; Saadabadi, A.S. Optimum tilt angle and orientation of solar surfaces in Abu Dhabi, UAE. Renew. Energy 2013, 56, 44–49. [Google Scholar] [CrossRef]
  34. Hartley, E.L.; Martínez-Lozano, A.J.; Utrillas, P.M.; Tena, F.; Pedrós, R. The optimization of the angle of inclination of solar collector to maximize the incident solar radiation. Renew. Energy 1999, 17, 291–309. [Google Scholar] [CrossRef] [Green Version]
  35. Yadav, K.A.; Chandel, S.S. Tilt angle optimization to maximize incident solar radiation: A review. Renew. Sustain. Energy Rev. 2013, 23, 503–513. [Google Scholar] [CrossRef]
  36. Handoyo, A.E.; Prabowo, I.D. The optimal tilt angle of a solar collector. Energy Procedia 2013, 32, 166–175. [Google Scholar] [CrossRef] [Green Version]
  37. Kamali, A.G.H.; Moradi, I.; Khalili, A. Estimating solar radiation on titled surfaces with various orientations: A study case in Karaj (Iran). Theor. Appl. Climatol. 2006, 84, 235–241. [Google Scholar] [CrossRef]
  38. Ahmad, J.M.; Tiwari, N.G. Optimization of Tilt Angle for Solar Collector to Receive Maximum Radiation. Open Renew. Energy J. 2009, 2, 19–24. [Google Scholar] [CrossRef]
  39. Günther, M. Advanced CSP Teaching Materials, Chapter 2: Solar Radiation; DLR: Köln, Germany, 2011. [Google Scholar]
  40. DIN 5034-2: Tageslicht in Innenräumen, Grundlagen; Beuth Verlag: Berlin, Germany, 1985.
  41. Frank, E.; Mauthner, F.; Fischer, S. Overheating prevention and stagnation handling in solar process heat applications. In IEA SHC Task 49; IEA: Paris, France, 2015. [Google Scholar] [CrossRef]
Figure 1. Solar panels installed on the tracker construction allowing the collectors to be tilted.
Processes 08 00621 g001
Figure 2. Control system based on Siemens Desigo Insight.
Processes 08 00621 g002
Figure 3. (a) Diagram of solar radiation incident on a titled plane. S, N—cardinal points, β—tilt angle, γ—plane azimuth angle, γs—solar azimuth angle, θ—incidence angle, θz—solar zenith angle; (b) Scheme of sun position in time. SolEtHor—solar hour, SolAzimuth—solar azimuth, N,W,E,S—cardinal points.
Processes 08 00621 g003
Figure 4. Temperature—pressure diagram water and glycol.
Processes 08 00621 g004
Figure 5. Diagram of a part of the multivalent laboratory system used in experiments. Blue line—inlet pipes (cold water), Red line—outlet pipes (heated water).
Processes 08 00621 g005
Figure 6. Position control system.
Processes 08 00621 g006
Figure 7. Block diagram of a control system of a construction rotation.
Processes 08 00621 g007
Figure 8. Diagram of the pump system control.
Processes 08 00621 g008
Figure 9. Solar radiation intensity and usable solar radiation.
Processes 08 00621 g009
Figure 10. Incident solar radiation on the panel—noon.
Processes 08 00621 g010
Figure 11. Incident solar radiation on the panel—east and west.
Processes 08 00621 g011
Figure 12. Tilting of the panel to the east at the noon.
Processes 08 00621 g012
Figure 13. Illumination intensity and amount of incident solar radiation during a sunny day.
Processes 08 00621 g013
Figure 14. Flow of system inlet and outlet temperatures, outside and storage temperatures during a sunny day.
Processes 08 00621 g014
Figure 15. Circulation pump failure simulation and its effect on the system outlet temperature.
Processes 08 00621 g015
Figure 16. Simulation of circulation pump failure with and without tilting the panel to the end position.
Processes 08 00621 g016
Figure 17. Influence of panel tilting on the system temperatures and liquid cooling process in the tank.
Processes 08 00621 g017
Figure 18. Outlet temperature curve depending on panel tilting.
Processes 08 00621 g018
Table 1. Definition of heat-transfer fluid.
DEFINITION
Freezing temperature−30 °C
At lower temperatures, an ice slurry is formed without jerky effects
Short-term superheat temperatureUp to 230 °C (up to, 5 MPa)
Short term overheating temperature300 °C, pH differential less than 0,11
Boiling point 105 °C under normal conditions
pH7.0–8.0
Table 2. Parameters of heat-transfer fluid in temperature modes −30 °C to 100 °C.
Temperature
°C
Density
kg/m3
Kin. Viscosity
mm2/s
Heat Capacity
kJ/kg.K
Heat Conductivity
W/mK
Prandtl
No.
−301066110.03.370.381100
0105220.03.520.38105
2010385.03.610.3850
4010253.53.690.3825
6010102.03.760.3815
809921.13.810.3810
1009760.73.860.387

