1. Introduction
With the depletion of fossil fuels, large-scale renewable energy, such as wind energy and solar energy, is used for power generation. However, these kinds of renewable energy have volatility and uncertainty, and most of them lack inertia to power systems [
1,
2]. With the increase of renewable energy penetration [
3], the proportion of conventional units in power systems will gradually reduce. The frequency regulation capacity and response speed of the traditional power generator will not be able to meet the frequency regulation demand [
4,
5]. To improve the frequency regulation capacity of the power system, the energy storage system (ESS), which has fast response characteristics, has attracted extensive attention in participating in power system auxiliary services [
6].
Since the charging and discharging power of ESS can be controlled rapidly and flexibly, using ESS to regulate power system frequency can improve the frequency regulation performance and reduce the reserve of traditional units.
The performance of frequency regulation is related to the control strategy of ESS. The coordinated controller designed in reference [
7] can coordinate multiple distributed ESSs to participate in the frequency regulation market. However, centralized energy storage is the dominant mode in China and some other countries, which limits the application of the control method. Reference [
8] discussed the feasibility of using virtual inertia control and droop control in primary frequency regulation of the power system and demonstrated that ESS could be used to simulate the output response of traditional generators. In reference [
9], the frequency regulation of a microgrid using ESS was presented. The drop control method was used to regulate the output power of ESS. In reference [
10], a virtual inertial control method was proposed for primary frequency regulation. By simulating the output characteristics of traditional units, the primary frequency regulation capacity of the ESS was analyzed. The results showed that virtual inertial control could significantly reduce the frequency deviation caused by the instantaneous load fluctuation. In reference [
11], it was mentioned that the ESS used virtual droop control and virtual inertial control to participate in the primary frequency regulation of power system, which could effectively reduce the rate of frequency change and increase the frequency nadir.
However, all the above-mentioned literature fails to take the state of charge (SOC) of ESS into consideration. Thus, the ESS may overcharge or discharge, and it is detrimental to the ESS service life. To tackle this problem, reference [
12] discussed the droop control strategies considering the SOC of ESS. Besides, in reference [
13], an adaptive SOC feedback virtual droop control was designed to keep the SOC at the optimal value to extend the cycle life of ESS. In reference [
14], the ESS aggregation method using the droop control with SOC feedback was proposed for frequency regulation. These methods can reduce the steady-state frequency deviation but cannot effectively suppress the rate of frequency change.
To overcome the disadvantages of droop control, a hybrid control mode for ESS to participate in the primary frequency modulation of the power grid was proposed in reference [
15]. The virtual inertial control was used in the frequency deterioration stage, and the virtual droop control was used in the frequency recovery stage. This kind of hybrid control mode could reduce the rate of frequency change as well as maximum frequency deviation. However, when the control mode was switched, the output power of ESS would jump from zero to its maximum value. This sudden power change would reduce the service life of ESS.
As far as we know, all the control strategies of ESS participating in the primary frequency regulation in existing literature have disadvantages. Some methods do not take into account the influence of the SOC of the ESS. Others do not take into account the influence of the frequency change rate or have sudden power change when the control mode is switched. To tackle these problems, this paper presented an adaptive control strategy of ESS participating in primary frequency regulation of the power system. The proposed method combined virtual inertia control, virtual negative inertia control, and virtual droop control. The control coefficients were based on the SOC of ESS. The frequency deviation and frequency change rate were taken into consideration. ESS could avoid over-charging and over-discharging since the output power of ESS was related to the SOC. Finally, a case study using an independent power system was conducted in MATLAB to verify the proposed control strategy.
2. Control Strategy of Energy Storage System Participating in Primary Frequency Regulation
The virtual droop control and the virtual inertial control are two typical control methods for ESS participating in the primary frequency regulation. It is of practical value to study the effect of these methods on power systems. In this paper, a control method of ESS for frequency regulation was proposed according to the frequency deviation and frequency change rate. The control method was a combination of virtual droop control, virtual inertial control, and virtual negative inertial control to improve the performance of the three control methods.
Since virtual droop control has a good steady-state performance, and virtual inertia control can effectively prevent frequency change, the control method combining virtual droop control and virtual inertia control was used in the frequency deterioration stage. In addition, the virtual negative inertia control was integrated with the virtual droop control to accelerate frequency recovery in the frequency recovery stage. Moreover, the droop coefficient and the inertia coefficient of the control methods were adjustable based on the SOC of ESS, to prevent the ESS from over-charging or over-discharging.
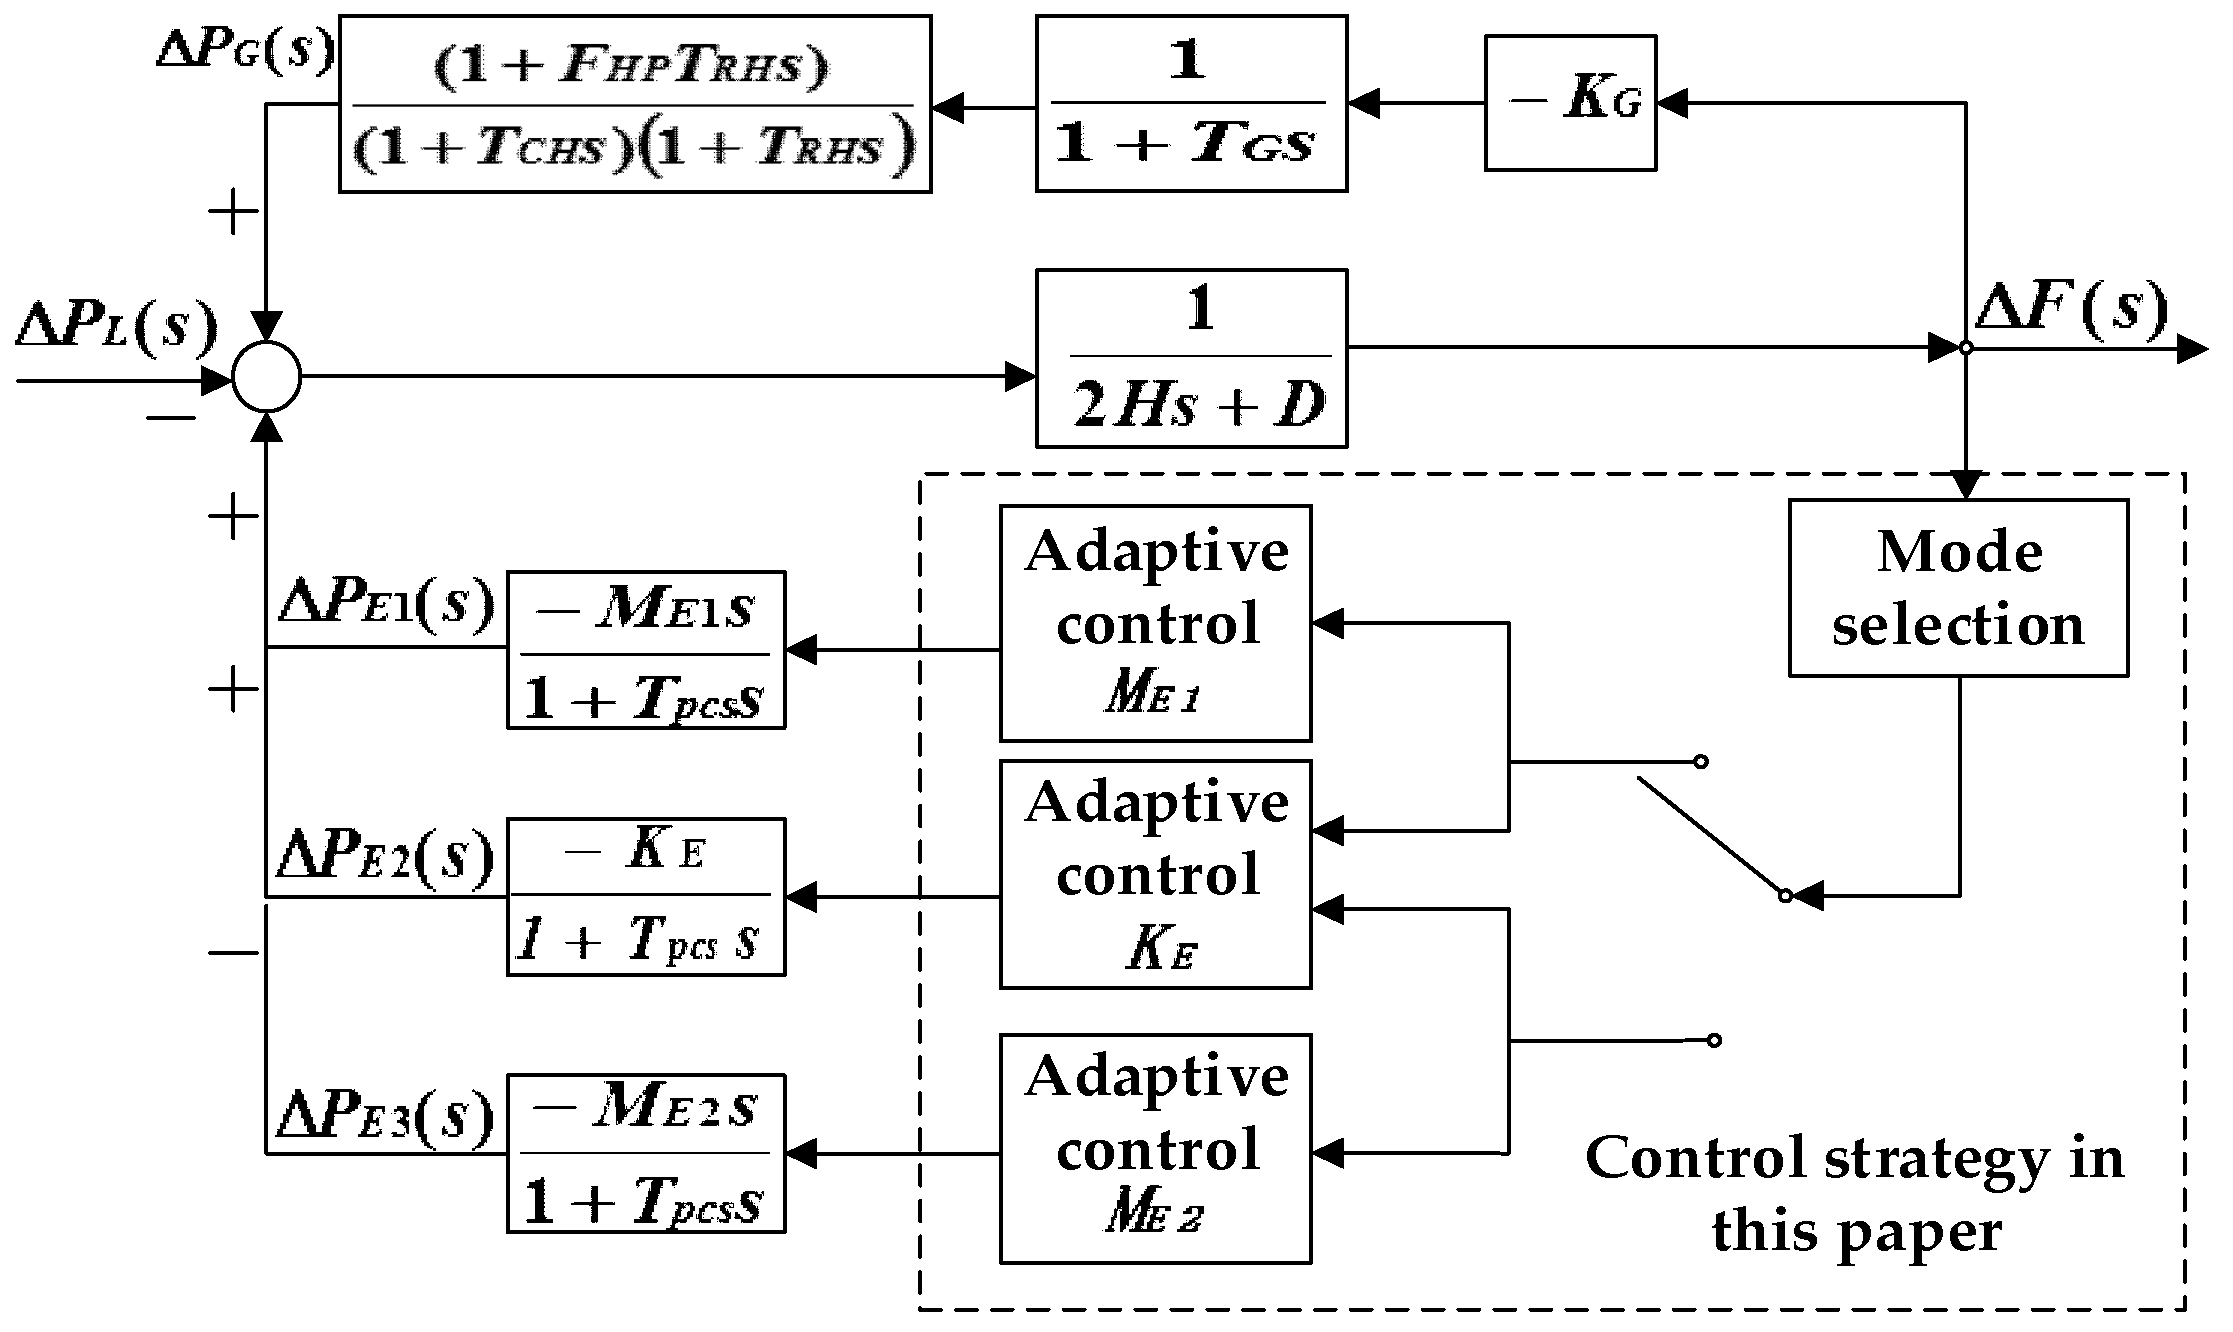
The dynamic model of power system frequency regulation with ESS is shown in
Figure 1.
In
Figure 1, Δ
PL(s) is the load fluctuation; Δ
F(s) is the power system frequency deviation; Δ
PE1(s), Δ
PE2(s), Δ
PE3(s) are the outputs of virtual inertial control mode, virtual droop control mode, and virtual negative inertial control mode, respectively; T
G, T
CH, T
RH are the time constants of traditional power supply governor, turbine, and reheater, respectively; T
pcs is the time constant of the energy storage battery;
FHP is the reheater gain;
s is the Laplace operator;
KG,
ME1,
ME2,
ME3,
KE are the unit regulated power of traditional power supply, the virtual inertia coefficient of ESS, the virtual negative inertia coefficient of ESS, and the virtual droop coefficient of ESS;
H and
D are the inertia time constant of the power system and the load damping coefficient, respectively.
2.1. Virtual Droop Control
The principle of virtual droop control is to imitate the frequency droop characteristic of the synchronous generator participating in primary frequency regulation [
16]. Virtual droop control increases or decreases the active power output of ESS according to system frequency deviation.
The increment of active power in this process is:
where Δ
f is the frequency deviation; the larger the
KE is, the higher the energy storage output will be under the same frequency deviation.
The virtual droop control of ESS is easy to implement and can reduce the steady-state frequency deviation of the power system.
2.2. Virtual Inertia Control
The inherent inertial response process of the synchronous generator is that the mechanical power keeps constant in a short time since the rotating speed of the rotor cannot be changed abruptly. When a sudden increase in electromagnetic power occurs, the rotor speed decreases continuously and releases the kinetic energy of rotation. Thus, the frequency decaying rate of the power system is reduced, and the system becomes more stable. The virtual inertia control of ESS resembles the inertial response of the synchronous generator [
16]. By controlling the charging and discharging power based on the power system frequency change rate, ESS can reduce the imbalance of power supply and demand of the power system. In this way, the frequency change is slowed down, and the amplitude of frequency fluctuation is decreased. Hence, the damping ratio of the system is enhanced, and the power system becomes more stable.
The virtual inertial response can be described as:
where
ME is the positive inertial control coefficient,
d(Δ
f)/
dt is the frequency change rate. The virtual inertial control can effectively prevent frequency change and can be used to prevent frequency deterioration.
2.3. Virtual Negative Inertia Control
When the frequency of the system is deteriorating, the virtual inertial control strategy can be used to control the output of ESS. This control method can effectively restrain the system frequency from further deterioration. Usually, the virtual inertia control is used to determine the output power of ESS to prevent the frequency change. However, virtual inertia control plays a disadvantageous role when the system frequency starts to recover. In other words, the power output of ESS under virtual inertia control is equivalent to a disturbance for the system when the frequency is recovering.
To avoid the side effect of virtual inertia control, a virtual ‘negative’ inertia control strategy is adopted during the frequency recovery process, which can effectively promote the frequency recovery rate, and makes the system recovers faster [
17]. The virtual negative inertia response can be described as:
where
M’E is the negative inertia control coefficient. The virtual “negative” inertial control strategy is mainly used to accelerate the frequency recovery after the frequency reaches the maximum frequency deviation.
3. SOC-Based Control Coefficients
At present, the capacity of ESS is still very small compared with the whole power system capacity. If the coefficients of the control methods of ESS is large during all the regulation process, the SOC of ESS is likely to exceed the limit.
In order to solve this problem, the droop coefficient and the inertia coefficient can be adjusted dynamically according to SOC. On the one hand, it can keep SOC in an appropriate range and prevent ESS from over-charging or over-discharging, which will affect the life cycle of ESS [
18]; on the other hand, it can effectively avoid the negative impact on power system when the SOC exceeds the limit.
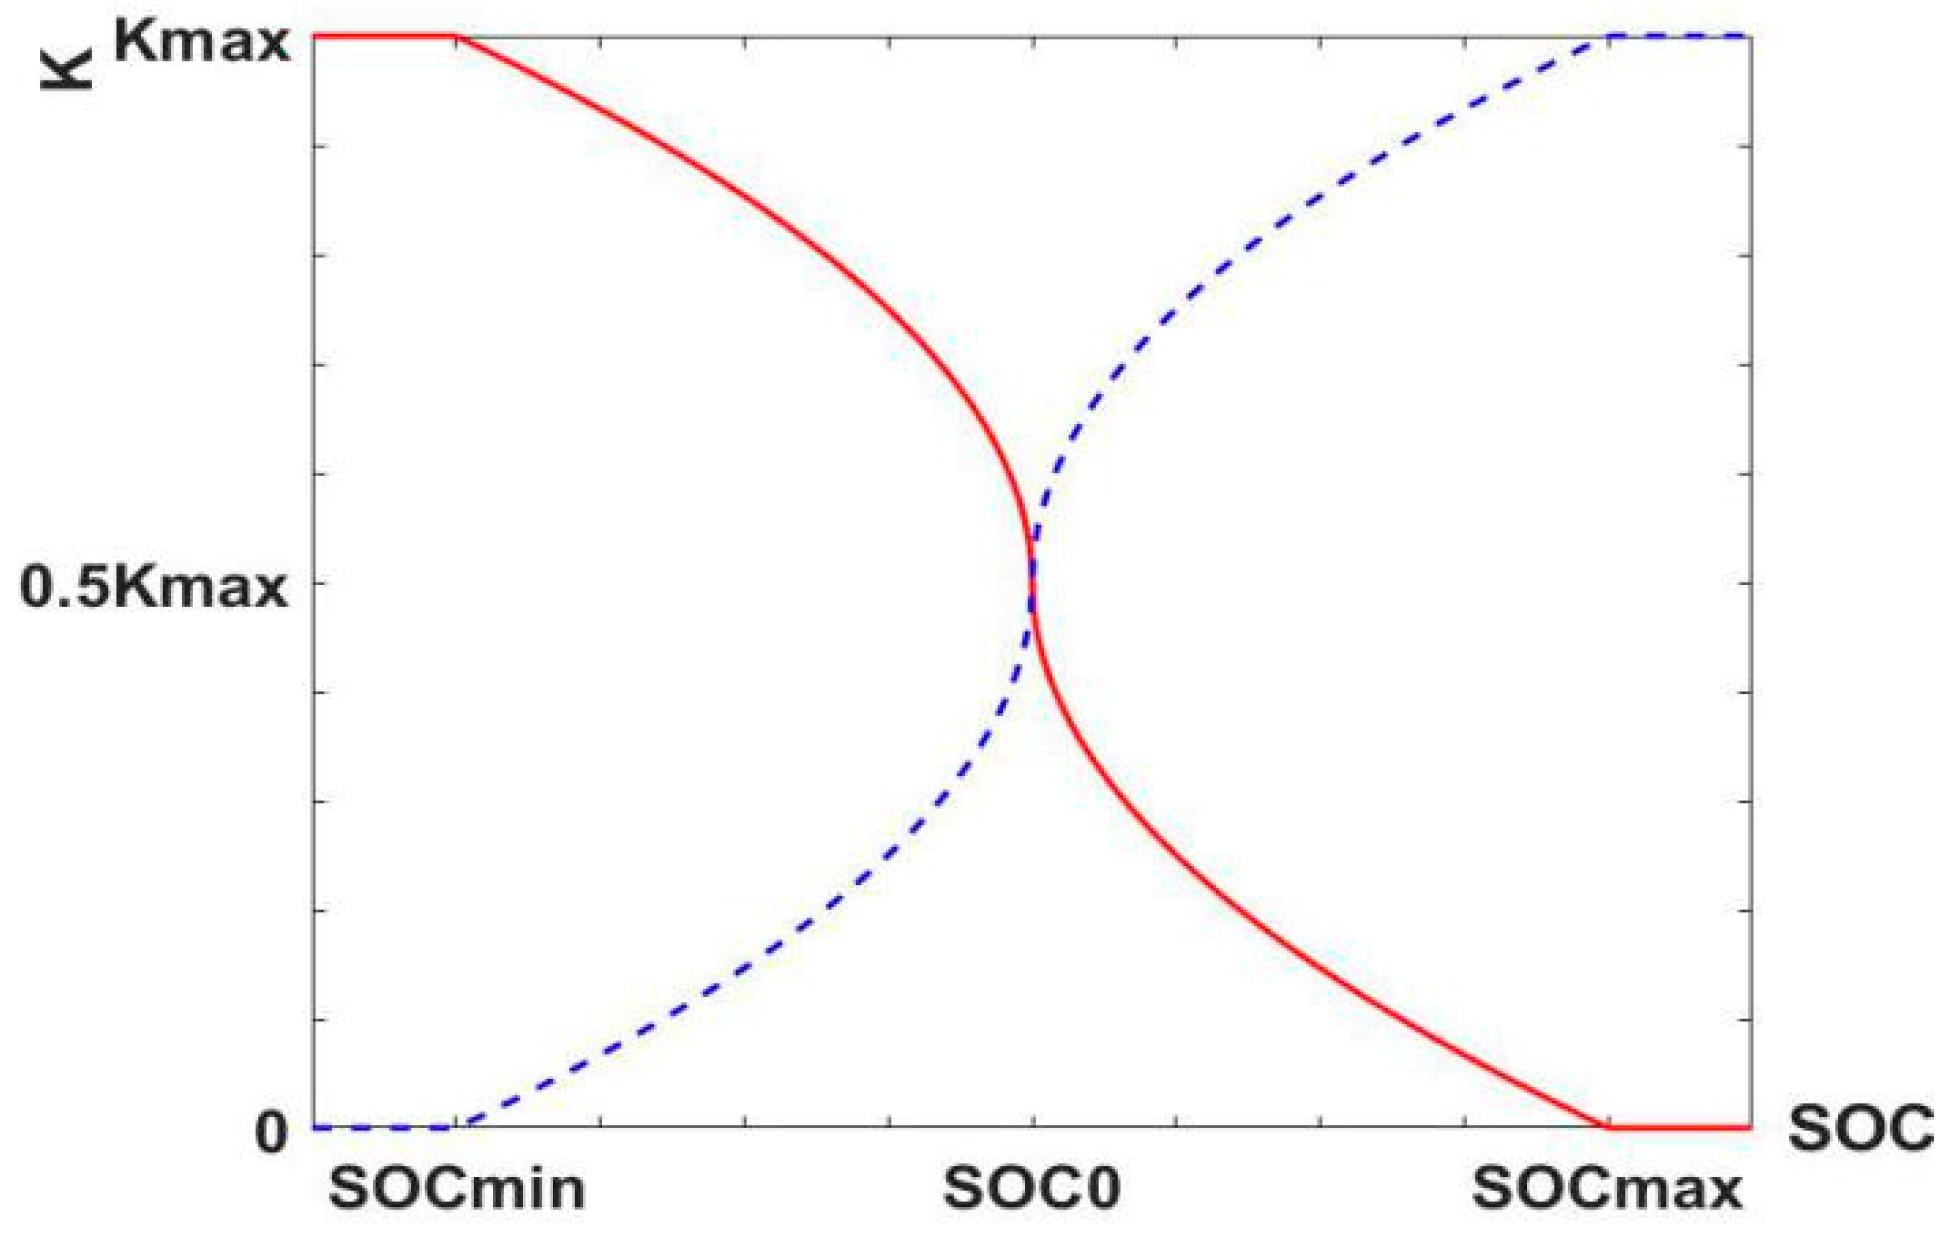
Therefore, a strategy based on the SOC of ESS was proposed to determine the coefficients of the control method. The relationship between the control coefficients and SOC is as follows:
(1) When
(2) When
(3) When
(4) When
where
SOC0 is a constant, usually set to 0.5,
Kmax is set to 1,
SOCmin is set to 0.1,
SOCmax is set to 0.9.
KC is the charge curve,
Kd is the discharge curve. The control coefficient curve is shown in
Figure 2.
The charging and discharging power of ESS is regulated by the SOC-based control coefficients. Take the discharging process as an example.
When there is an active power shortage in the power system and SOC≥SOCmax, the discharge coefficient of ESS is Kmax. That is, when the frequency regulation capacity of ESS is sufficient, the ESS discharges at the maximum speed to provide the power support to the power system to reduce the frequency deviation as much as possible. When the ESS is relatively enough (SOC0<SOC≤SOCmax), the output of ESS is based on the variable discharge coefficient Kdis. With the decrease of SOC, the discharge coefficient also decreases, but the decrease rate of the discharge coefficient is relatively slow. When the SOC is relatively low (SOCmin<SOC≤SOC0), Kdis decreases rapidly with the decrease of SOC, and the decrease rate of discharge coefficient is faster. When the SOC decreases to SOCmin, the ESS stops discharging.
The control strategy comprehensively considers the power demand of the power system and the SOC of ESS. When the SOC is between SOC0 and SOCmax, the decrease rate of discharge coefficient is slower than that of SOC. That is to say, the priority is to ensure the frequency regulation effects in the period when SOC is relatively sufficient. When the SOC is between SOCmin and SOC0, the decrease rate of discharge coefficient is faster than that of SOC. In this period, the priority is to maintain SOC. When SOC decreases to SOC0, ESS stops discharging to prevent over-discharging.
The charging process is similar to the discharging process. It not only ensures the frequency regulation ability but also prevents the battery from over-charging and over-discharging to increase the service life of ESS.
4. Integrated Primary Frequency Regulation Control Strategy
4.1. Control Strategy in This Paper
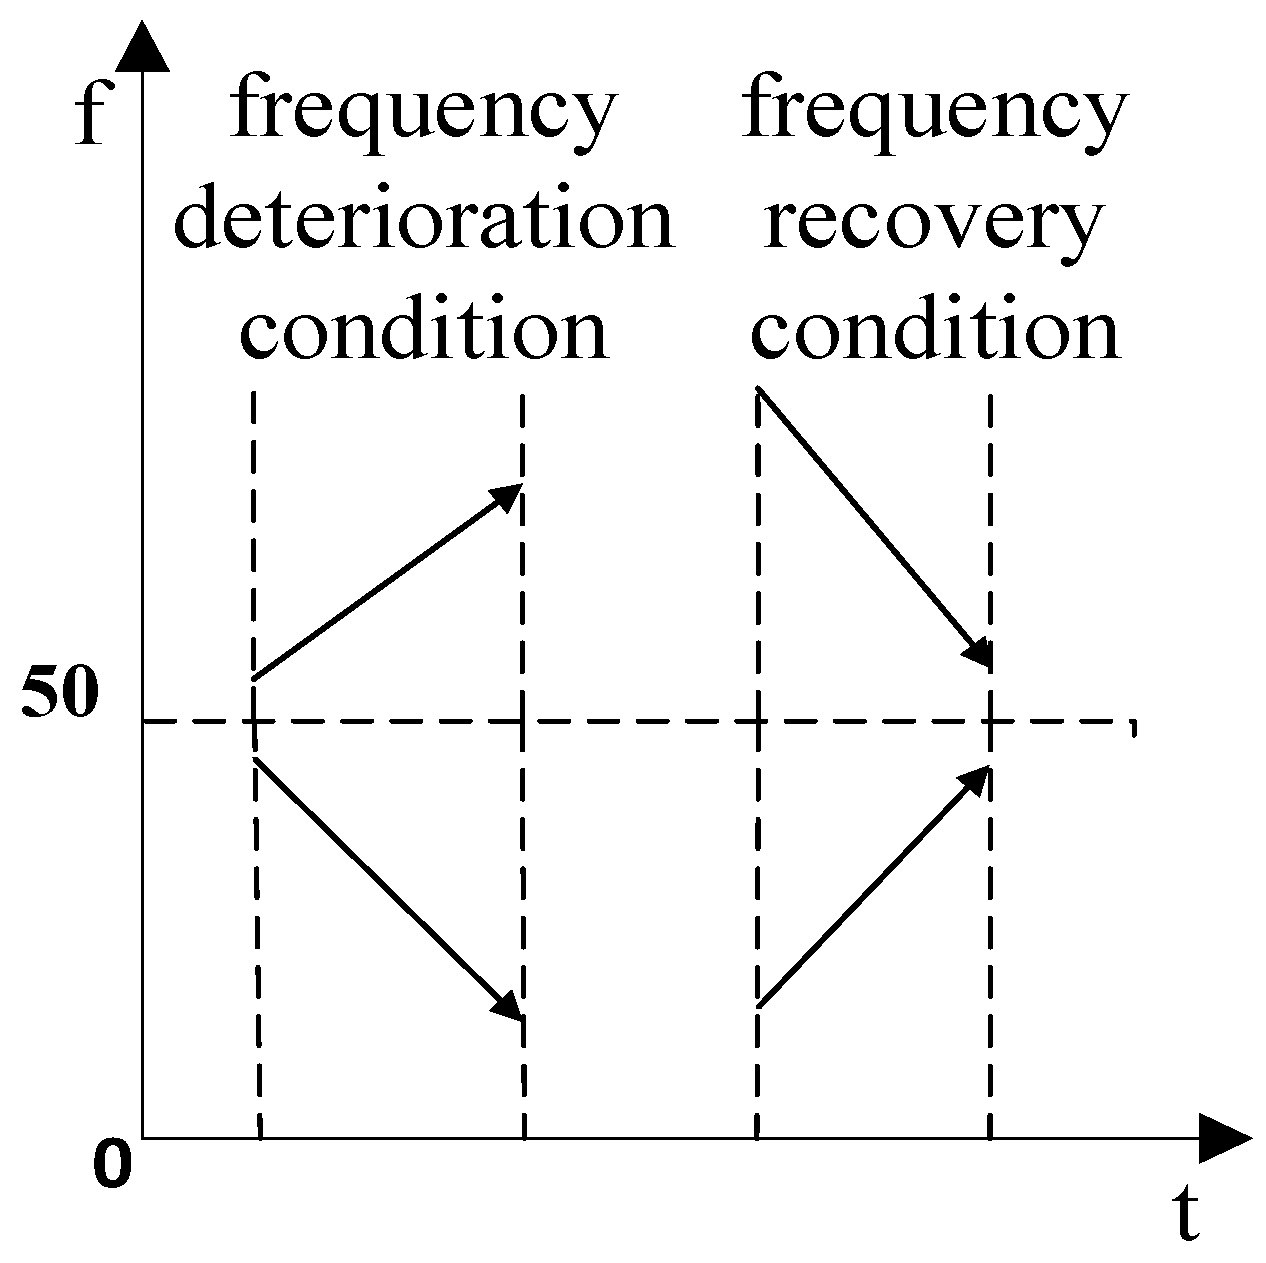
The primary frequency regulation control strategy proposed in this paper included three control modes: the virtual droop control, the virtual inertia control, and the virtual negative inertia control. In order to realize the comprehensive utilization of these control modes, the frequency regulation conditions were divided into two types. One of the two types was the frequency deterioration condition, and the other one was the frequency recovery condition. The frequency regulation conditions are shown in
Figure 3.
As shown in
Figure 3, the frequency deterioration condition (Δ
f ×
df/
dt > 0) referred to the frequency deviation becoming larger, while the frequency recovery condition (Δ
f ×
df/
dt < 0) referred to the frequency deviation becoming smaller.
In the frequency deterioration stage (Δf × df/dt >0), the control mode combining virtual inertial control and virtual droop control was adopted. The virtual droop control was used to reduce the frequency deviation, and the virtual inertial control was used to reduce the change rate of frequency deviation, which hindered the further deterioration of frequency.
In the frequency recovery stage (Δf × df/dt < 0), the control mode combining virtual negative inertia control and virtual droop control was adopted. The virtual negative inertia control was used to increase the recovery rate of system frequency and maximize the utilization of ESS in frequency regulation.
4.2. Implementation of the Proposed Control Strategy
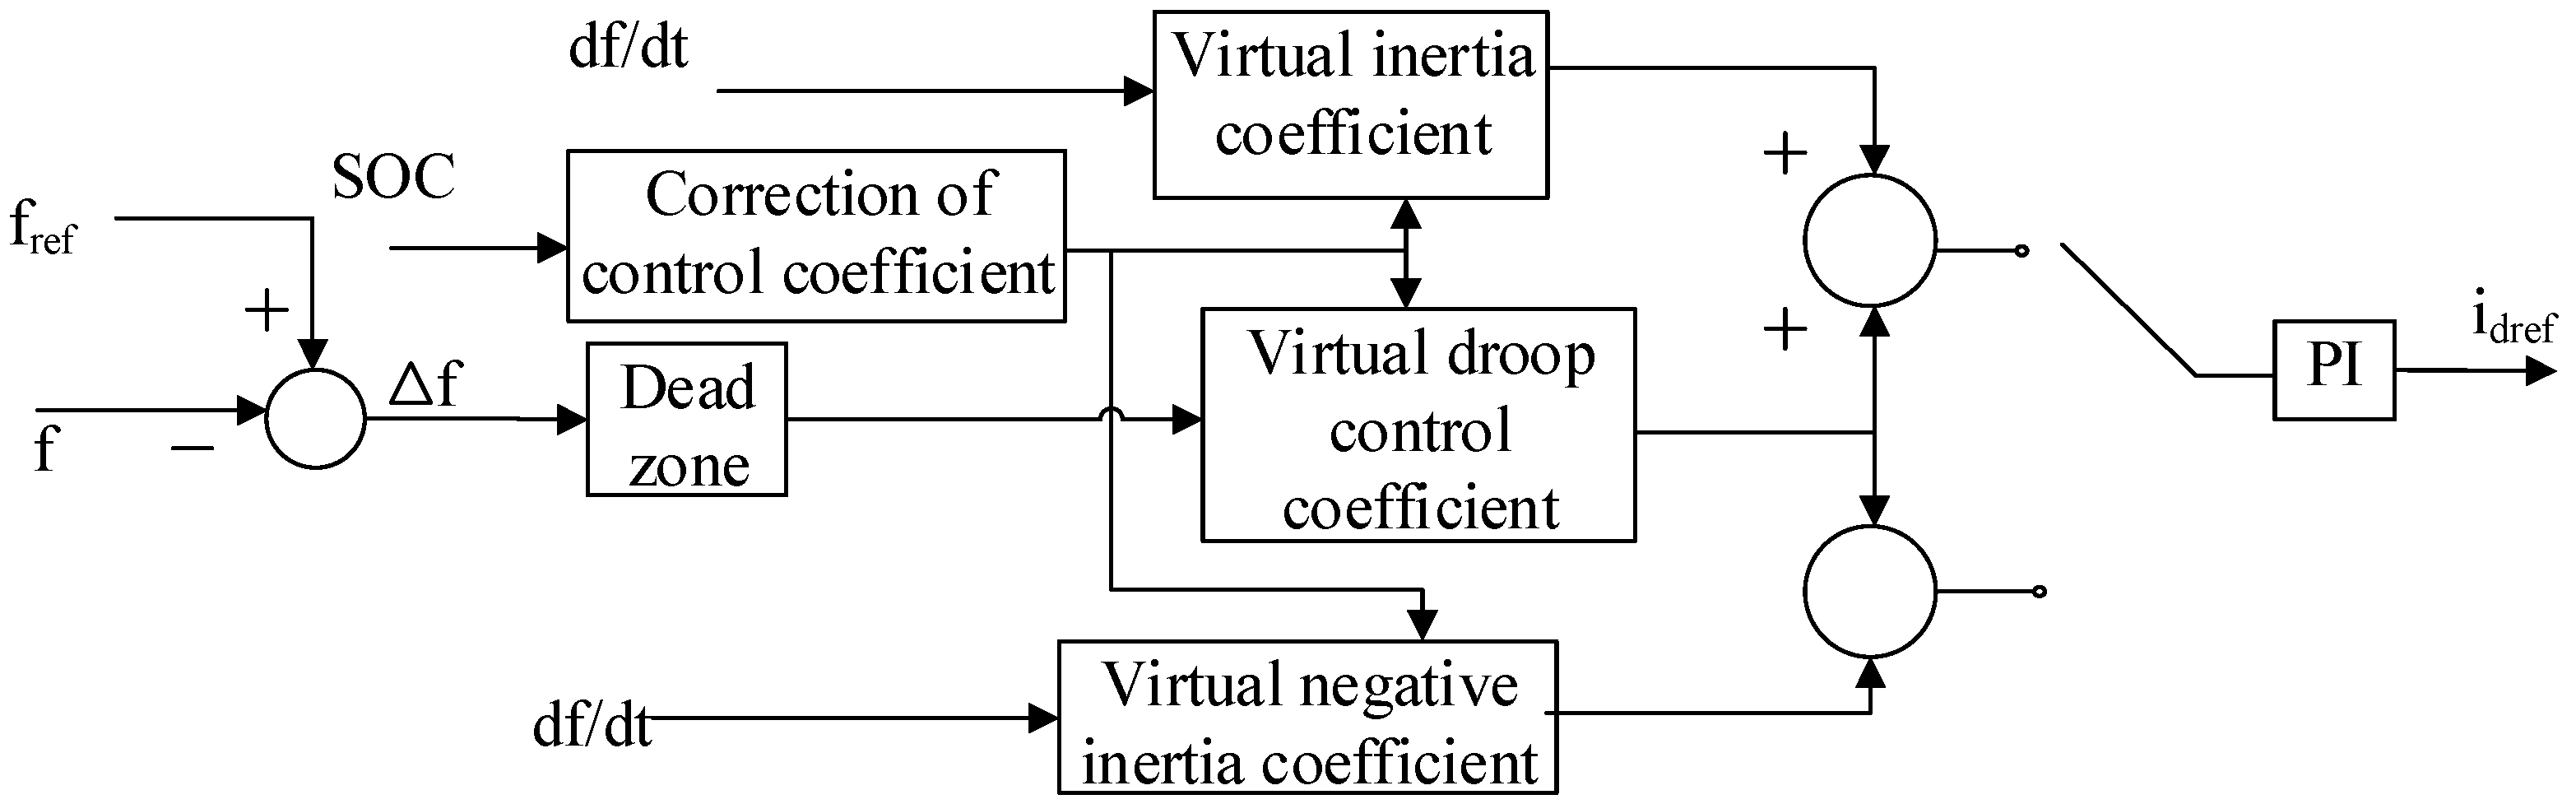
The block diagram of the integrated control strategy proposed in this paper for ESS participating in the primary frequency regulation is shown in
Figure 4.
Take Δf>0 as an example, which means the ESS needs to absorb power:
Step 1: The ESS monitors the frequency and d(Δf)/dt of the power system, as well as the SOC of the ESS. When the frequency of the power system is abnormal, assess whether it is out of the dead zone (fref1, fref2). If it is out of the dead zone, move to the next step. The initial operating range of SOC is set to (10%, 90%), and the dead zone of power system frequency is set to 50 ± 0.033 Hz, according to the requirements of primary frequency regulation in China.
Step 2: When the frequency deviation exceeds the allowed dead zone of frequency change, the ESS starts to participate in primary frequency regulation. In the frequency deterioration stage, the virtual inertial control and the virtual droop control are used together. In the frequency recovery stage, the virtual negative inertial control and the virtual droop control work together. According to the SOC of ESS, the charge and discharge coefficients are obtained. To be specific, the power response values of virtual droop control, virtual inertia control, and virtual negative inertia control are calculated according to Equation (1), Equation (2), and Equation (3), respectively.
Step 3: The power response values are summarized and sent to the PI (proportional integral) controller. Then, the control command is transmitted to the control system of the energy storage inverter.
It is worth mentioning that, when the switch before the PI block is moved, the control command will not change suddenly. In other words, the control command is continuous before and after the switch is moved. The reason is that the switch is only moved when df/dt=0 (the critical state). At this critical state, the outputs of virtual inertial control and virtual negative inertia control are all zeros. Thus, the final output of the frequency deterioration stage and the output of the frequency recovery stage are the same in a critical state. The output value is the output of virtual droop control. This guarantees the continuity of the control command of the method proposed in this paper to avoid sudden change of the ESS output power.
5. Simulation Analysis
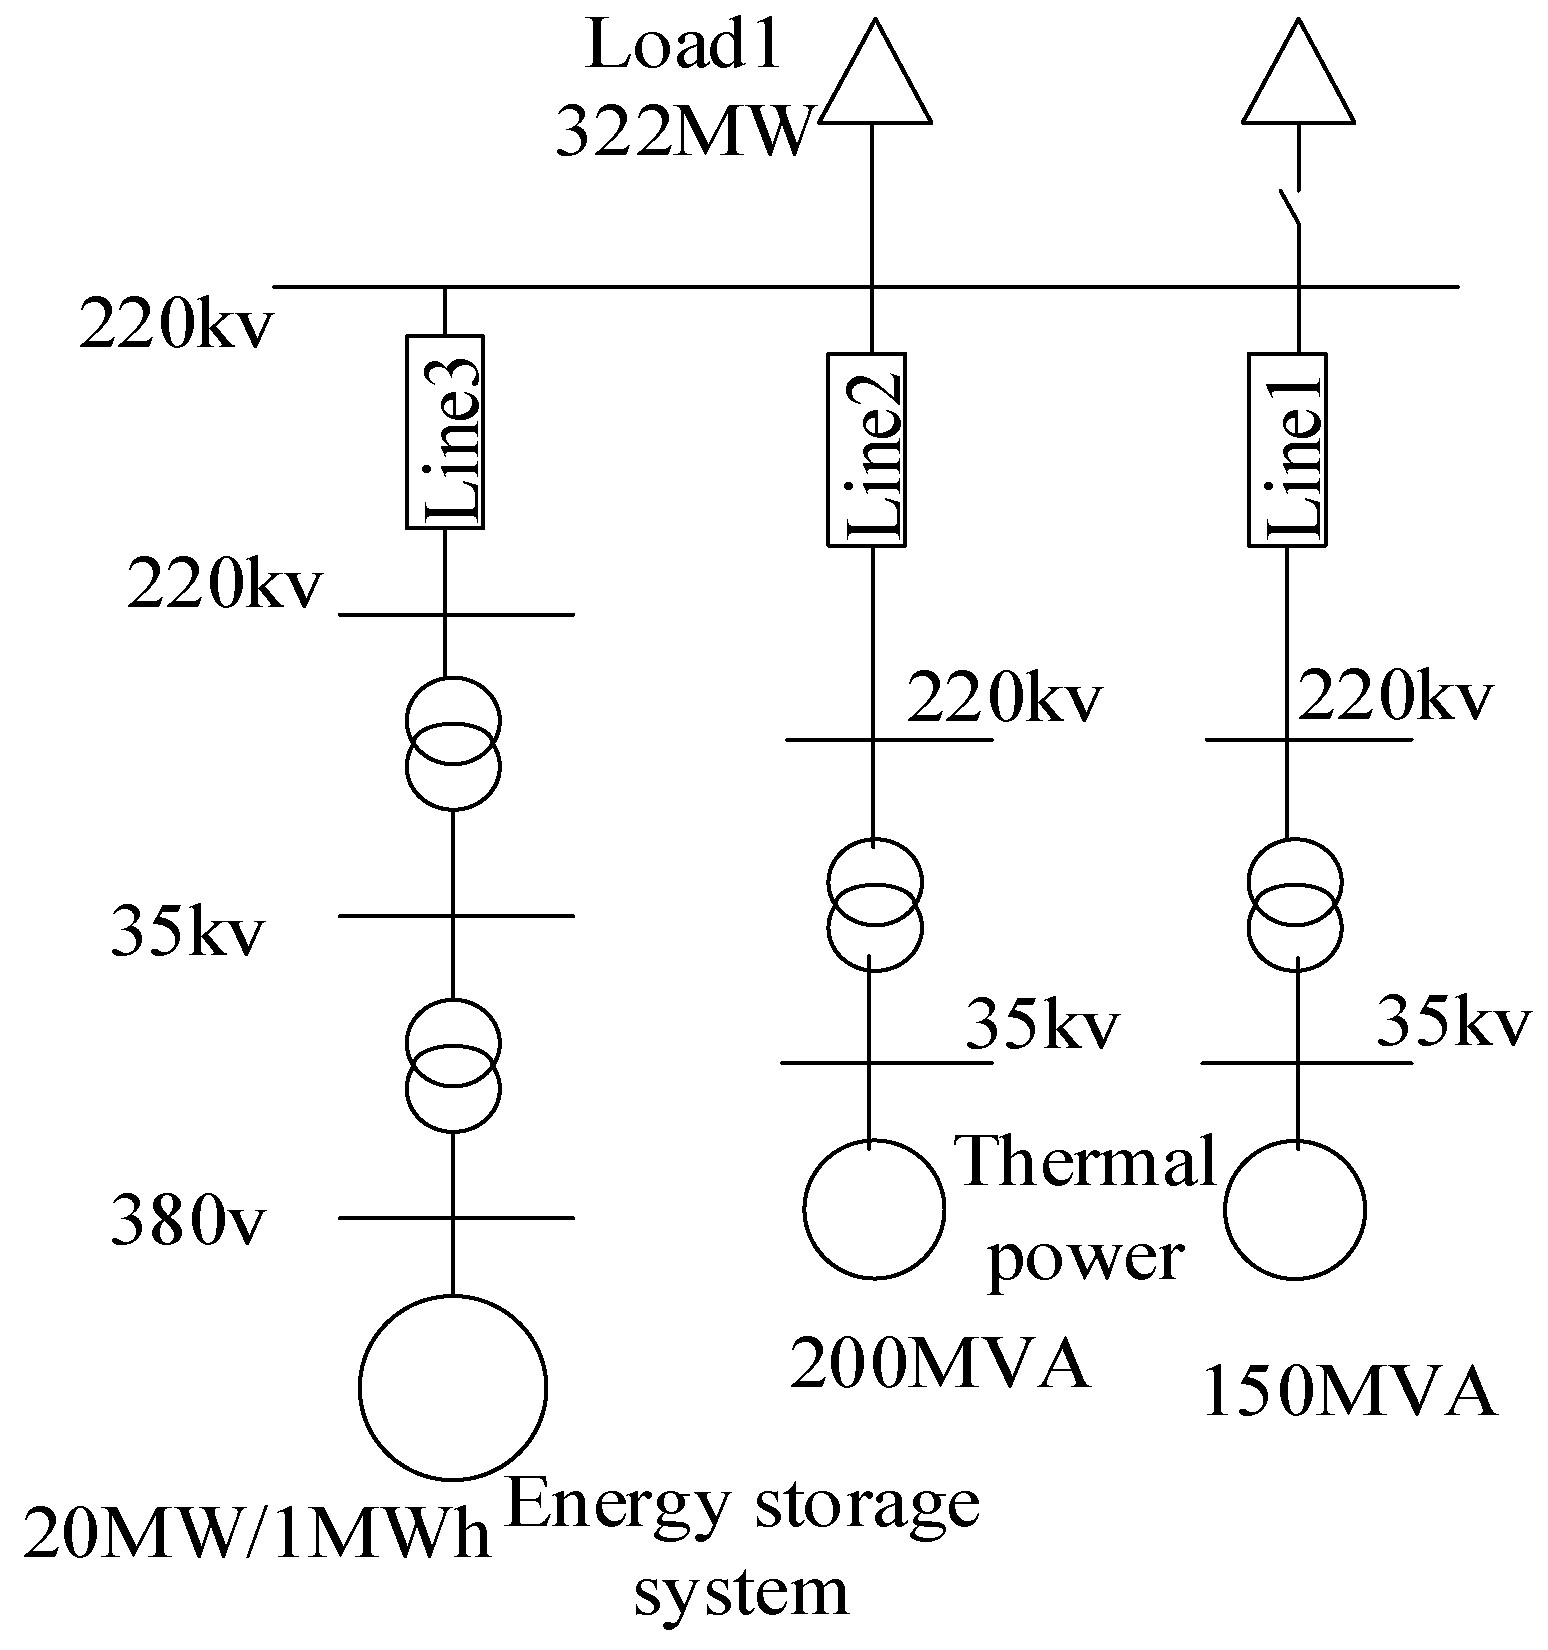
An independent power system, including two thermal power units of ESS, was built in MATLAB/Simulink. The thermal power units had complete speed regulation systems and excitation systems. The rated capacities of the two thermal power units were 200 MVA and 150 MVA, respectively. The rated capacity of ESS was 20 MW/2 MWh. The constant load was 322 MW. The rated frequency of the power system was 50 Hz.
The schematic diagram of the simulation system is shown in
Figure 5. Two case studies, i.e., step load disturbance and continuous load disturbance, were carried out to verify the proposed control method. In each case study, four control methods were used to compare with each other. The four control methods were as follows,
Method 1: No ESS was installed in the power system. The system frequency was regulated by generator units.
Method 2: ESS was added to the system to participate in primary frequency regulation. After the load disturbance occurred in the system, the charging or discharging power of ESS was controlled. In the frequency deterioration stage, the virtual droop control and virtual inertia control were used to control the output of ESS. In the frequency recovery stage, the virtual droop control was used. The control coefficients were based on the SOC of ESS.
Method 3: ESS was added to the system to participate in primary frequency regulation. In the frequency deterioration stage, the virtual inertia control and the virtual droop control were used to control the output of ESS, while the virtual droop control and virtual negative inertia control were used in the frequency recovery stage. The droop coefficient and the inertia coefficient were constant.
Method 4: Method 4 was similar to Method 3. The difference was that the control coefficients of Method 4 were based on the SOC of ESS.
The four methods were typical methods to control ESS participating in frequency regulation. Comparing Method 1 with the other three methods could verify the function of ESS since ESS was not used in Method 1. Comparing Method 2 and Method 4 could prove the advantage of the use of virtual negative inertia control in the frequency recovery stage because virtual negative inertia control was not used in Method 2. By comparing Method 3 and Method 4, it could be seen that the control coefficients based on SOC could avoid over-charging and over-discharging of ESS since the control coefficients of Method 3 were constant. These methods were compared to show the advantages of Method 4, which was proposed in this paper.
5.1. Case 1: Step Load Disturbance
The step load disturbance was conducted by putting a switched load of 24 MW to the power system at the time 1 s. This caused an unbalance of the power in the system, and the system frequency started to decrease and oscillate. The simulation results of step load disturbance are shown in
Figure 6 and
Figure 7.
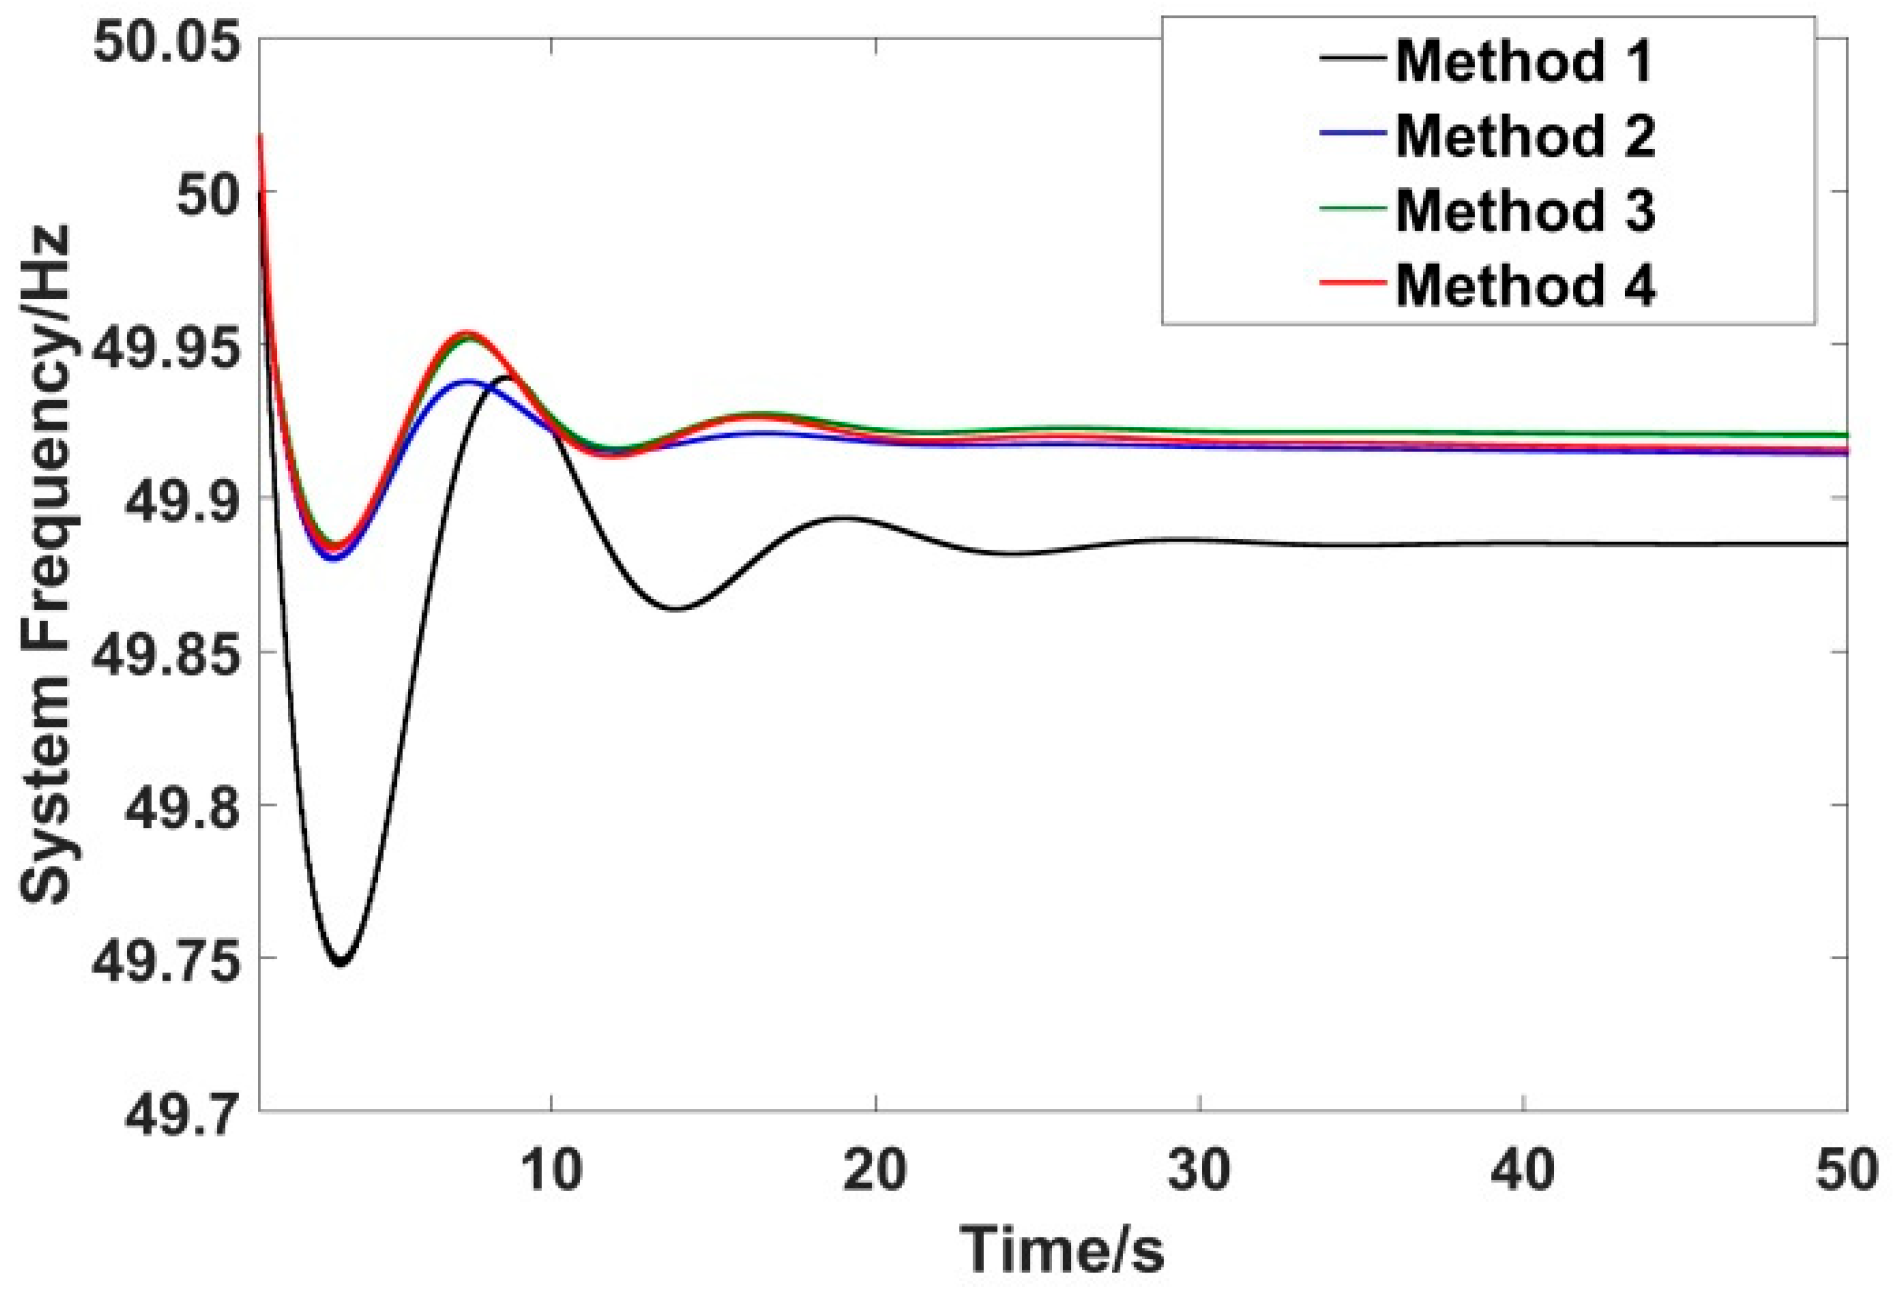
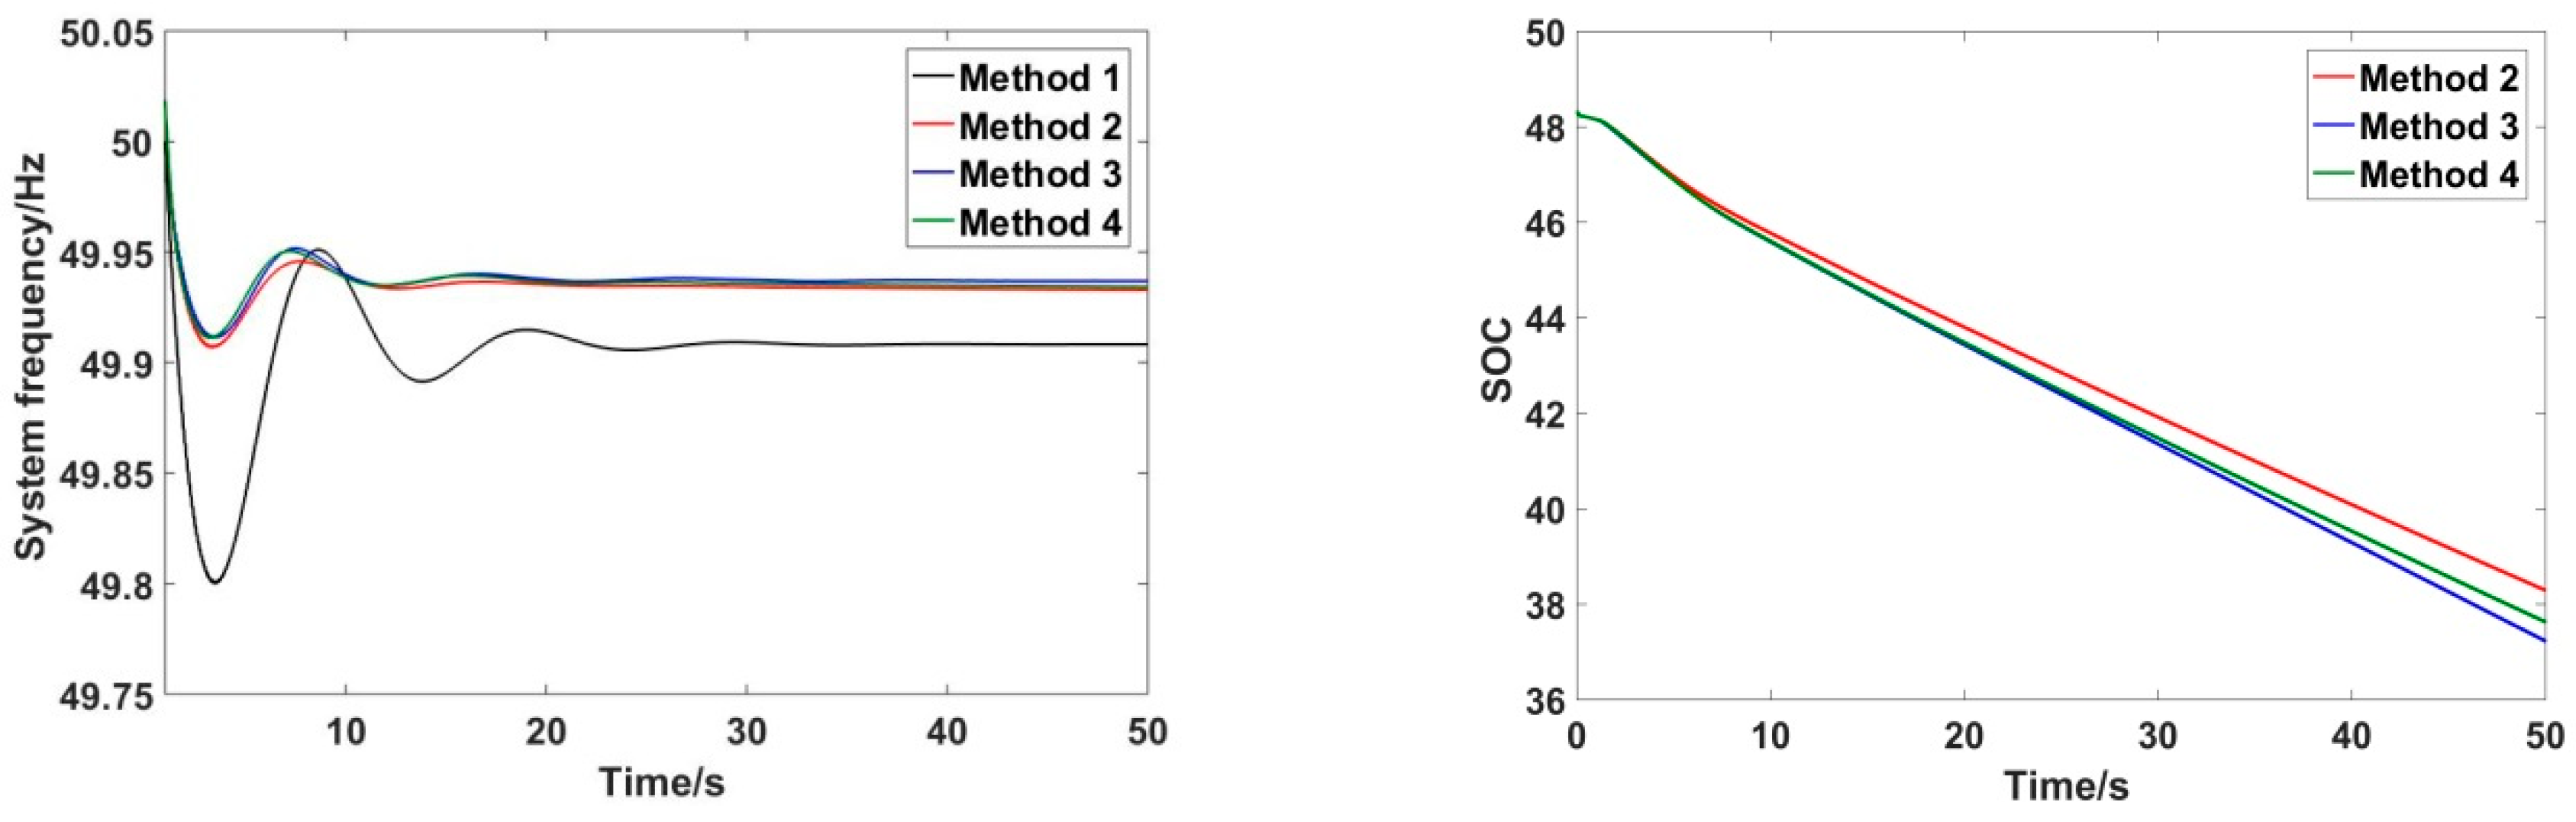
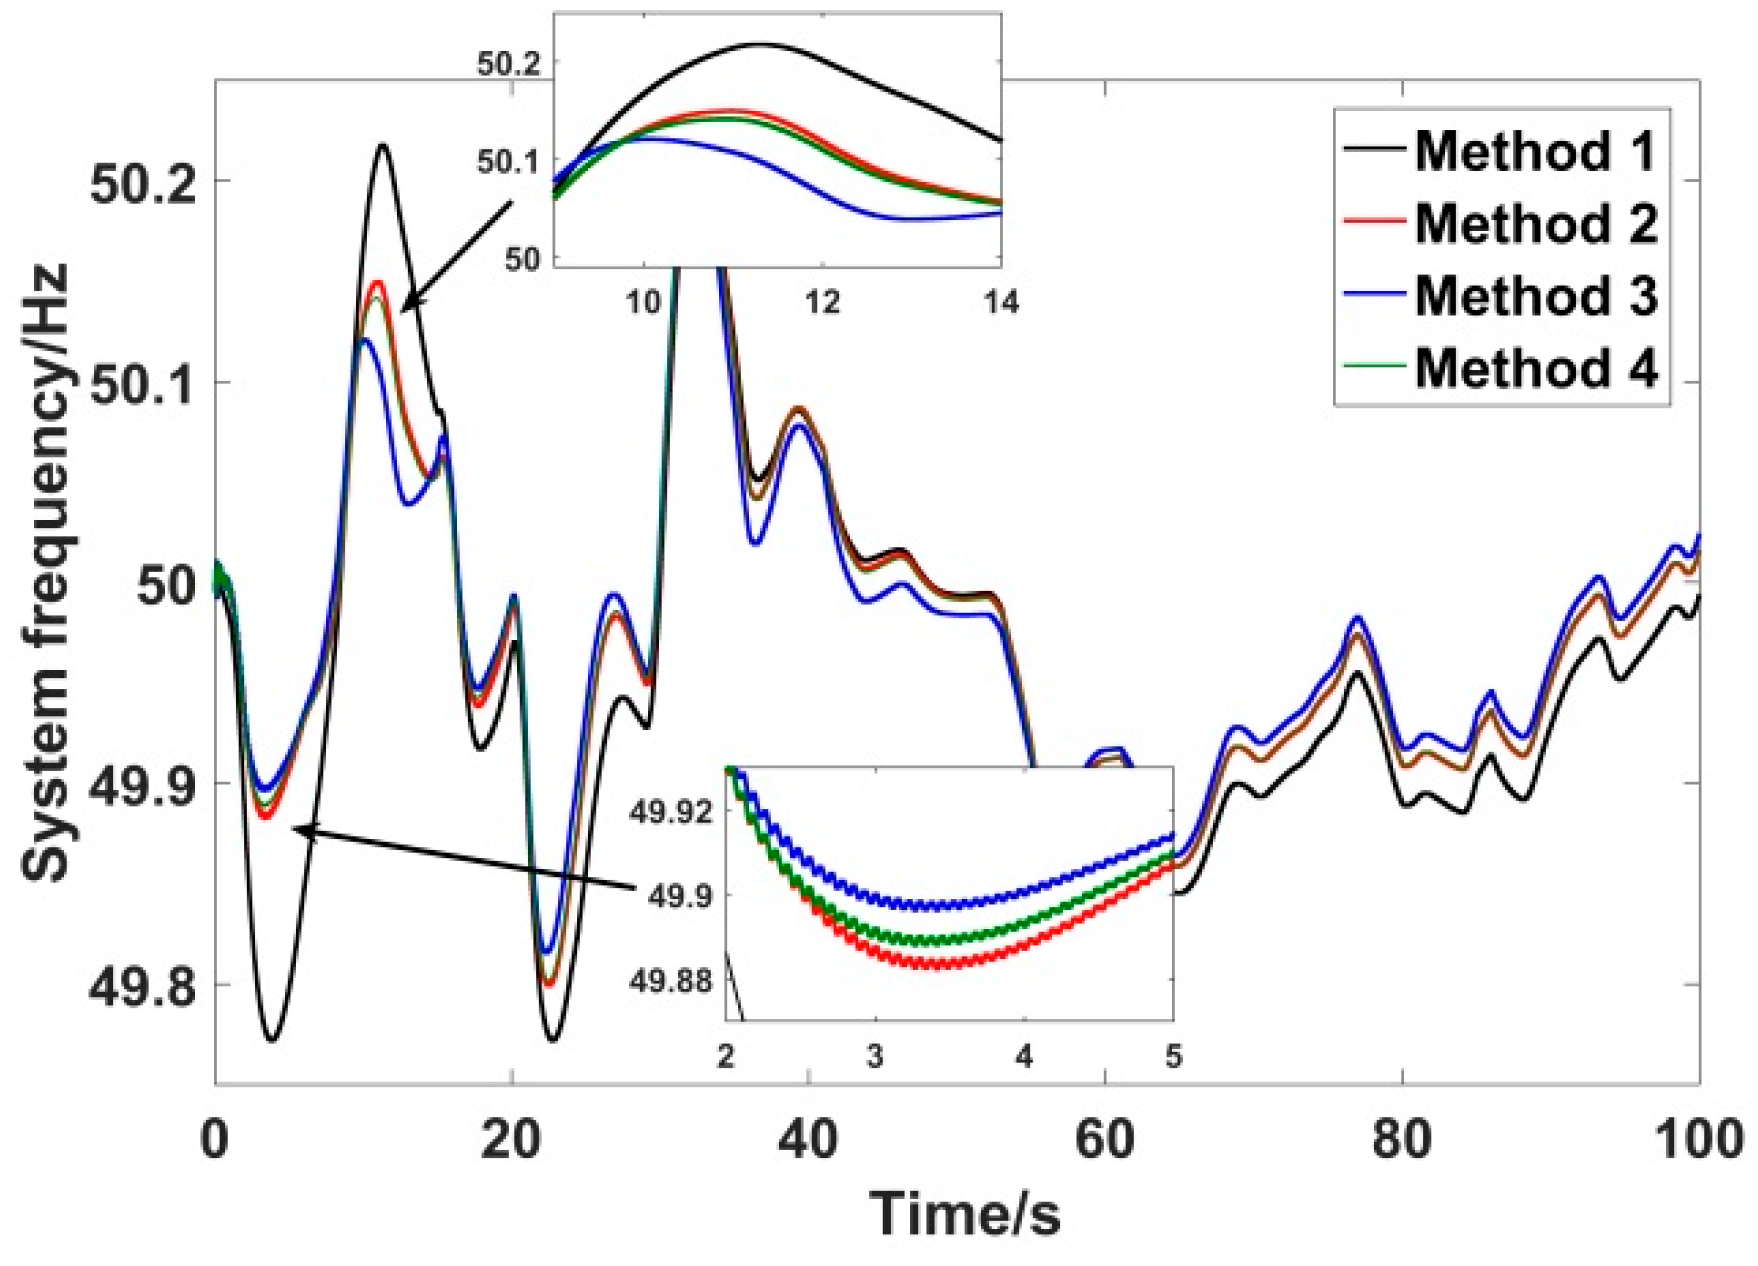
In
Figure 6, the system frequencies of all the four methods decreased at the moment when the switched load was applied. Method 1 had the largest frequency deviation, and its lowest frequency was 49.75 Hz. Compared with Method 1, the lowest frequency values of the other three methods were larger. Besides, the frequency change rates of the other three methods in the frequency deterioration stages were smaller. This meant the use of ESS could improve the lowest frequency and reduce the frequency change rate, which was beneficial for frequency regulation.
The lowest frequency of Method 2 was 49.88 Hz, which was lower than that of Method 3 and Method 4. Method 3 and Method 4 almost had the same lowest frequencies, i.e., 49.884 Hz and 49.885 Hz, respectively. These results suggested that the virtual negative inertia control used in the frequency recovery stage in Method 3 and Method 4 could improve the lowest frequency.
As for the time to reach a steady-state, Method 1 needed 31.26 s, and it was the longest among the four methods. The time of Method 2, Method 3, and Method 4 was 21.21 s, 19.18 s, and 19.66 s, respectively. Hence, the results of Method 3 and Method 4 were also better. The reason is that the virtual negative inertia control in the frequency recovery stage can accelerate the recovery of the system frequency.
At the steady states, the frequency deviation of Method 1, Method 2, Method 3, and Method 4 was 0.13 Hz, 0.036 Hz, 0.035 Hz, and 0.035 Hz, respectively. Method 3 and Method 4 had the smallest steady-state frequency deviation.
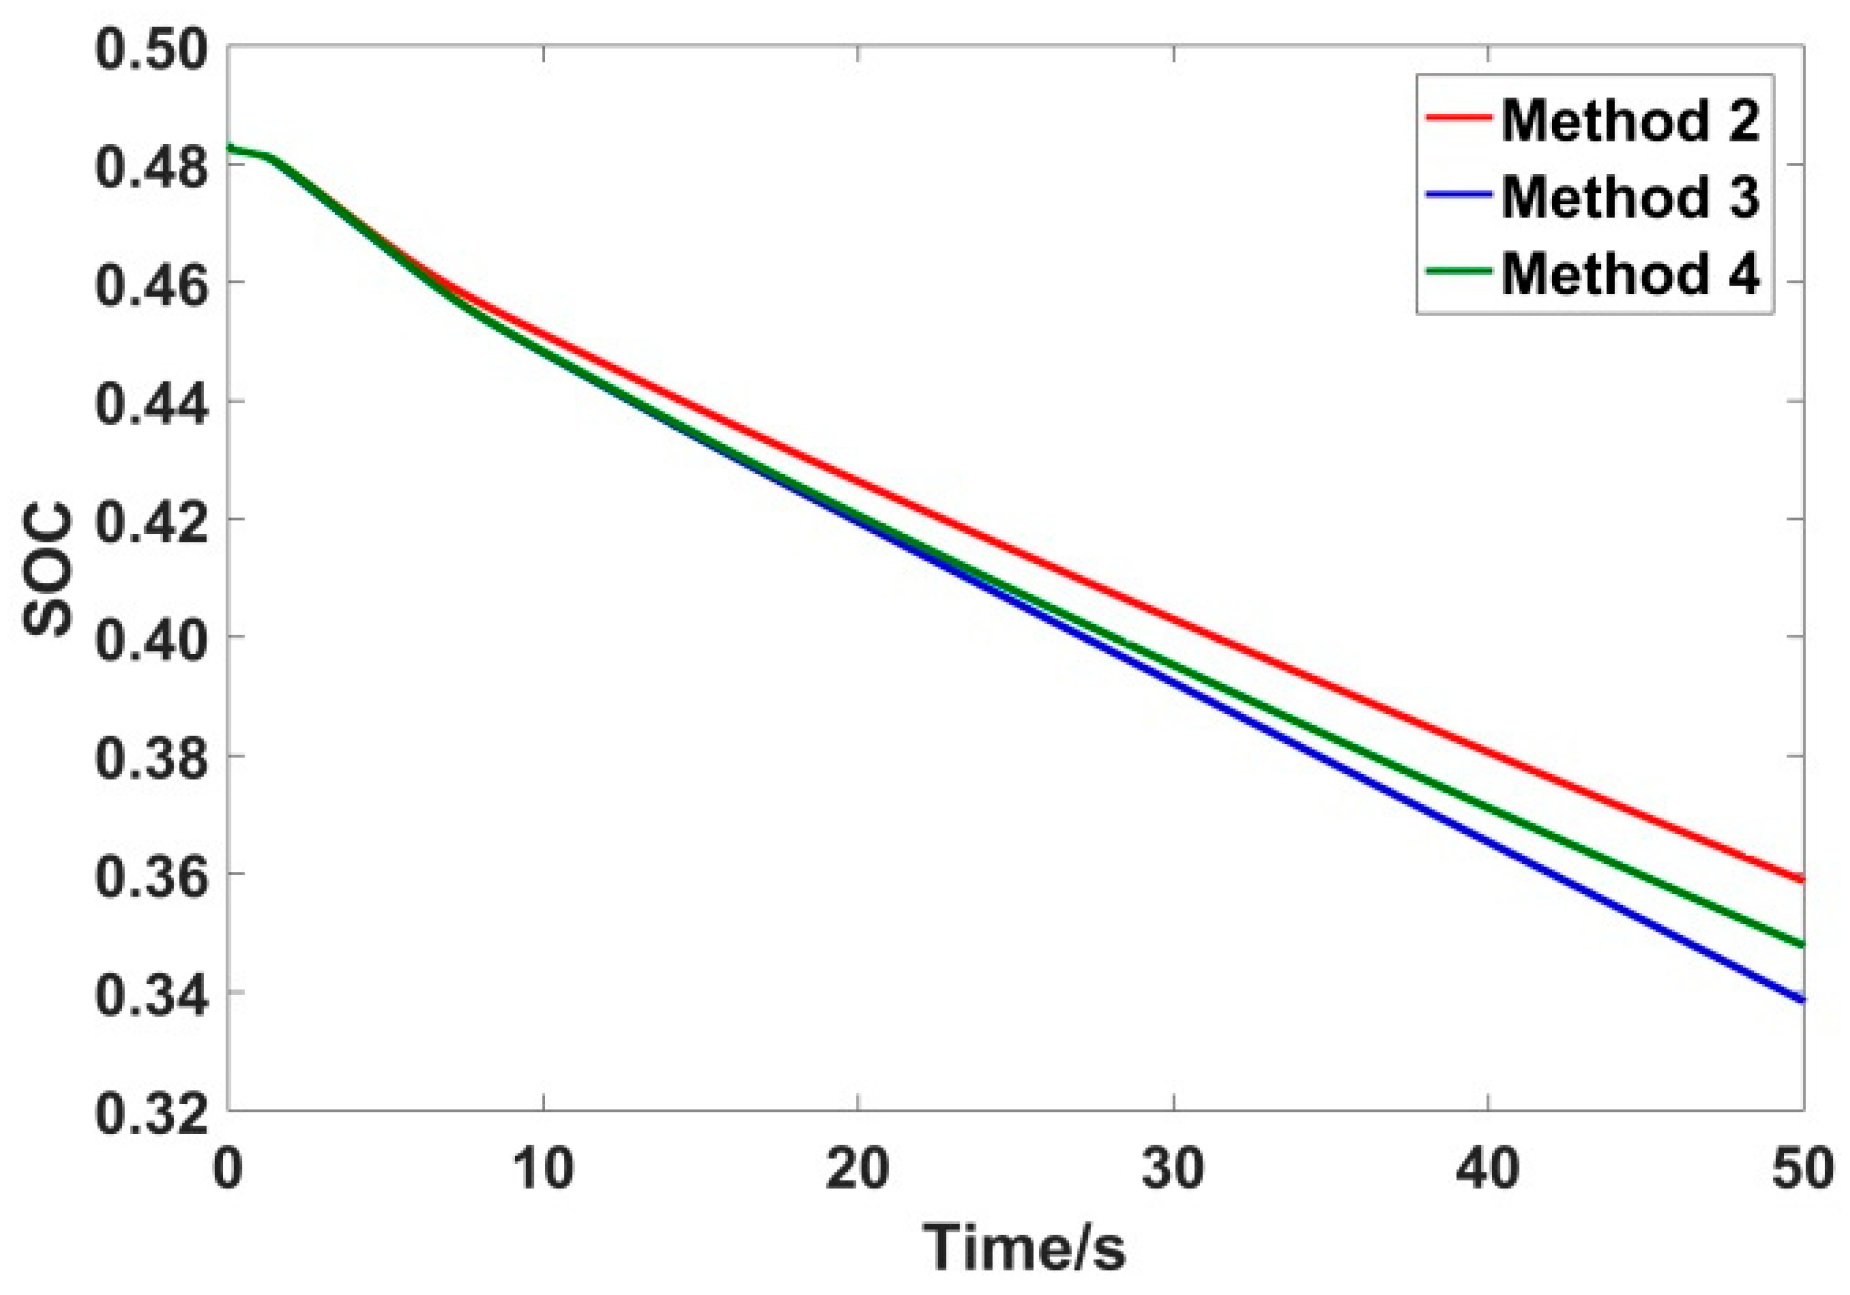
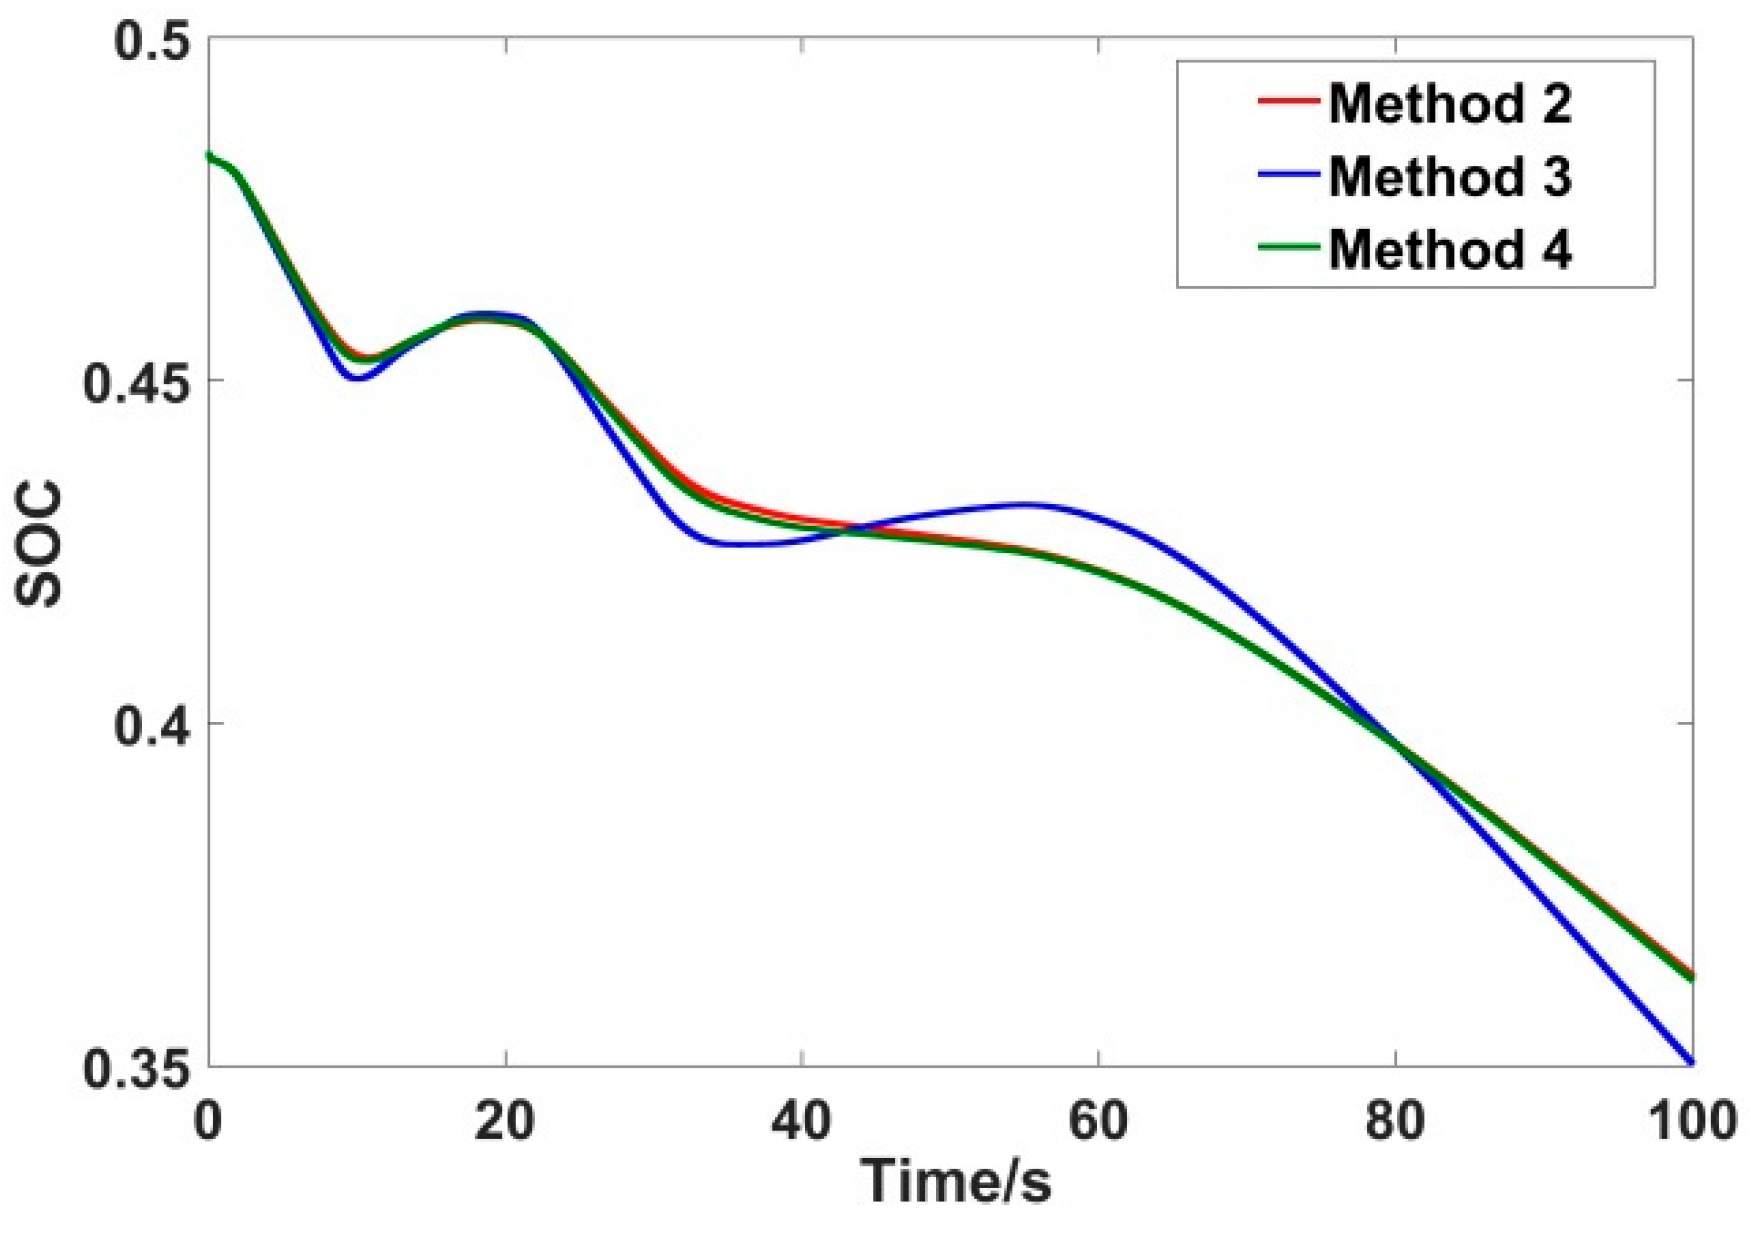
In
Figure 7, the SOC curves of Method 2, Method 3, and Method 4 are illustrated. The final SOC of Method 2 was 0.359, which was the largest. Method 3 had the smallest final SOC, i.e., 0.339. The final SOC of Method 4 was 0.348. It was greater than the SOC of Method 3. This was because the control coefficients of Method 4 were based on the SOC, while the control coefficients of Method 3 were constant. Method 4 could avoid over-charging and over-discharging of ESS. Hence, the SOC of Method 4 could be kept in a proper range, and the cycle life of ESS could be improved.
As mentioned before, the frequency regulation performance of Method 3 and Method 4 was much better than that of Method 1 and Method 2. Although Method 3 had a little advantage over Method 4 in respect of frequency regulation, the SOC of Method 3 was worse than that of Method 4. Therefore, Method 4 was the best method to balance frequency regulation and cycle life of ESS when the step load disturbance was applied.
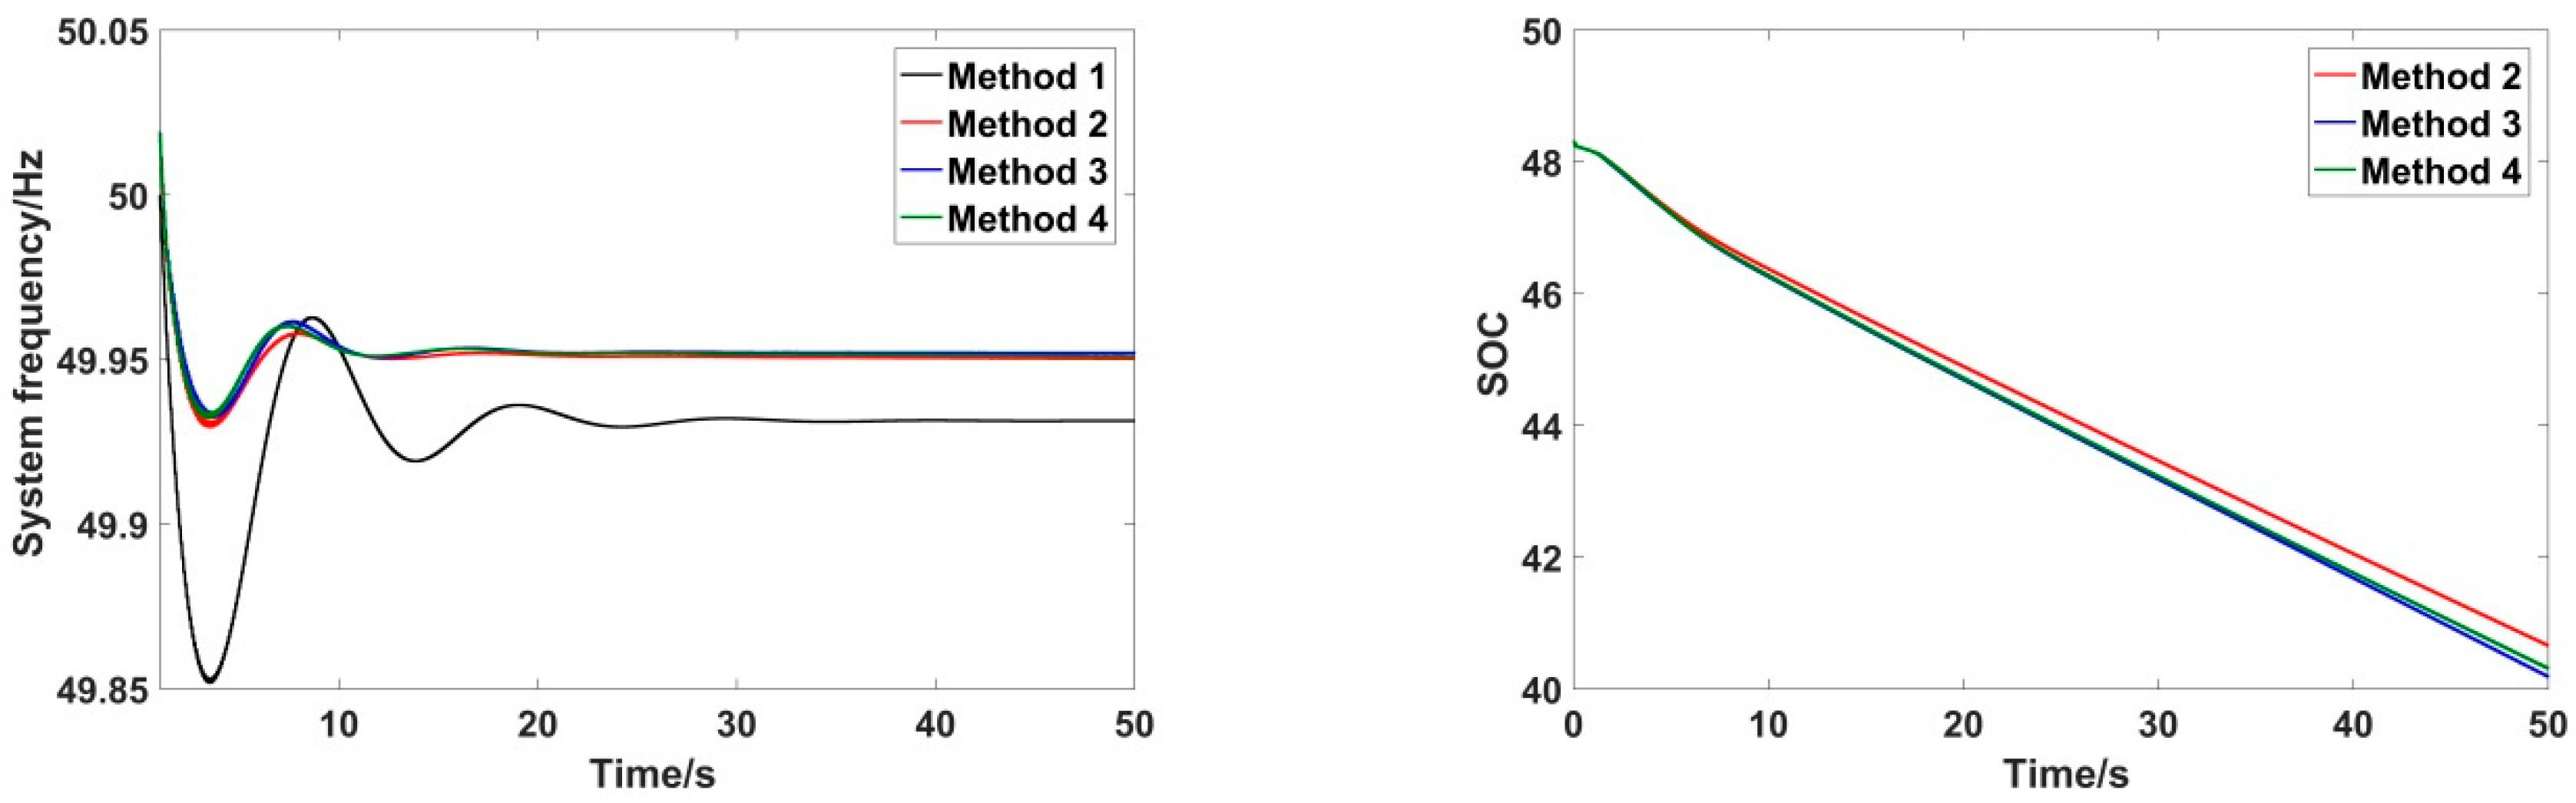
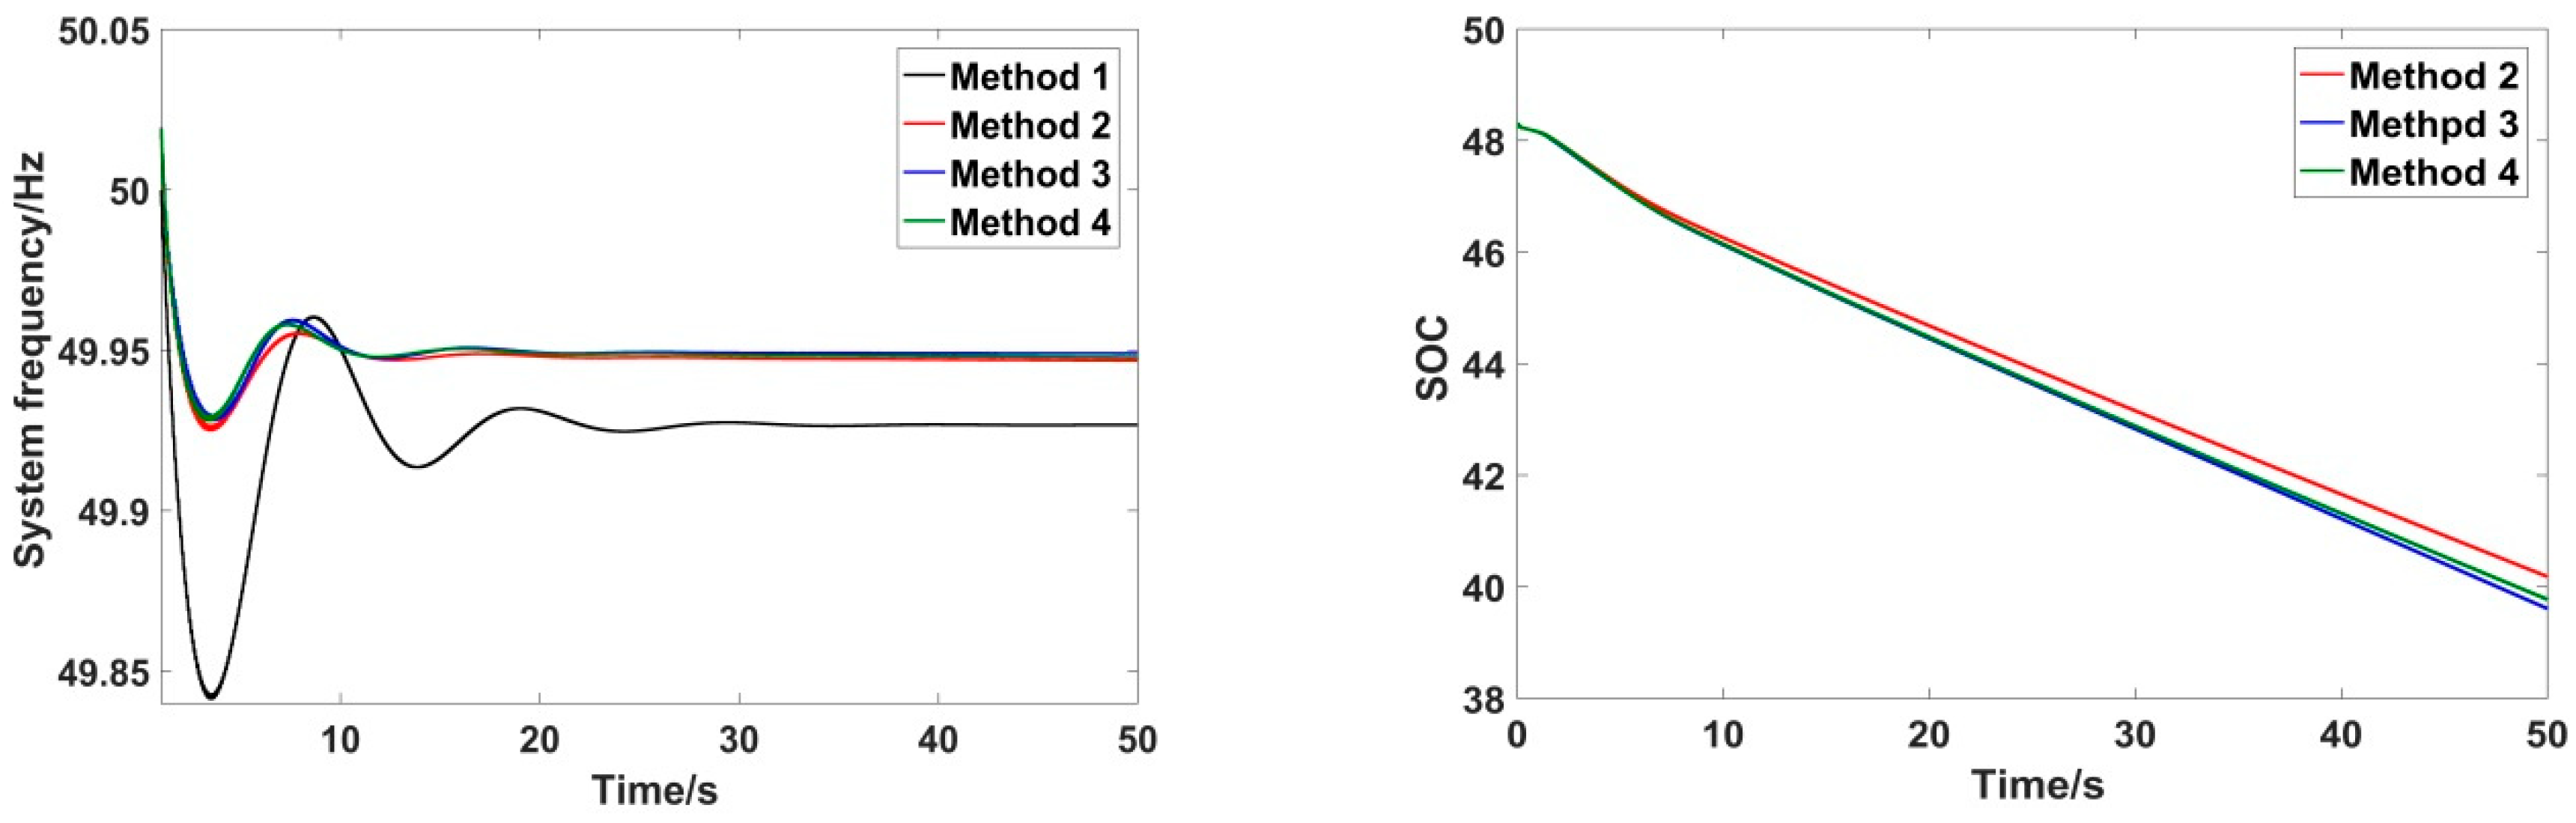
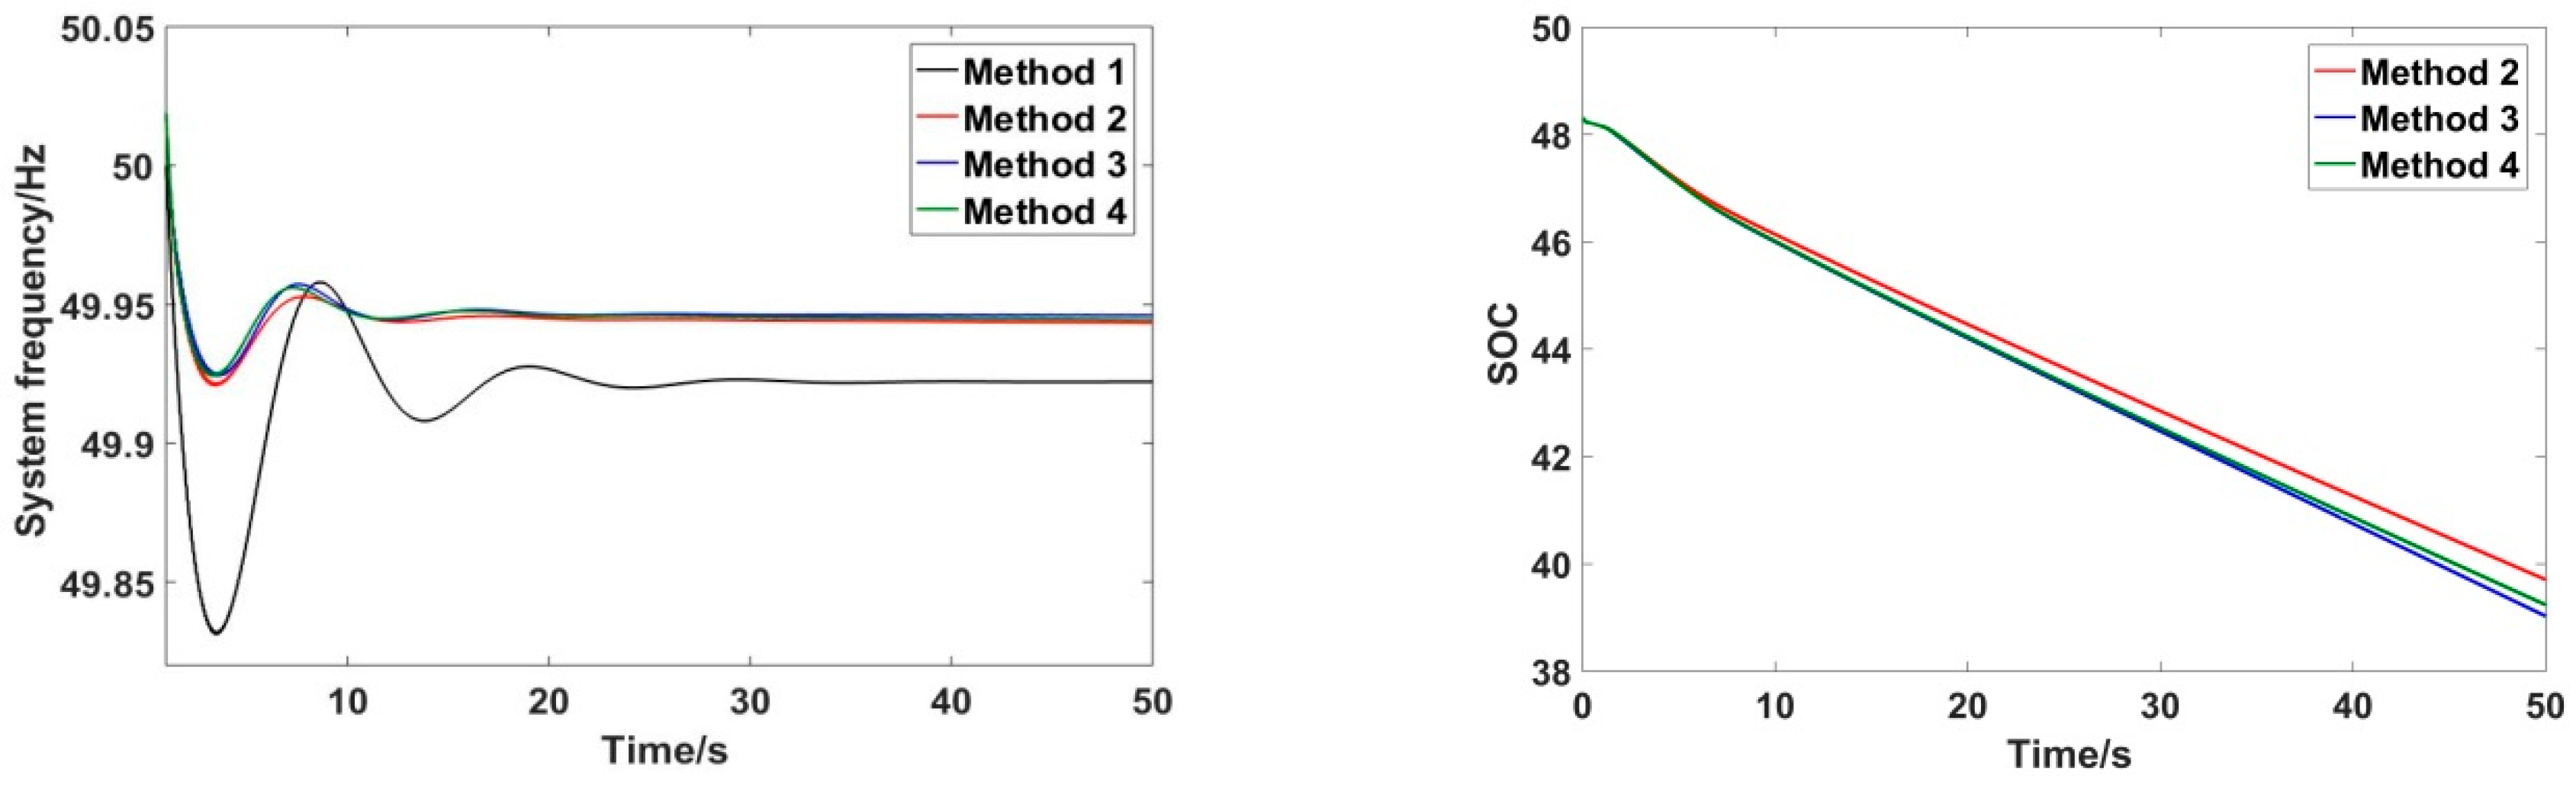
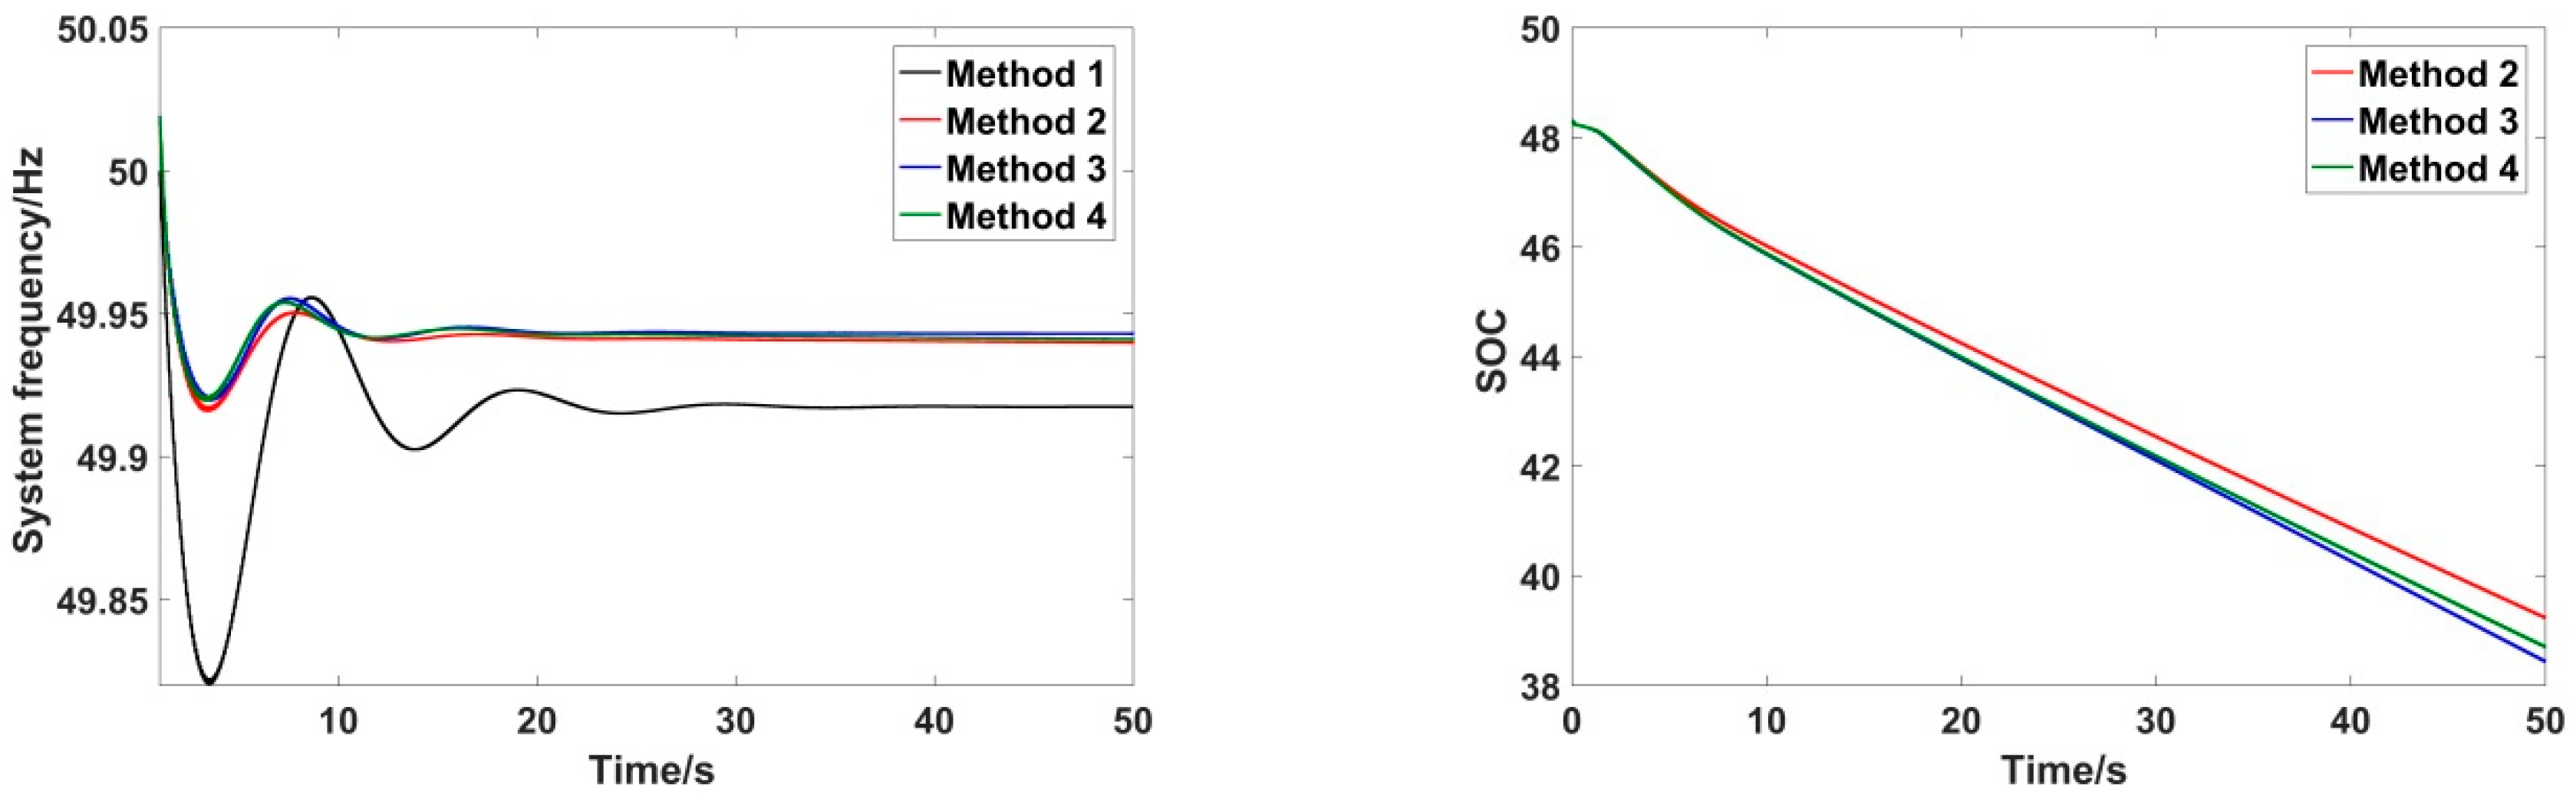
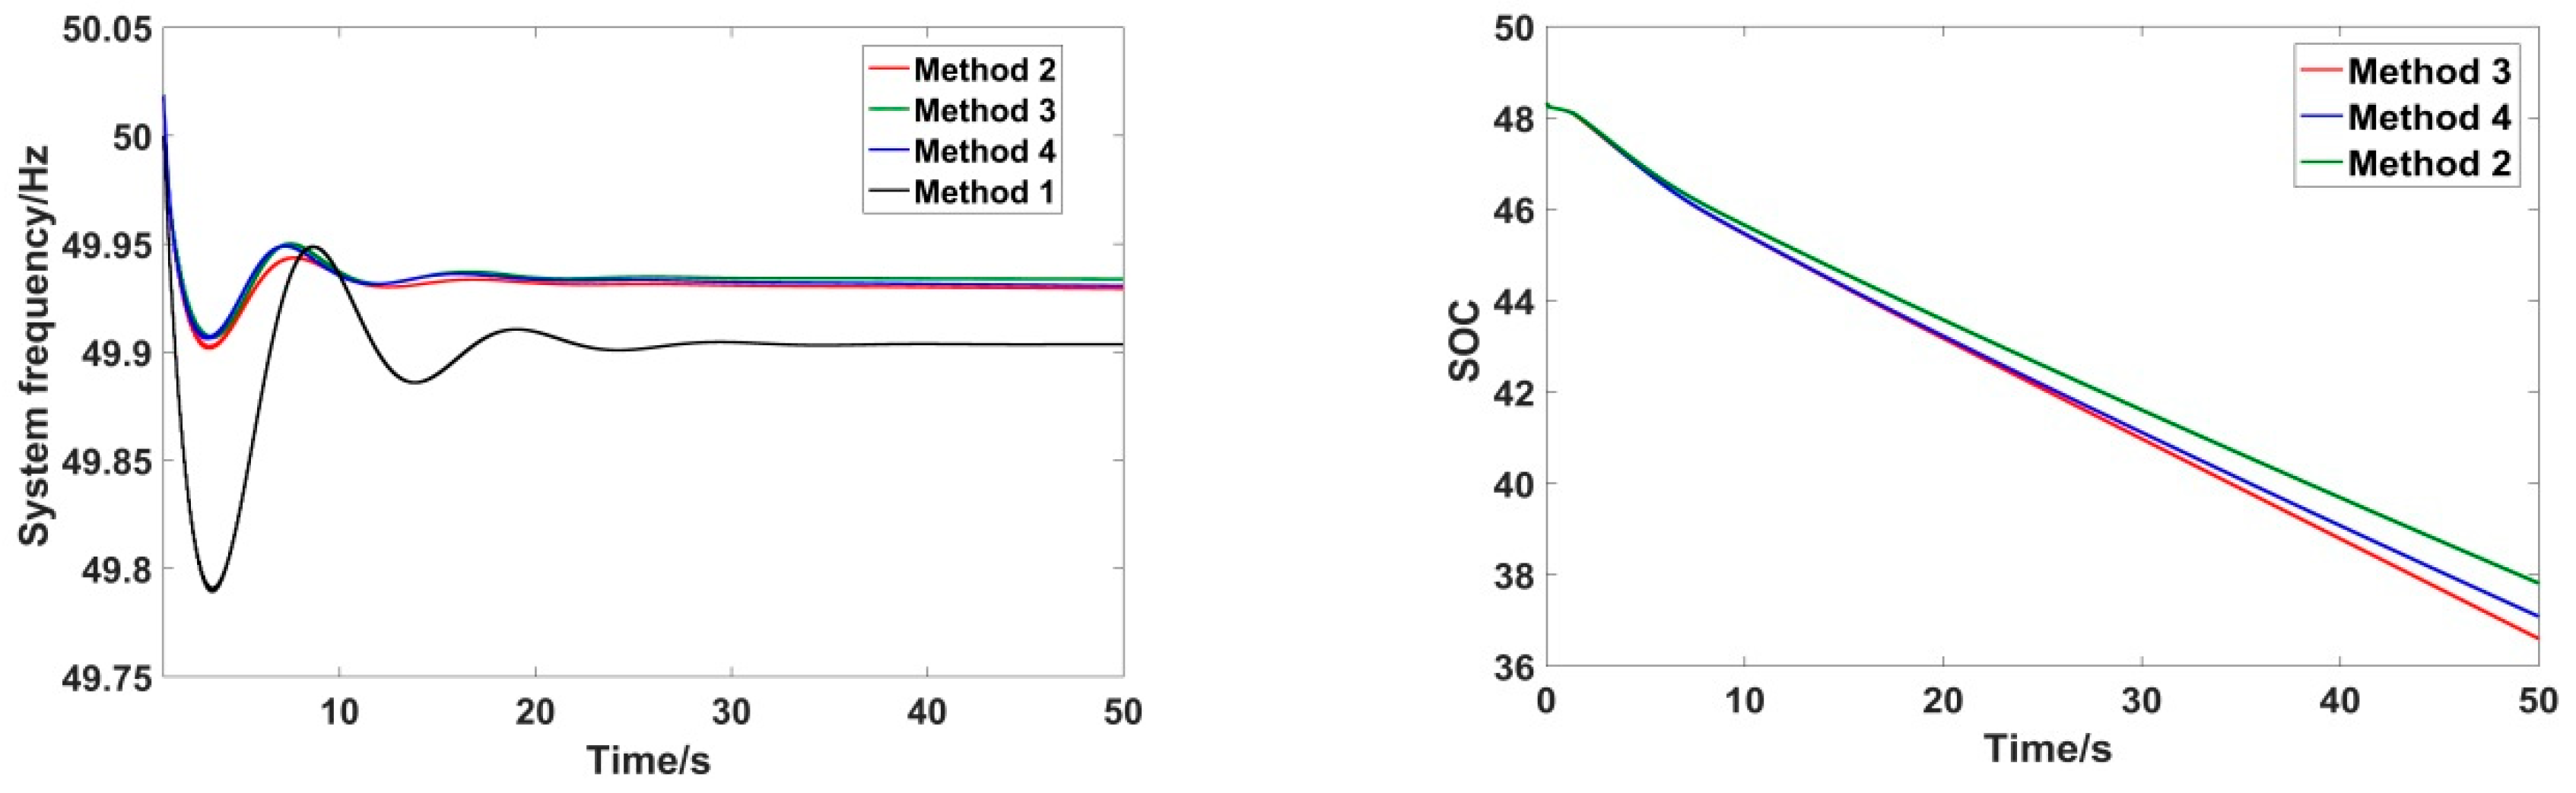
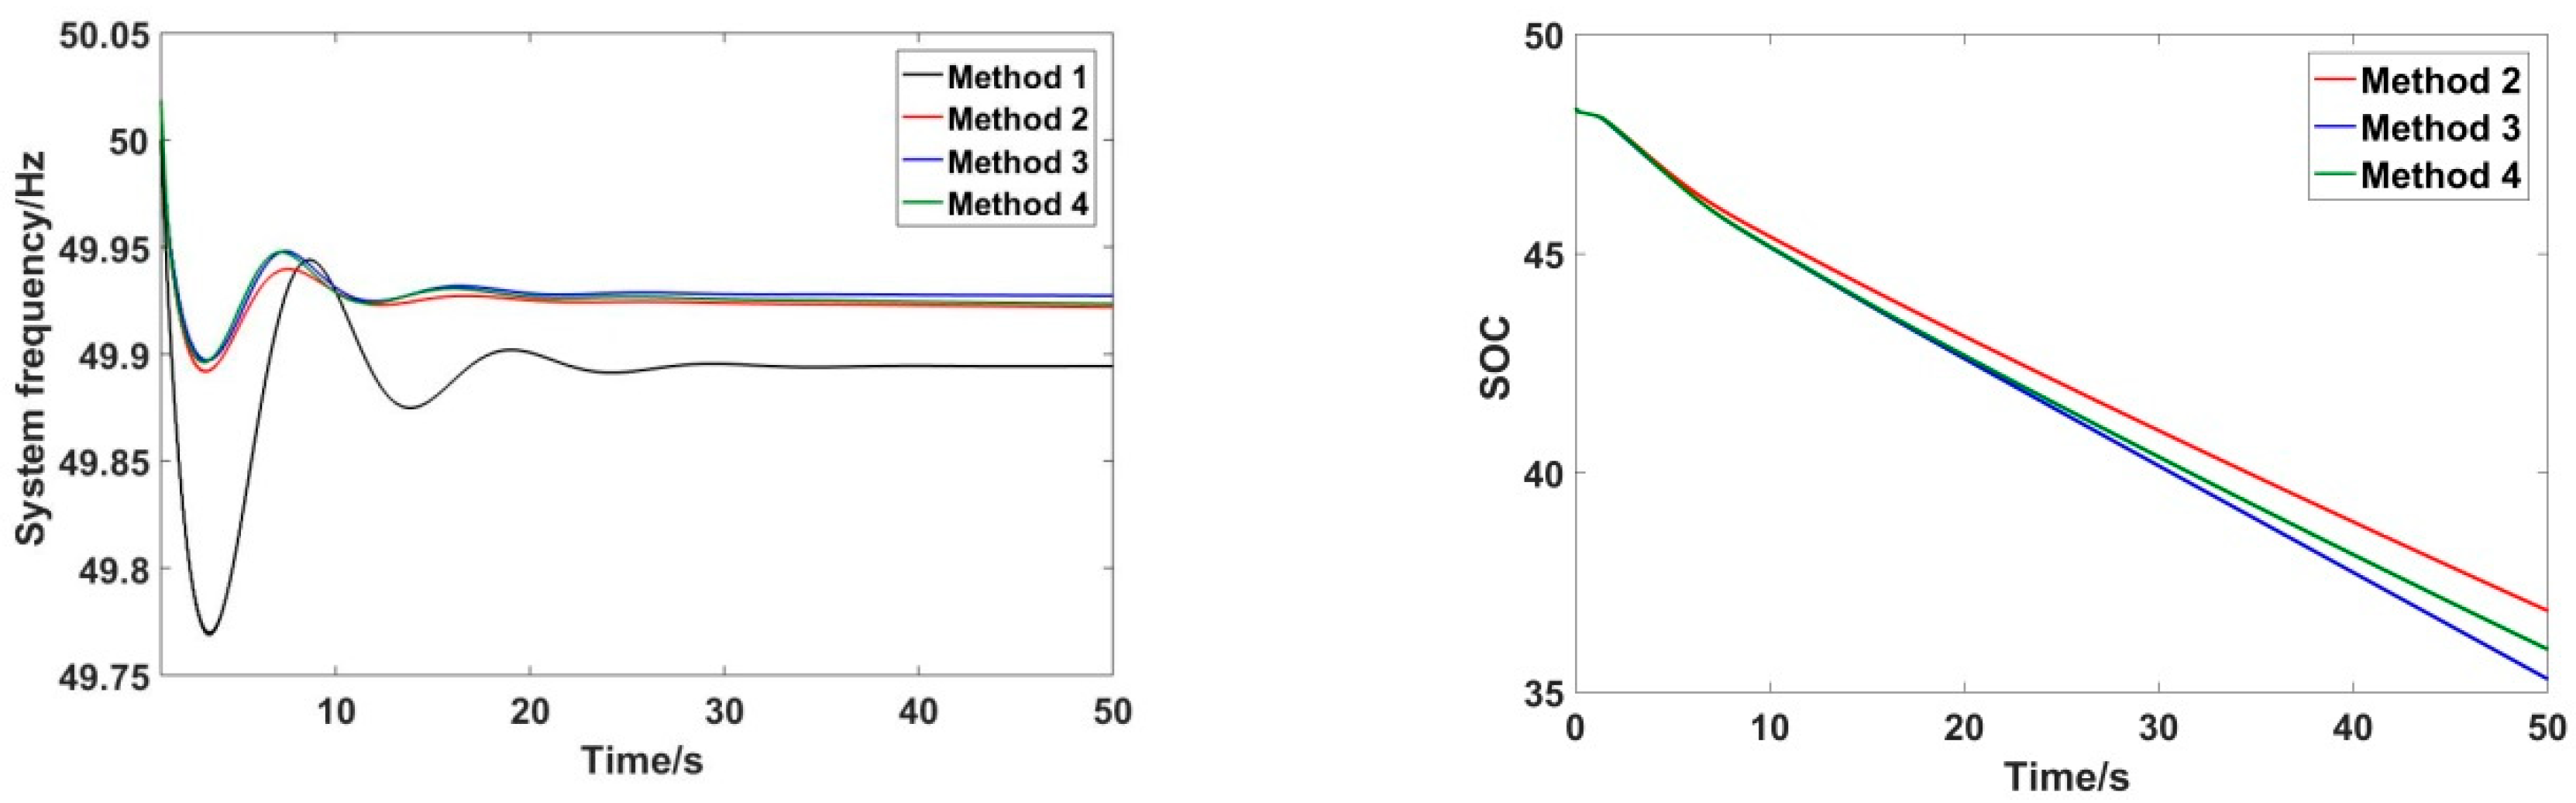
In order to show the generality of the control strategy proposed in this paper, different step load disturbances were simulated, such as 13 MW, 14 MW, 15 MW, 16 MW, and so on. The corresponding simulation results are shown in
Figure 8,
Figure 9,
Figure 10,
Figure 11,
Figure 12,
Figure 13,
Figure 14,
Figure 15 and
Figure 16.
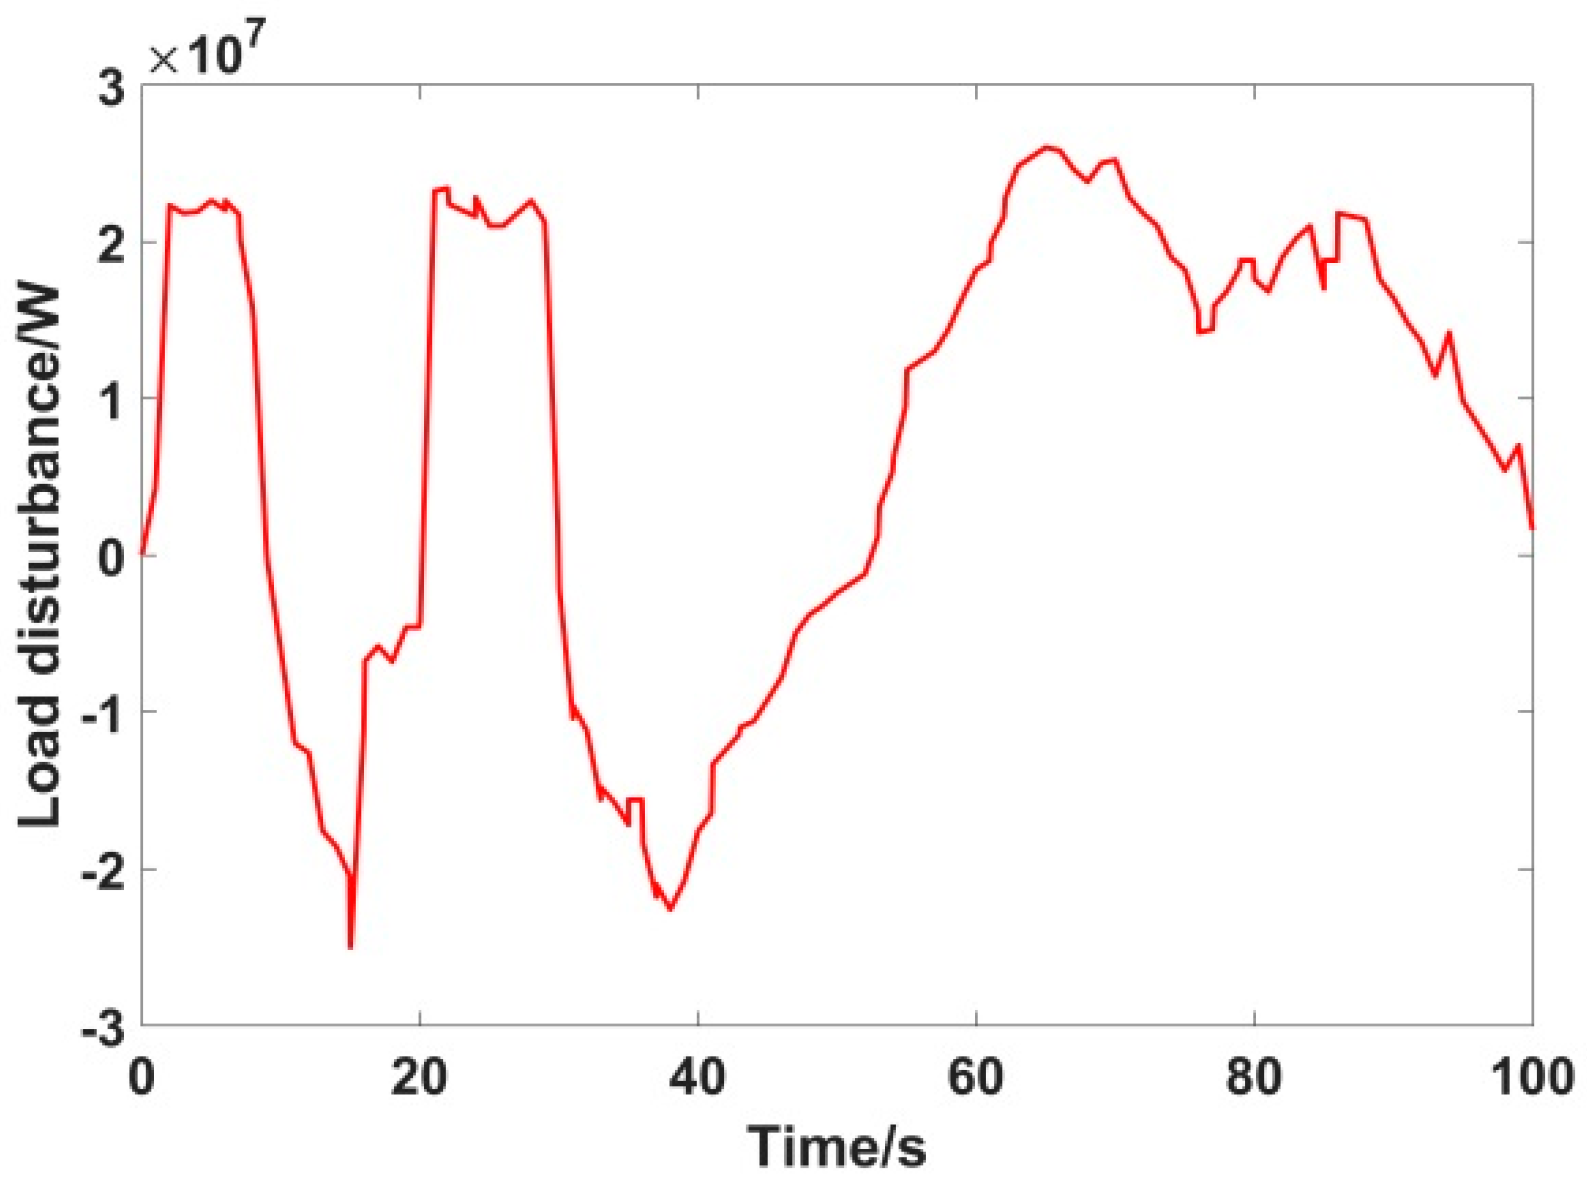
5.2. Case 2: Continuous Load Disturbance
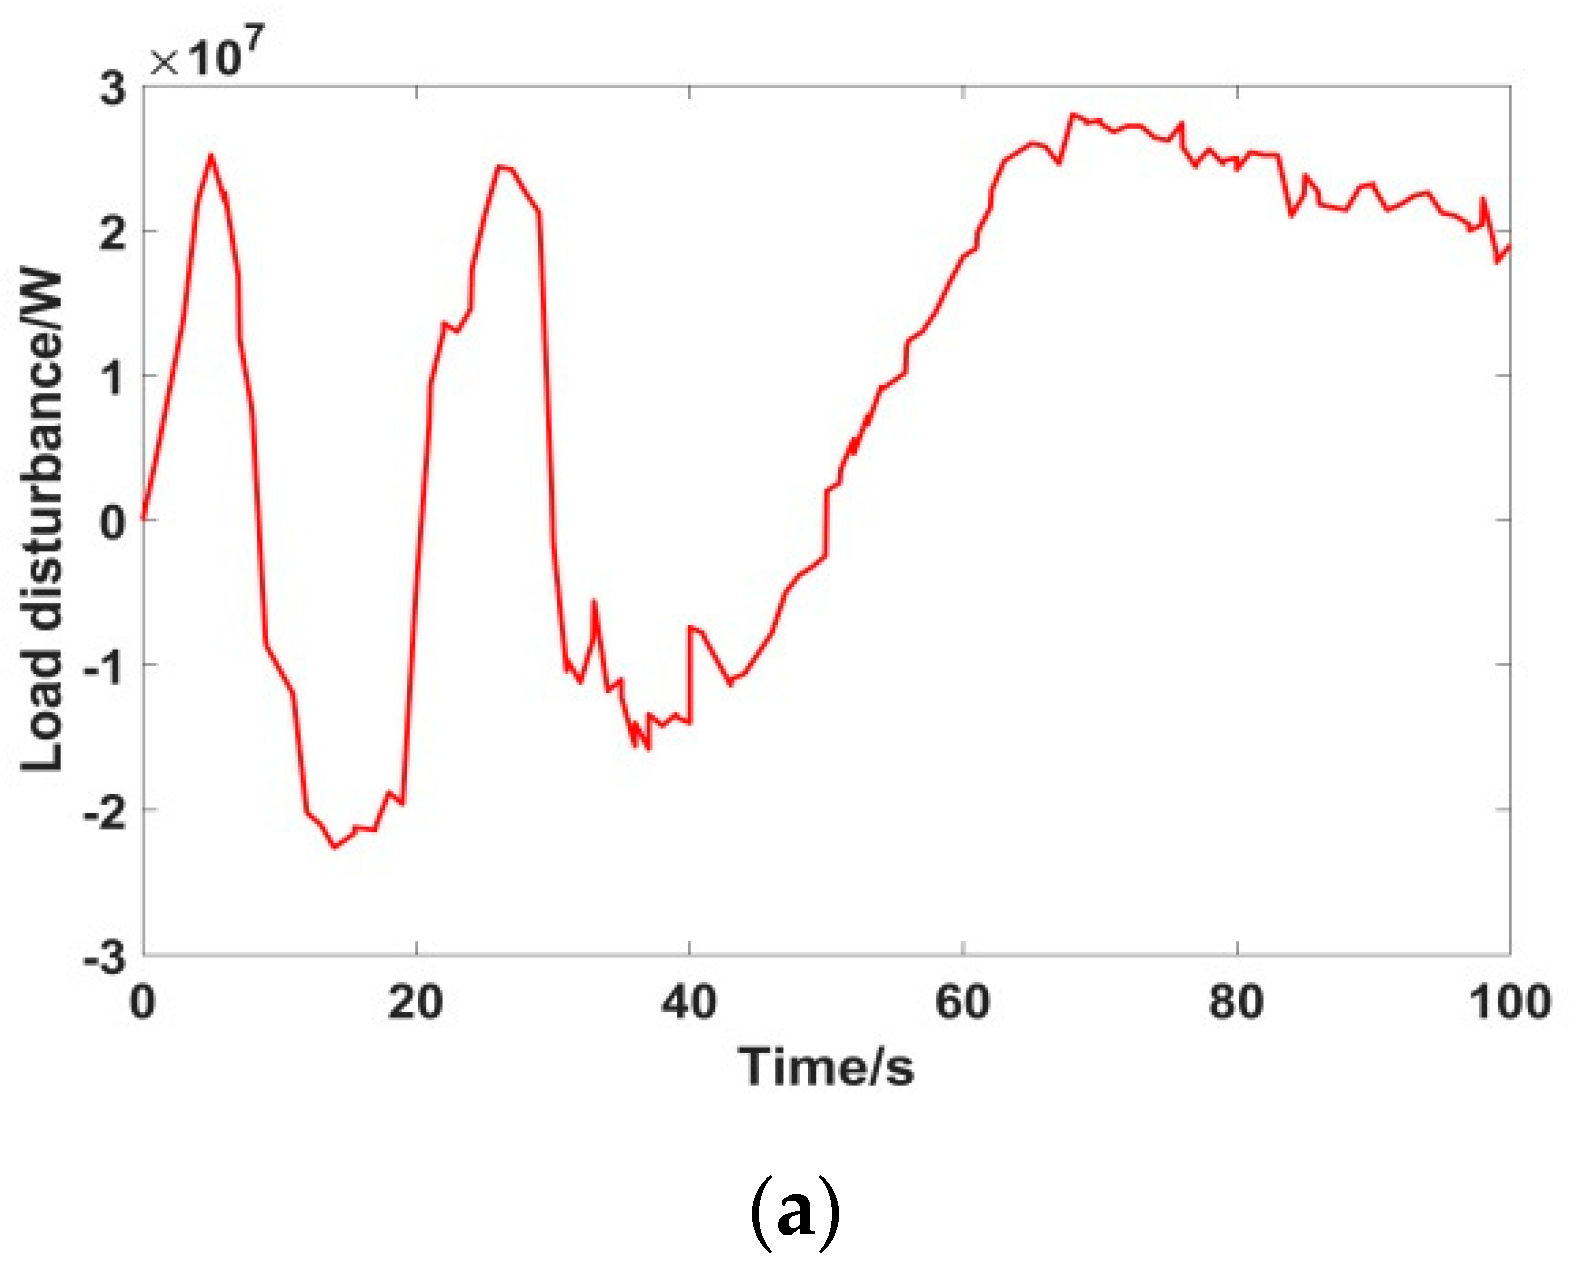
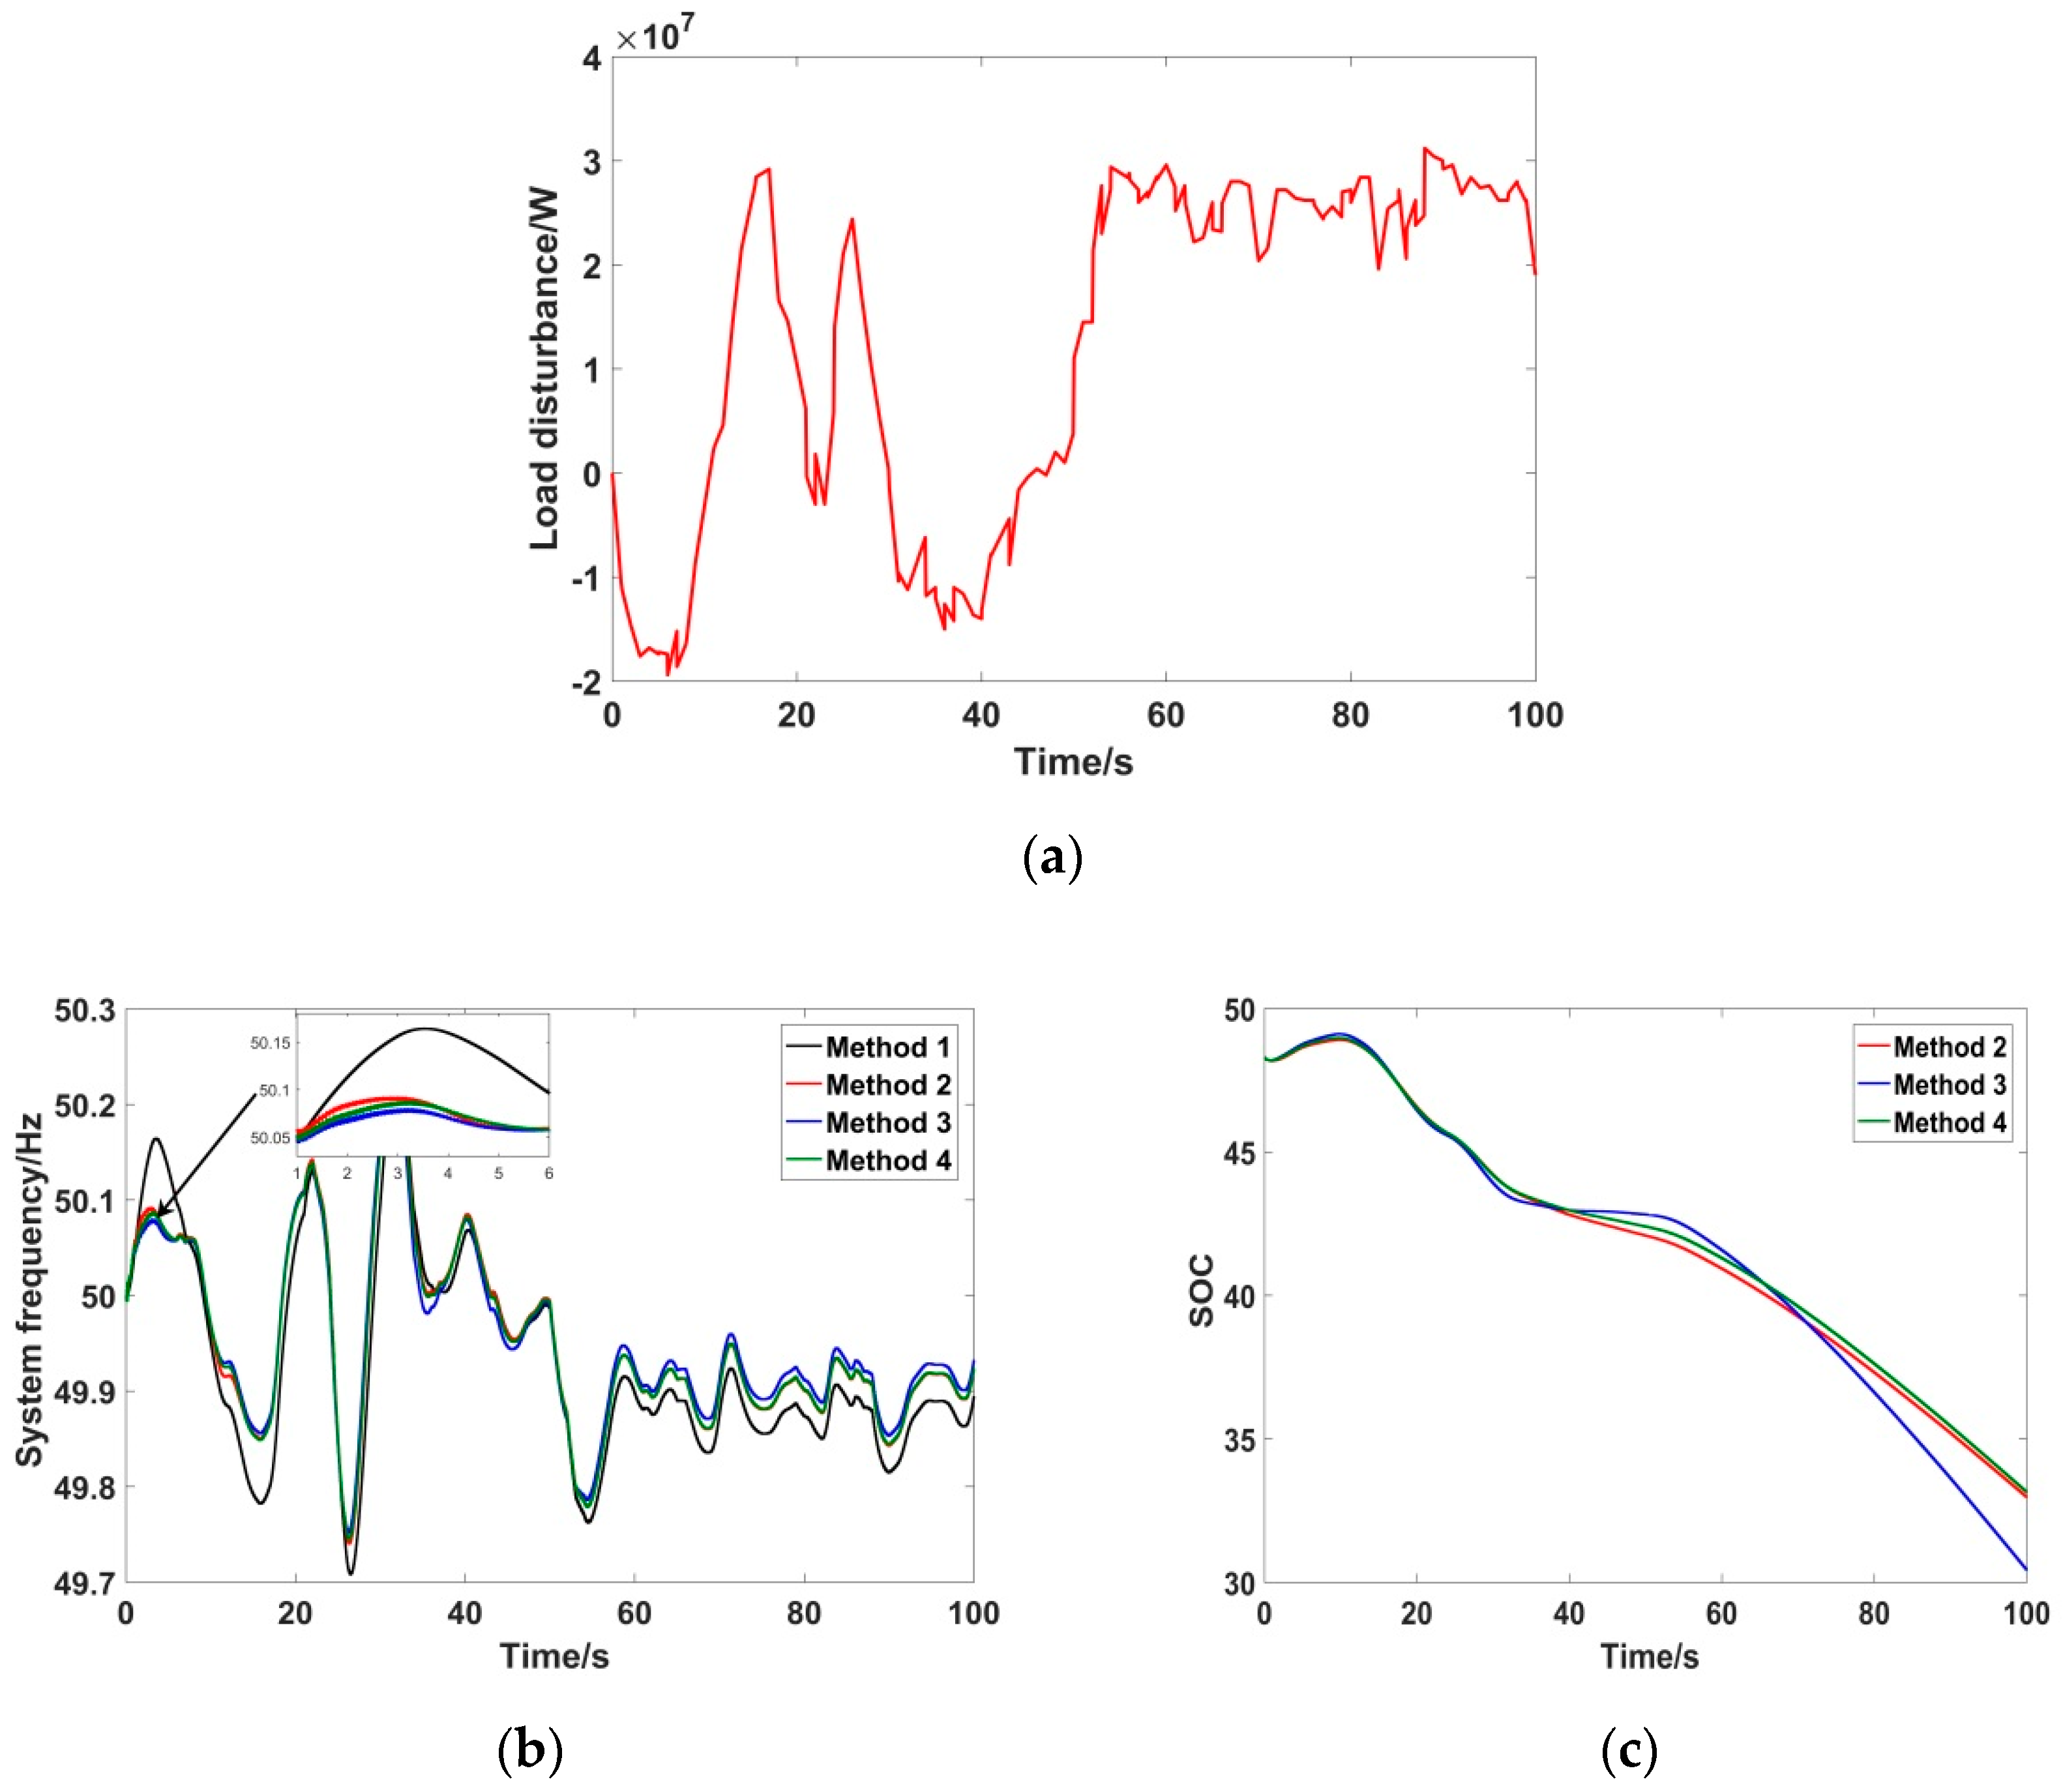
In order to verify the proposed method in continuous load disturbance condition, the continuous load disturbance was added to the model for simulation analysis. The load disturbance curve is shown in
Figure 17. The system frequencies under four control strategies are shown in
Figure 18.
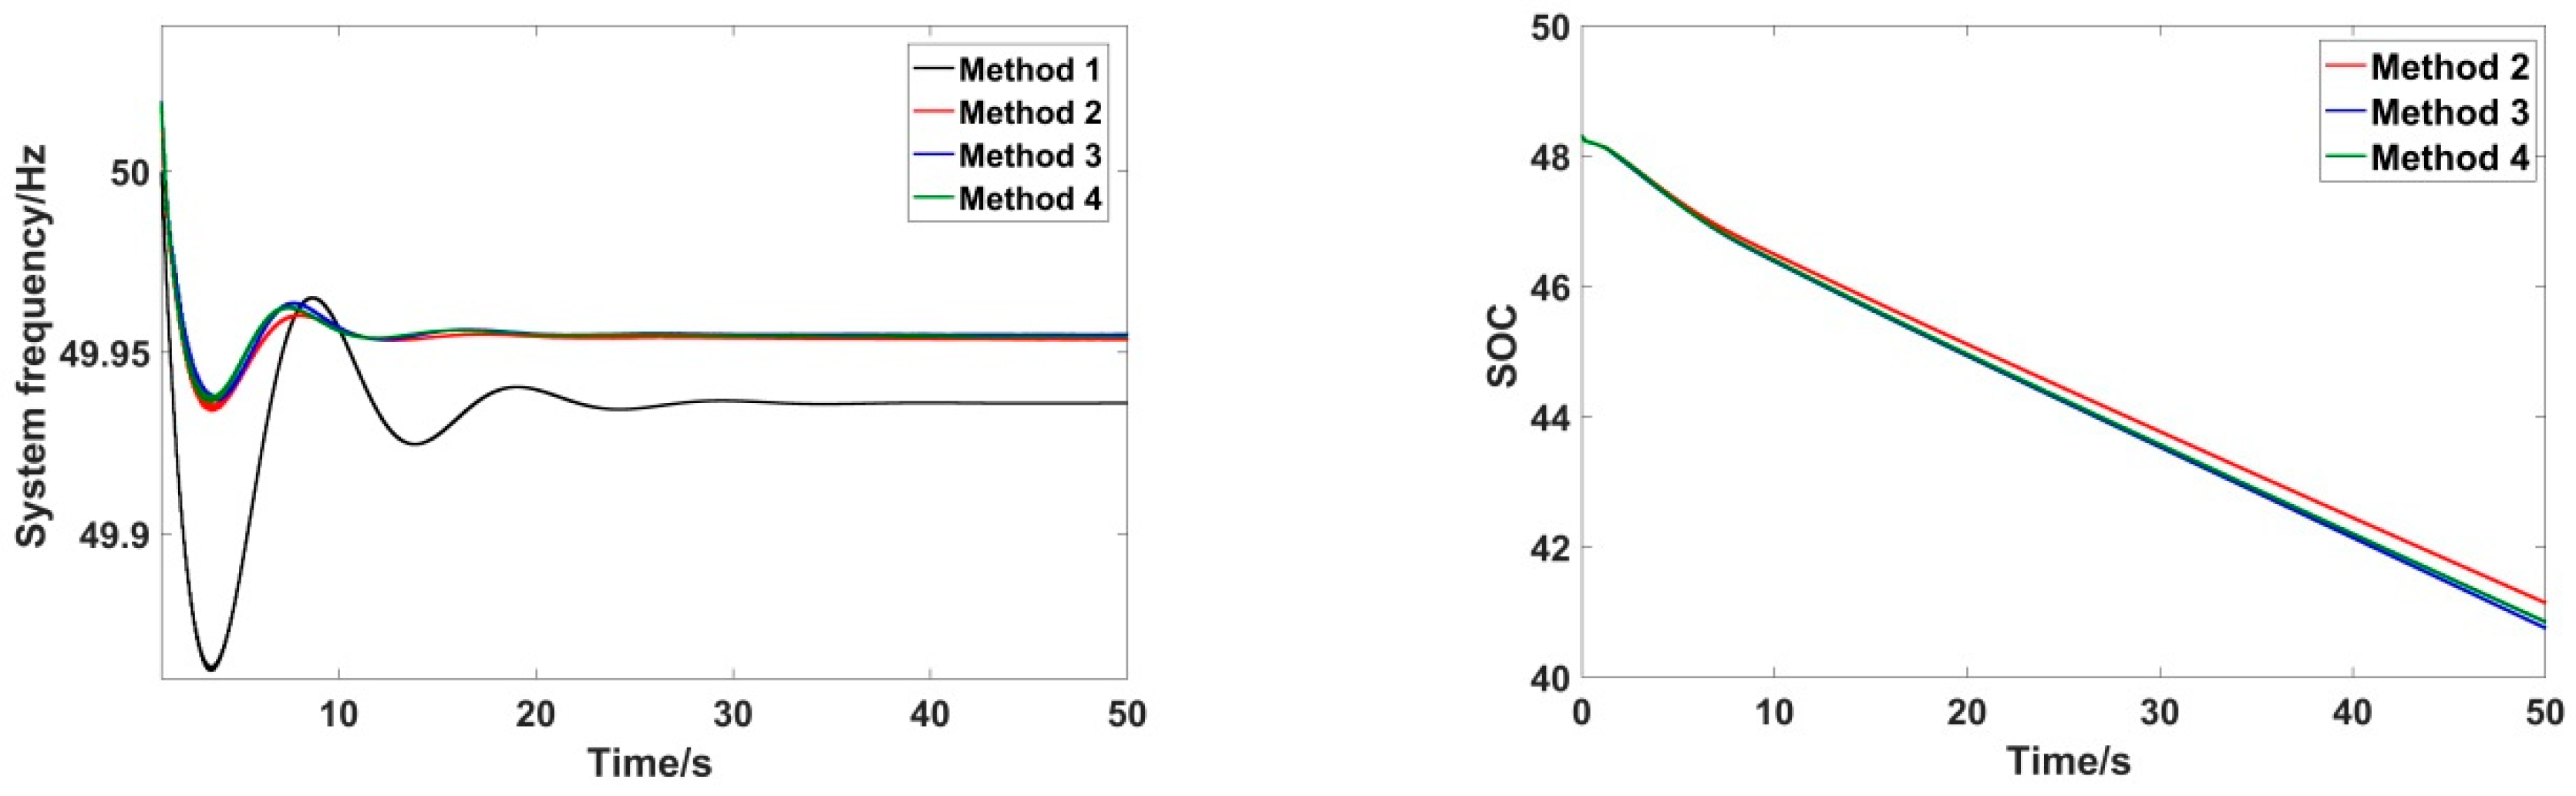
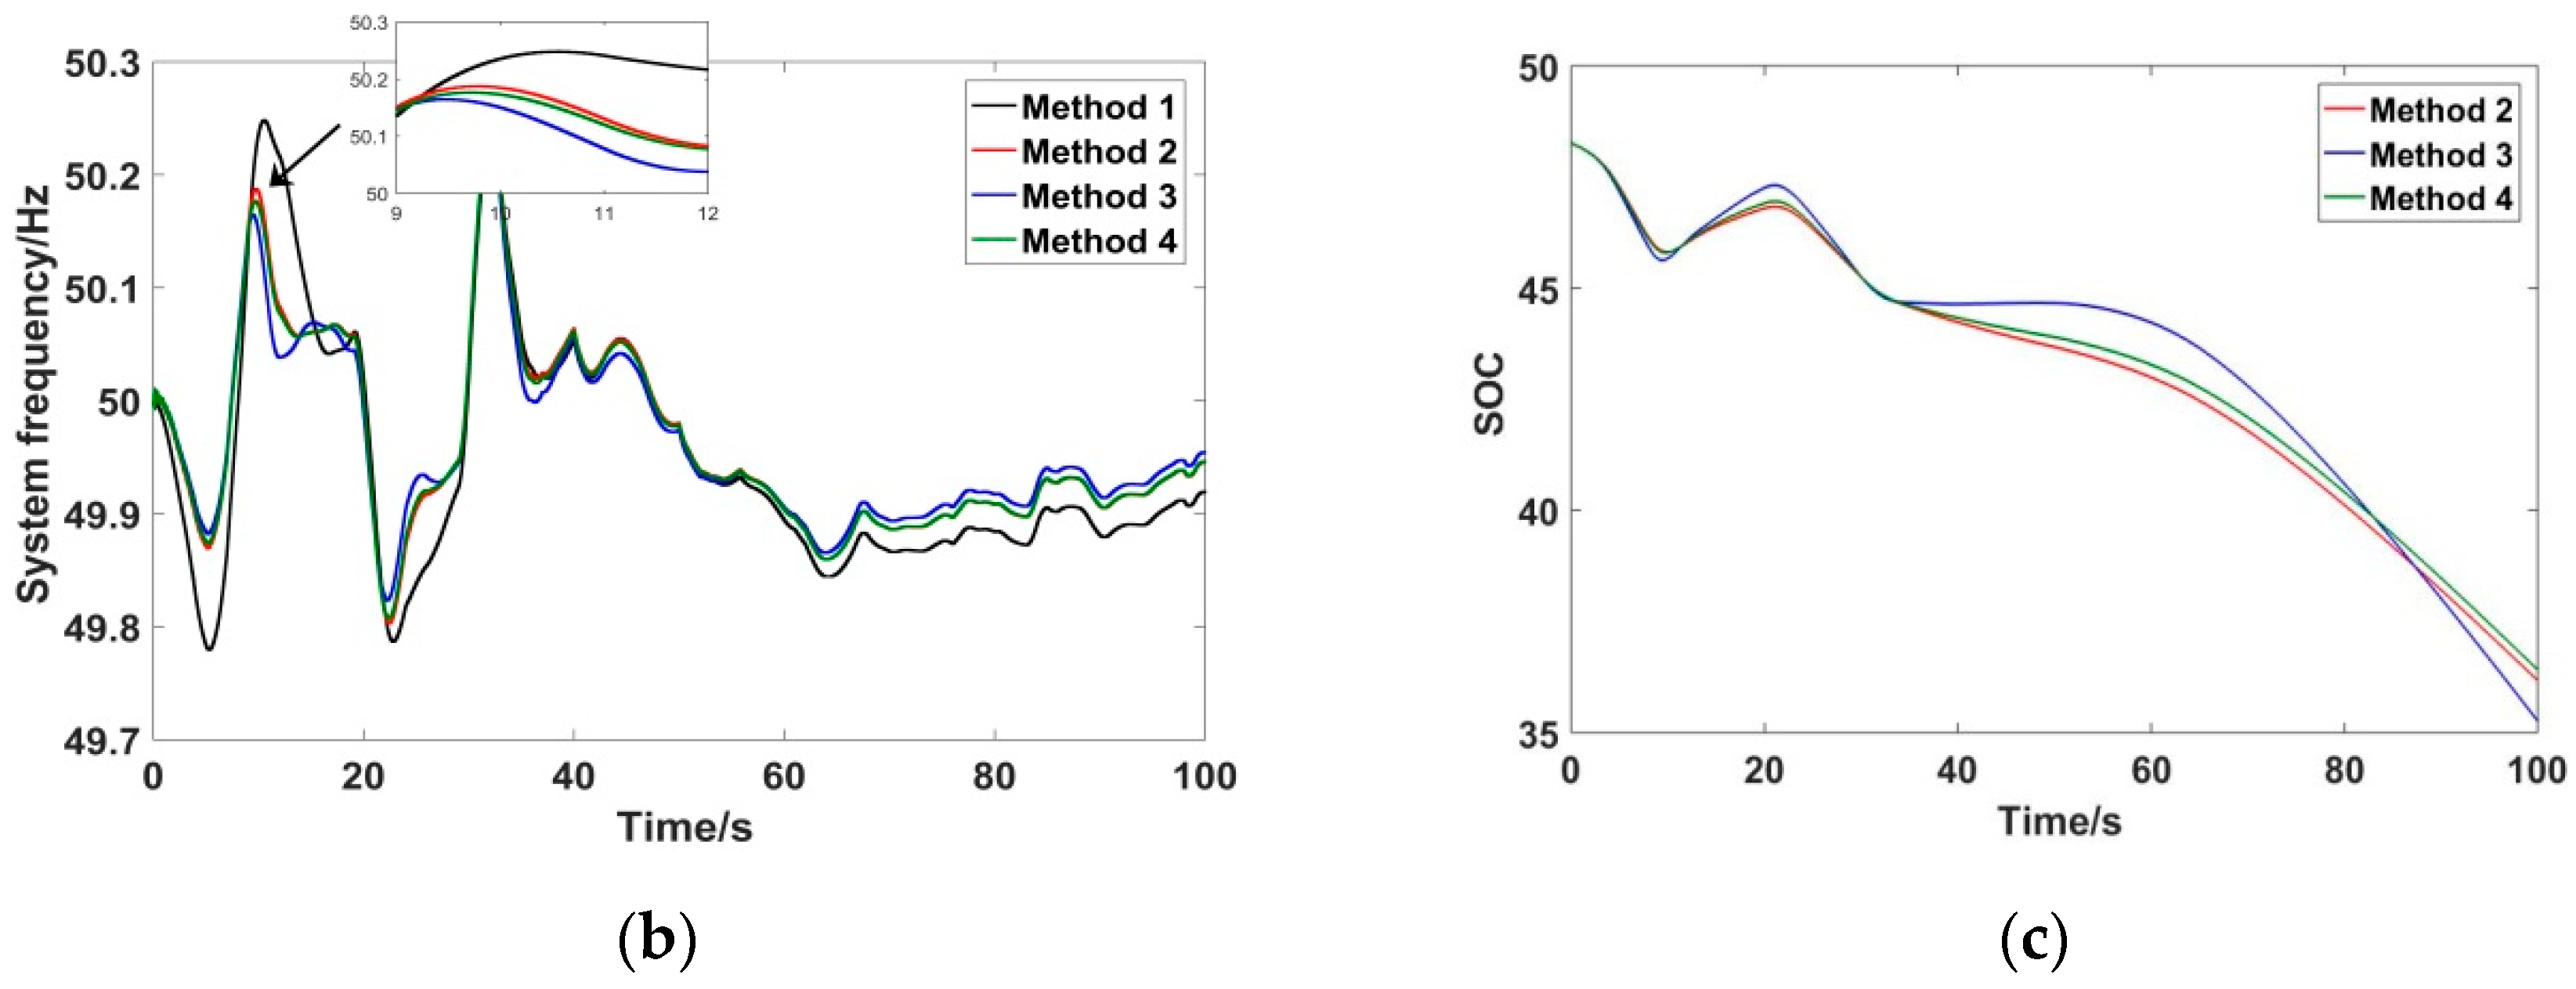
As shown in
Figure 18, after adding ESS, the system frequency deviation decreased compared to Method 1 (without ESS). The frequency deviation of Method 3 was the smallest. The frequency deviation of Method 4 was smaller than that of Method 2. The reason was that the virtual negative inertia control used in Method 3 and Method 4 could reduce the frequency deviation.
The SOC curves of the three methods using ESS are shown in
Figure 19. It could be seen that the final SOCs of Method 2, Method 3, and Method 4 were 0.363, 0.350, and 0.363, respectively. Method 3 had the worst SOC performance. Method 2 and Method 4 had the same final SOC, which was better than Method 3. Therefore, Method 4 was better than other methods under continuous load disturbance condition, considering both frequency regulation and maintenance of SOC.
To sum up, the control strategy proposed in this paper (Method 4) could achieve good frequency regulation performance. At the same time, the control strategy could keep the SOC in a reasonable range, which was of great significance to improve the cycle life of ESS and reduce the operation cost.
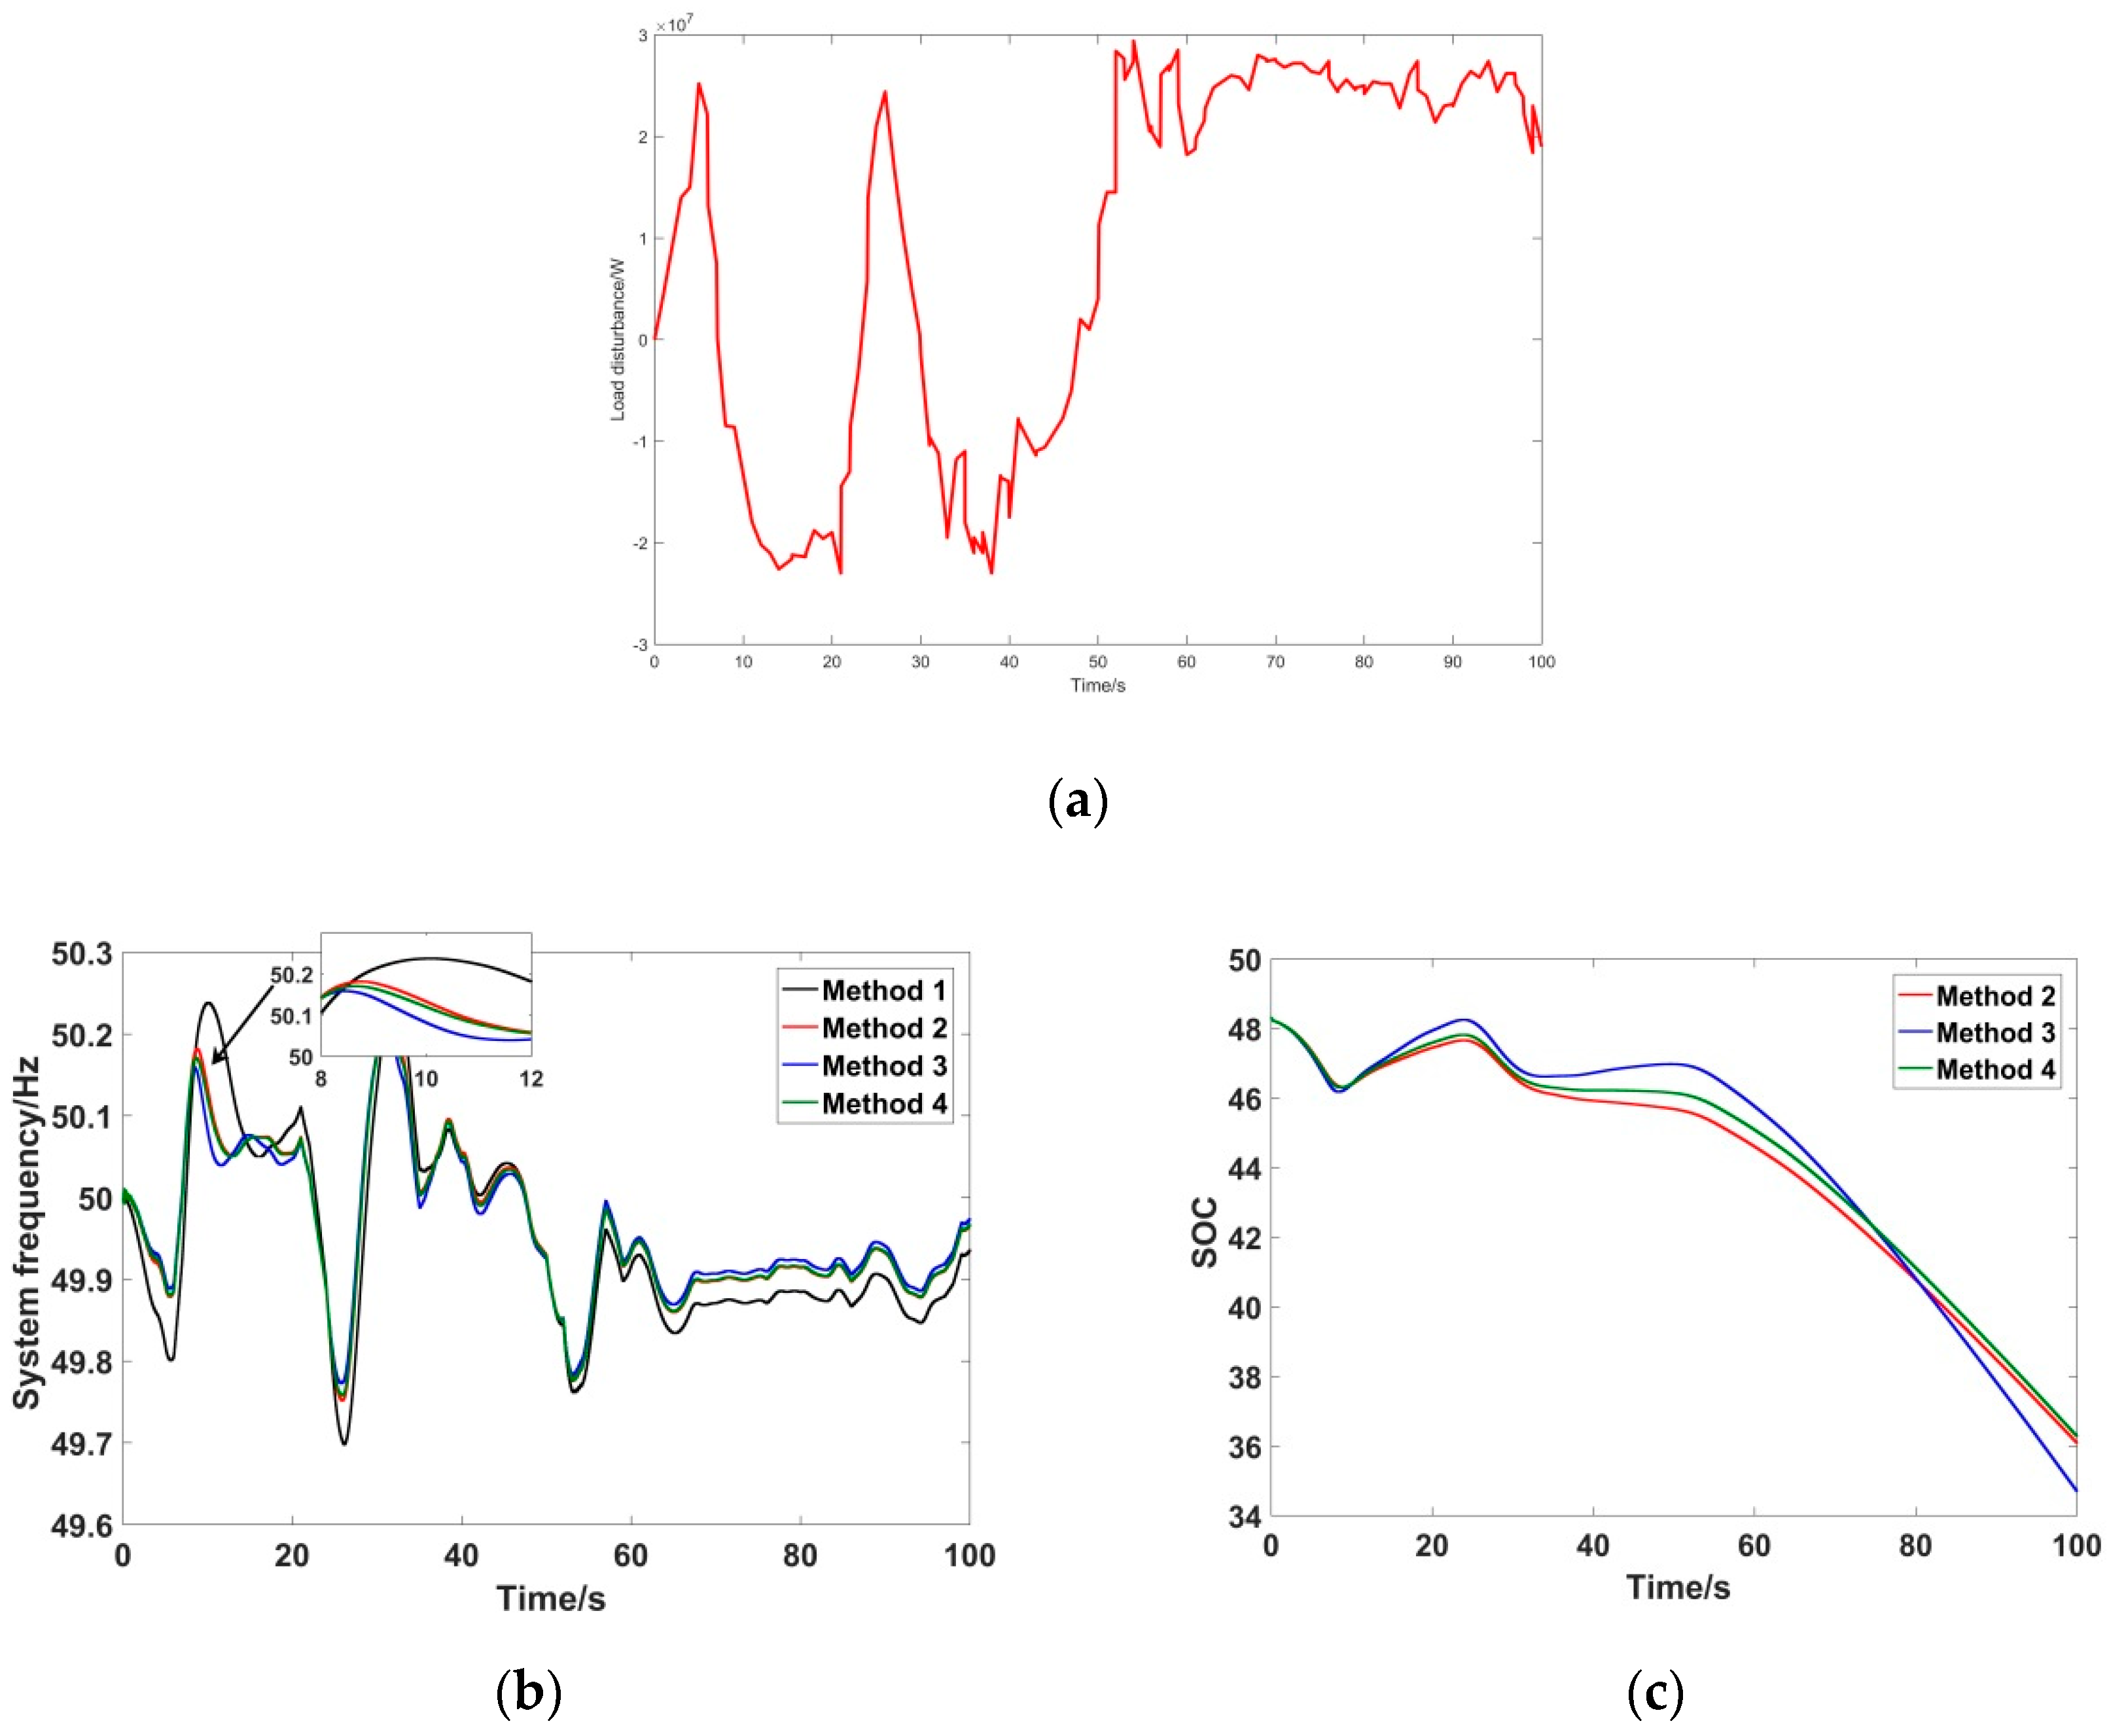
In order to prove the generality of the control strategy proposed in this paper, different continuous load disturbances were simulated. The continuous load disturbances were denoted as Load A, Load B, and Load C, respectively. The corresponding simulation results are shown in
Figure 20,
Figure 21 and
Figure 22.
The above simulation results of Load A, Load B, and Load C were similar to the results of
Figure 17. Therefore, the effectiveness of the control strategy proposed in this paper had generality with respect to continuous load disturbance.
6. Conclusions
This paper proposed a novel control strategy for battery energy storage to participate in the primary frequency regulation of the power system. Through simulation results, it could be concluded that:
- (1)
Different control strategies should be adopted under different frequency conditions. Usually, the virtual inertial control can prevent frequency deterioration, and the virtual negative inertia control can accelerate frequency recovery.
- (2)
The SOC-based adaptive control method in this paper has a positive impact on the cycle life of the ESS while meeting the demand for frequency regulation.

 ,
, 


