Oxidation and Characterization of Low-Concentration Gas in a High-Temperature Reactor

Abstract
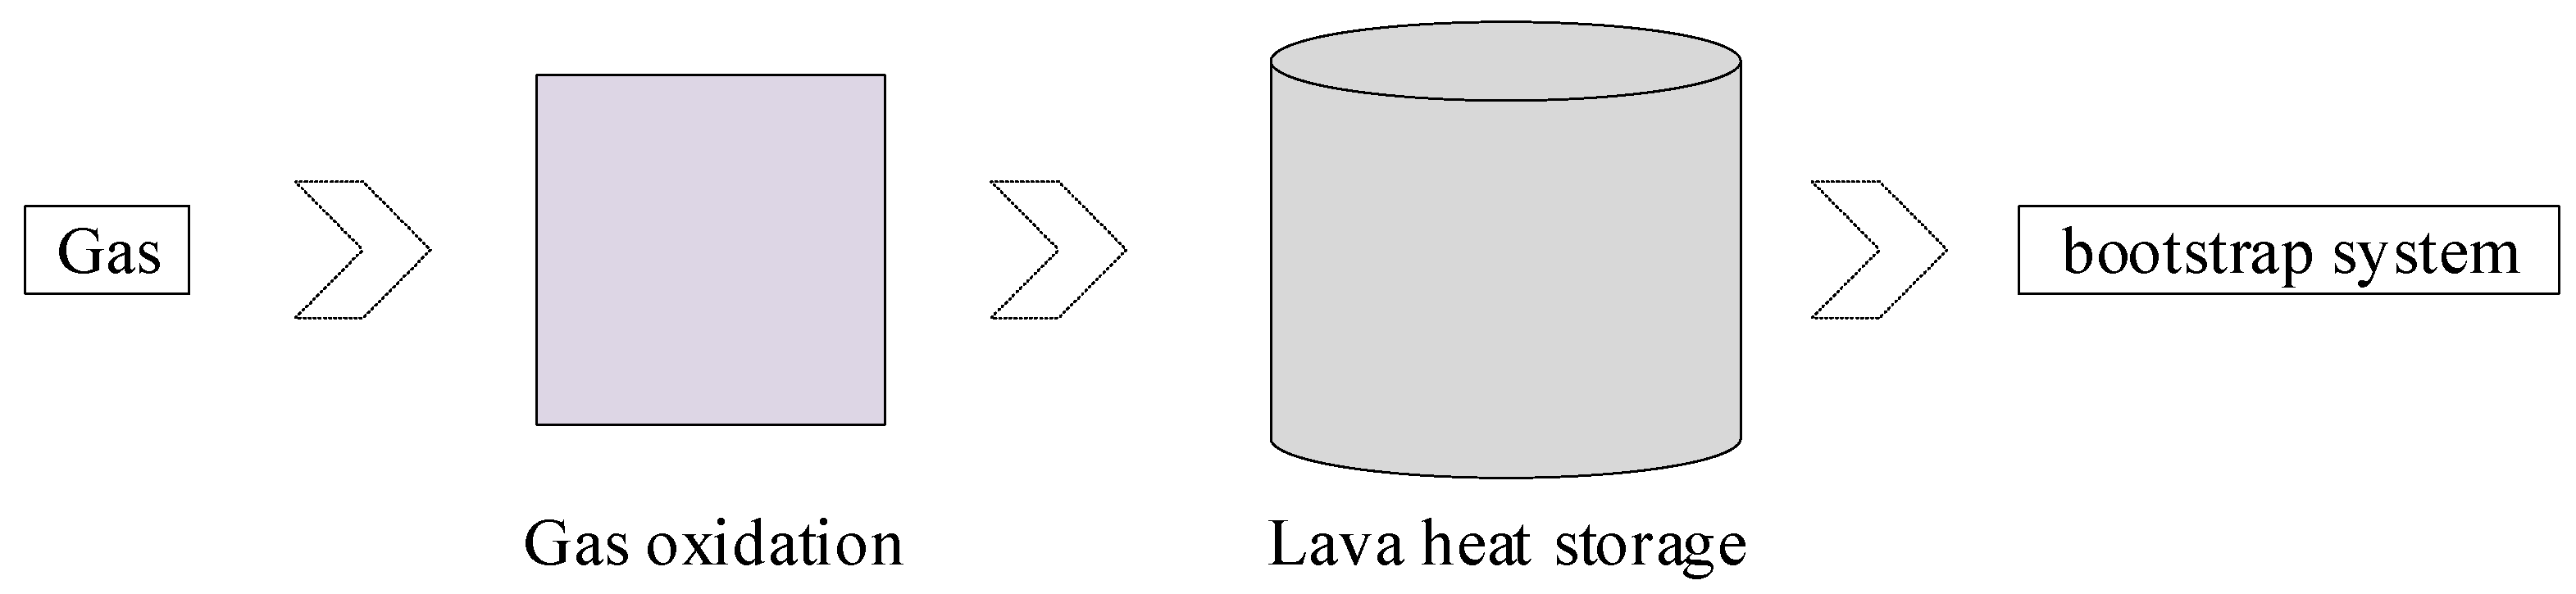
:1. Introduction
2. Theory and Experiment
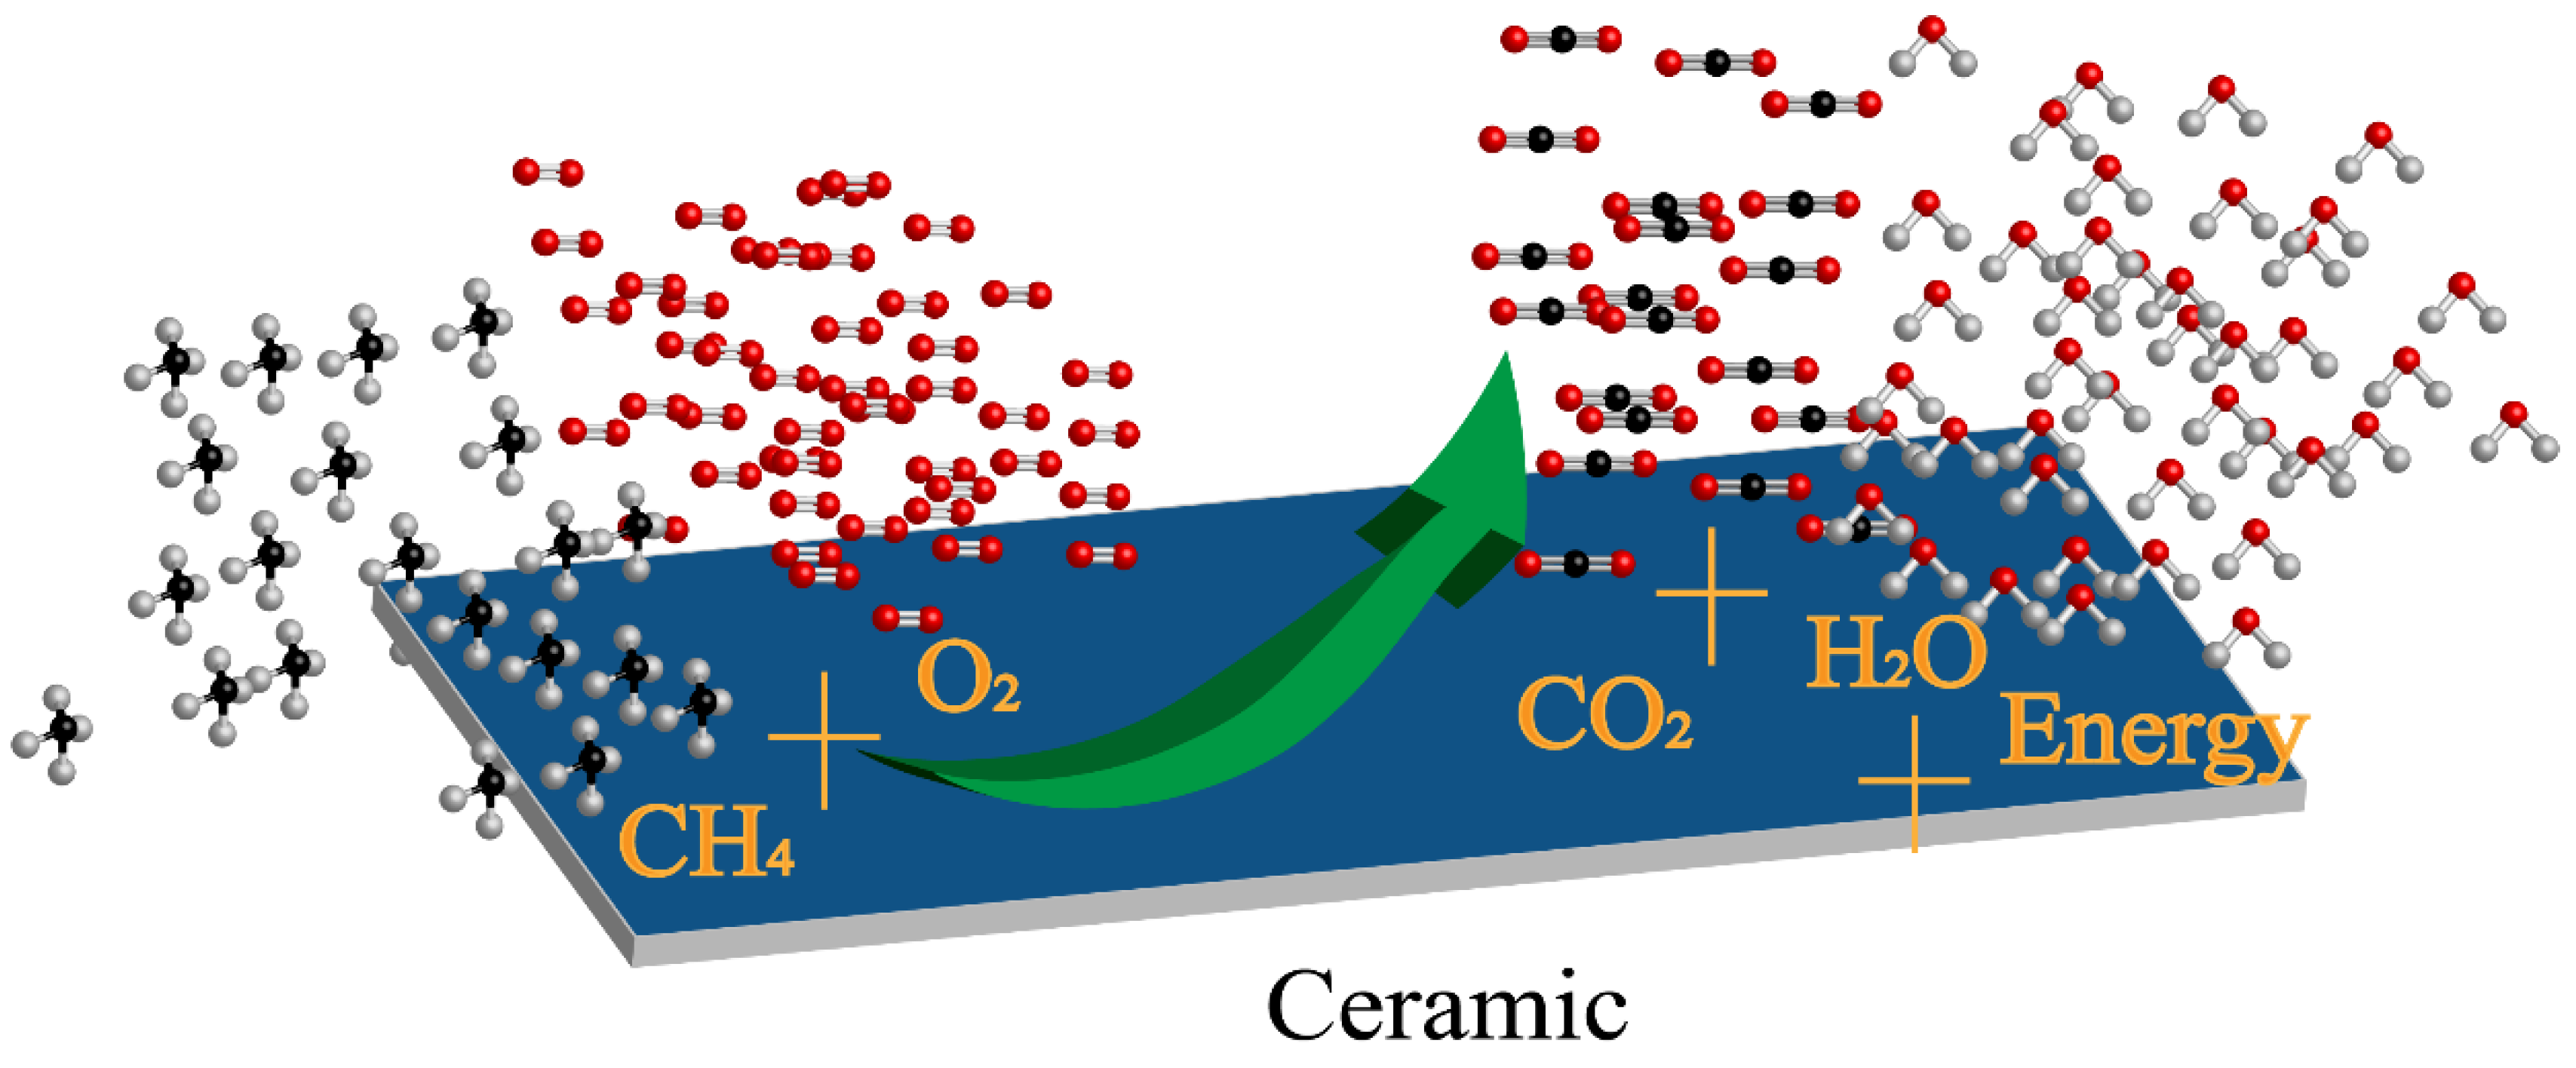
2.1. Gas Oxidation Equation
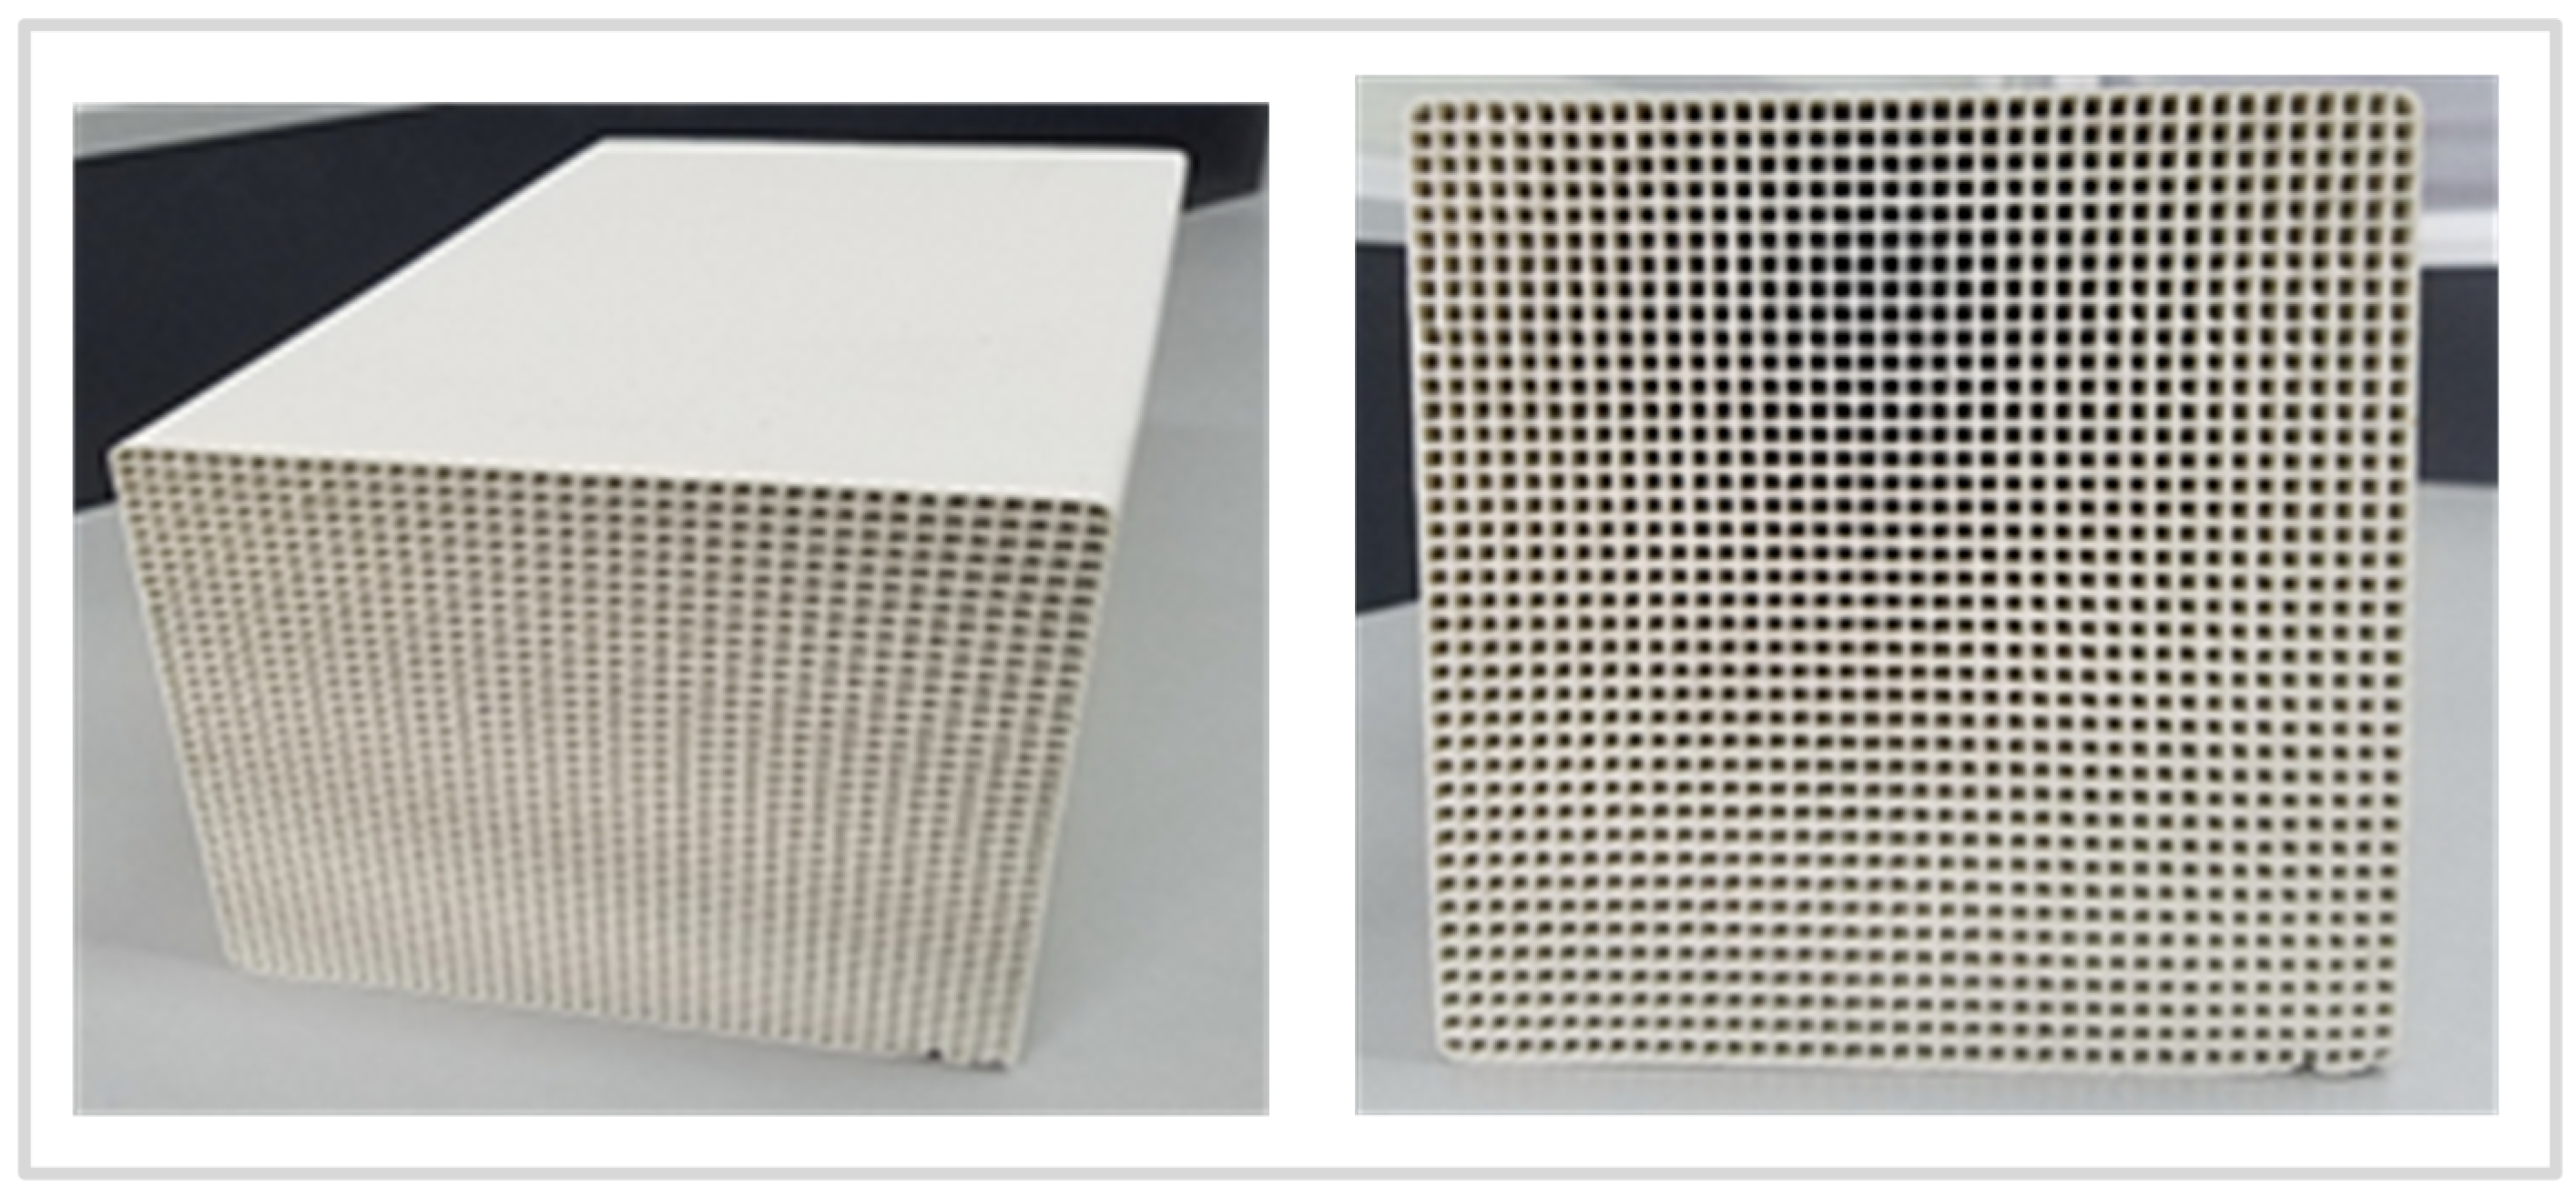
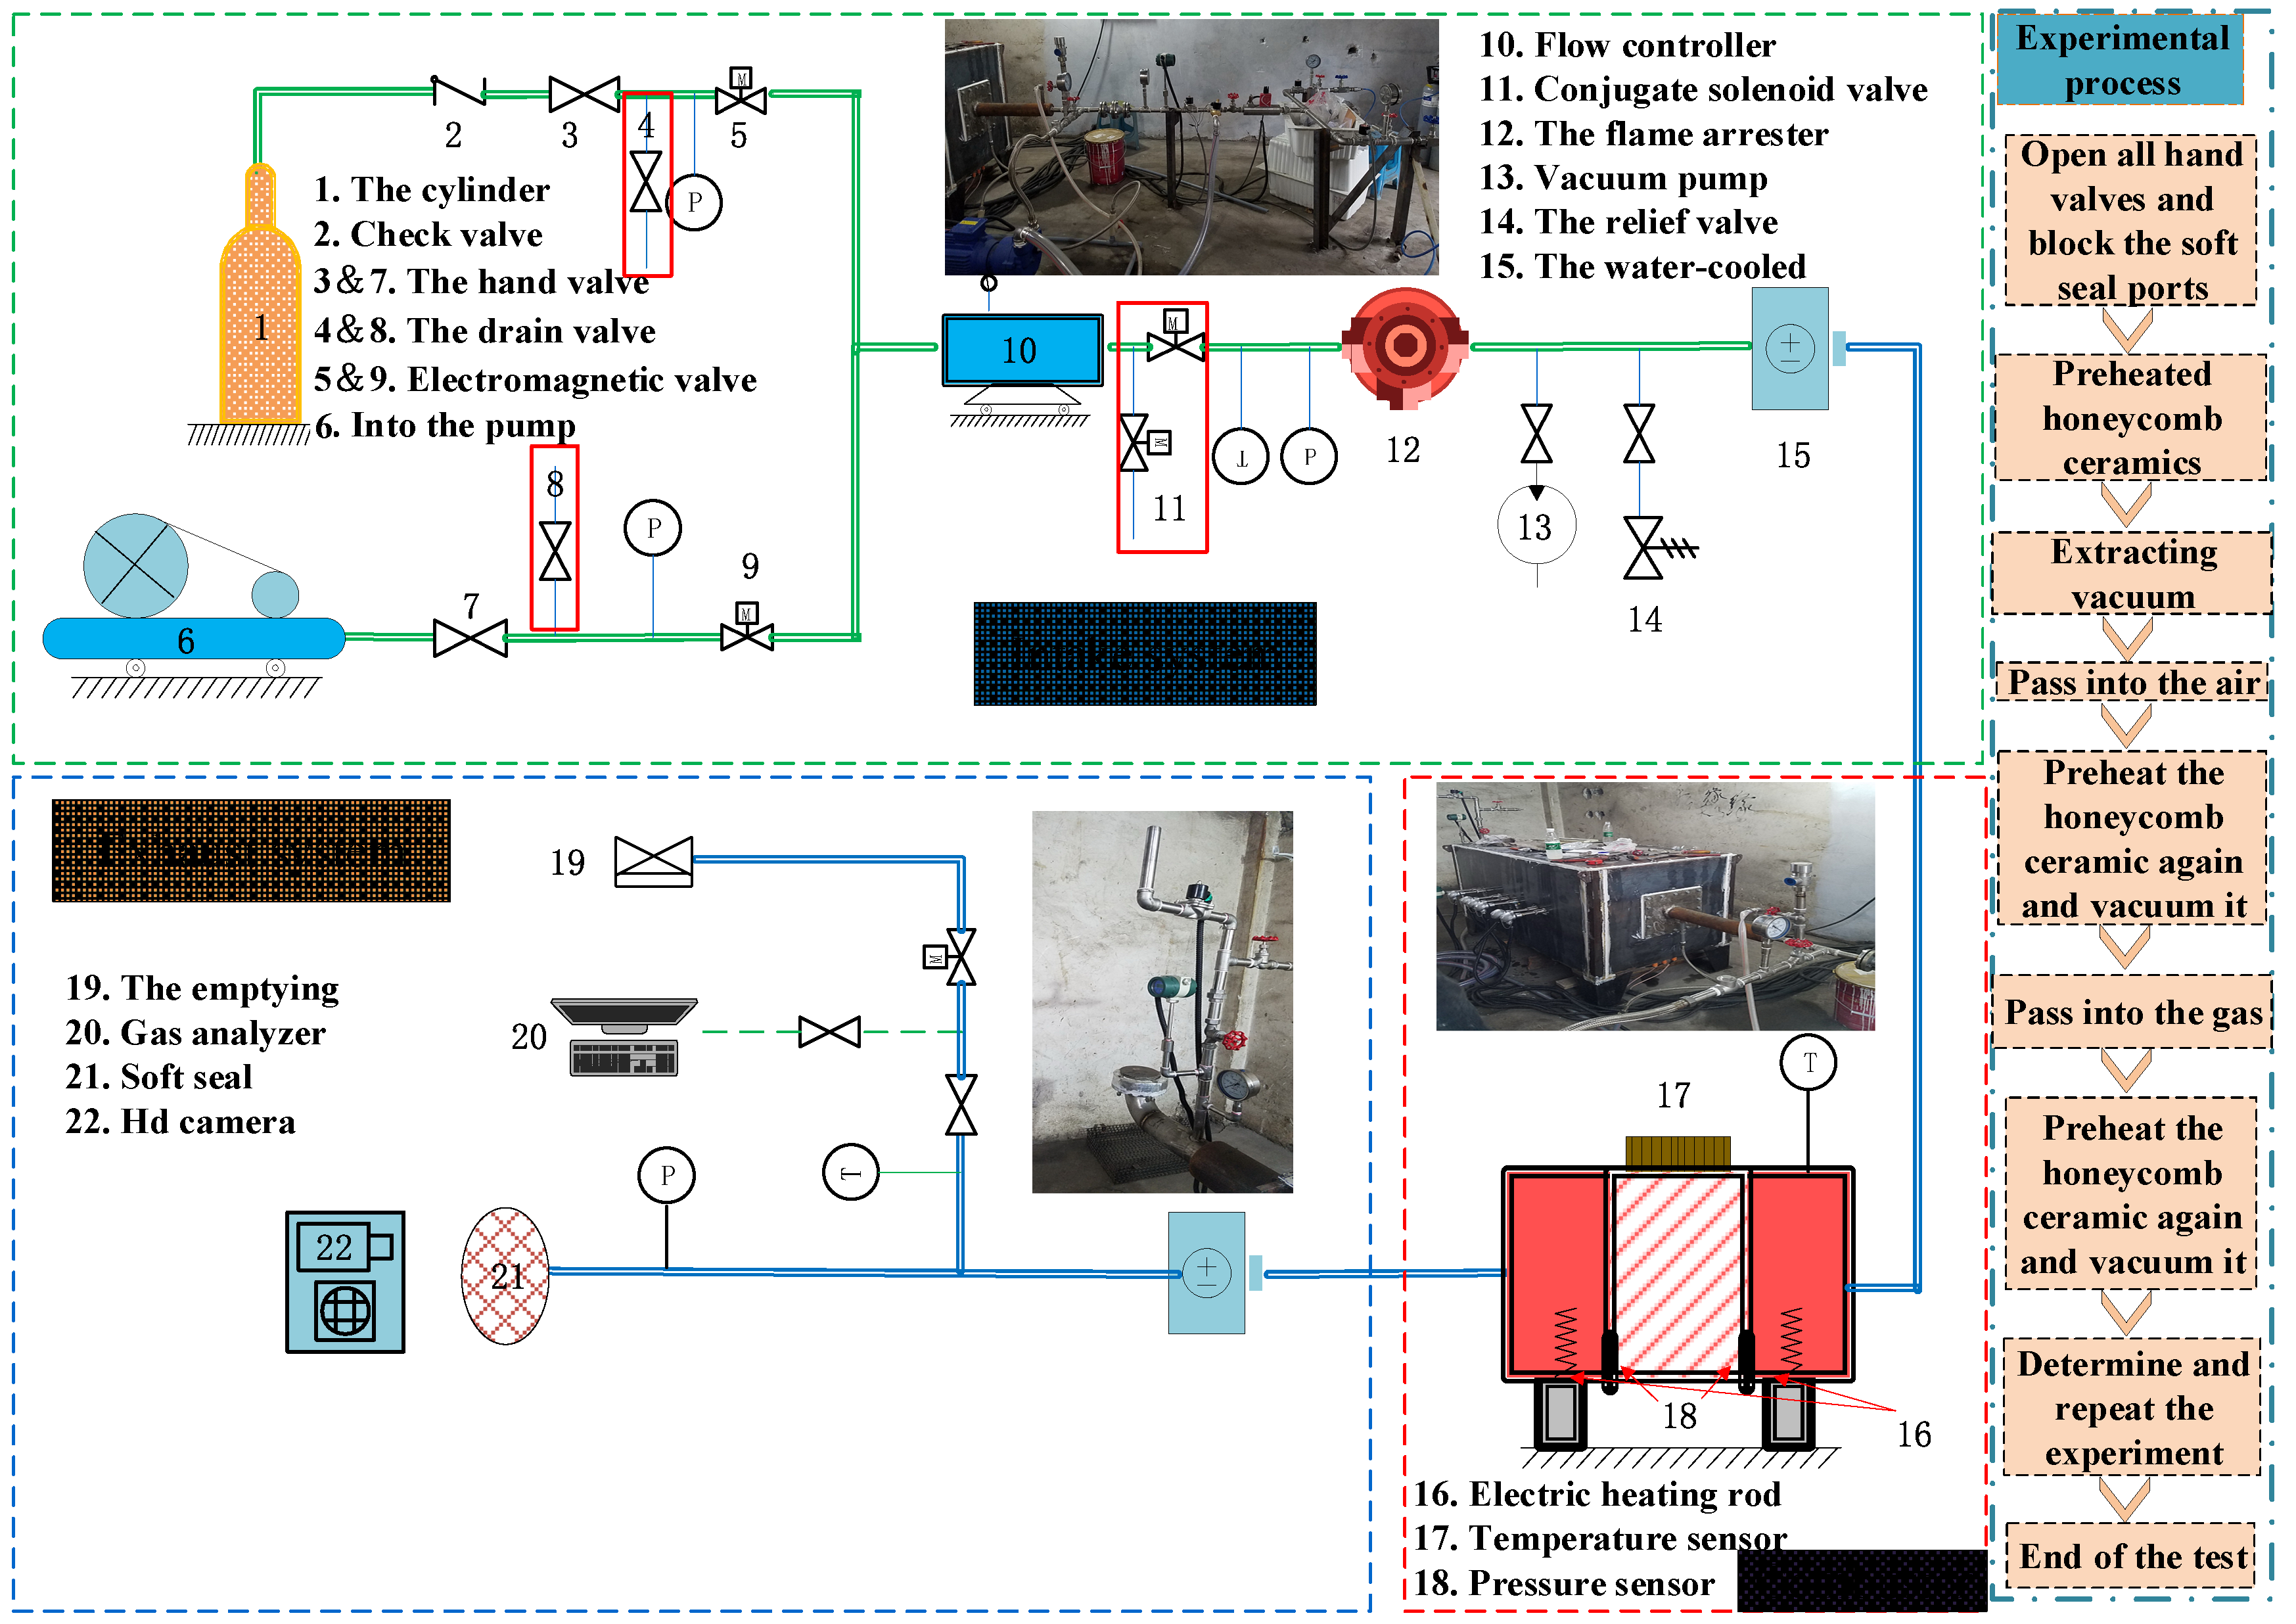
2.2. Equipment Optimization
2.3. Experimental Parameters
2.4. Explosion Criterion
2.5. Experimental Process
3. Results and Discussion
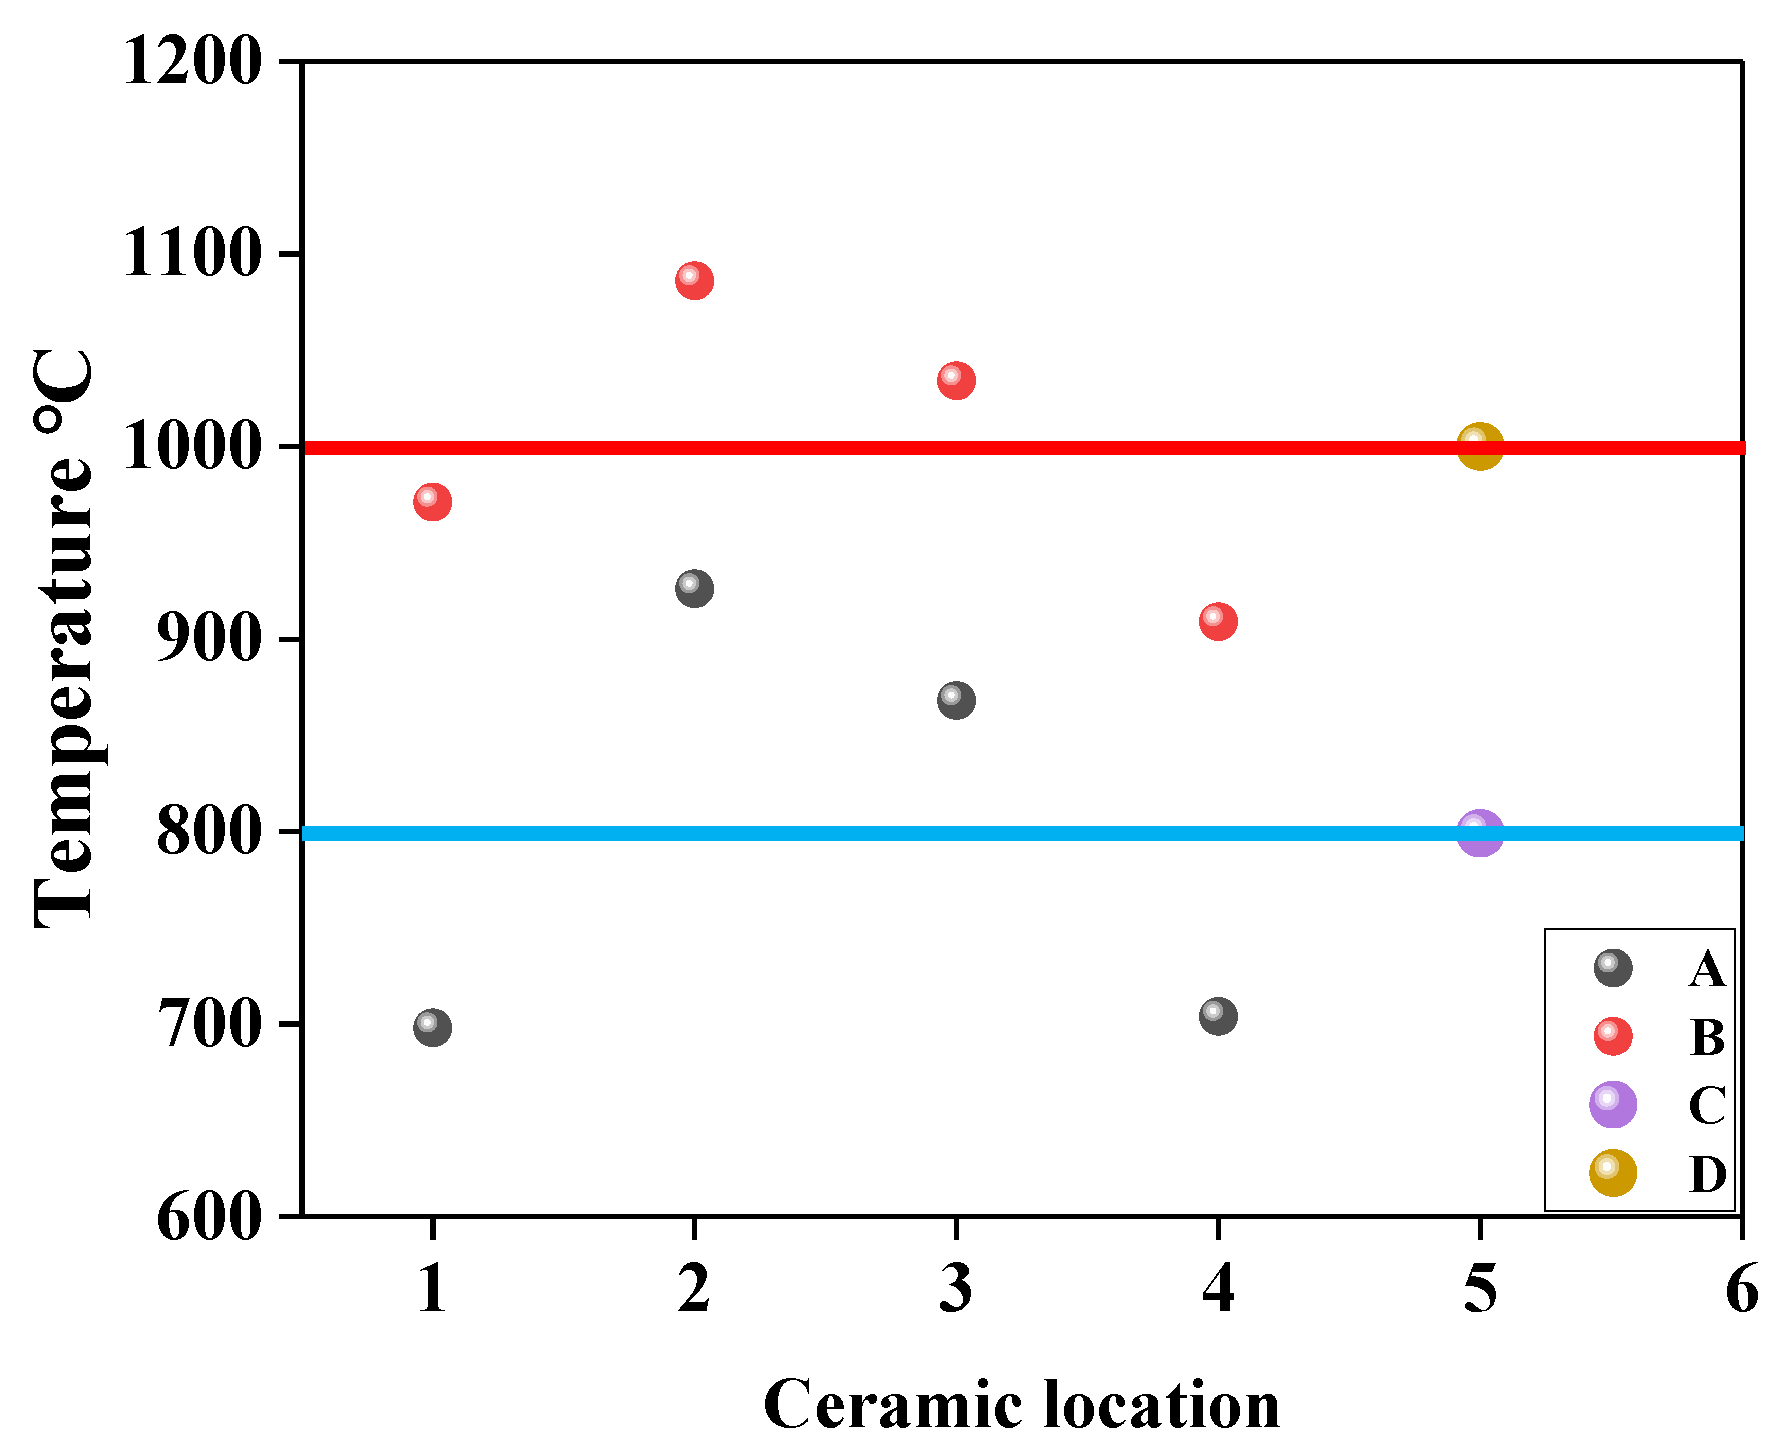
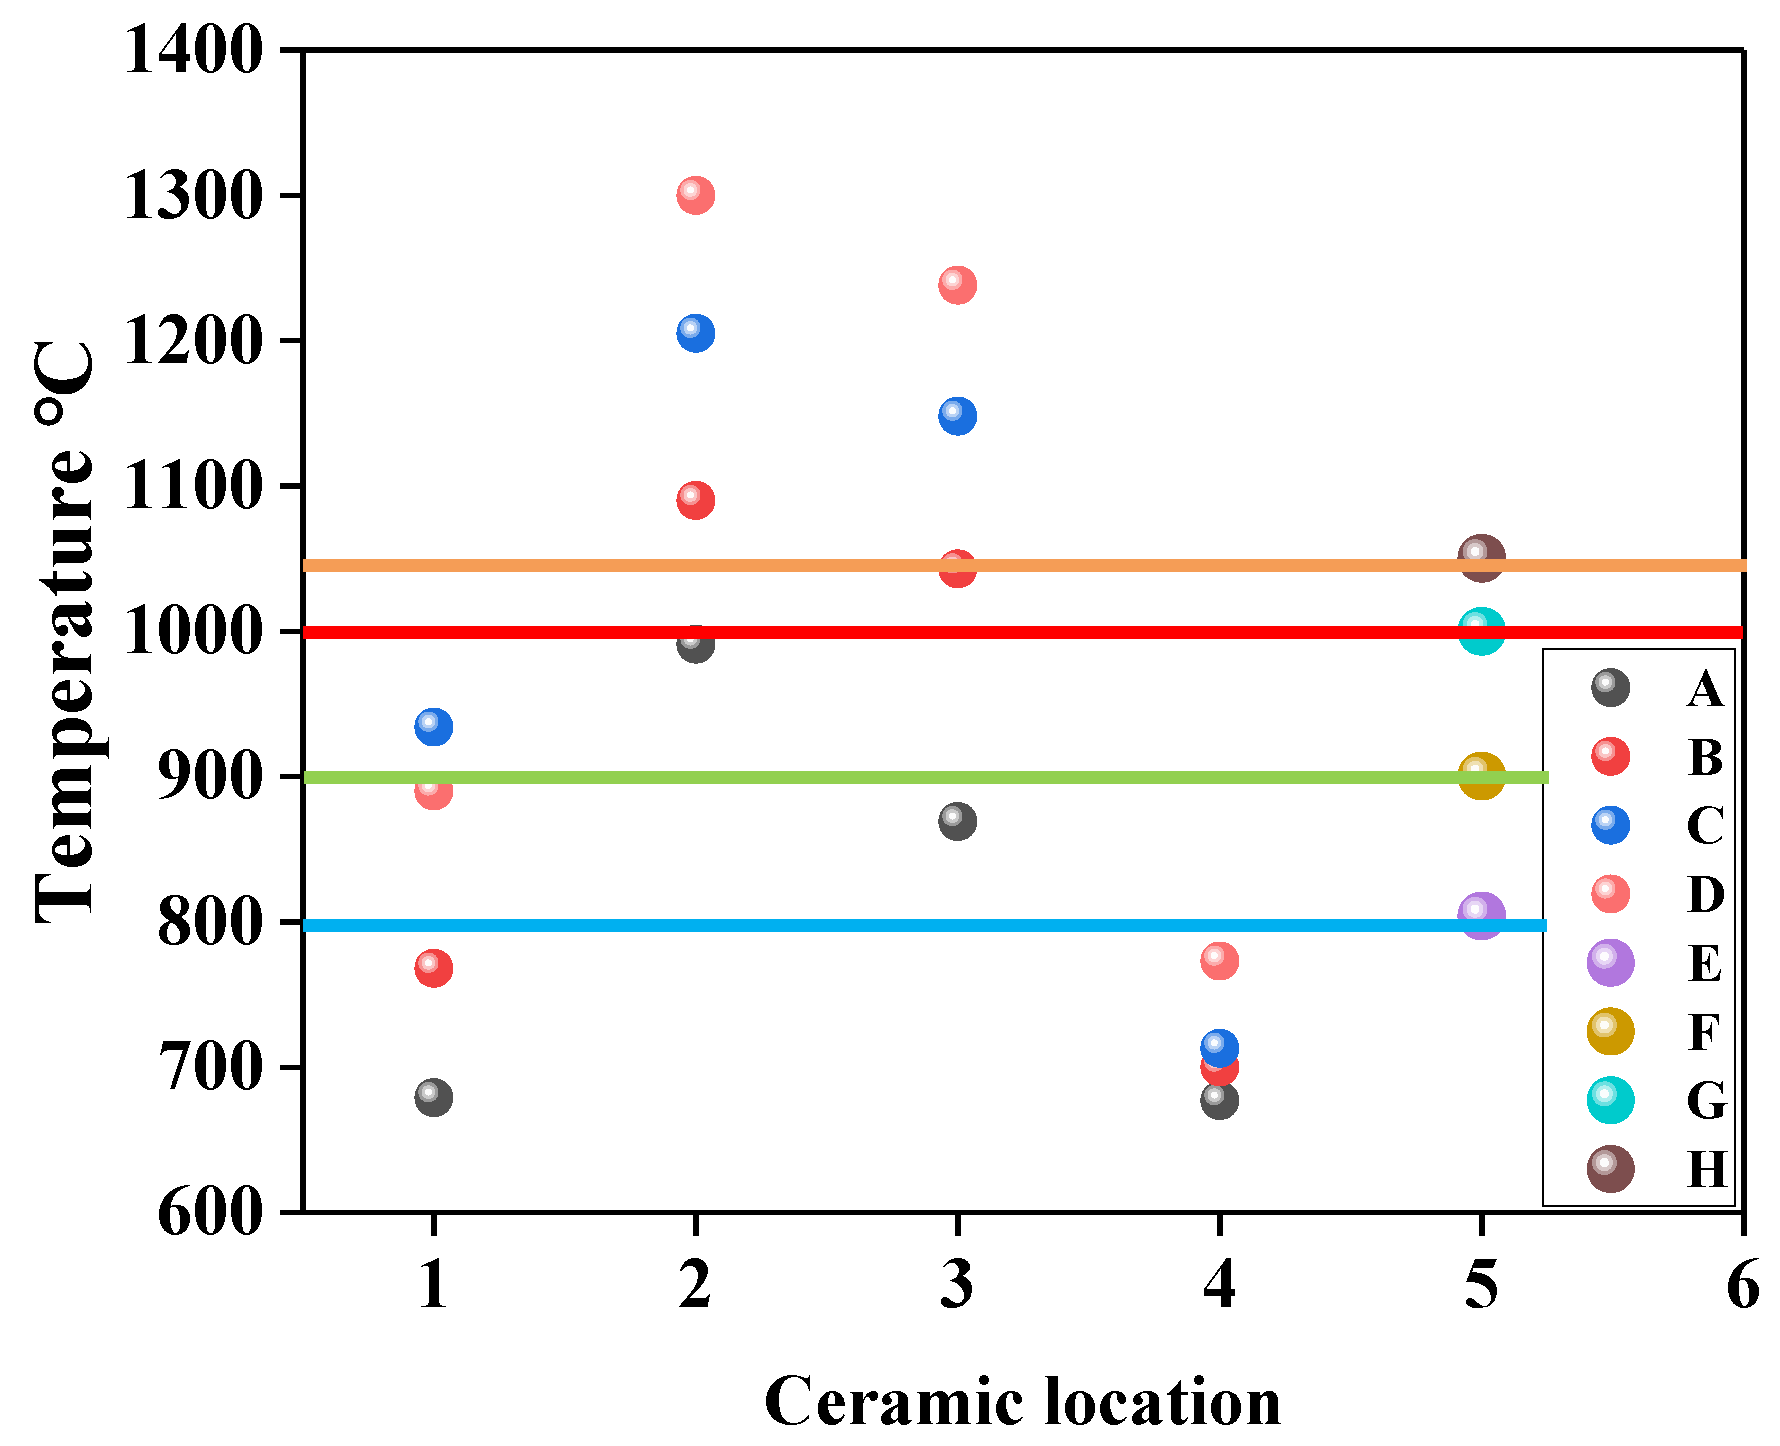
3.1. Discussion of Heating Capacity of Improved Equipment
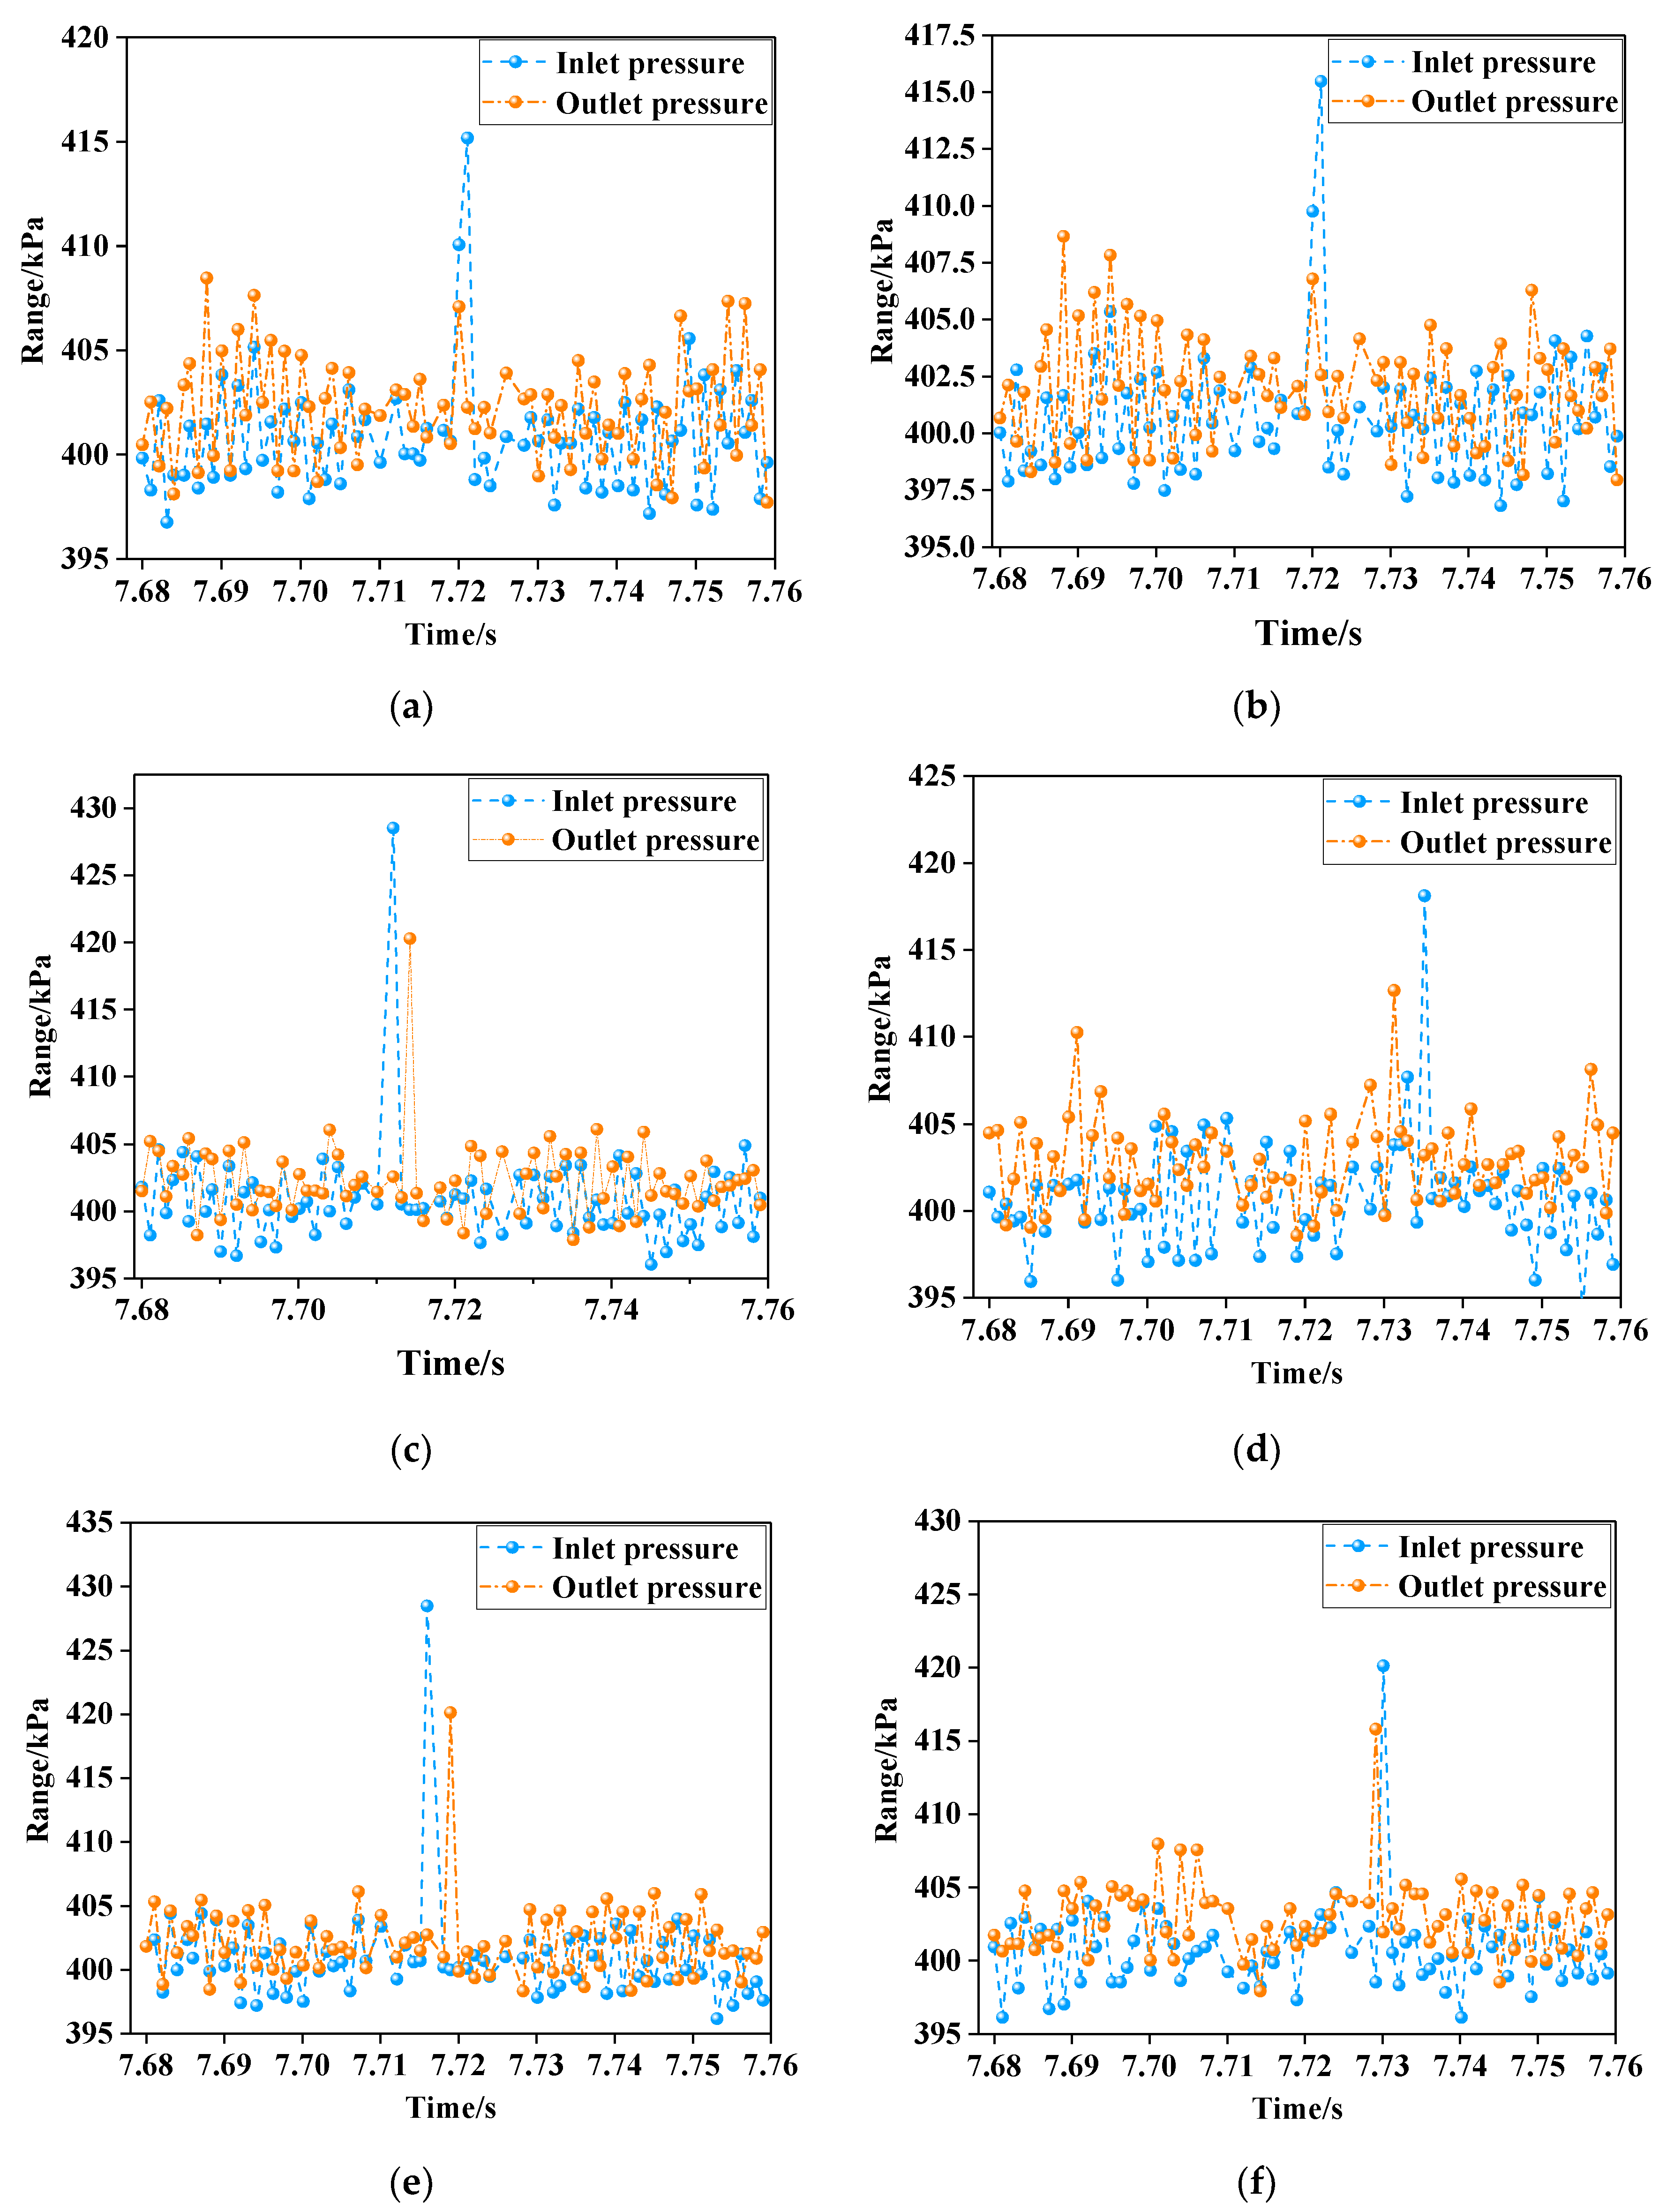
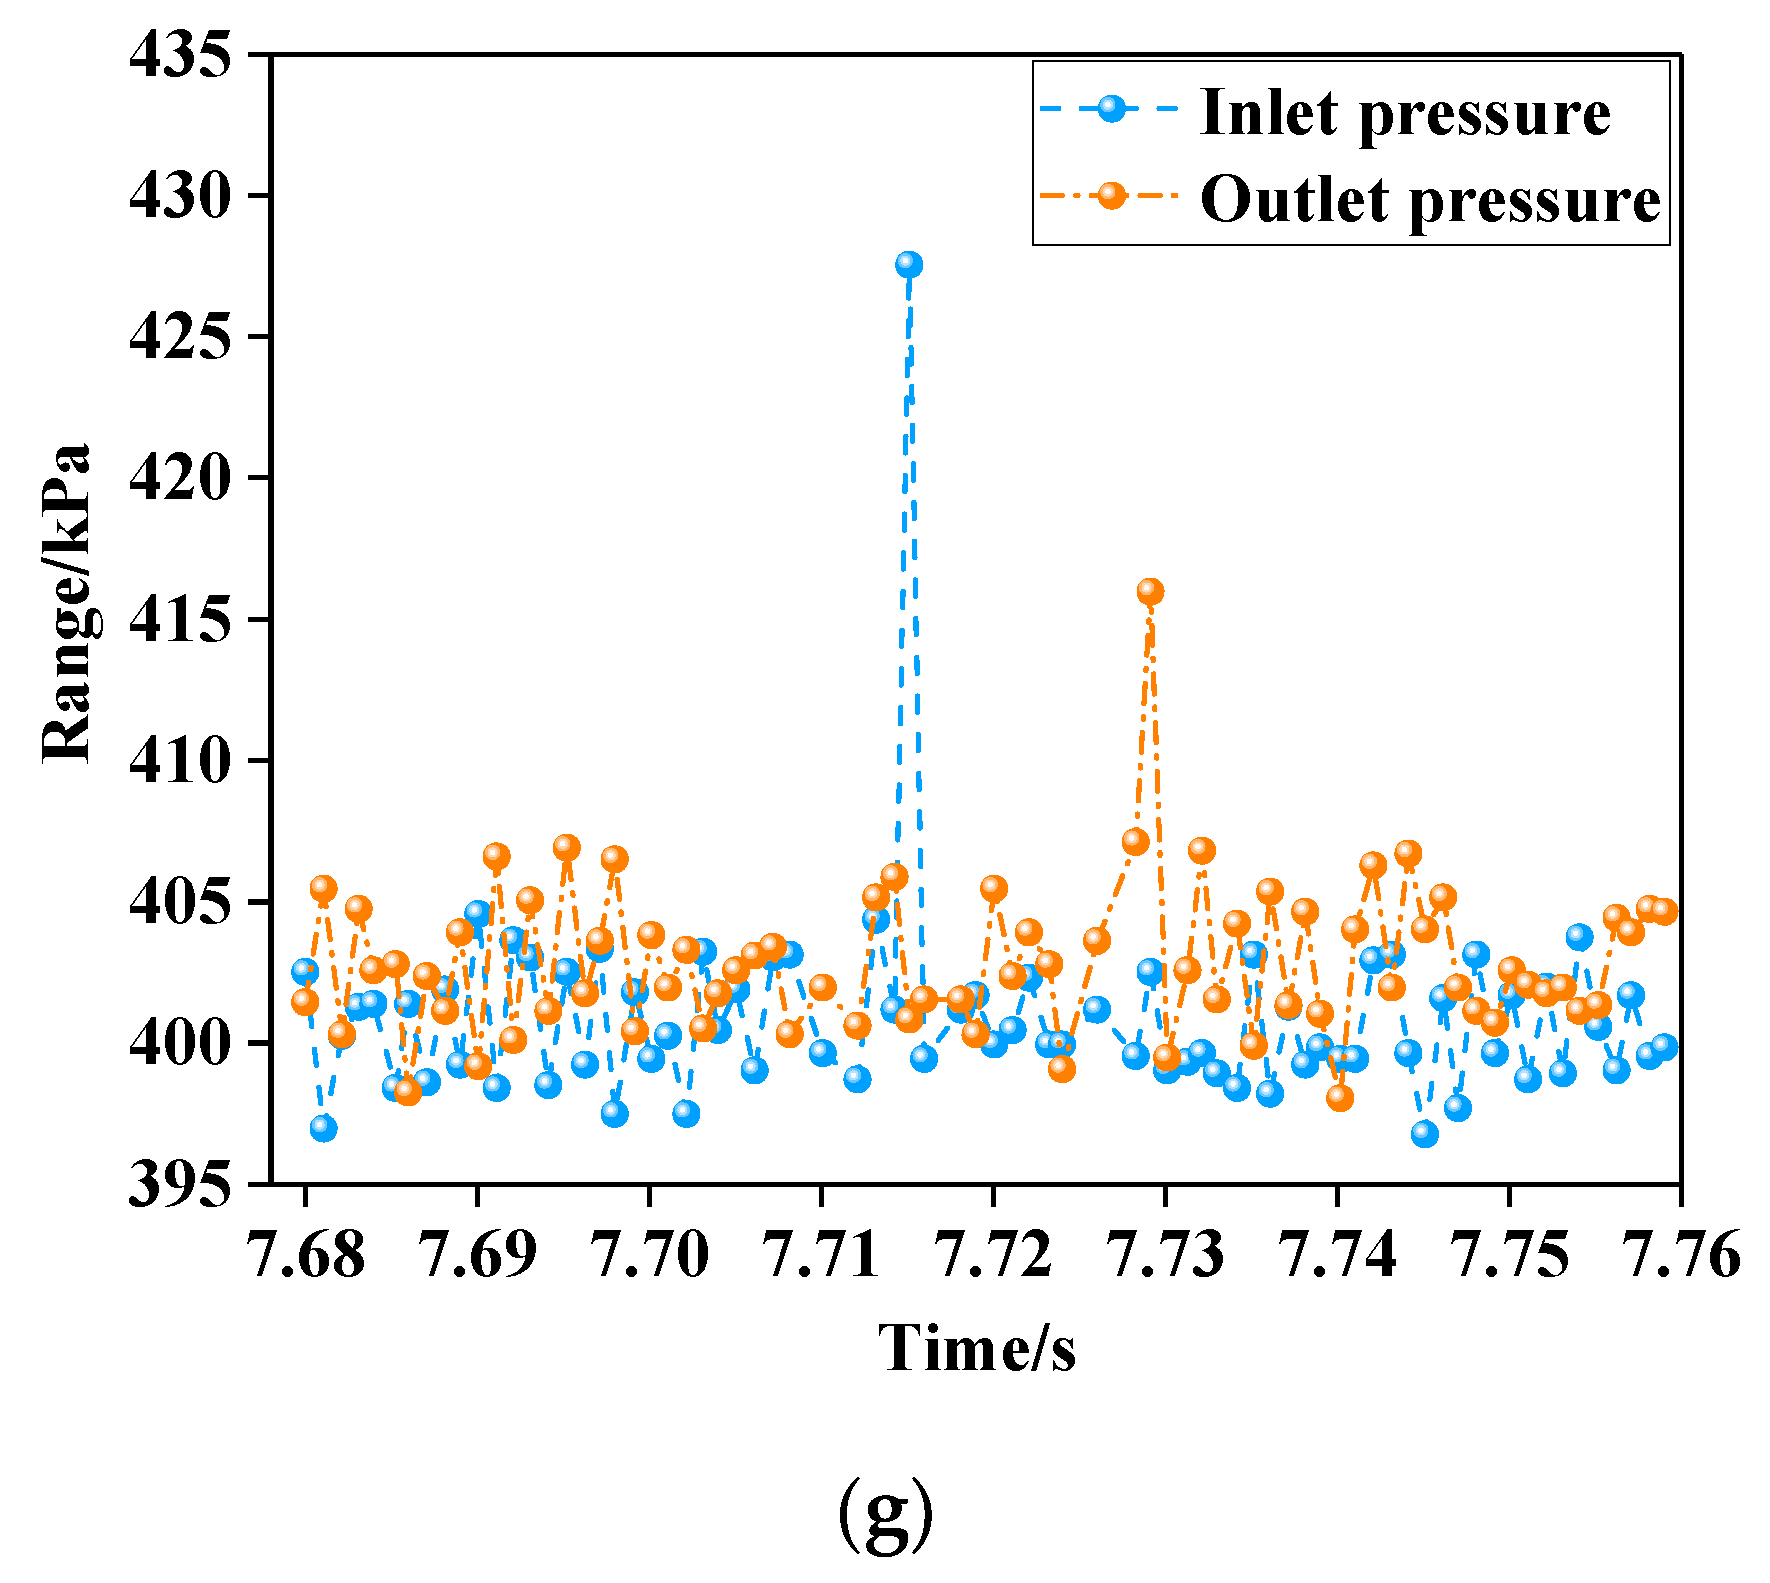
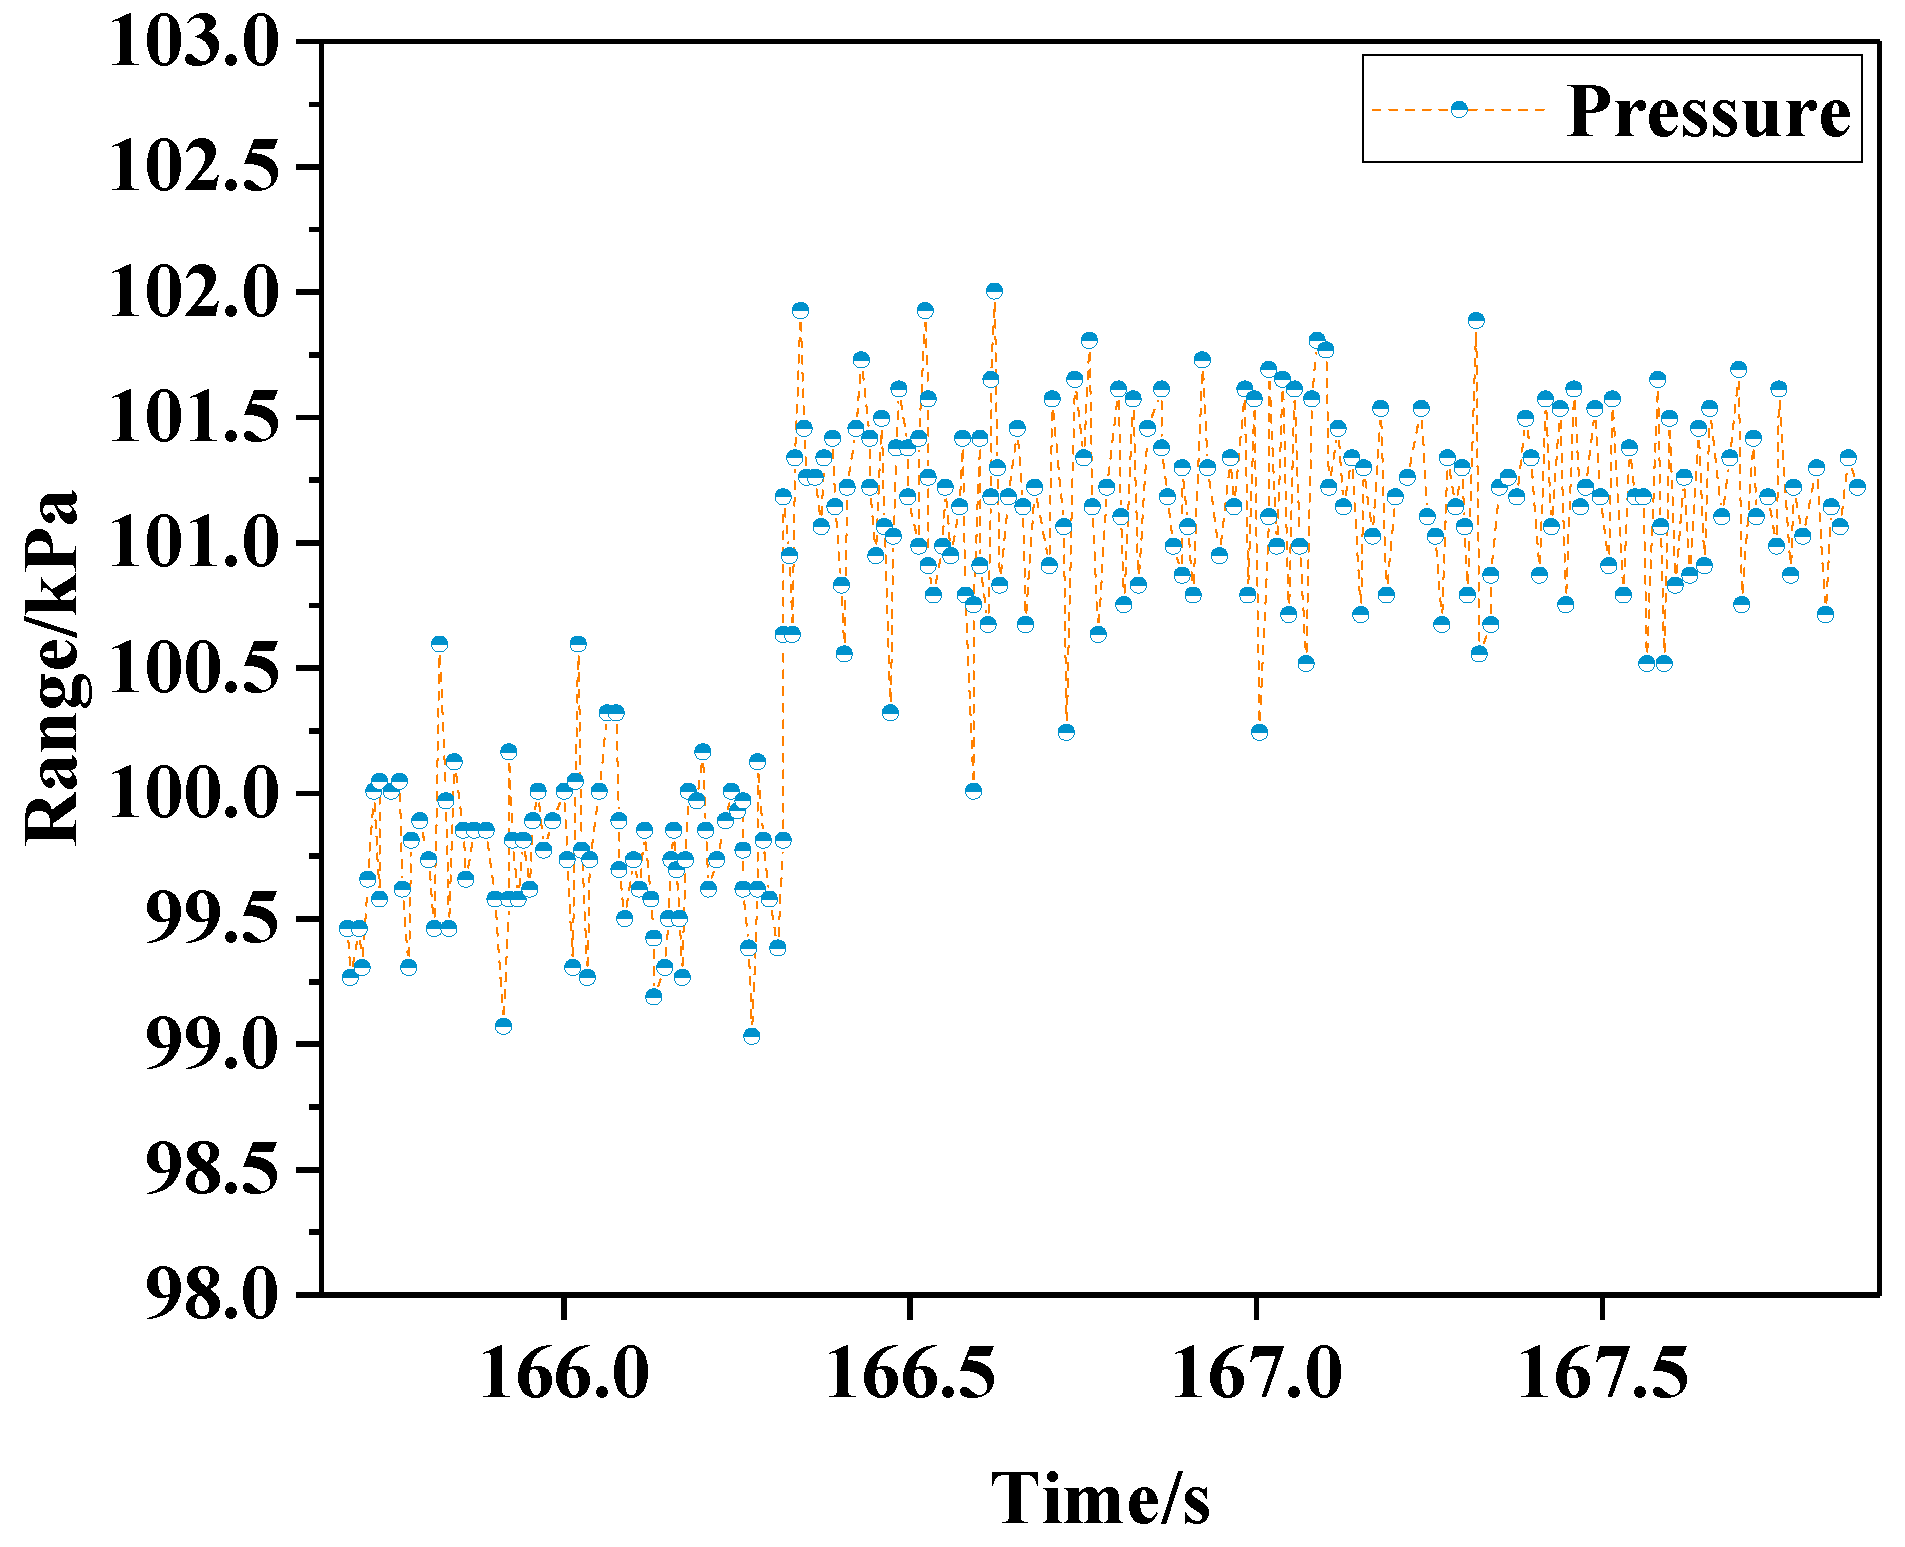
3.2. Measured Pressure Chart of Gas Oxidation at 900 °C
4. Conclusions
- The reactor has the ability to provide a high-temperature reaction environment at 1000 °C for low-concentration gas oxidation.
- The pressure variation curves of the reactor with air and different concentrations of gas were similar. The gas in the reactor did not exhibit a sudden volume expansion or a sudden pressure increase due to oxidation. Compared with air, the pressure of gas mixed with a small amount of carbon dioxide and water vapor did not fluctuate significantly during the further reaction.
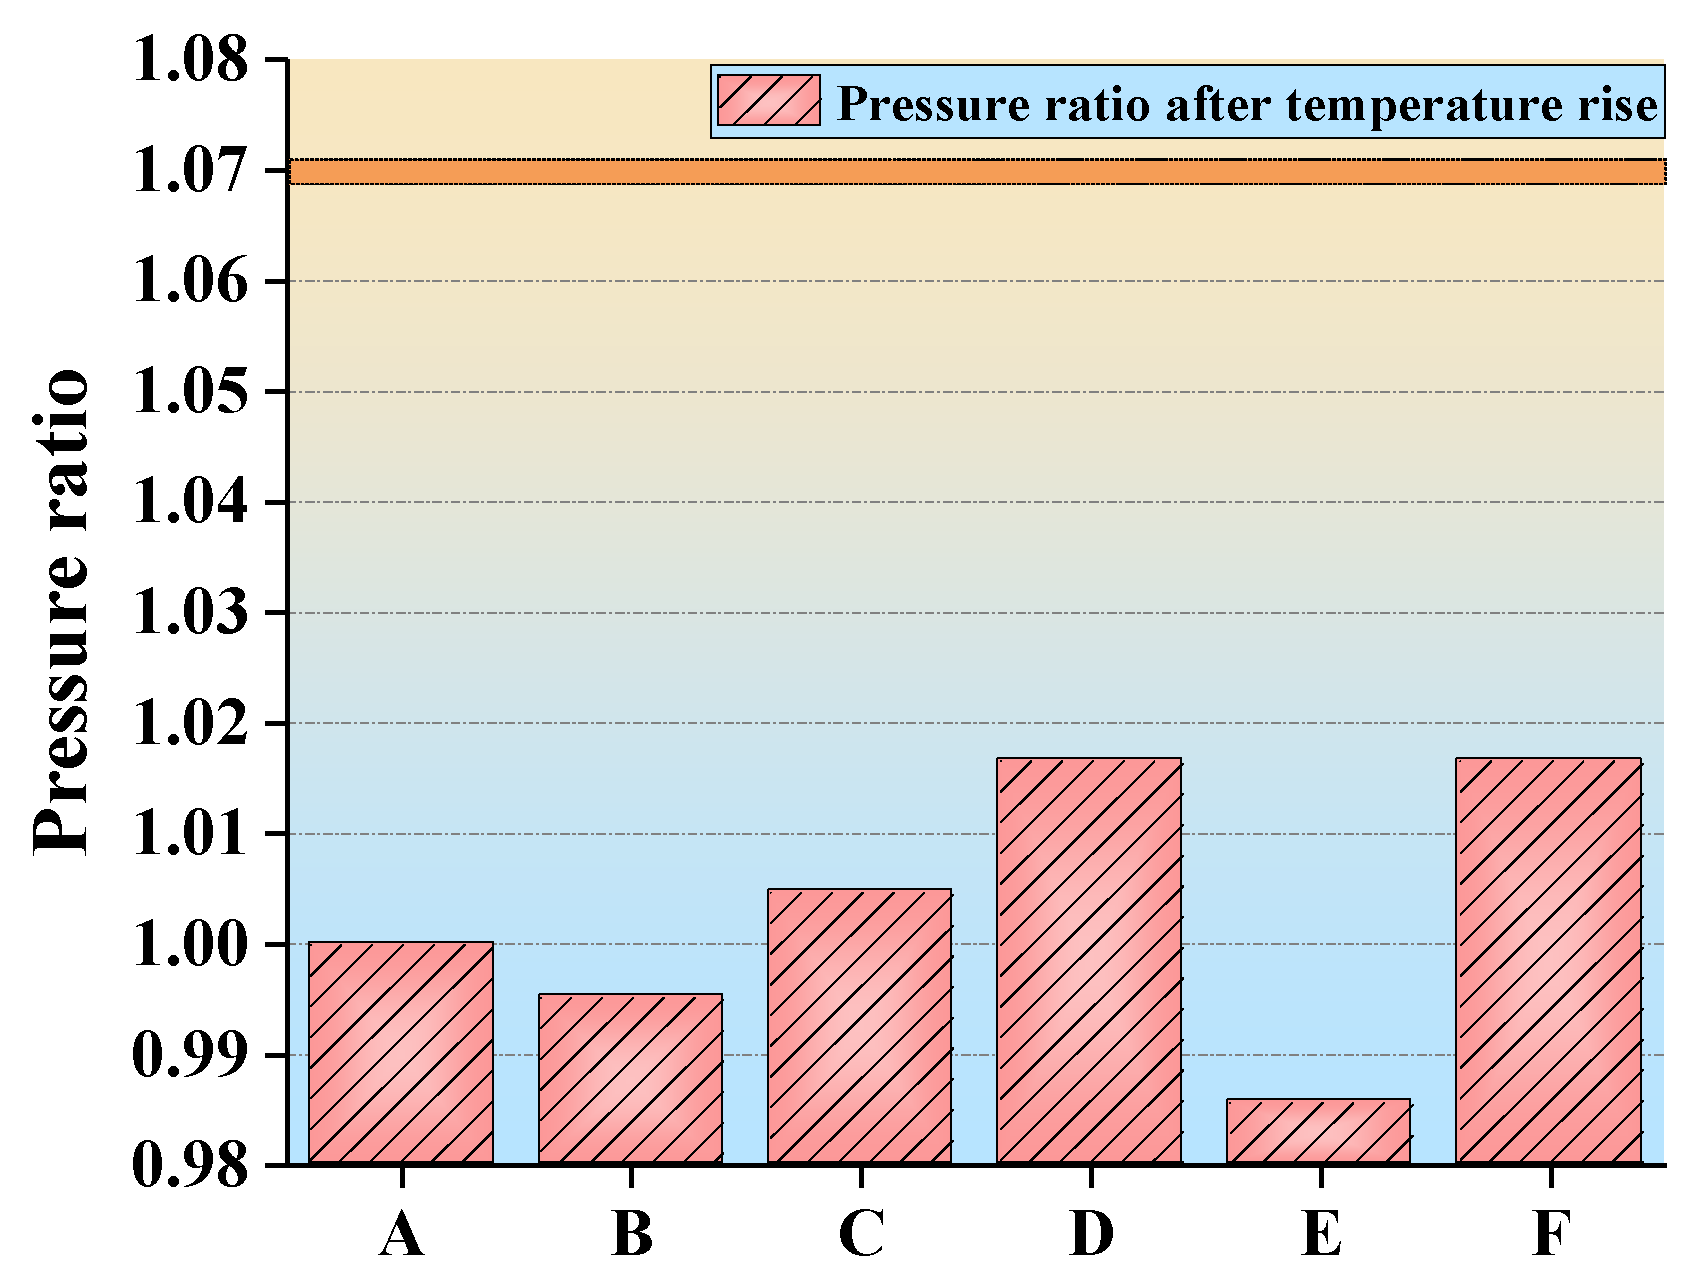
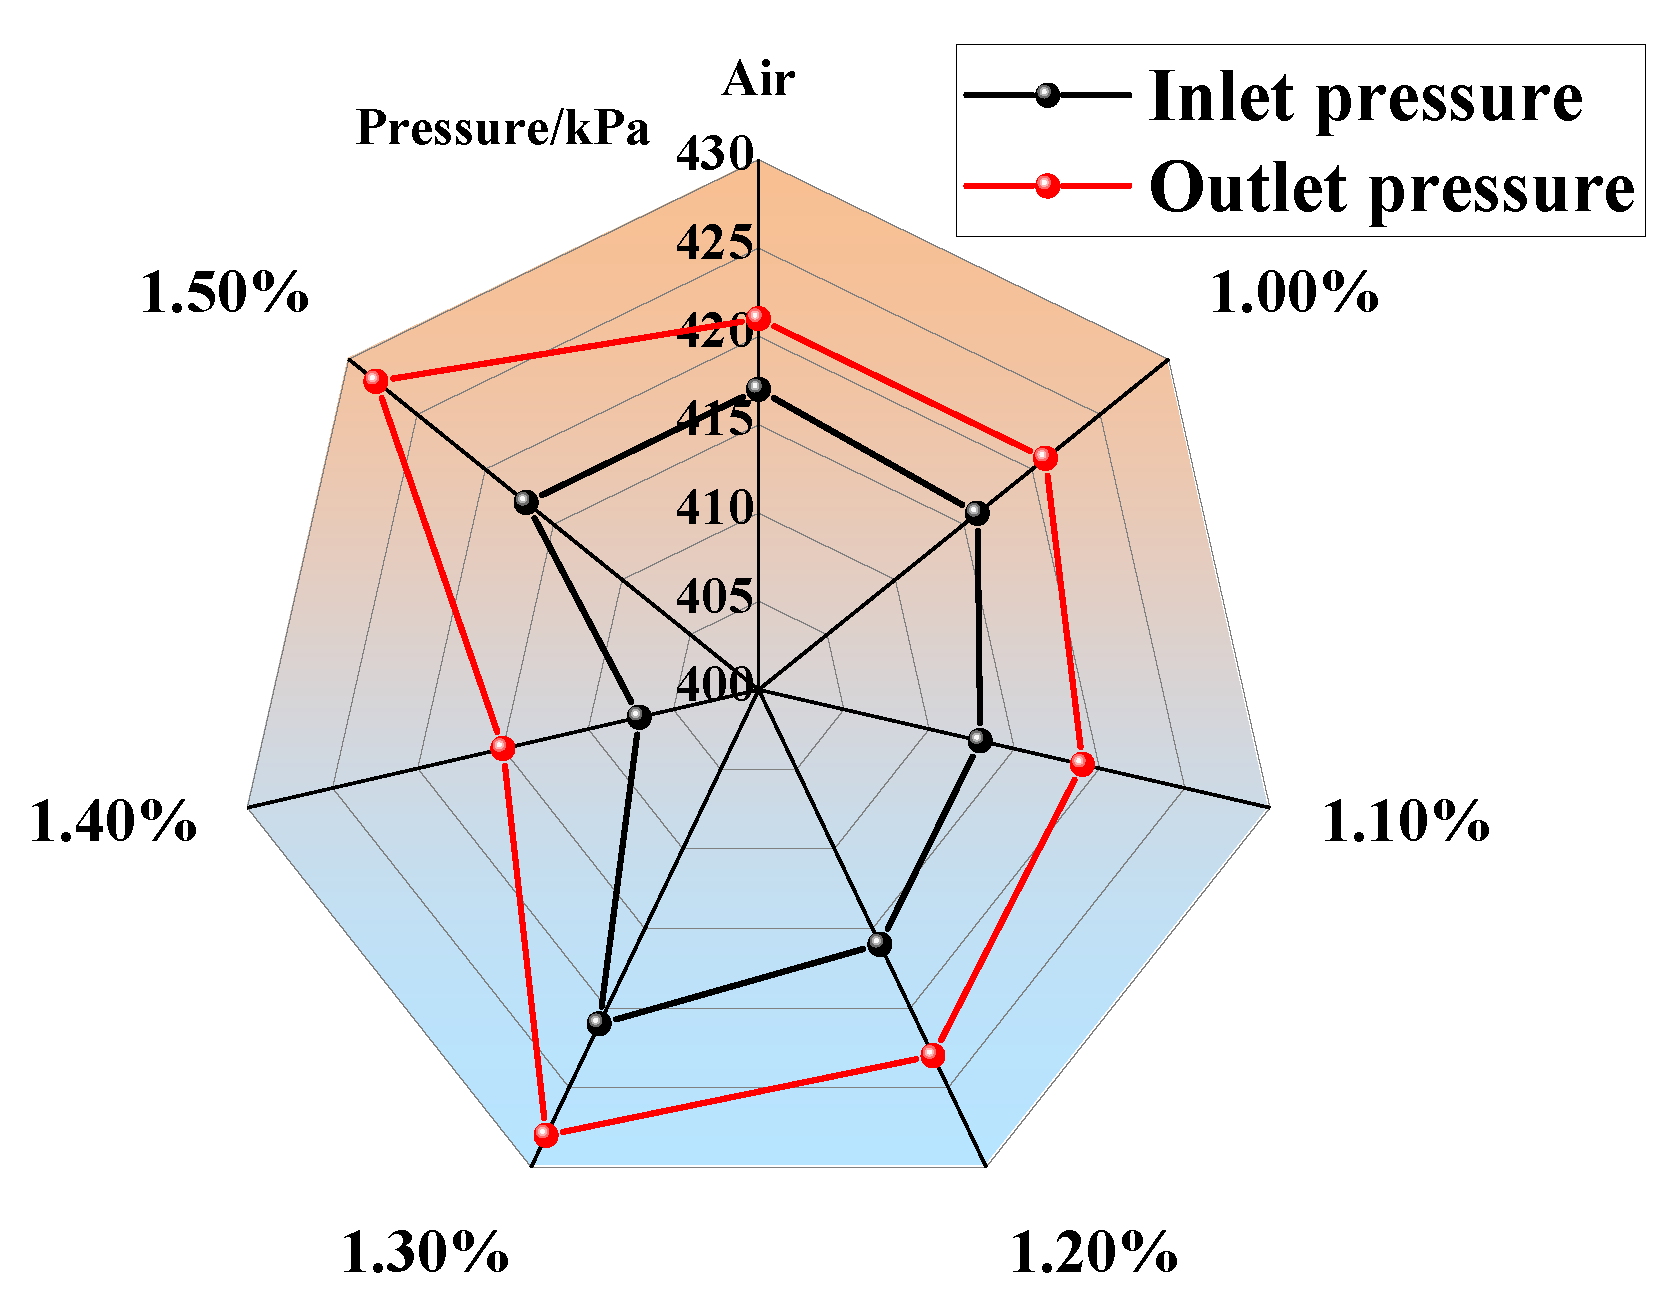
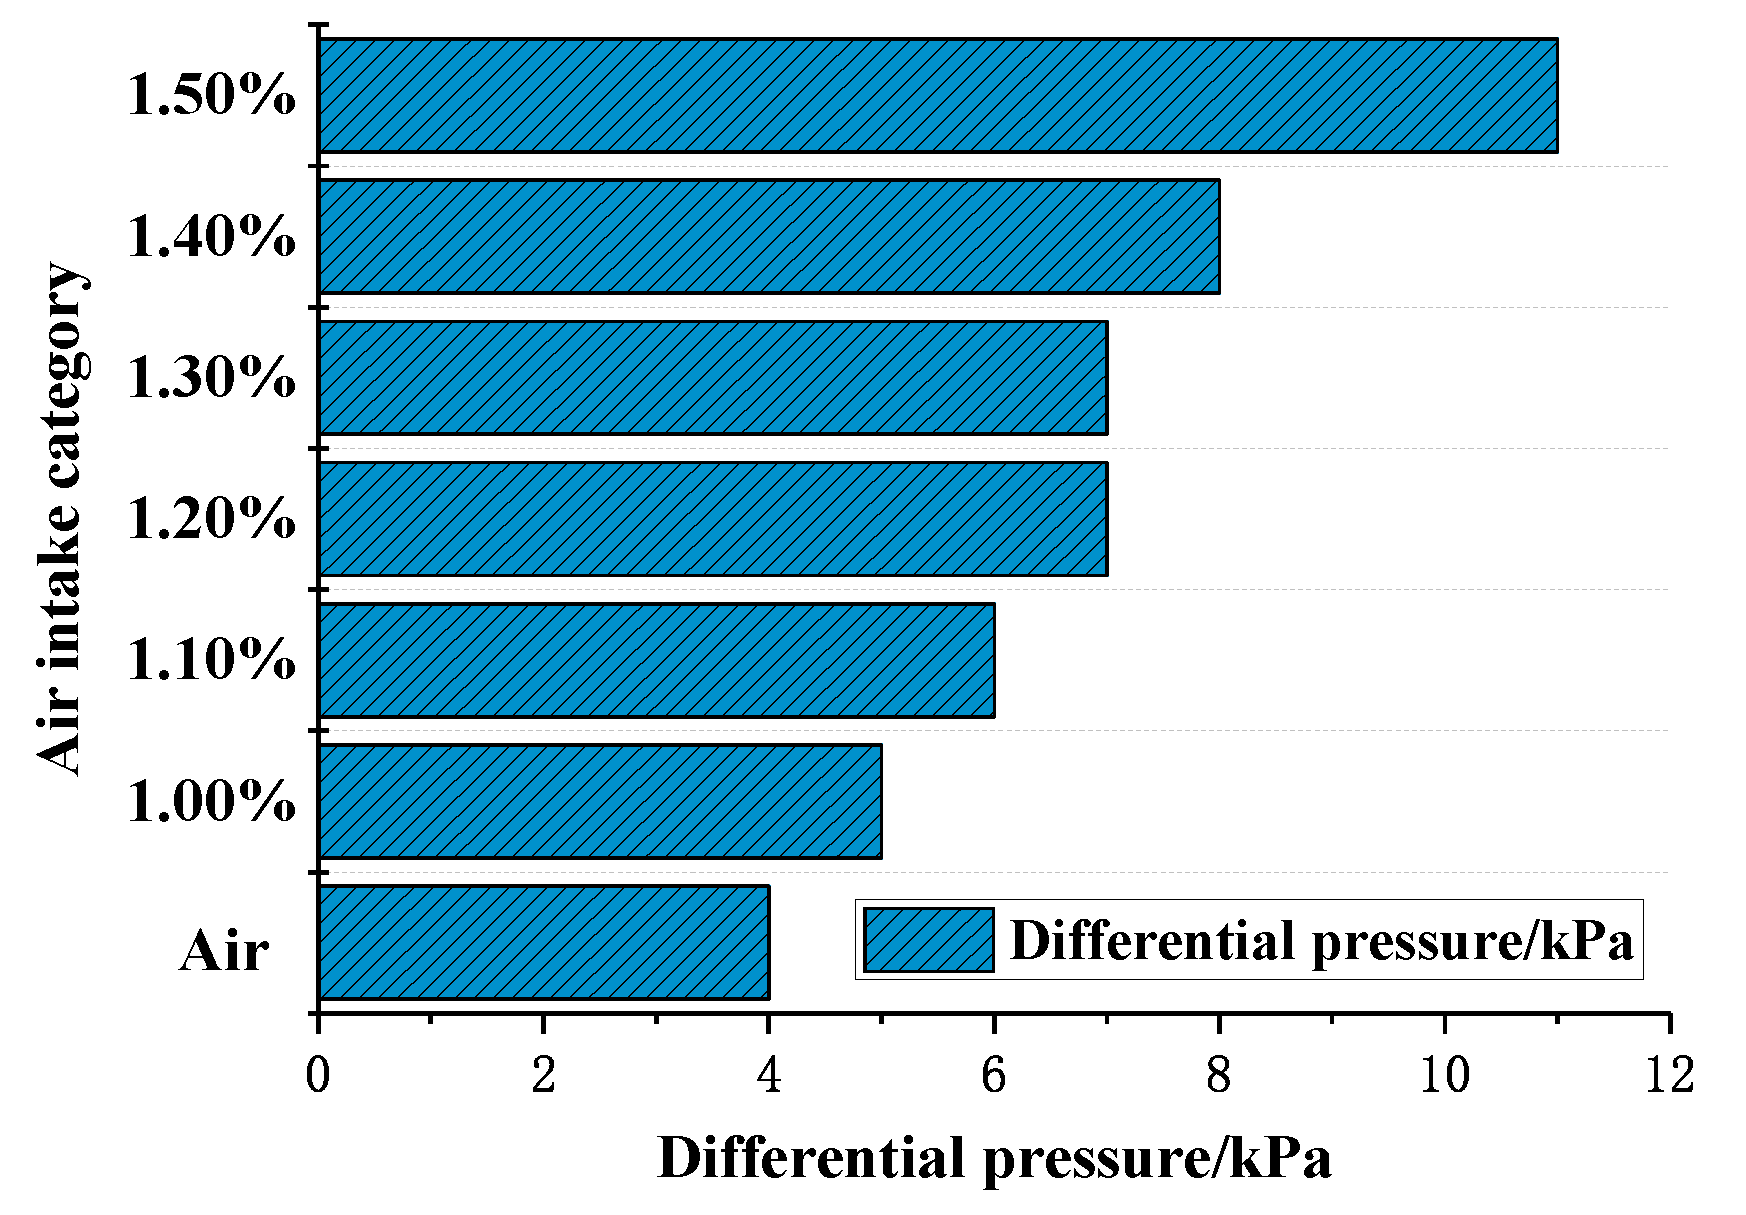
- The inlet and outlet pressures of 1.00–1.50% concentration gas were at similar levels. Their pressure difference was slight, indicating that there was no instant increase in pressure in the gas reactor. The minimum pressure difference was 4 kPa (air) and the maximum was 11 kPa (1.50% gas). The ratio of low-concentration gas outlet pressure to air outlet pressure was less than 1.07, indicating that no gas explosion occurred in the measured range. The safe oxidation gas concentration in the reactor was from 1.00% to 1.50% and the gas concentration of 1.40% had the minimum explosion probability, which provides the optimal concentration for future low-concentration gas oxidation utilization. This provides a premise for the utilization of waste heat in low-concentration gas (Figure 11).
Author Contributions
Funding
Conflicts of Interest
References
- Marín, P.; Vega, A.; Díez, F.V.; Ordóñez, S. Control of regenerative catalytic oxidizers used in coal mine ventilation air methane exploitation. Process Saf. Environ. Prot. 2020, 134, 333–342. [Google Scholar] [CrossRef]
- Gao, P. Application of low concentration coal mine methane (CMM) oxidization technology in coal refrigeration system. China Energy Environ. Prot. 2017, 39, 108–112. [Google Scholar]
- Li, Q.; Lin, B.; Yuan, D.; Chen, G. Demonstrationand its validation for ventilation air methane (VAM) thermal oxi-dation and energy recovery project. Appl. Therm. Eng. 2015, 90, 75–85. [Google Scholar] [CrossRef]
- Li, Z. Research status and application prospect of low concentration CBM utilization technology. Energy Environ. Prot. 2018, 40, 152–156. [Google Scholar]
- He, Z.; Li, X.-B.; Liu, L.-M.; Zhu, W. The intrinsic mechanism of methane oxidation under explosion condition: A combined ReaxFF and DFT study. Fuel 2014, 124, 85–90. [Google Scholar] [CrossRef]
- Stracher, G.B. Gases Generated During the Low-Temperature Oxidation and Pyrolysis of Coal and the Effects on Methane-Air Flammable Limits. In Coal and Peat Fires: A Global Perspective: Volume 5: Case Studies—Advances in Field and Laboratory Research; Elsevier: Amsterdam, The Netherlands, 2019; Volume 5, pp. 157–171. [Google Scholar]
- Li, M.; Xu, J.; Wang, C.; Wang, B. Thermal and kinetics mechanism of explosion mitigation of methane-air mixture by N2/CO2 in a closed compartment. Fuel 2019, 255, 115747. [Google Scholar] [CrossRef]
- Deng, J.; Cheng, F.; Song, Y.; Luo, Z.; Zhang, Y. Experimental and simulation studies on the influence of carbon monoxide on explosion characteristics of methane. J. Loss Prev. Process Ind. 2015, 36, 45–53. [Google Scholar] [CrossRef]
- Shen, X.; Zhang, B.; Zhang, X.; Wu, S. Explosion behaviors of mixtures of methane and air with saturated water vapor. Fuel 2016, 177, 15–18. [Google Scholar] [CrossRef]
- Wen, X.; Wang, M.; Su, T.; Zhang, S.; Pan, R.; Ji, W. Suppression effects of ultrafine water mist on hydrogen/methane mixture explosion in an obstructed chamber. Int. J. Hydrog. Energy 2019, 44, 32332–32342. [Google Scholar] [CrossRef]
- Hoffman, R.E.; Darmon, E.; Aserin, A.; Garti, N. High accuracy NMR chemical shift corrected for bulk magnetization as a tool for structural elucidation of dilutable microemulsions. Part 1—Proof of concept. J. Colloid Interface Sci. 2016, 463, 349–357. [Google Scholar] [CrossRef] [PubMed]
- Cao, X.; Ren, J.; Bi, M.; Zhou, Y.; Li, Y. Experimental research on the characteristics of methane/air explosion affected by ultrafine water mist. J. Hazard. Mater. 2017, 324, 489–497. [Google Scholar] [CrossRef] [PubMed]
- Cui, G.; Wang, S.; Liu, J.; Bi, Z.; Li, Z. Explosion characteristics of a methane/air mixture at low initial temperatures. Fuel 2018, 234, 886–893. [Google Scholar] [CrossRef]
- Li, P.; Liu, Z.; Li, M.; Huang, P.; Zhao, Y.; Li, X.; Jiang, S. Experimental study on the flammability limits of natural gas/air mixtures at elevated pressures and temperatures. Fuel 2019, 256, 115950. [Google Scholar] [CrossRef]
- Huang, L.; Pei, S.; Wang, Y.; Zhang, L.; Ren, S.; Zhang, Z.; Xiao, Y. Assessment of flammability and explosion risks of natural gas-air mixtures at high pressure and high temperature. Fuel 2019, 247, 47–56. [Google Scholar] [CrossRef]
- Tang, C.; Zhang, S.; Si, Z.; Huang, Z.; Zhang, K.; Jin, Z. High methane natural gas/air explosion characteristics in confined vessel. J. Hazard. Mater. 2014, 278, 520–528. [Google Scholar] [CrossRef] [PubMed]
- Niu, Y.; Shi, B.; Jiang, B. Experimental study of overpressure evolution laws and flame propagation characteristics after methane explosion in transversal pipe networks. Appl. Therm. Eng. 2019, 154, 18–23. [Google Scholar] [CrossRef]
- Slepterev, A.A.; Salnikov, V.S.; Tsyrulnikov, P.G.; Noskov, A.S.; Tomilov, V.N.; Chumakova, N.A.; Zagoruiko, A.N. Homogeneous high-temperature oxidation of methane. React. Kinet. Catal. Lett. 2007, 91, 273–282. [Google Scholar] [CrossRef]
- Gao, P.; Sun, D.; Huo, C.; Kang, J.; Zhao, X.; Chen, J.; Lan, B. Study progress on thermal oxidized utilization technology of ultralow concentration gas. Coal Sci. Technol. 2018, 12, 67–73. [Google Scholar] [CrossRef]
- Kang, J.; Lan, B.; Yan, Z.; Gao, P.; Xu, H. Study on Regenerative Oxidation Test of Ventilation Air Methane. Min. Saf. Environ. Prot. 2013, 14, 75–88. [Google Scholar]


| Dimension (Length, Width, Height m) | Single Pore Side Length m | Number of Pores | Pore Surface Area m2 | Mass kg |
| 0.15 × 0.15 × 0.3 | e = 0.003 | 40 × 40 | 5.8 | 5.71 |
| Volume m3 | Single Pore Side Thickness m | Porosity | Specific Surface Area m2/m3 | Heating up to 1000 °C Required Energy kJ |
| 0.00675 | a = 0.00075 | 65% | 859 | 10352 |
© 2020 by the authors. Licensee MDPI, Basel, Switzerland. This article is an open access article distributed under the terms and conditions of the Creative Commons Attribution (CC BY) license (http://creativecommons.org/licenses/by/4.0/).
Share and Cite
Chen, J.; Wen, G.; Yan, S.; Lan, X.; Xiao, L. Oxidation and Characterization of Low-Concentration Gas in a High-Temperature Reactor. Processes 2020, 8, 481. https://doi.org/10.3390/pr8040481
Chen J, Wen G, Yan S, Lan X, Xiao L. Oxidation and Characterization of Low-Concentration Gas in a High-Temperature Reactor. Processes. 2020; 8(4):481. https://doi.org/10.3390/pr8040481
Chicago/Turabian StyleChen, Jinhua, Guangcai Wen, Song Yan, Xiangyun Lan, and Lu Xiao. 2020. "Oxidation and Characterization of Low-Concentration Gas in a High-Temperature Reactor" Processes 8, no. 4: 481. https://doi.org/10.3390/pr8040481
APA StyleChen, J., Wen, G., Yan, S., Lan, X., & Xiao, L. (2020). Oxidation and Characterization of Low-Concentration Gas in a High-Temperature Reactor. Processes, 8(4), 481. https://doi.org/10.3390/pr8040481