Article

Hydrodynamic and Heat Transfer Study of a Fluidized Bed by Discrete Particle Simulations

1
Department of Chemical Engineering and Chemistry, Eindhoven University of Technology, P.O. Box 513, 5600 MB Eindhoven, The Netherlands
2
Department of Mechanical Engineering, Eindhoven University of Technology, P.O. Box 513, 5600 MB Eindhoven, The Netherlands
*
Author to whom correspondence should be addressed.
Processes 2020, 8(4), 463; https://doi.org/10.3390/pr8040463
Submission received: 20 March 2020 / Revised: 3 April 2020 / Accepted: 7 April 2020 / Published: 14 April 2020

Abstract

:
A numerical simulation study was carried out to study the combined thermal behavior and hydrodynamics of a pseudo-2D fluidized bed using a computational fluid dynamics–discrete element method (CFD-DEM). To mimic the effect of heterogeneous exothermic reactions, a constant heat source was implemented in the particle energy equation. The effects of superficial gas velocity, bed height and heat source distribution were analyzed with the aid of averaged volume fraction and temperature distributions and velocity profiles. It was found that both the gas superficial velocity and the bed aspect ratio have a profound influence on fluidization behavior and temperature distributions.

Graphical Abstract

1. Introduction

Fluidized beds find widespread application in various industrial processes because of their favorable heat transfer characteristics. Many of the important applications of fluidized beds involve reactions with large heat effects. This may give rise to high rates of heat removal or production. Examples can be found in fluidized bed coal combustion, fluid catalytic cracking and polymerization processes for the production of polyethylene. For a proper understanding of the role of heat production and transport, detailed knowledge is required. This includes considering studies of the fluidized bed hydrodynamics and heat transfer (see, e.g., the work of Kunii and Levenspiel [1]; Basu and Nag [2]; Zhou et al. [3,4]). Most of the previous work was based on temperature probes placed inside, mounted or placed on the fluidized bed walls (see, e.g., Borodulya et al. [5]; Valenzuela and Glicksman [6]). Limtrakul et al. [7], Zhou et al. [8] and Patil et al. [9] previously used a computational fluid dynamics–discrete element method (CFD-DEM) to study the hydrodynamics combined with heat transfer in fluidized beds. However, only recently has CFD-DEM with heat transport been used to investigate bubble-to-emulsion heat transfer (see Patil et al. [9]).
In this paper, we use a CFD-DEM approach to study heat transport in fluidized beds. This approach combines a computational fluid dynamics (CFD) model to describe the flow of the gas phase with a discrete element method (DEM) to describe the particle motion (Deen et al. [10]; van der Hoef et al. [11]). We present CFD-DEM simulations of a pseudo-2D fluidized bed with spherical particles, through which we studied the influence of particle size and superficial gas velocity on fluidized bed thermal behavior. To mimic processes with heat production inside the particles due to a heterogeneous exothermic chemical reaction, a source term was added to the thermal energy equation of the particles. The simulations were carried out with an open-source package, OpenFOAM-CFDEM-LIGGGHTS. The objective of this work is to study the influence of superficial gas velocity, bed aspect ratio and heat production distribution on the hydrodynamics and heat transport in the bed.

2. Governing Equations

The CFD-DEM model was first introduced by Hoomans et al. [12]. In this work, we use the same model equations as those reported by Patil et al. [9] and Li et al. [13]. In the CFD-DEM, the gas phase hydrodynamics is described by the Navier–Stokes equations, while the motion of each particle is described by Newton’s second law. The volume-averaged conservation equations for the gas phase mass and momentum are given by
( ε g ρ g ) t + · ( ε g ρ g u g ) = 0
( ε g ρ g u g ) t + · ( ε g ρ g u g u g ) = ε g p g · ( ε g τ g ) S + ε g ρ g g
where S represents the source term for momentum originating from the particulate phase. In this work, the Beetstra [14] drag force correlation is used to calculate the interphase momentum transfer coefficient:
S = 1 V c e l l i = 0 N p β V p 1 ε g ( u g v p ) D ( r r p ) .
The solid phase is considered to be discrete, and consequently, the modeling of this phase is based on the tracking of individual particles, accounting for particle–particle and/or particle–wall encounters. The motion of each spherical particle with mass m p and moment of inertia I p is described by Newton’s equations for spheres:
m p d 2 r p d t 2 = V p p + β V p 1 ε g ( u g v p ) + m p g + F c
I p d ω p d t = τ p
where r p is the particle position. The terms on the right-hand side of Equation (4) represent forces due to the pressure gradient, drag, gravity and inter-particle contact. For the contact force, a linear spring dashpot model (i.e., Hertz model) is used. τ p is the torque, and ω p is the angular velocity.
The thermal energy equation of the gas phase is given by
( ε g ρ g C p g T g ) t + · ( ε g ρ g u g C p g T g ) = · ( ε g k g e f f T g ) + Q p
where Q p represents the source term, accounting for the gas–particle heat transfer, whereas k g e f f is the effective thermal conductivity of the gas phase. The latter is related to the microscopic fluid thermal conductivity ( k g ) as follows:
k g e f f = 1 1 ε g ε g k g .
This equation was originally proposed by Syamal and Gidaspow [15]. The source term Q p due to the gas–particle heat transfer is obtained by summing and distributing the contributions of all particles using a discrete Dirac delta-function D in a similar manner as is done for the drag force:
Q p = p h A p ( T p T g ) D ( r r p )
where T p is the particle temperature, T g is the temperature of the gas phase at the Eulerian position r , and h is the fluid–particle heat transfer coefficient obtained from the empirical correlation by Gunn [16]:
N u p = ( 7 10 ε g + 5 ε g 2 ) ( 1 + 0.7 Re p 0.2 Pr 0.33 ) +                                                           ( 1.33 2.40 ε g + 1.20 ε g 2 ) Re p 0.7 Pr 0.33
N u p = h d p k g , Re p = ε g ρ g | u g v p | d p μ g , Pr = μ g C p g k g
where Re p and Pr are the particle Reynolds number and Prandtl number.
The thermal energy equation for each particle phase is given by
m p C p p d T p d t = h A p ( T g T p ) + q ˙ V p
where q ˙ is the heat production rate due to exothermic intra-particle reaction.

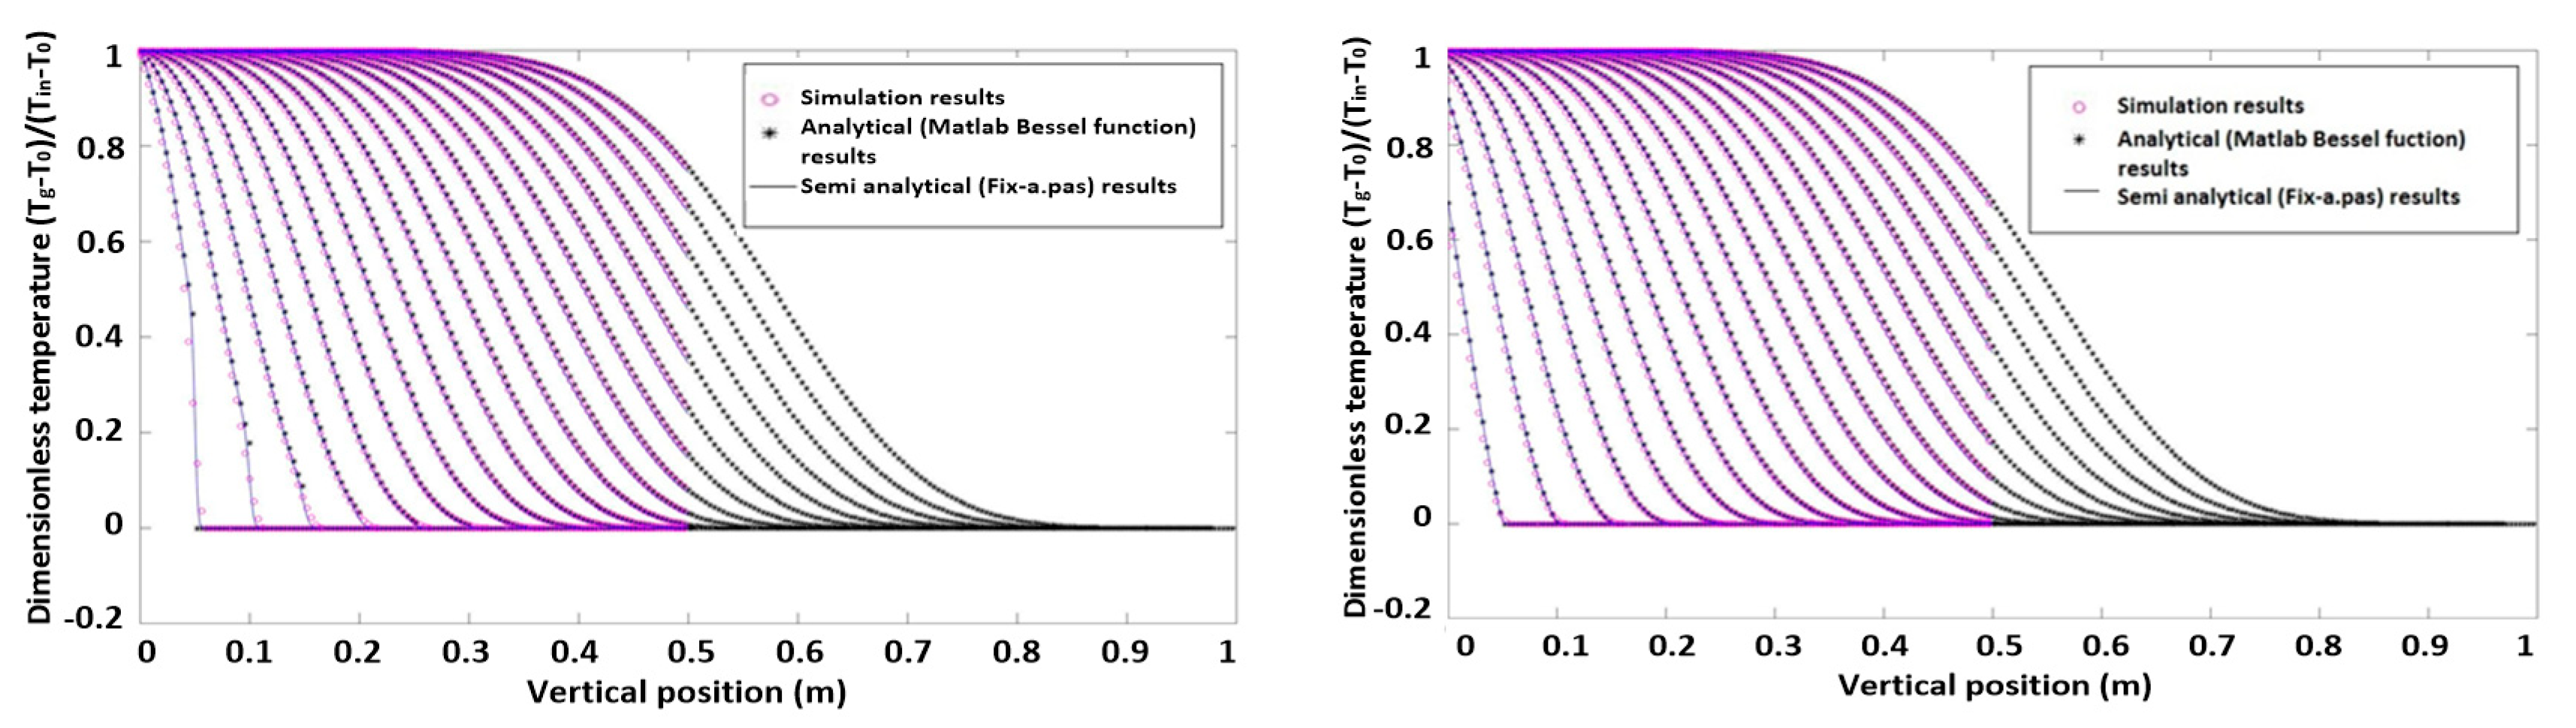
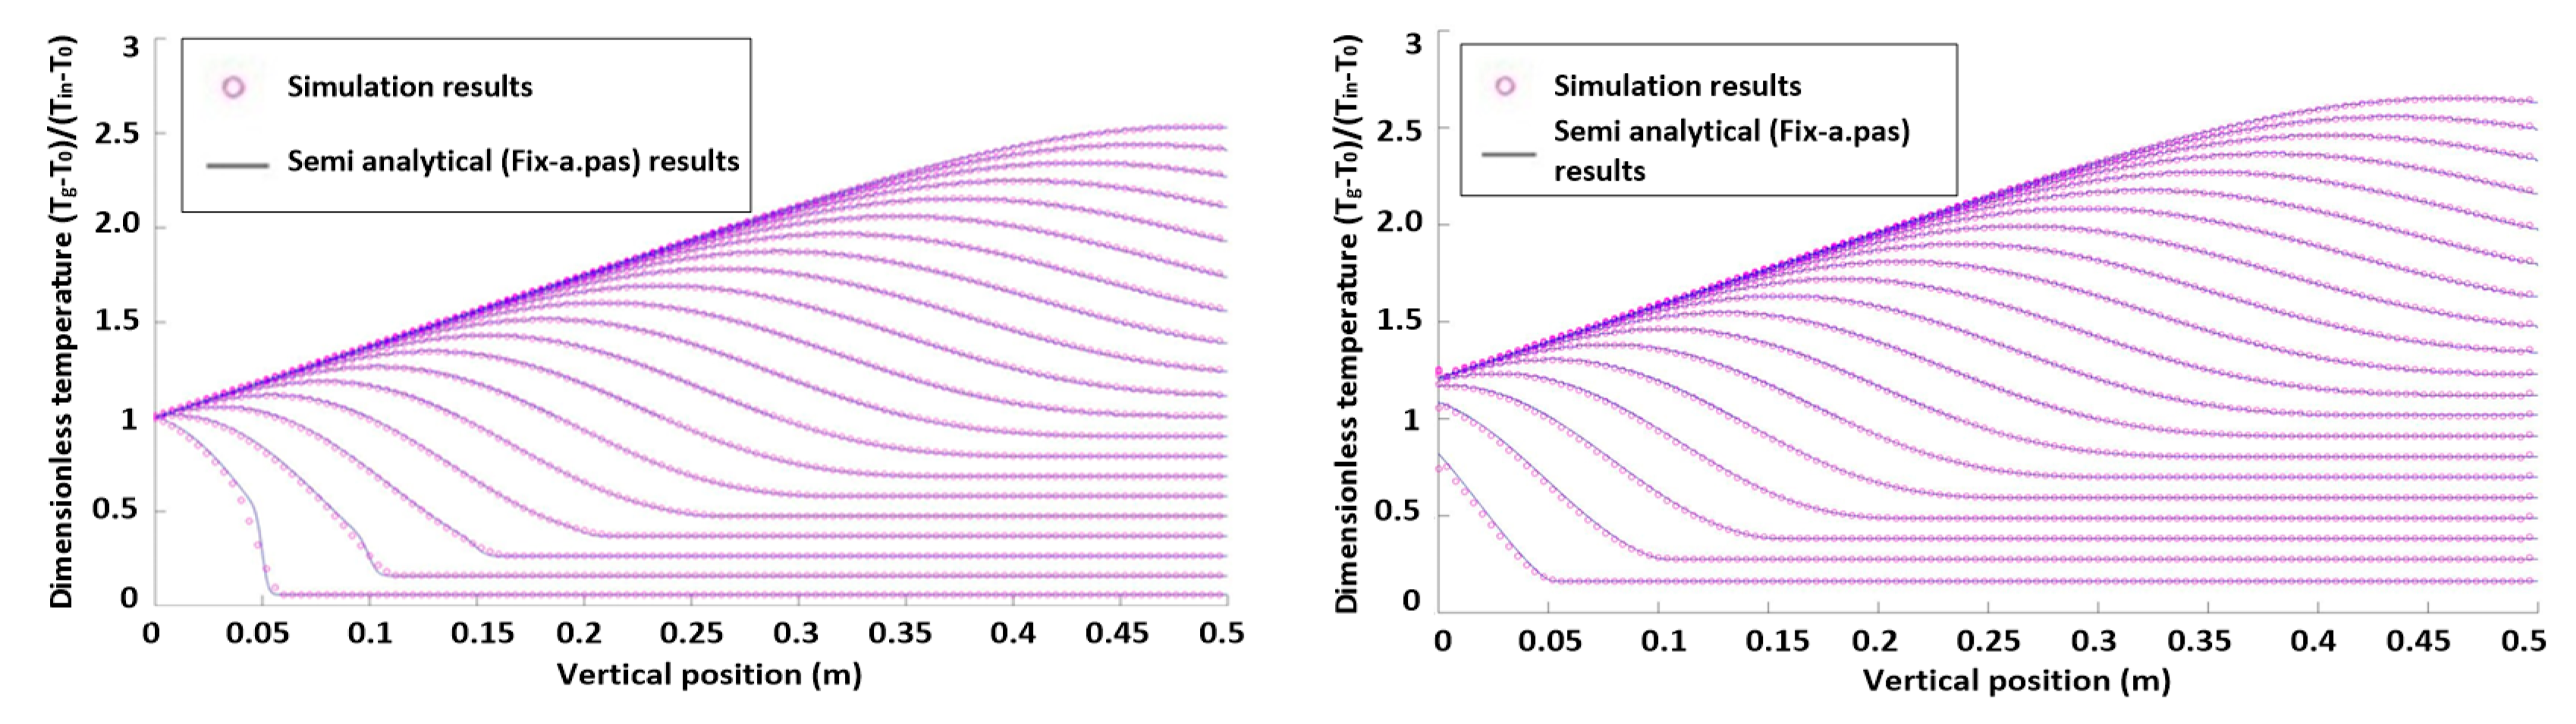
3. Model Verification

In this section, two test cases—without and with heat source term, respectively—were simulated to verify the heat transfer implementation. The test system was taken as a fixed bed with initially cold particles (273 K) that is heated up by a hot gas flow (373 K), which passes through the bed uniformly from the bottom of the bed. The particles were uniformly arranged in a block structure and maintained stationary, which is a similar geometry to that used by Van Sint Annaland et al. [17], Patil et al. [9] and Li et al. [13]. The physical properties of the particles and the gas in the CFD-DEM verification simulations are listed in Table 1. The geometrical characteristics of the bed are summarized in Table 2.
The simulation results were verified by comparing them with results from a semi-analytical model. The latter is based on a one-dimensional convection equation with interphase heat transfer between the gas and solid phase. For the 1D model, the gas and particle phase energy balances are given by
ε g ρ g C p g T g , z t = ε g ρ g u g , z C p g T g , z z + h a s ( T p , z T g , z )
( 1 ε g ) ρ g C p p T p , z t = h a s ( T g , z T p , z )
where as is the specific interfacial area, given by as = 6(1 − εg)/dp. The details of the analytical solution of Equations (12) and (13) can be found in Bird et al. [18].
Dimensionless axial temperature profiles of both phases without heat production are shown in Figure 1. The simulation results are compared with the semi-analytical data from the 1D model. Figure 2 shows simulation results in the case with heat production.
It was found that the results of both models (both without and with heat production) agree very well. Hence, we conclude that the heat transfer model is correctly implemented in the 3D CFD-DEM model and can be used for heat transfer studies of fluidized beds.

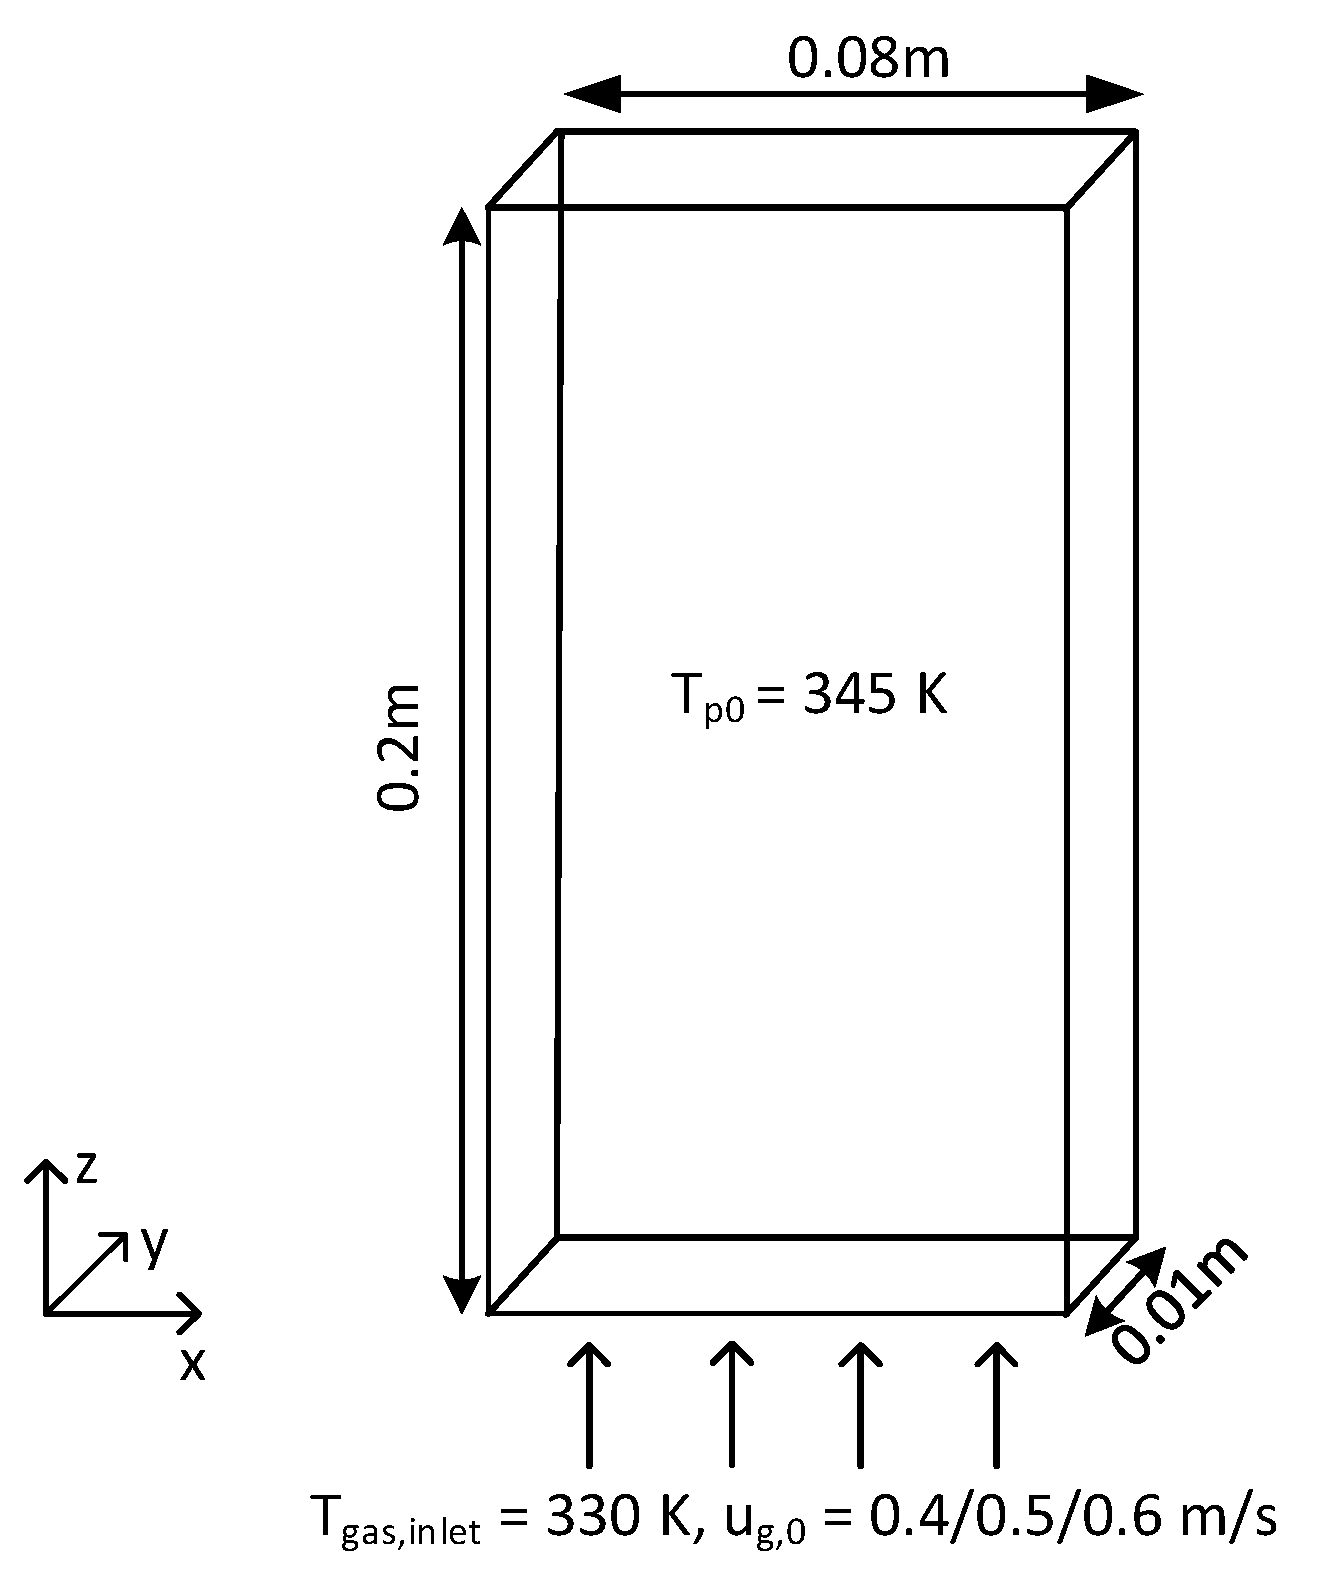
4. Simulation Settings

A series of fluidization simulations were performed using the OpenFOAM-CFDEM-LIGGGHTS package (we refer to this package as CFDEM hereafter) of a pseudo-2D fluidized bed, which is schematically presented in Figure 3. Details of the geometry are shown in Table 3. The simulations were carried out with particles of 0.995 mm in diameter, which are classified as Geldart D type particles. Simulations were performed for initial bed heights of 0.04 m (aspect ratio 0.5), 0.08 m (aspect ratio 1) and 0.16 m (aspect ratio 2). The number of particles in the system amounted to 37,225, 74,450 and 148,900, respectively. Free-slip boundary conditions were applied to the front and back walls, and no-slip boundary conditions were used for the left and right walls. Table 4 lists the physical properties of the gas and particles that were used in the simulations.
Simulations were performed for several gas superficial velocities, namely 0.4, 0.5 and 0.6 m/s (umf = 0.262 m/s). The particles were initialized at a temperature of 345 K and stacked on a cubic lattice at the bottom of the bed, after which a constant gas stream with Tg,0 = 330 K was supplied through the gas supply at the bottom of the bed. Each particle had a constant heat source of 0.0209 W/(K·m), which is the same as that used by Li et al. [13]. All simulations were performed for 10 s.

5. Results

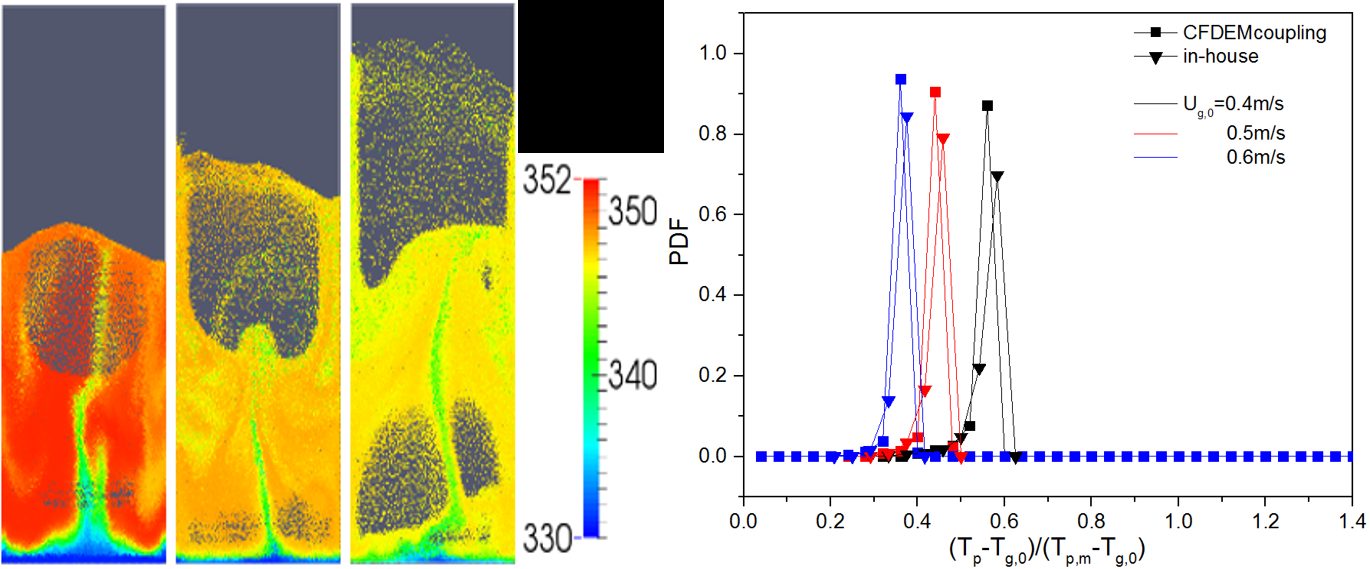
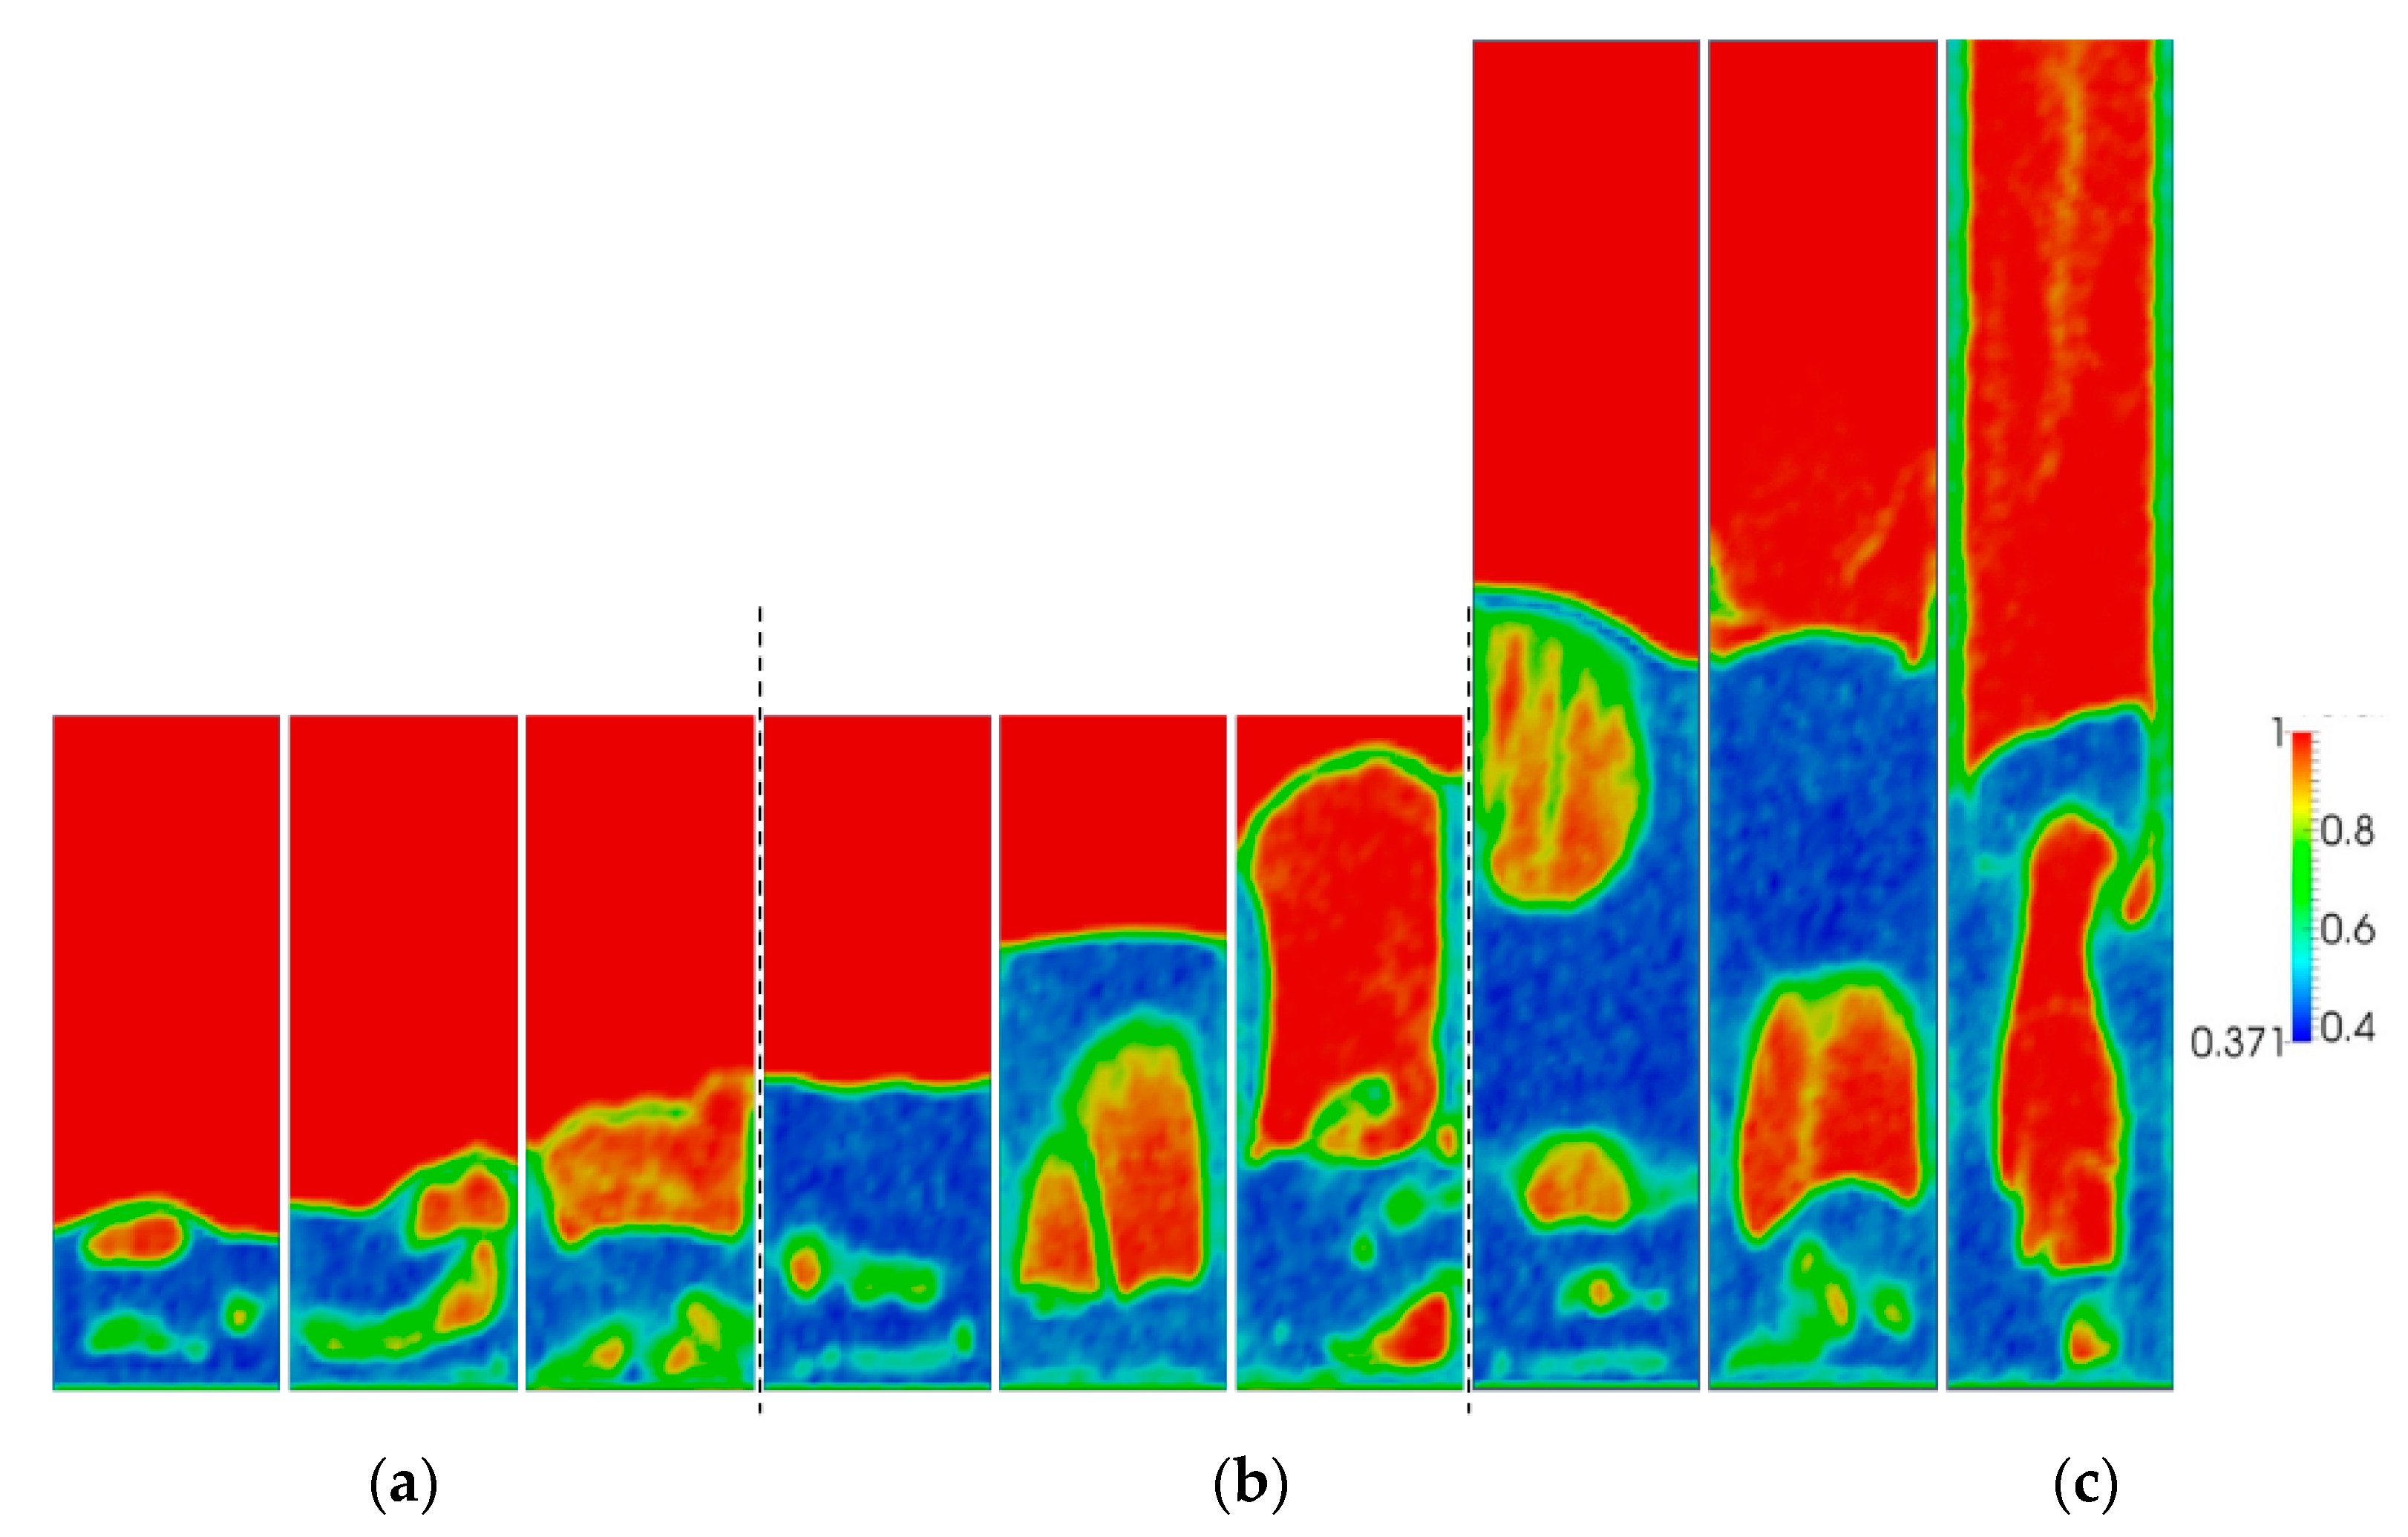
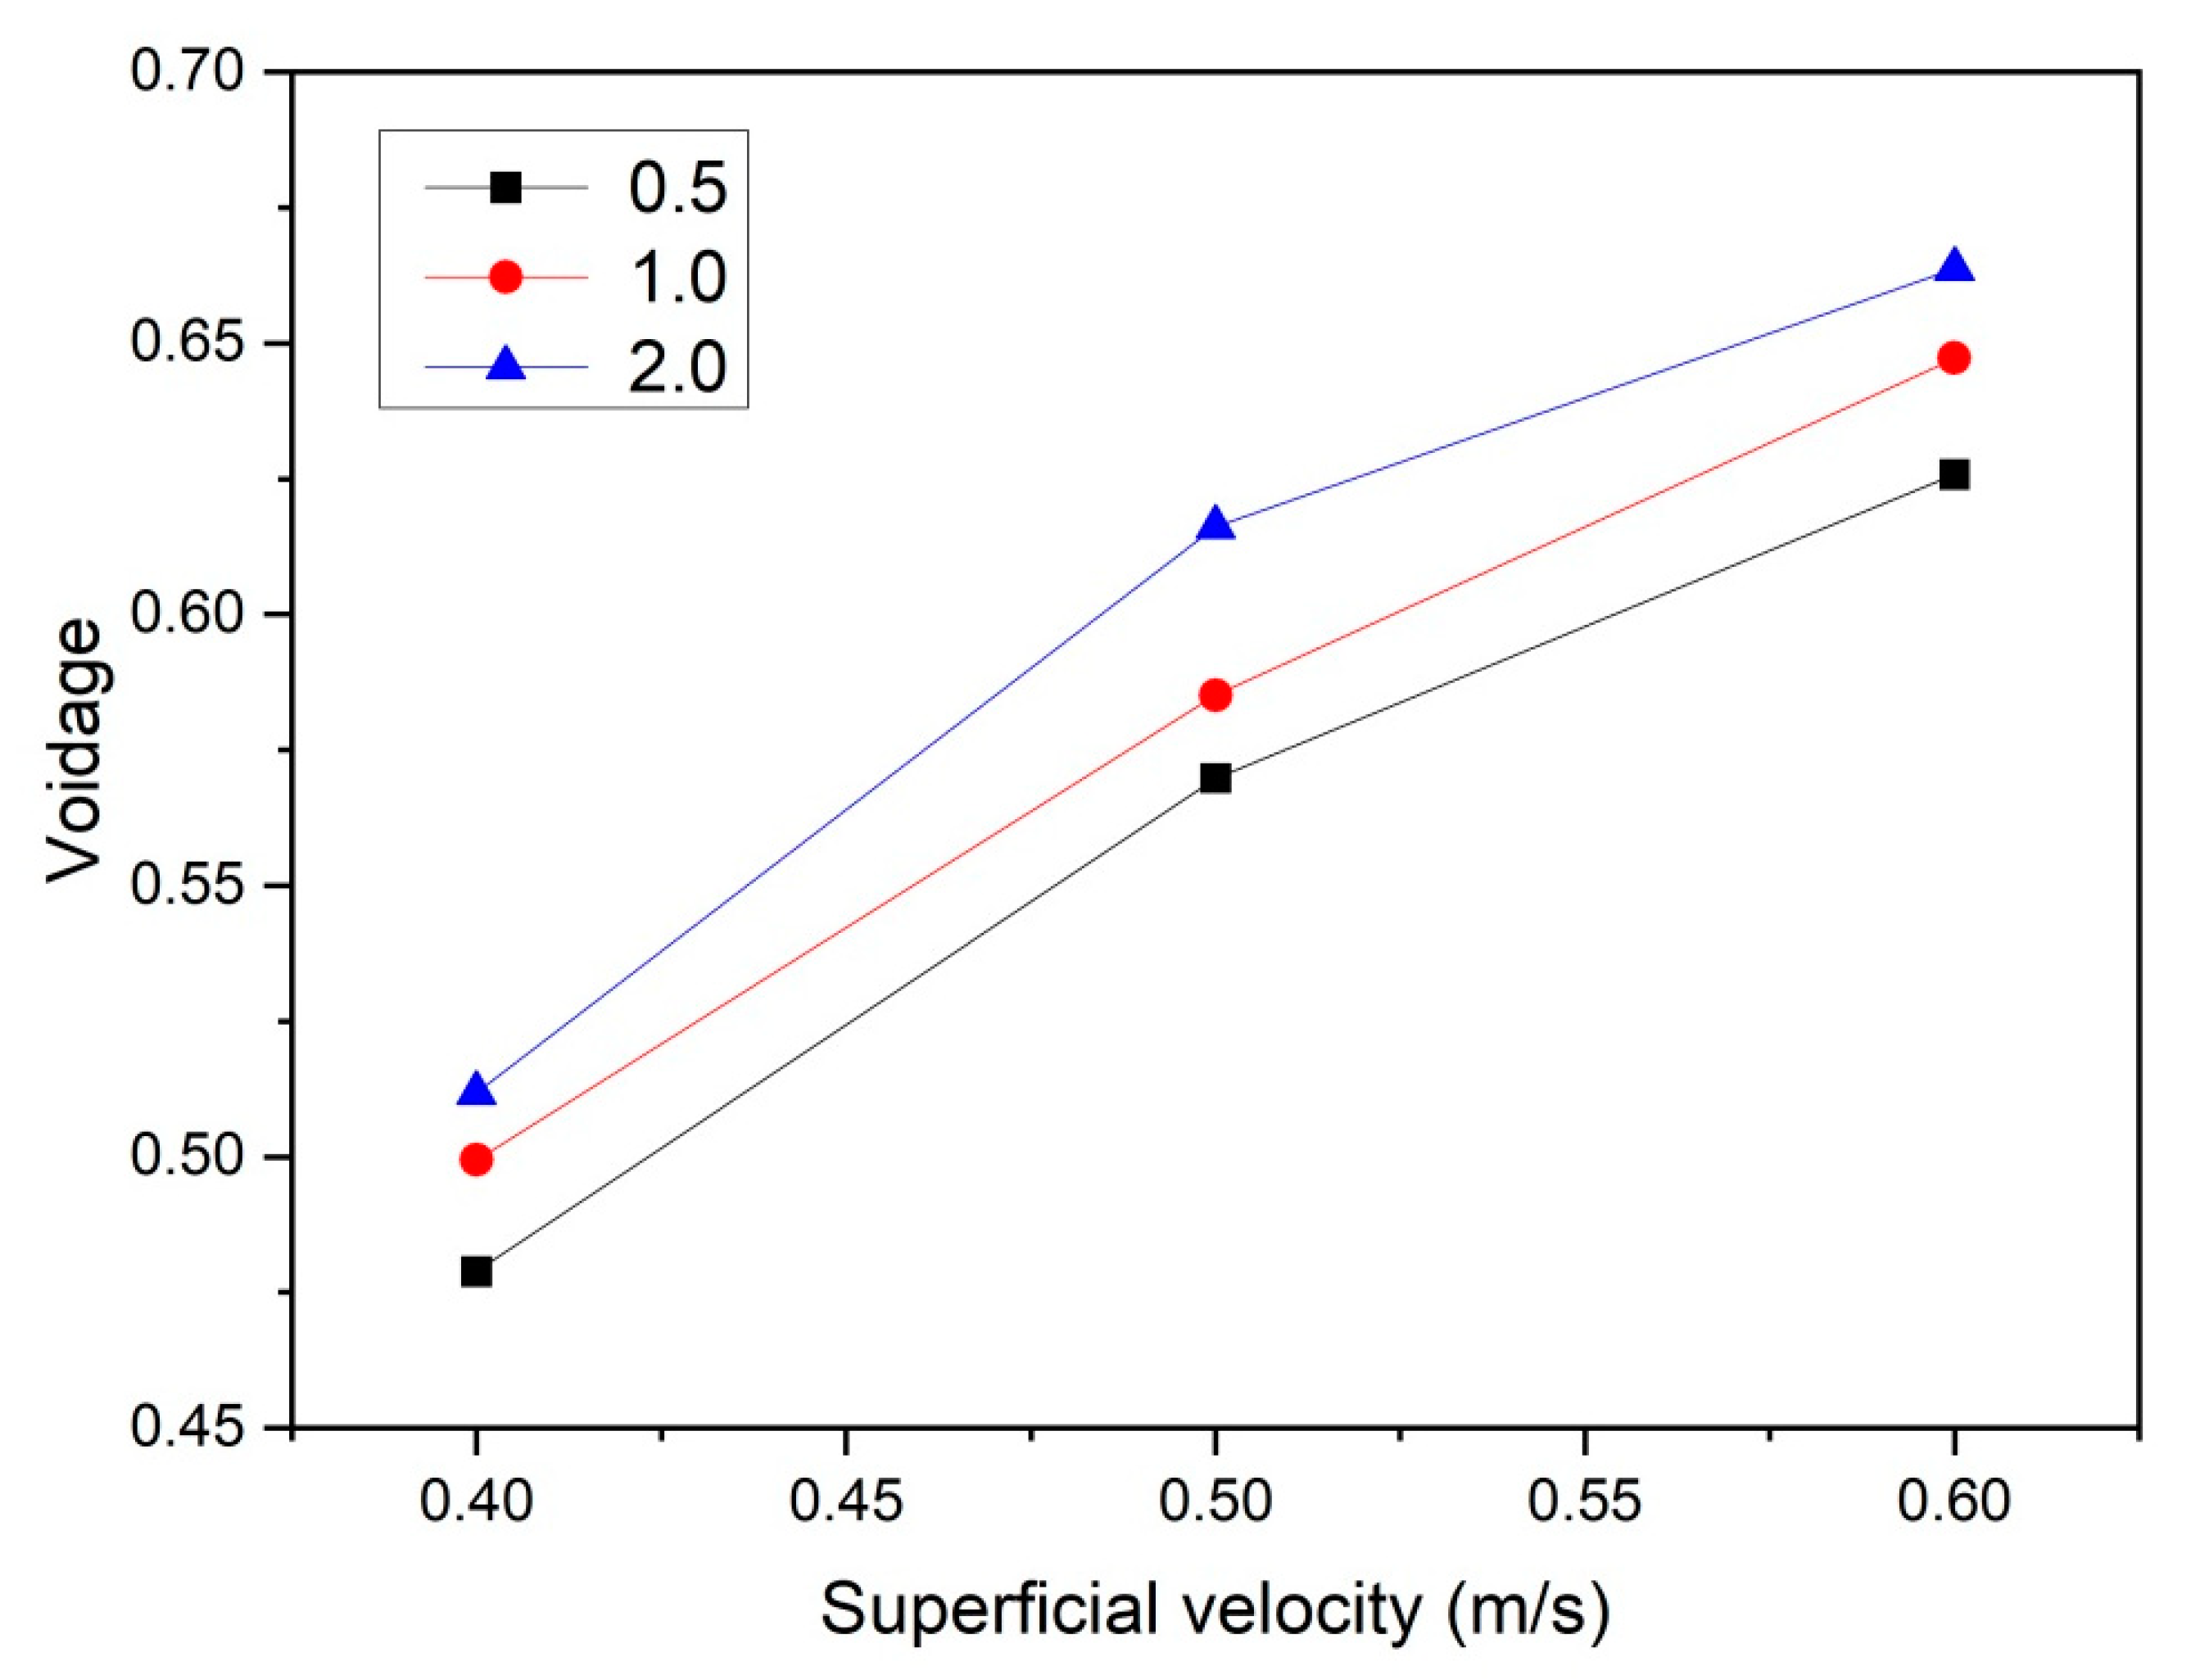
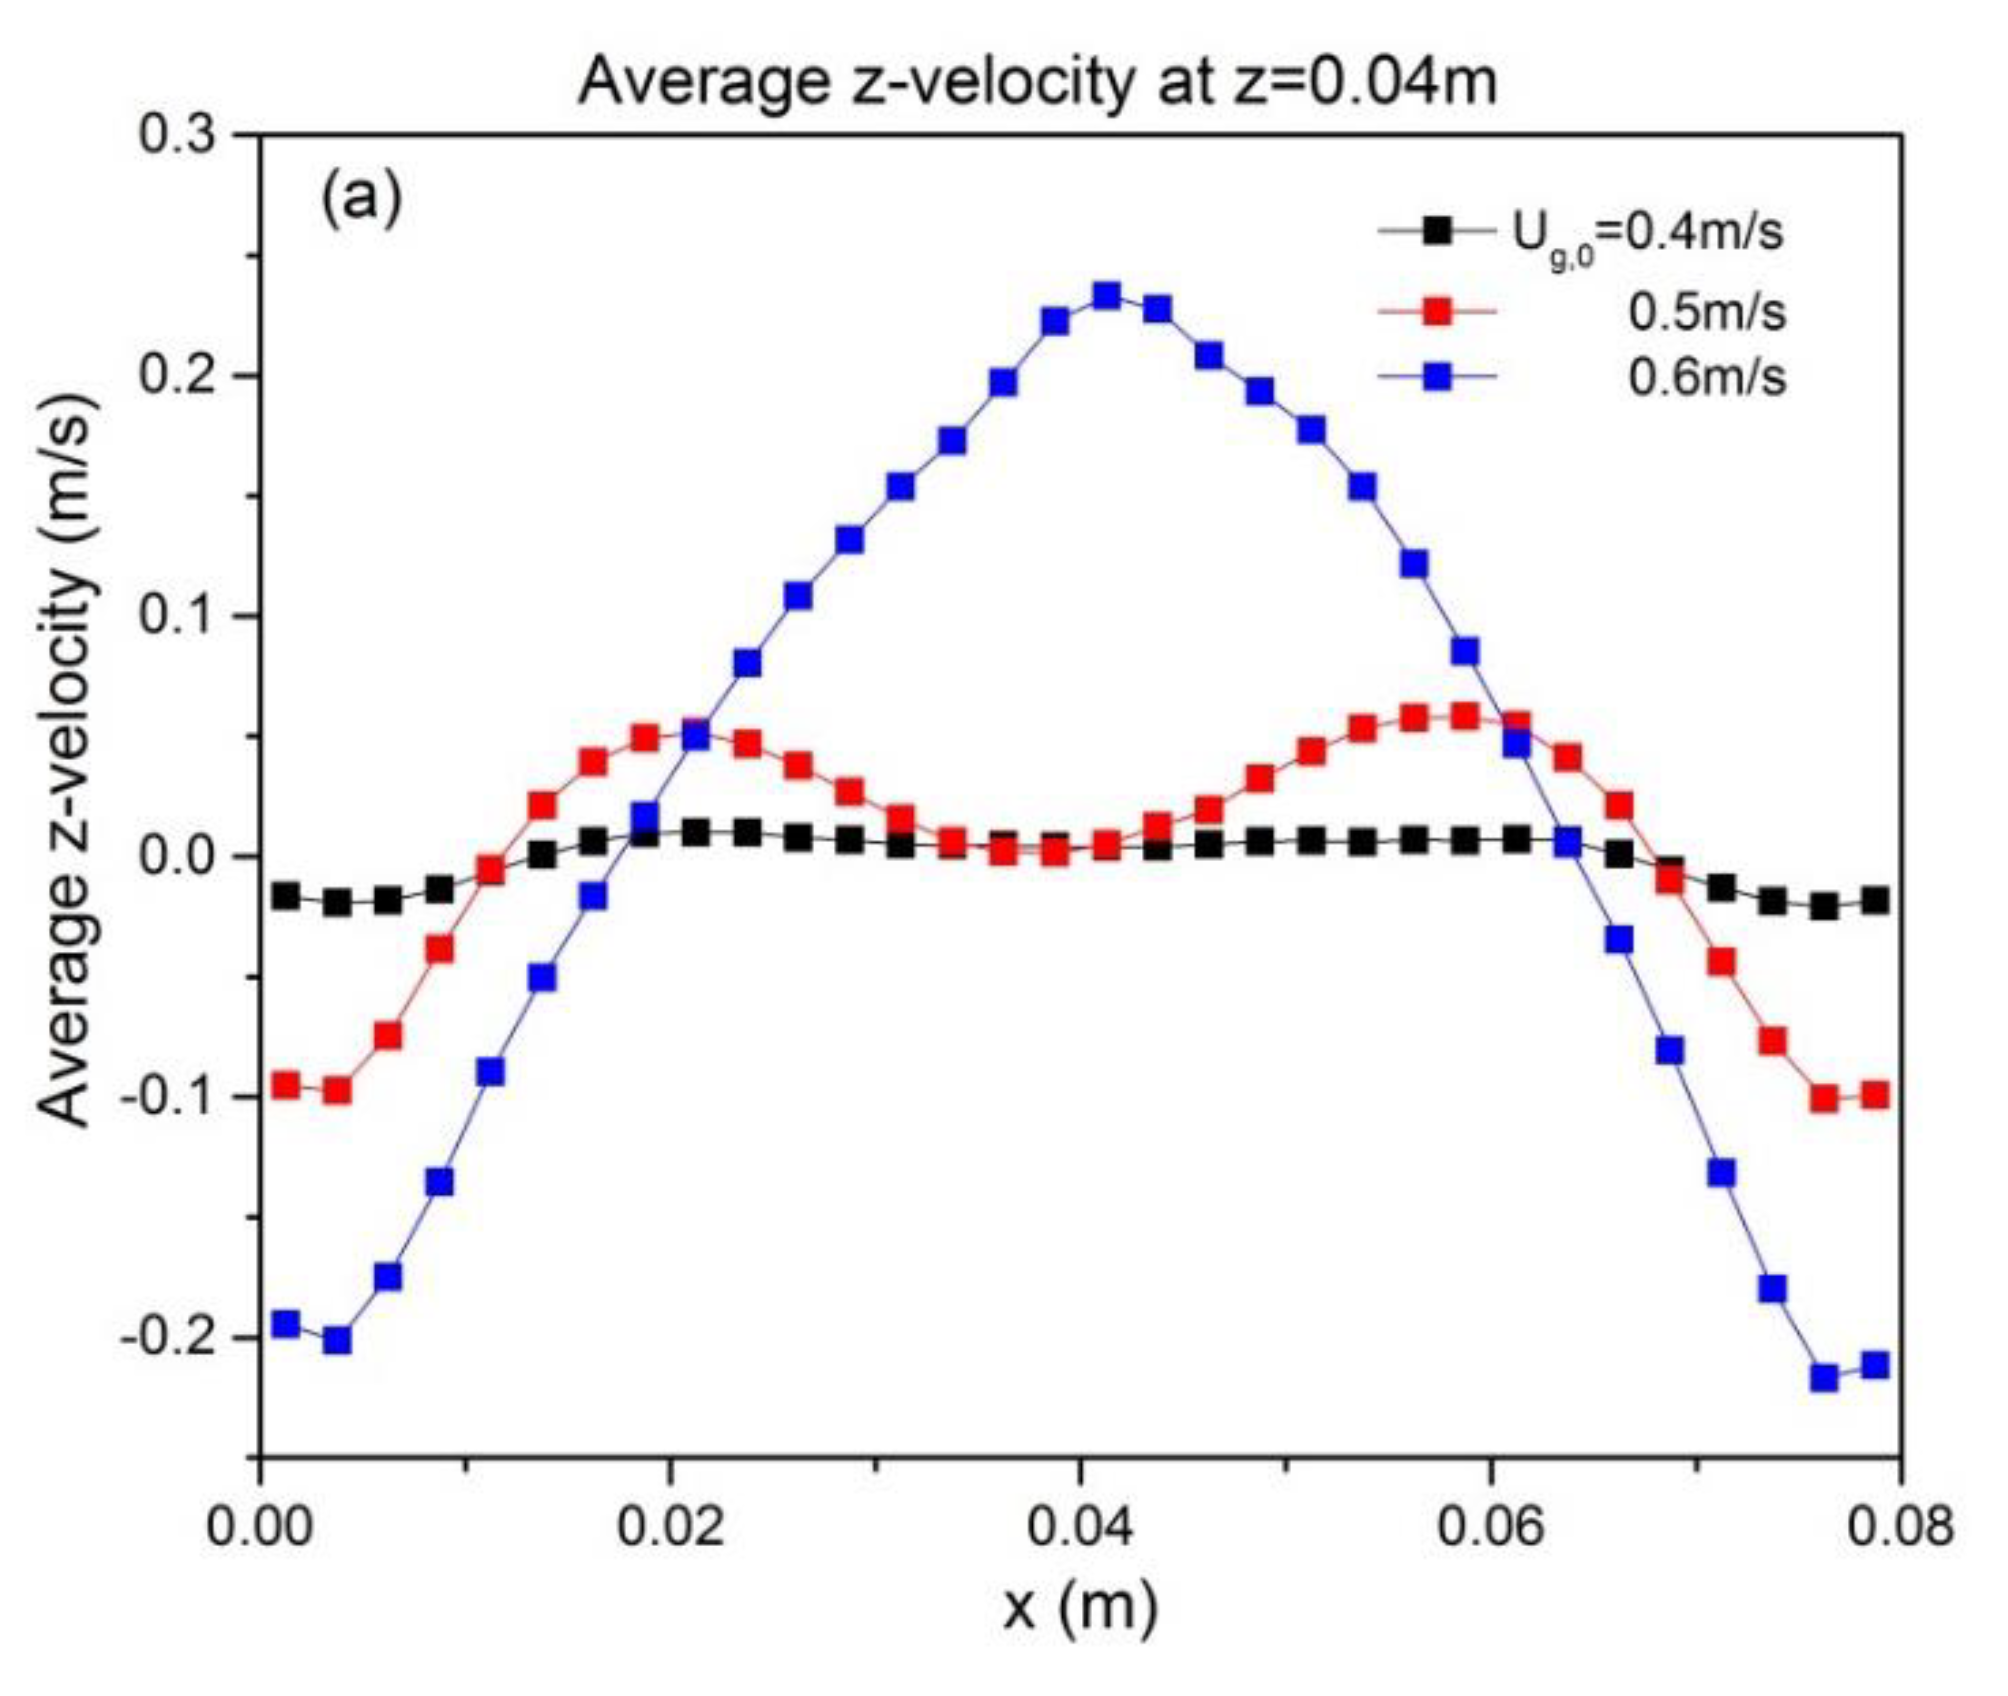
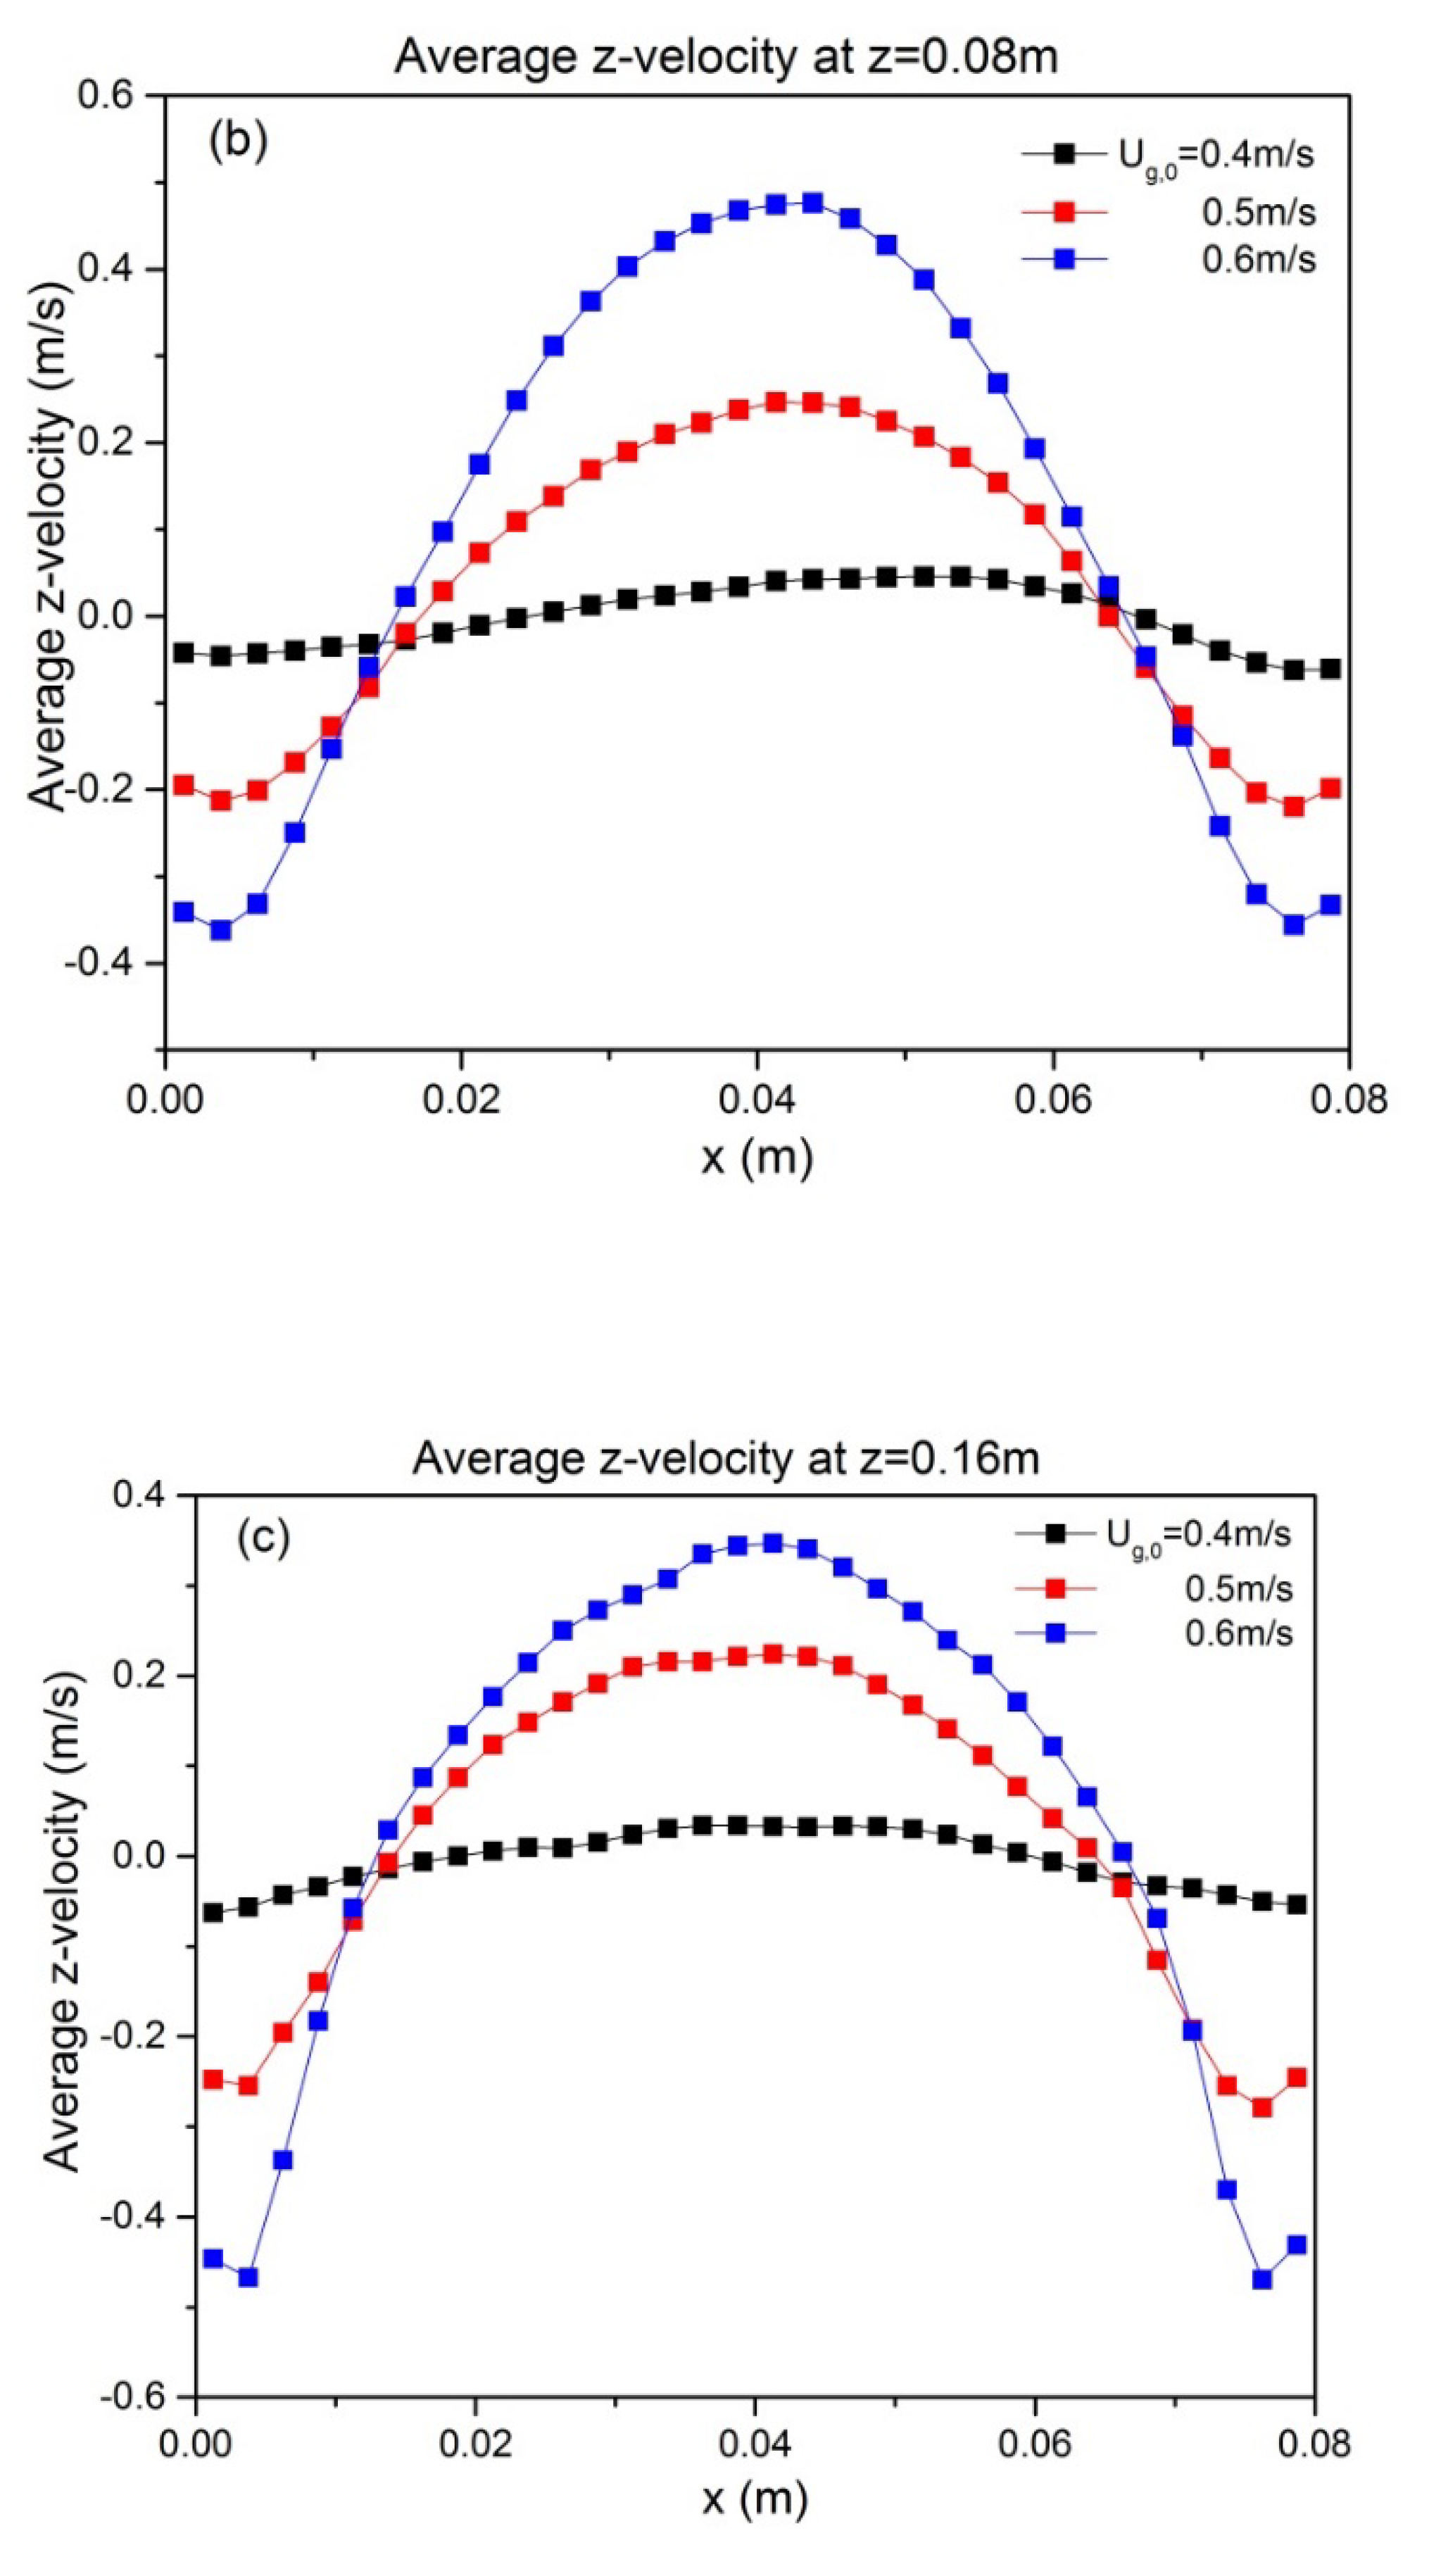
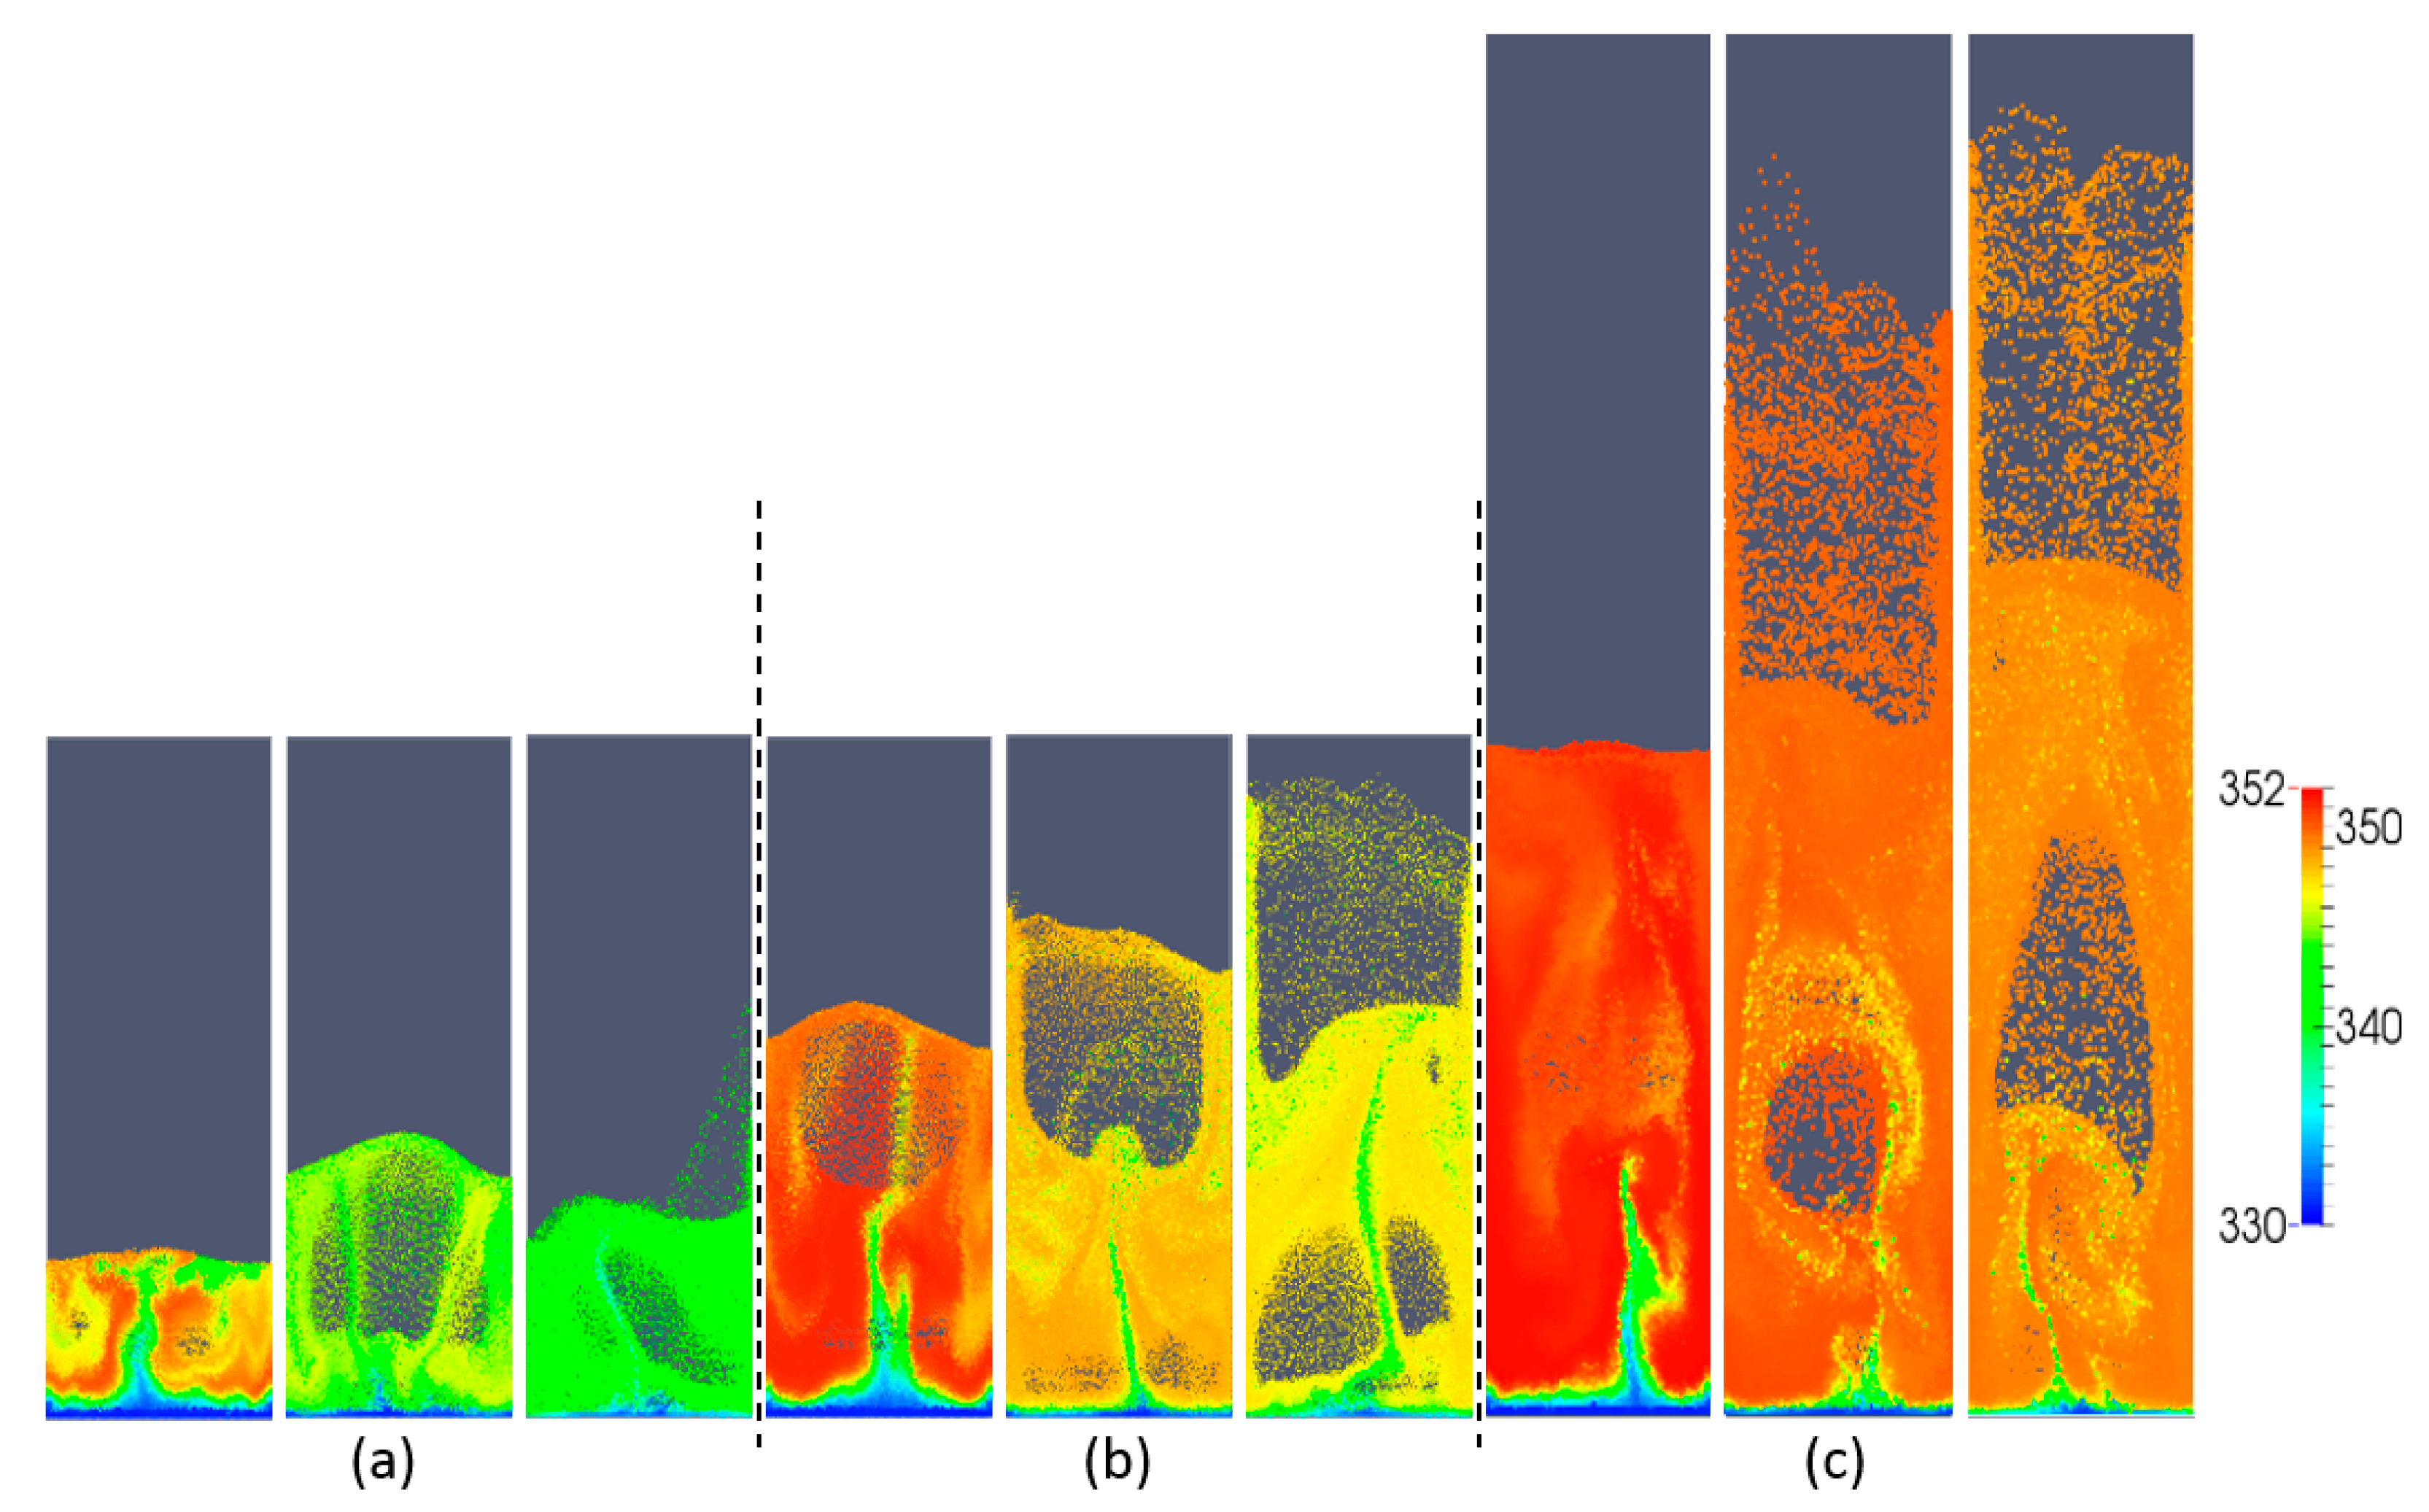
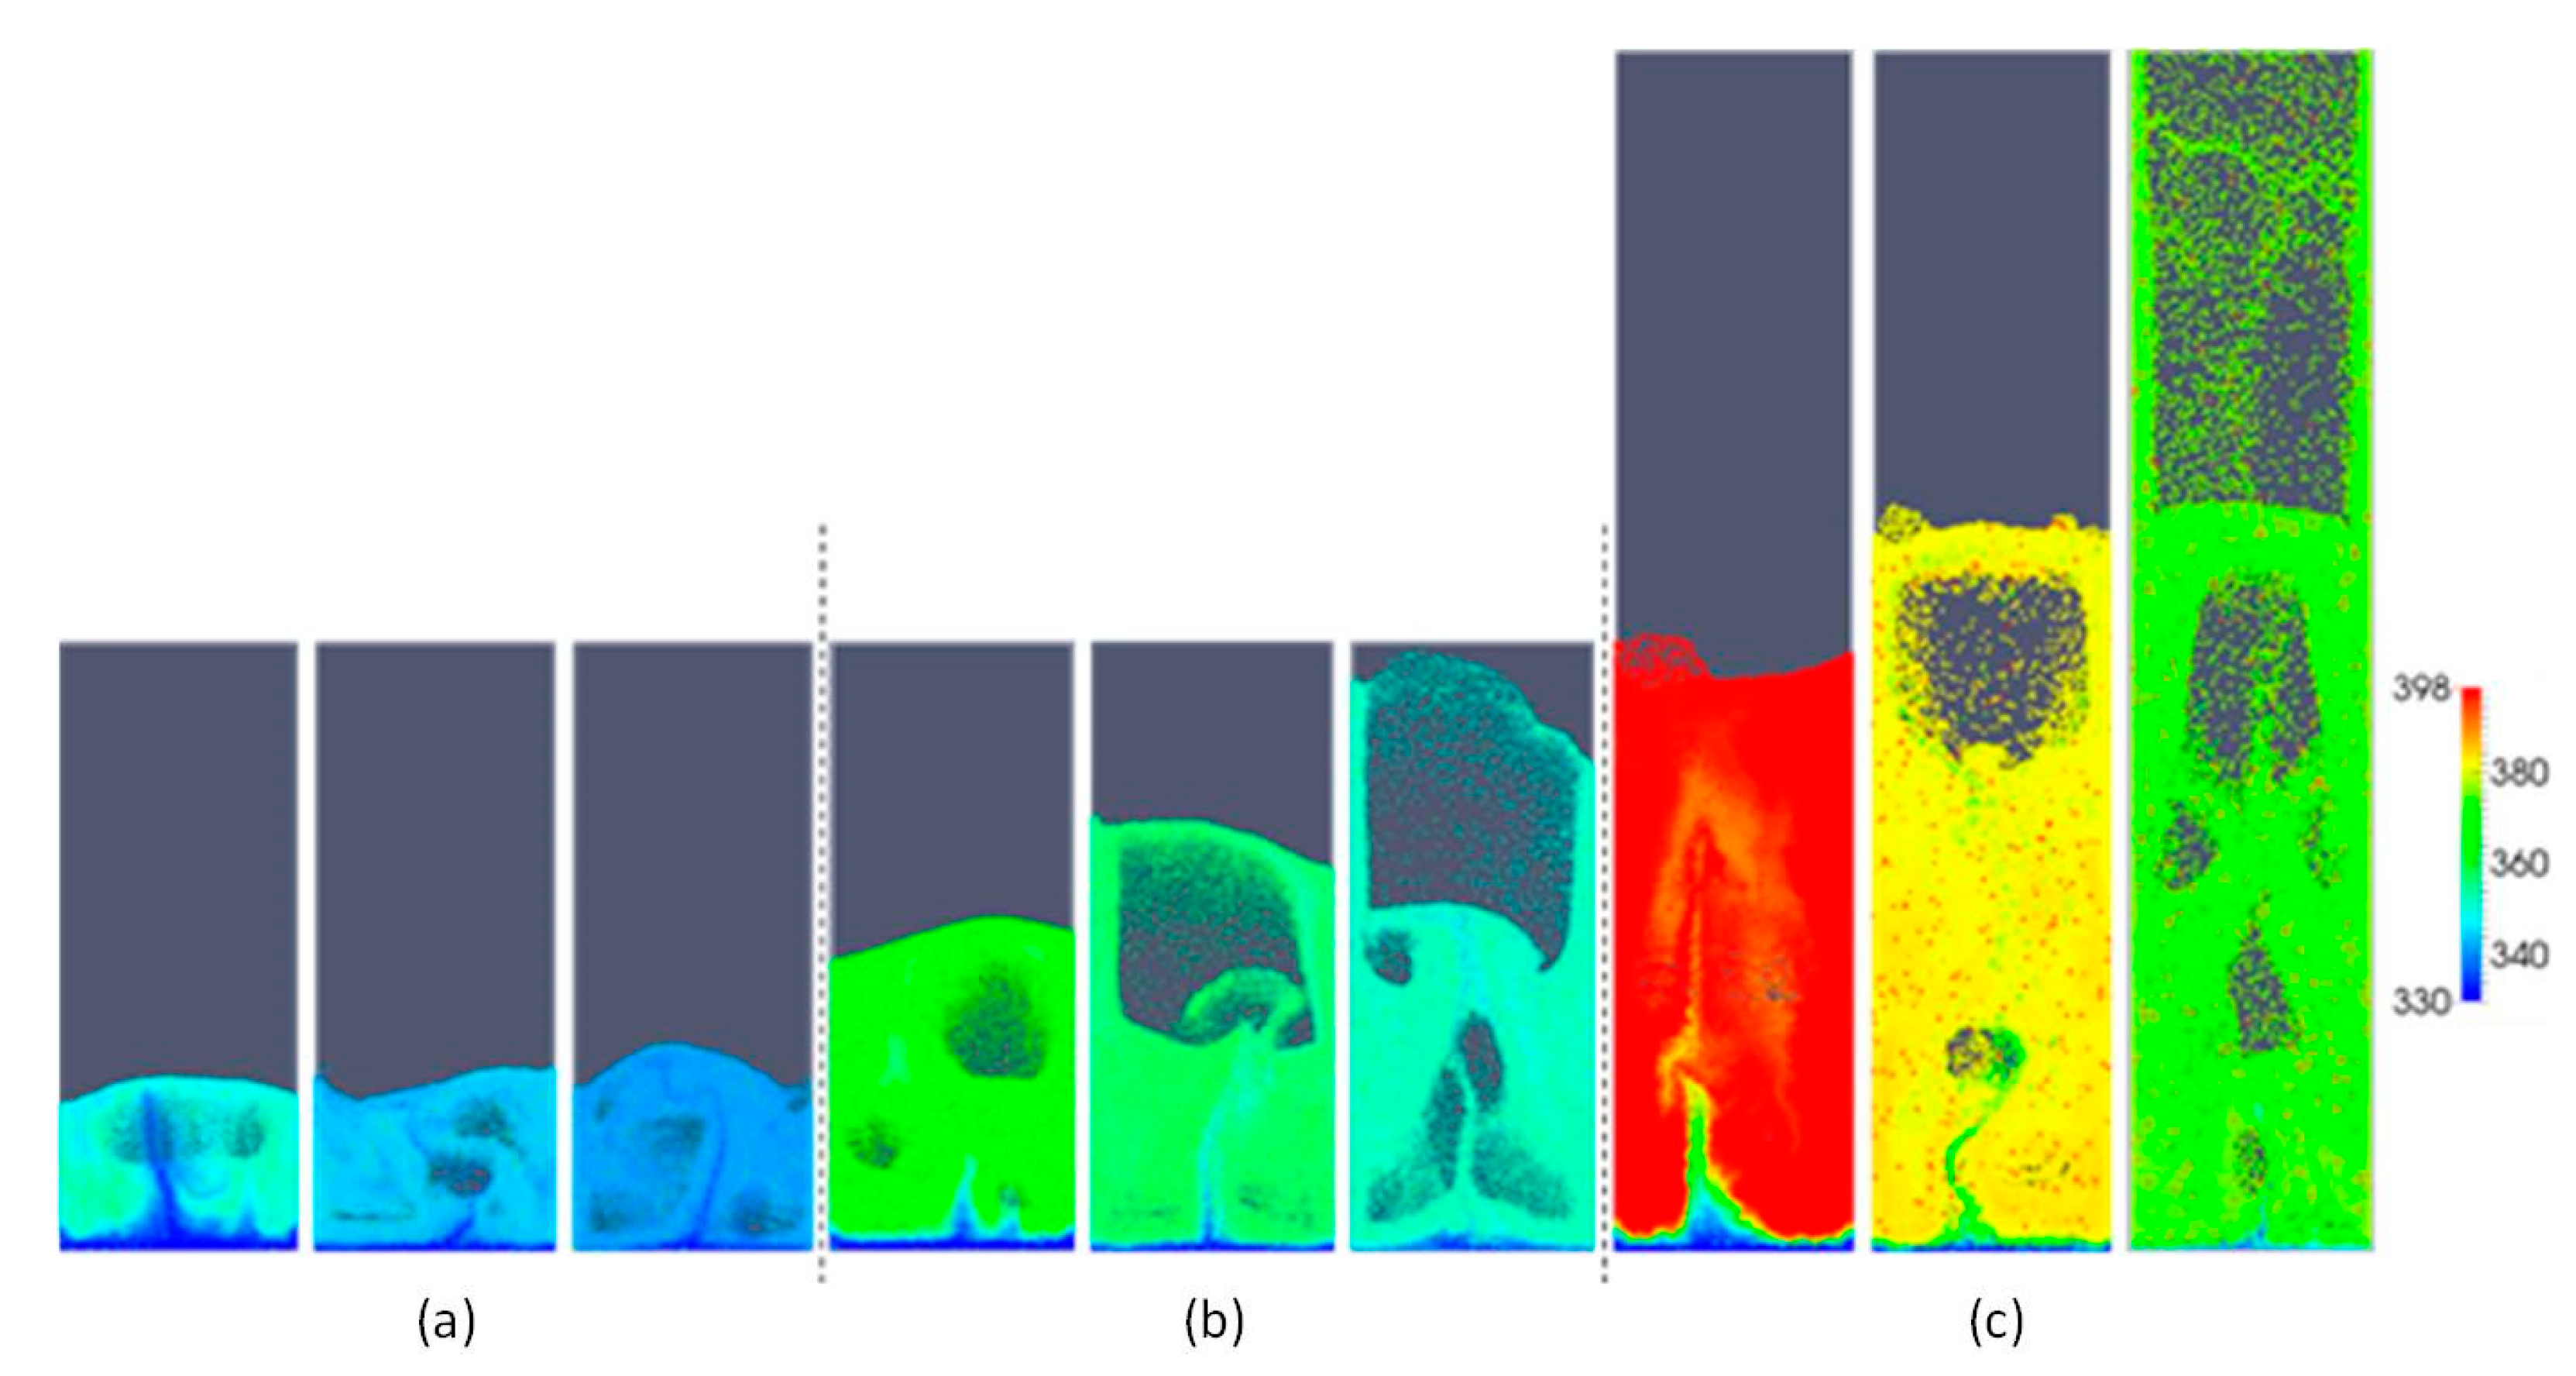
5.1. Effect of Superficial Velocity and Aspect Ratio on Bed Hydrodynamic Behavior

Figure 4 shows snapshots of the typical volume fraction distribution under conditions for each of the three simulated aspect ratios and superficial gas velocities. From this figure, it is apparent that bubbles grow in size as the gas superficial velocity is increased. From animations, it was observed that bubbles move more chaotically when the superficial gas velocity increases. This effect becomes more apparent with increasing H0/W.
To quantify the effect of the gas superficial velocity and initial bed height on bubble behavior, the temporally and spatially averaged gas porosity was obtained from the last 8 s of simulation data. It was found that 8 s of simulation time was sufficient to obtain well-converged results. In Figure 5, it is shown that the overall mean bed voidage increases more or less proportionally with increasing u0. When the superficial gas velocity increases, the differences of averaged voidage between different aspect ratios increase, which is in line with the observations from Figure 4.
To quantify the effect of ug,0 and H0/W on the solids motion, the temporally and spatially averaged particle velocity was obtained from the last 8 s of simulation data. The time-averaged vertical particle velocities at z = H0, as a function of superficial gas velocity and aspect ratio, are depicted in Figure 6. It can be seen that particle velocity is affected by superficial gas velocity as follows: both the up-flow in the core and the down-flow in the annulus are enhanced. This can be attributed to enhanced bubble action. The bed hydrodynamics is also influenced by the aspect ratio, as indicated by the altered shape of the time-averaged vertical velocity. When the initial bed height increases, the up-flow in the core region becomes larger. This reveals that a higher aspect ratio promotes intensified upward solids motion.

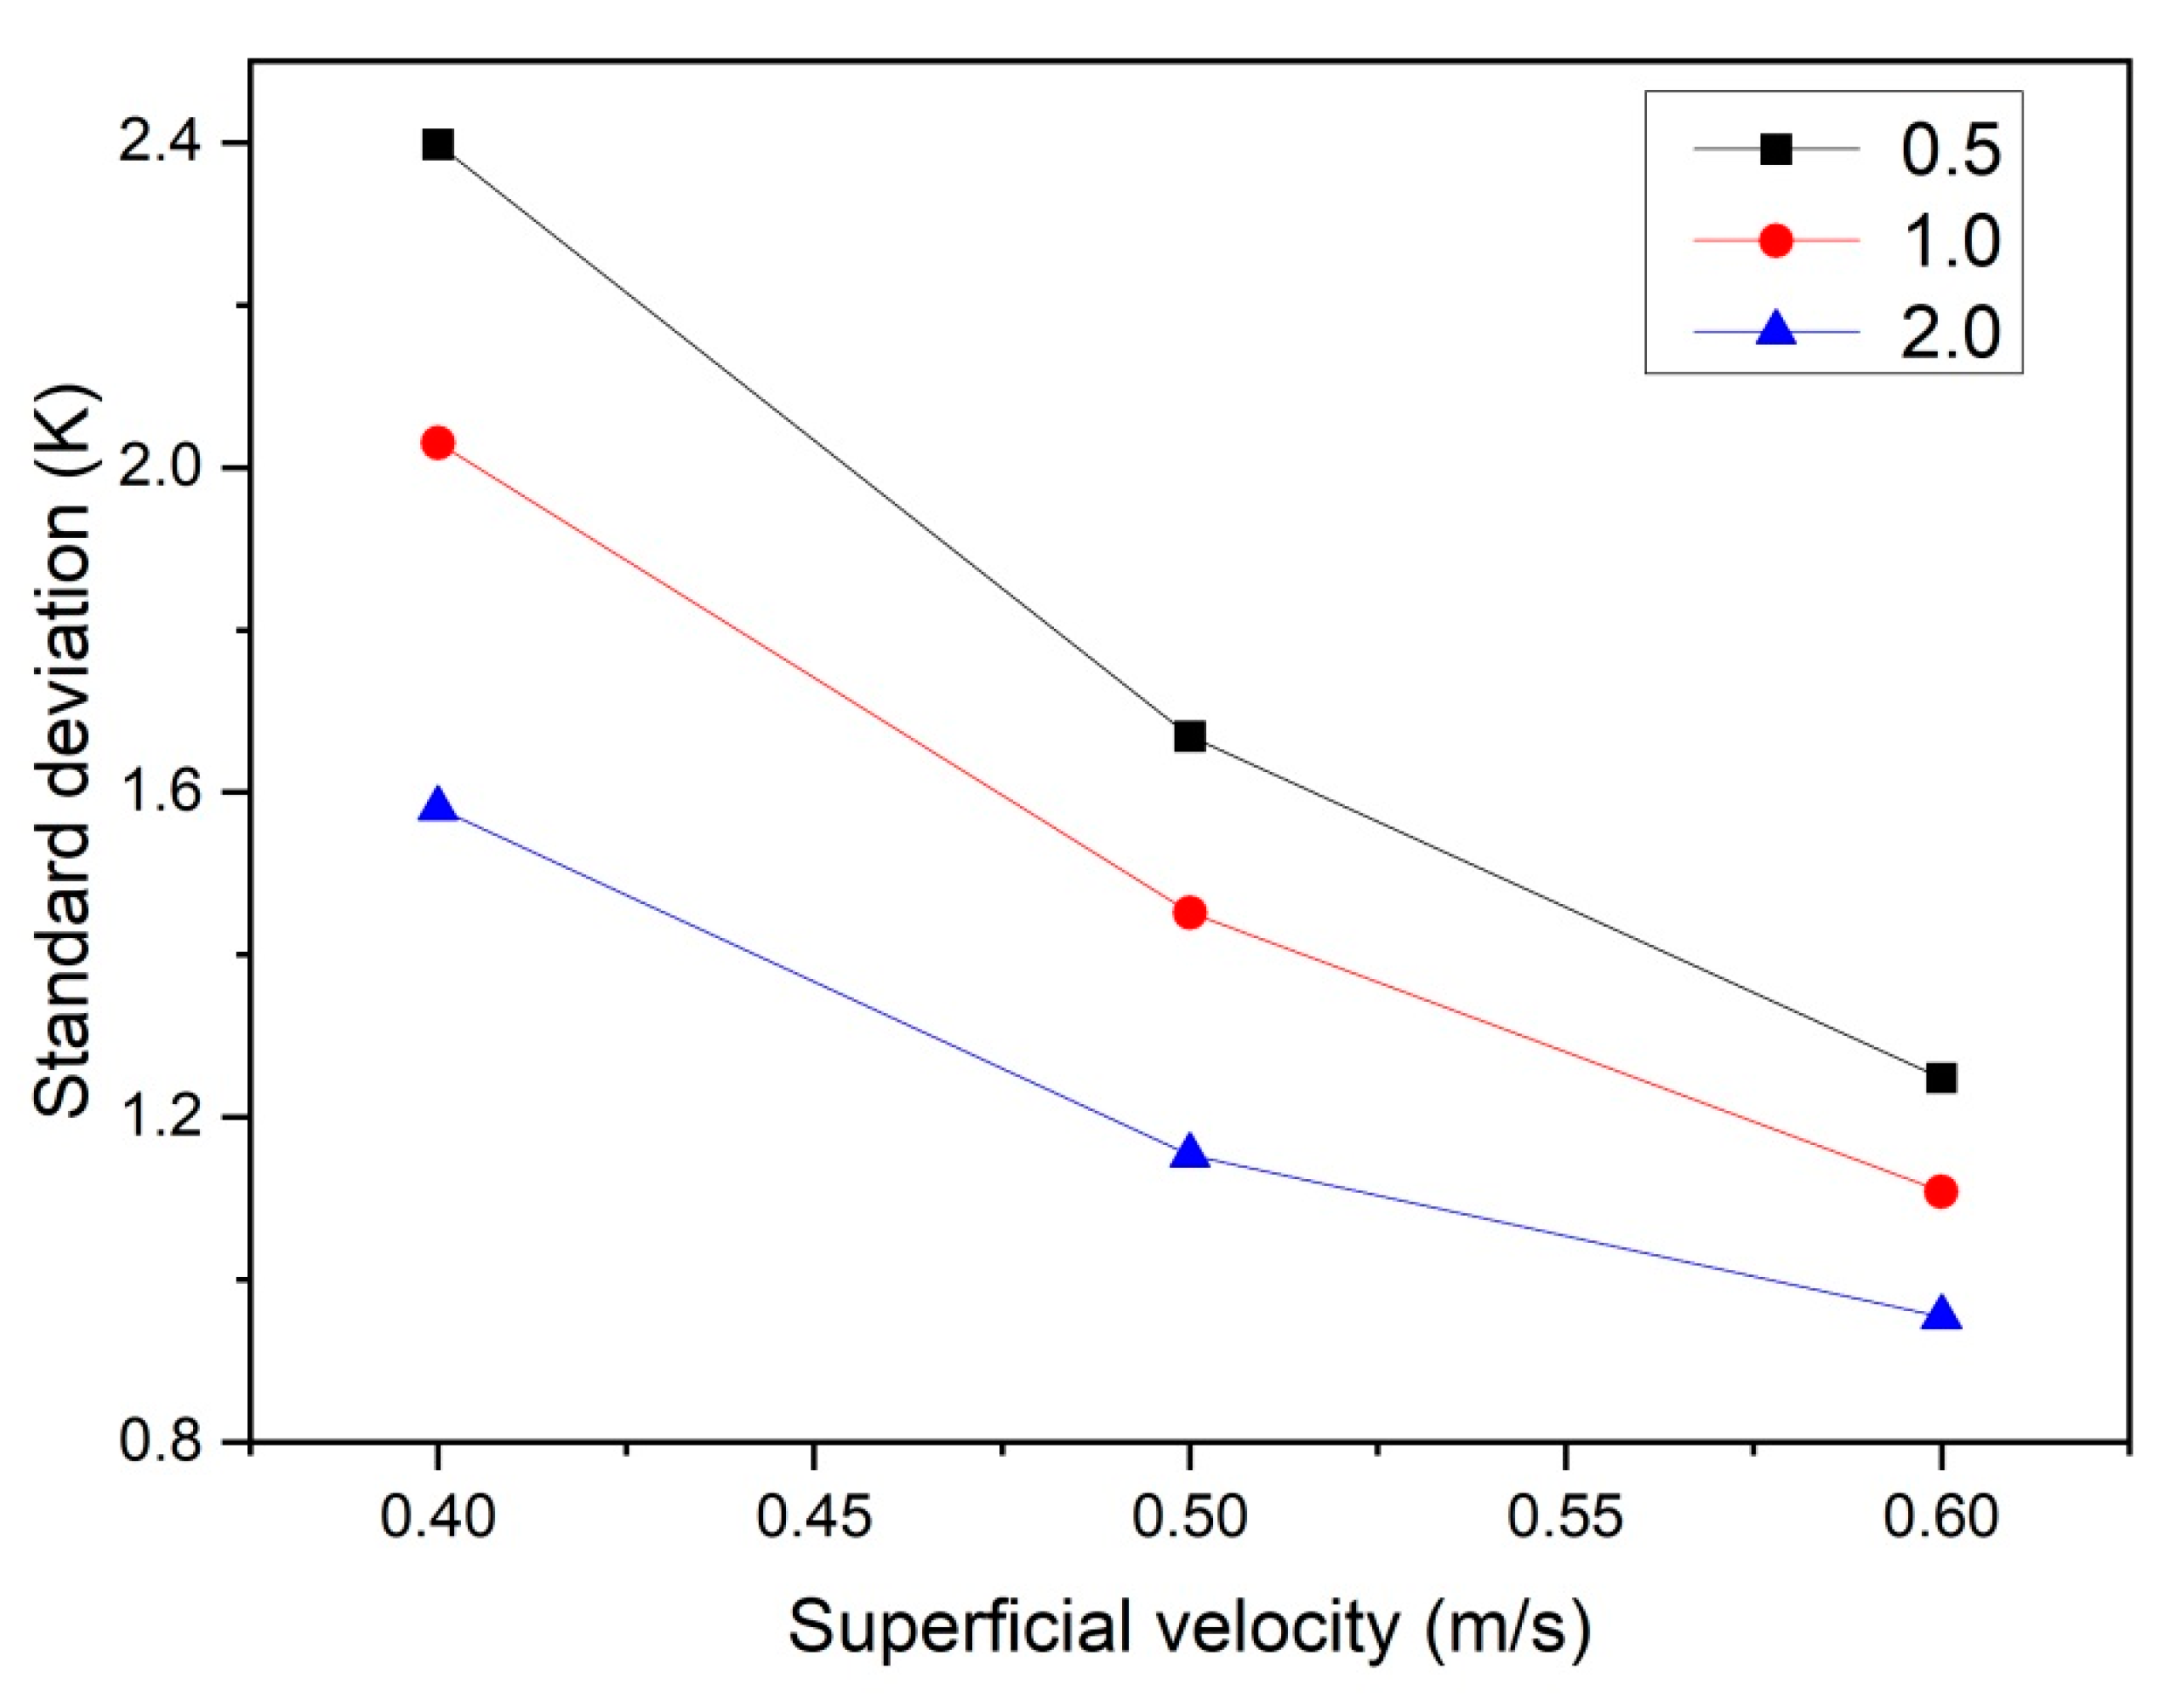
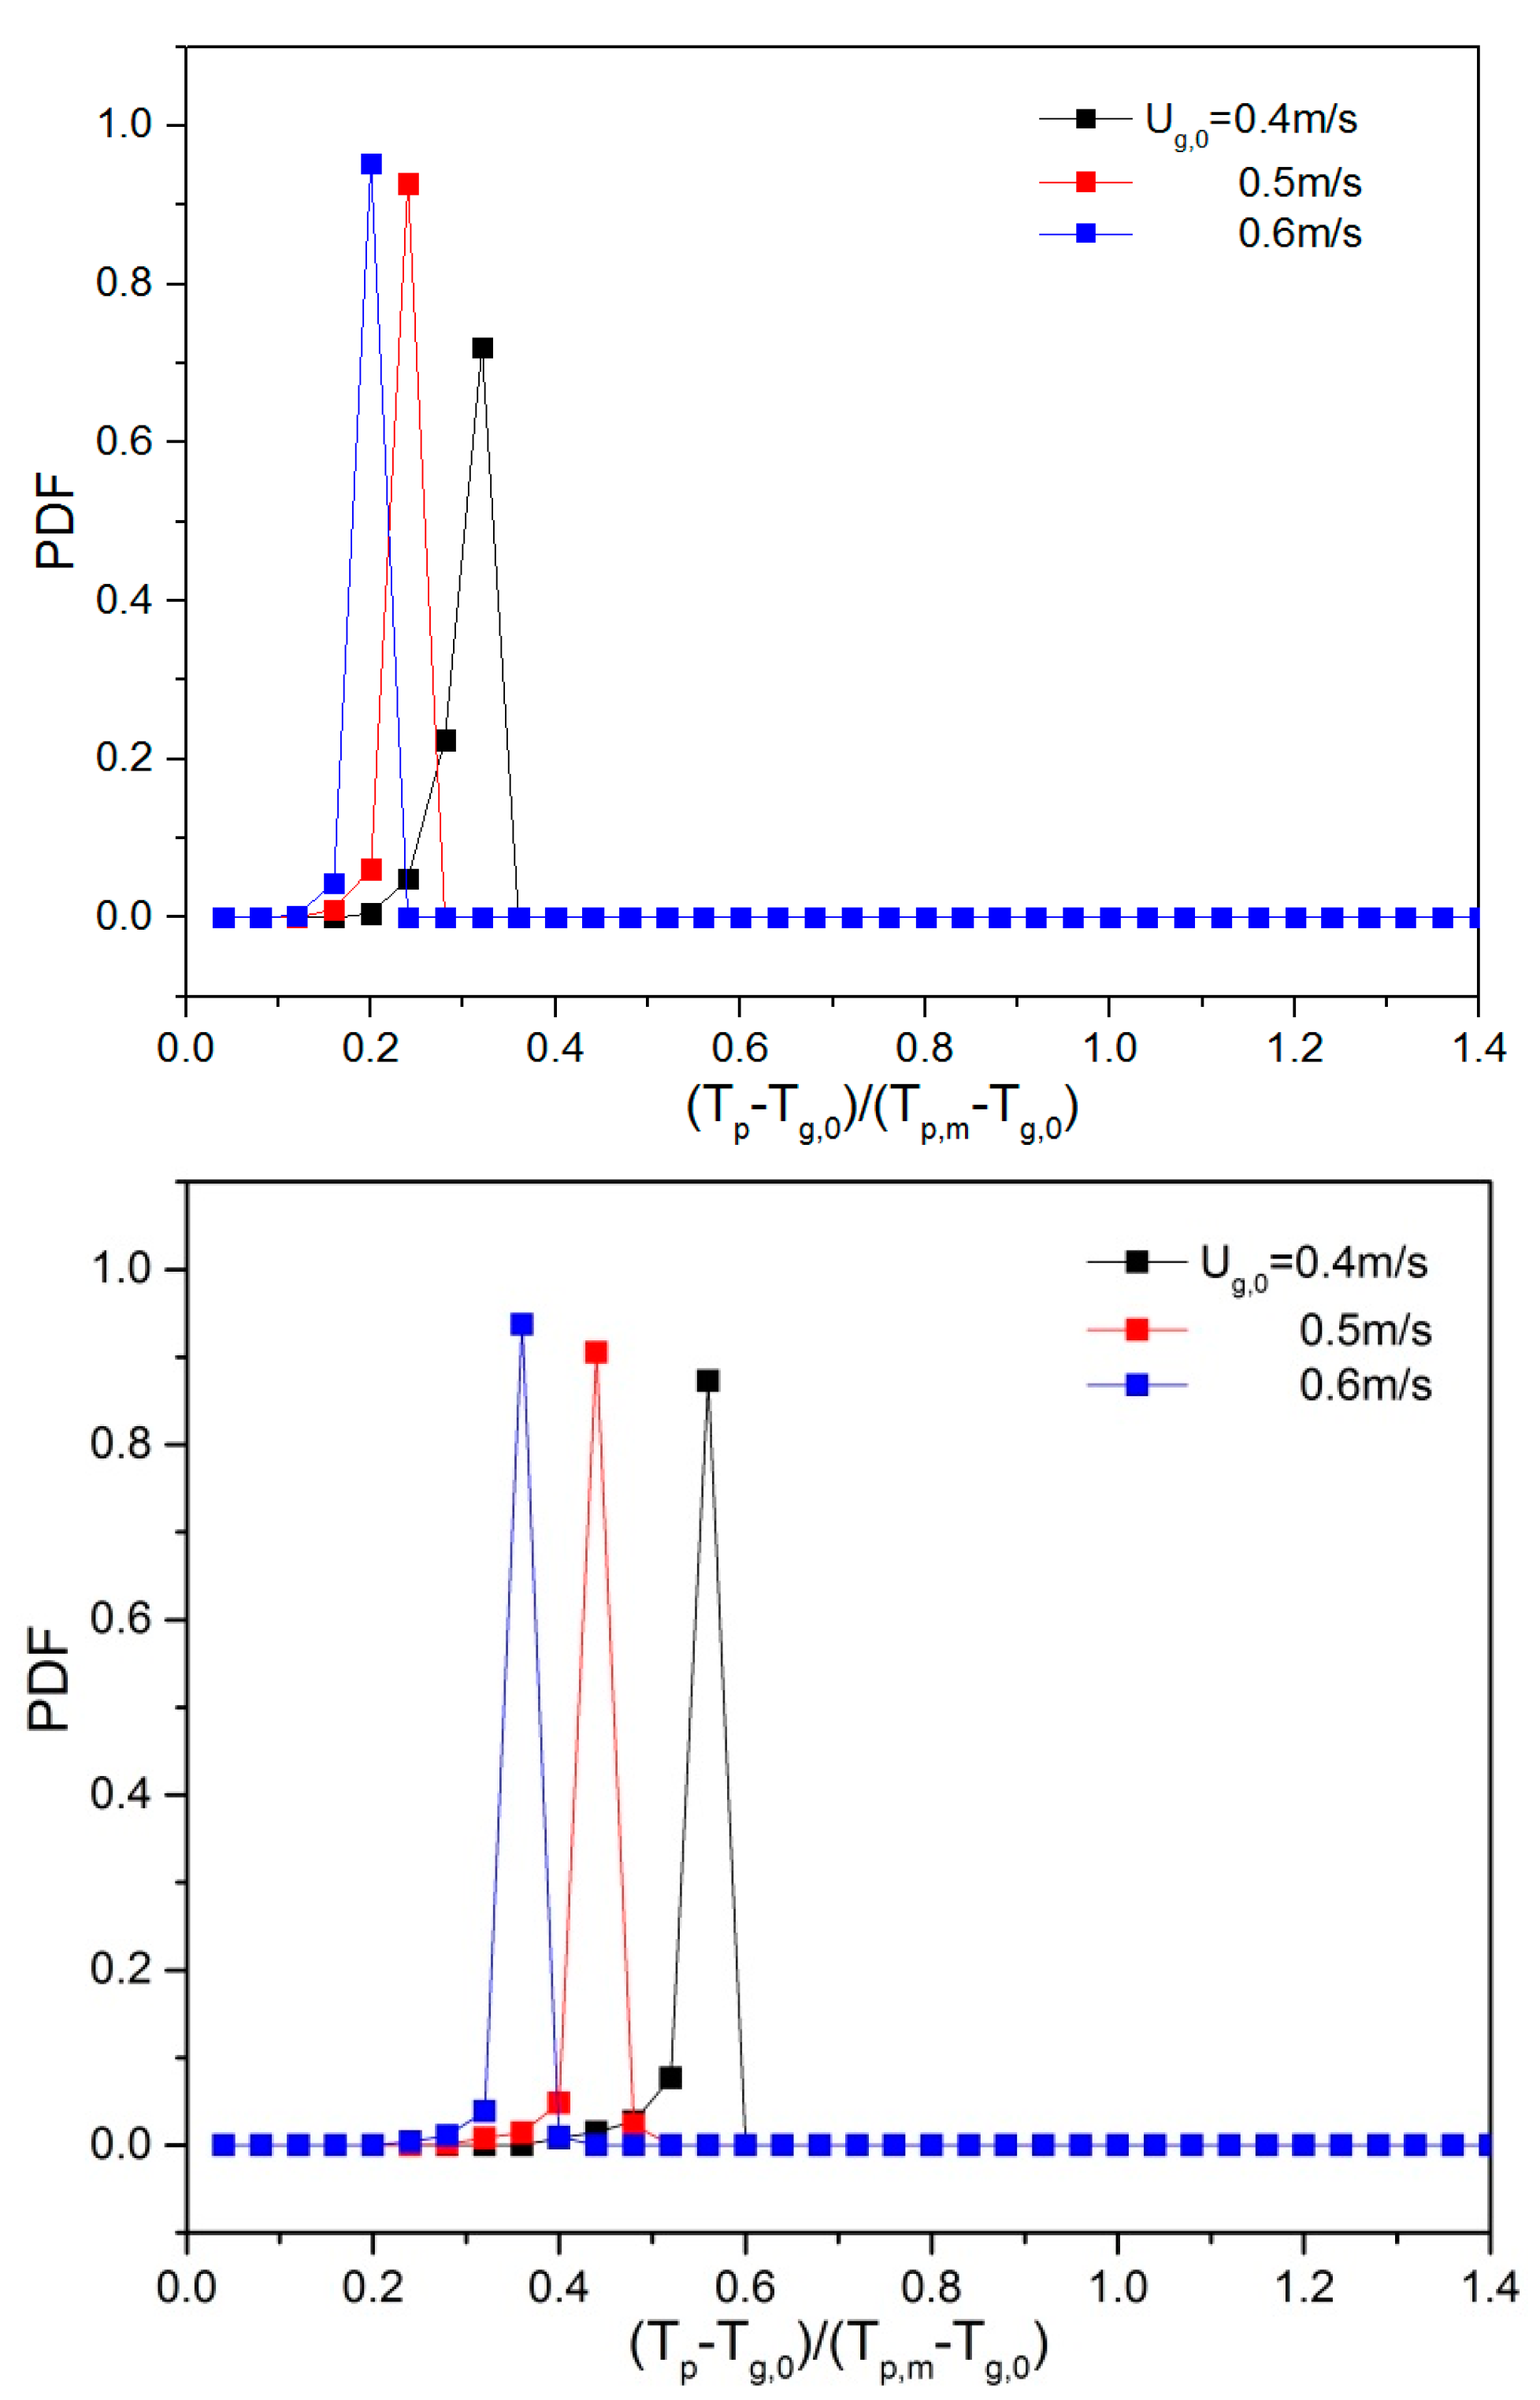
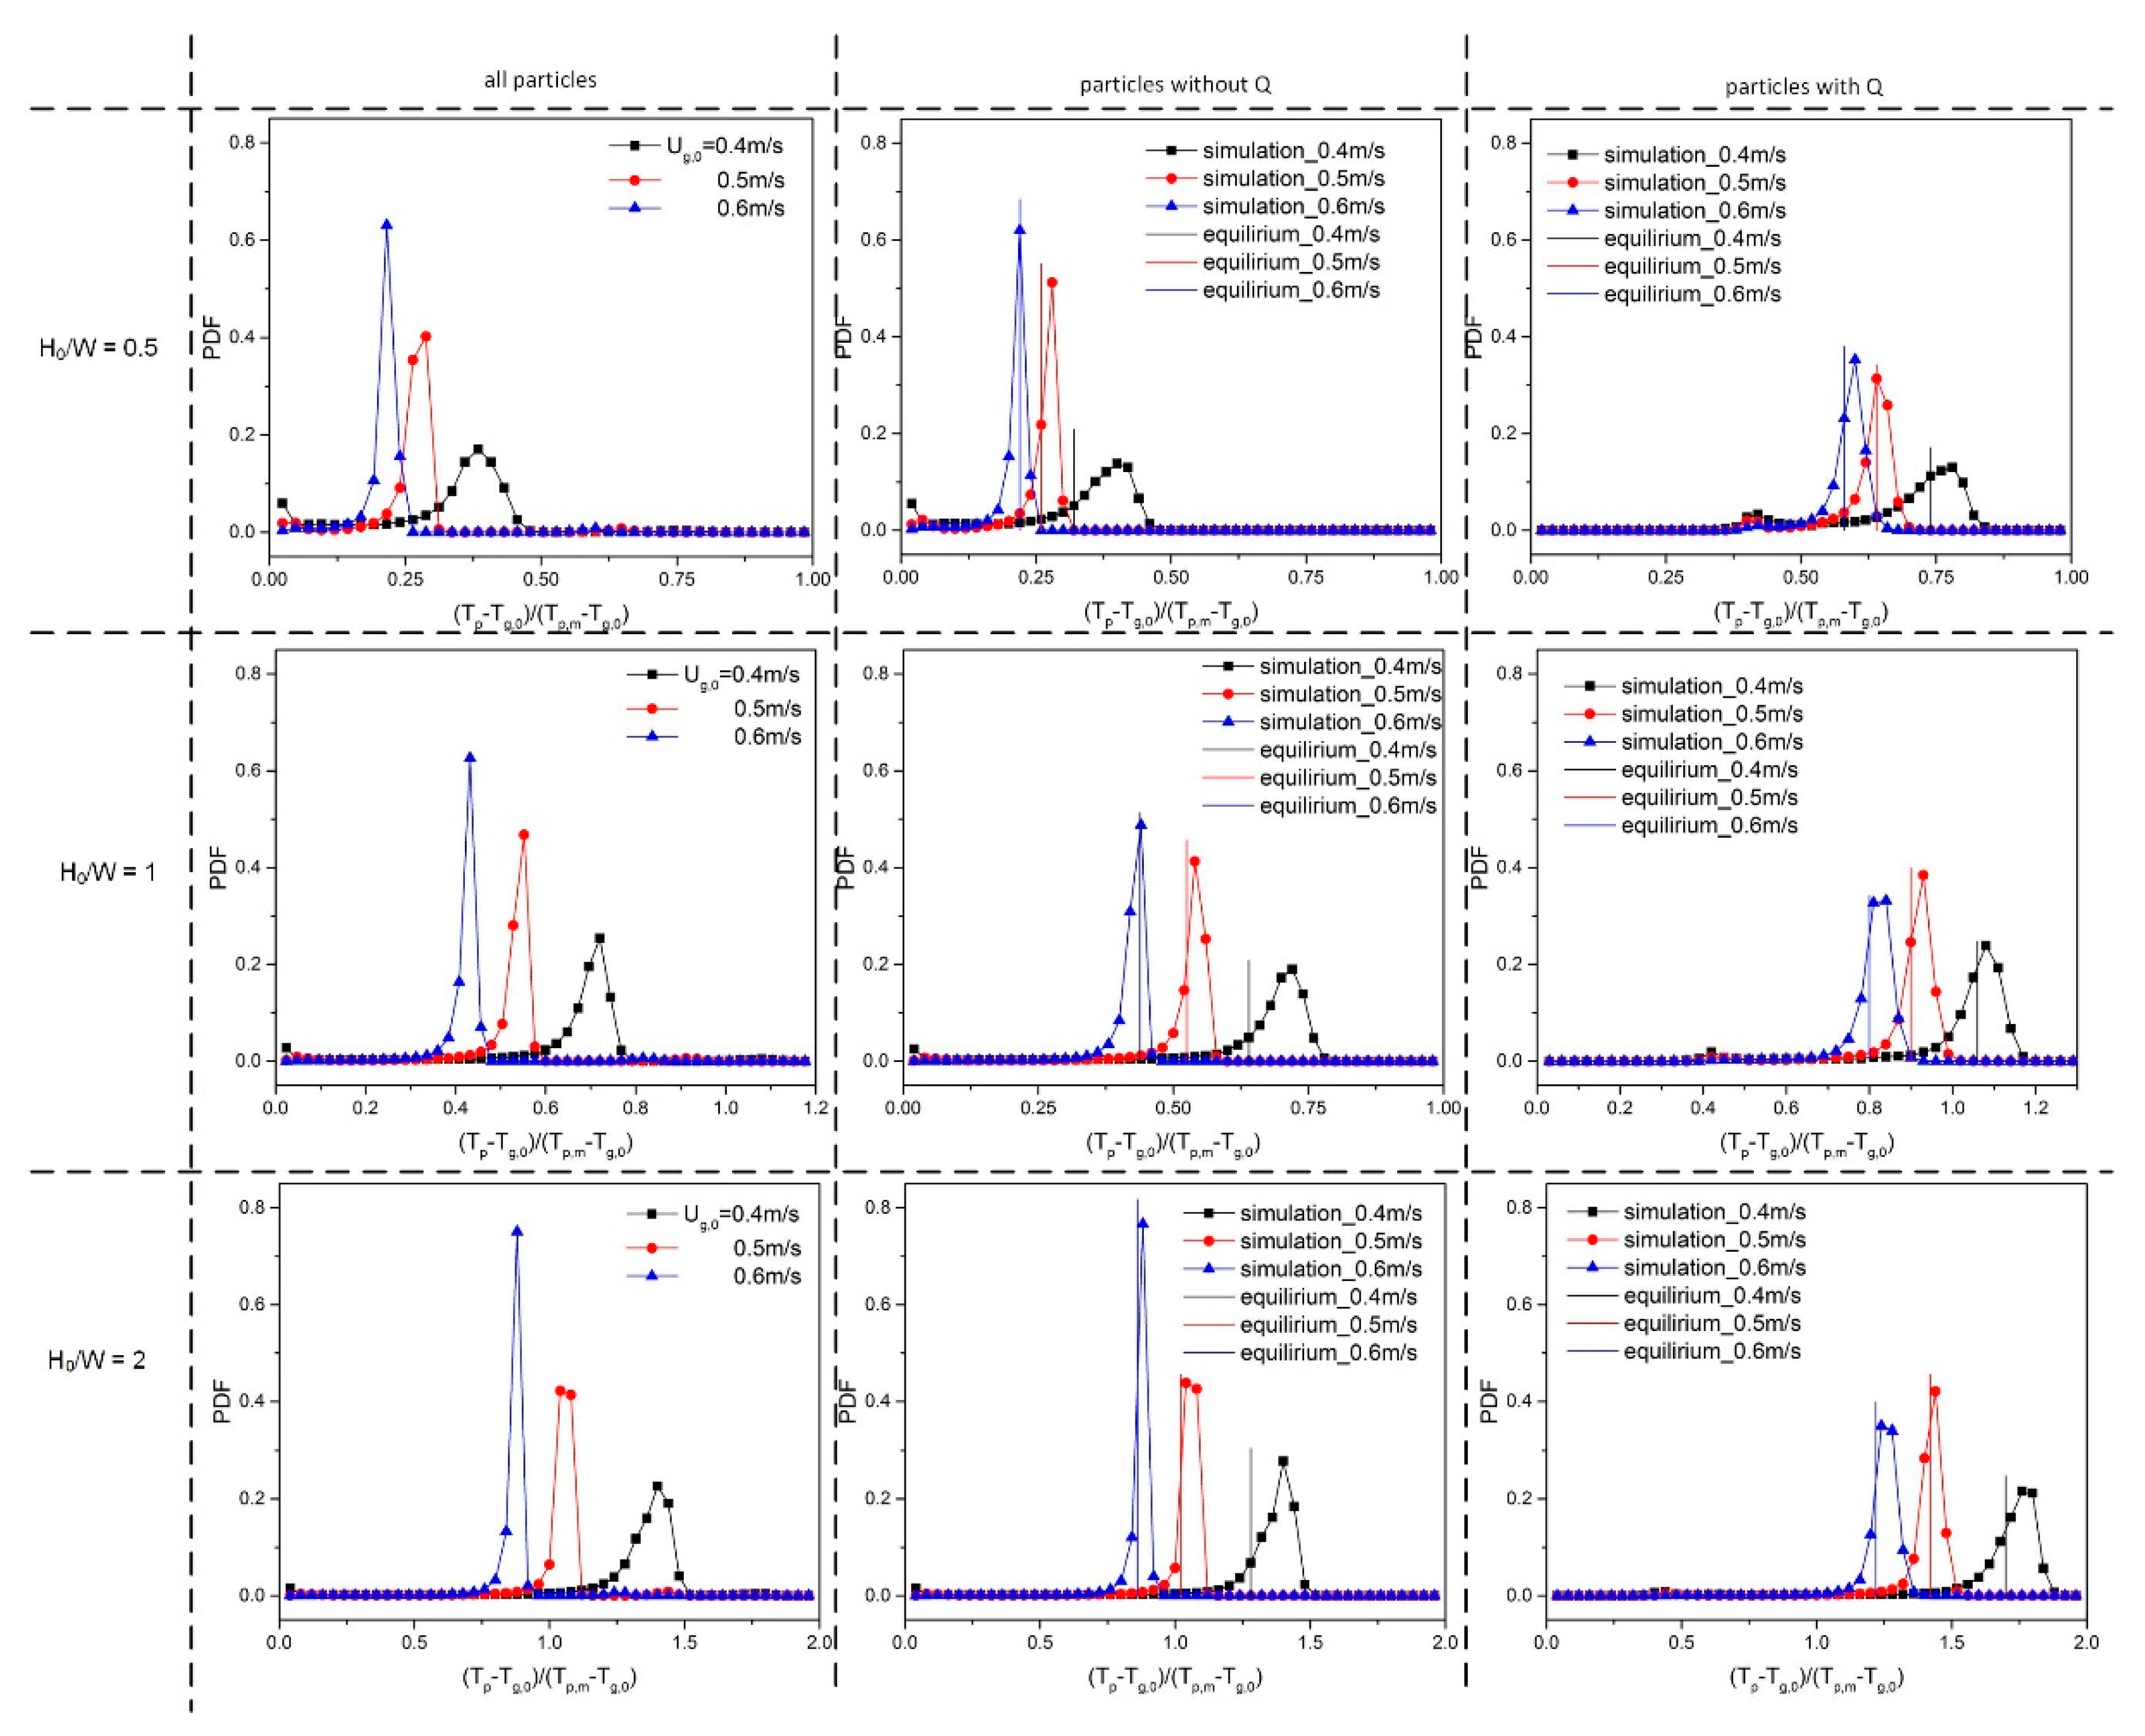
5.2. Effect of Superficial Velocity and Aspect Ratio on Heat Transfer Behavior

In this section, we focus on the effect of the gas superficial velocity and bed aspect ratio on the gas–particle heat transfer behavior. Figure 7 shows snapshots of the particle temperature at different gas superficial velocities and aspect ratios. With increasing superficial velocity, it is obvious that the particle temperature is more homogeneous. This can be explained by the fact that the particles become better-mixed and the heat transfer rate between gas and particles is more intense. The whole bed temperature increases with increasing aspect ratio, which can be explained by the fact that with increasing H0/W, the bed mass increases, and hence, the associated overall heat source in the bed also increases.
To characterize the bed thermal behavior, the temporal- and spatial-averaged particle temperature was calculated, along with the standard deviation of the particle temperature. Figure 8 shows the standard deviation (defined in Equation (14)) of the particle temperature as a function of the superficial velocity and bed aspect ratio. As can be seen, when the gas superficial velocity increases, the temperature standard deviation decreases in all cases. This can be explained by the fact that at higher u0, the bed is better-mixed and hence becomes more isothermal. Moreover, at higher aspect ratios, the relative influence of entrance effects is reduced and particles become better-mixed, which further reduces the standard deviation of the particle temperature.
σ = 1 N p i = 1 N p ( T p , i T ¯ p ) 2
To quantify the effect of ug,0 and H0/W on the thermal behavior, the probability density function (PDF) of the temperature was calculated. Prior to this, all particle temperatures were non-dimensionalized by subtracting the inlet gas temperature (Tp-Tg,0) and dividing by the driving force, i.e., the particle melting point (Tp,m = 380 K) minus the inlet gas temperature (Tp,m-Tg,0). Dimensionless temperatures of 0 and 1 correspond to a particle temperature equal to the inlet gas temperature and the melting point of the solid material, respectively. Subsequently, the dimensionless temperatures were used as an input to create a probability density function (PDF). This was done by dividing the dimensionless temperature range between 0 and 1 into 25 equal-sized bins. During a simulation period of 0.25–2 s, the number of particles in each of the temperature bins was counted (Li et al., [13]). When ug,0 was increased, the particle temperature PDF changed considerably (see Figure 9). The mean value of the temperature dropped as ug,0 was increased, implying that more heat is removed as more gas is supplied. When the aspect ratio increased, the mean value of dimensionless particle temperature increased, and the dimensionless temperature exceeded 1 at H0/W = 2.0. This can be explained by the fact that at higher initial bed height, there are more particles and, consequently, a stronger heat source in the bed, which will further increase the equilibrium temperature and dimensionless particle temperature.

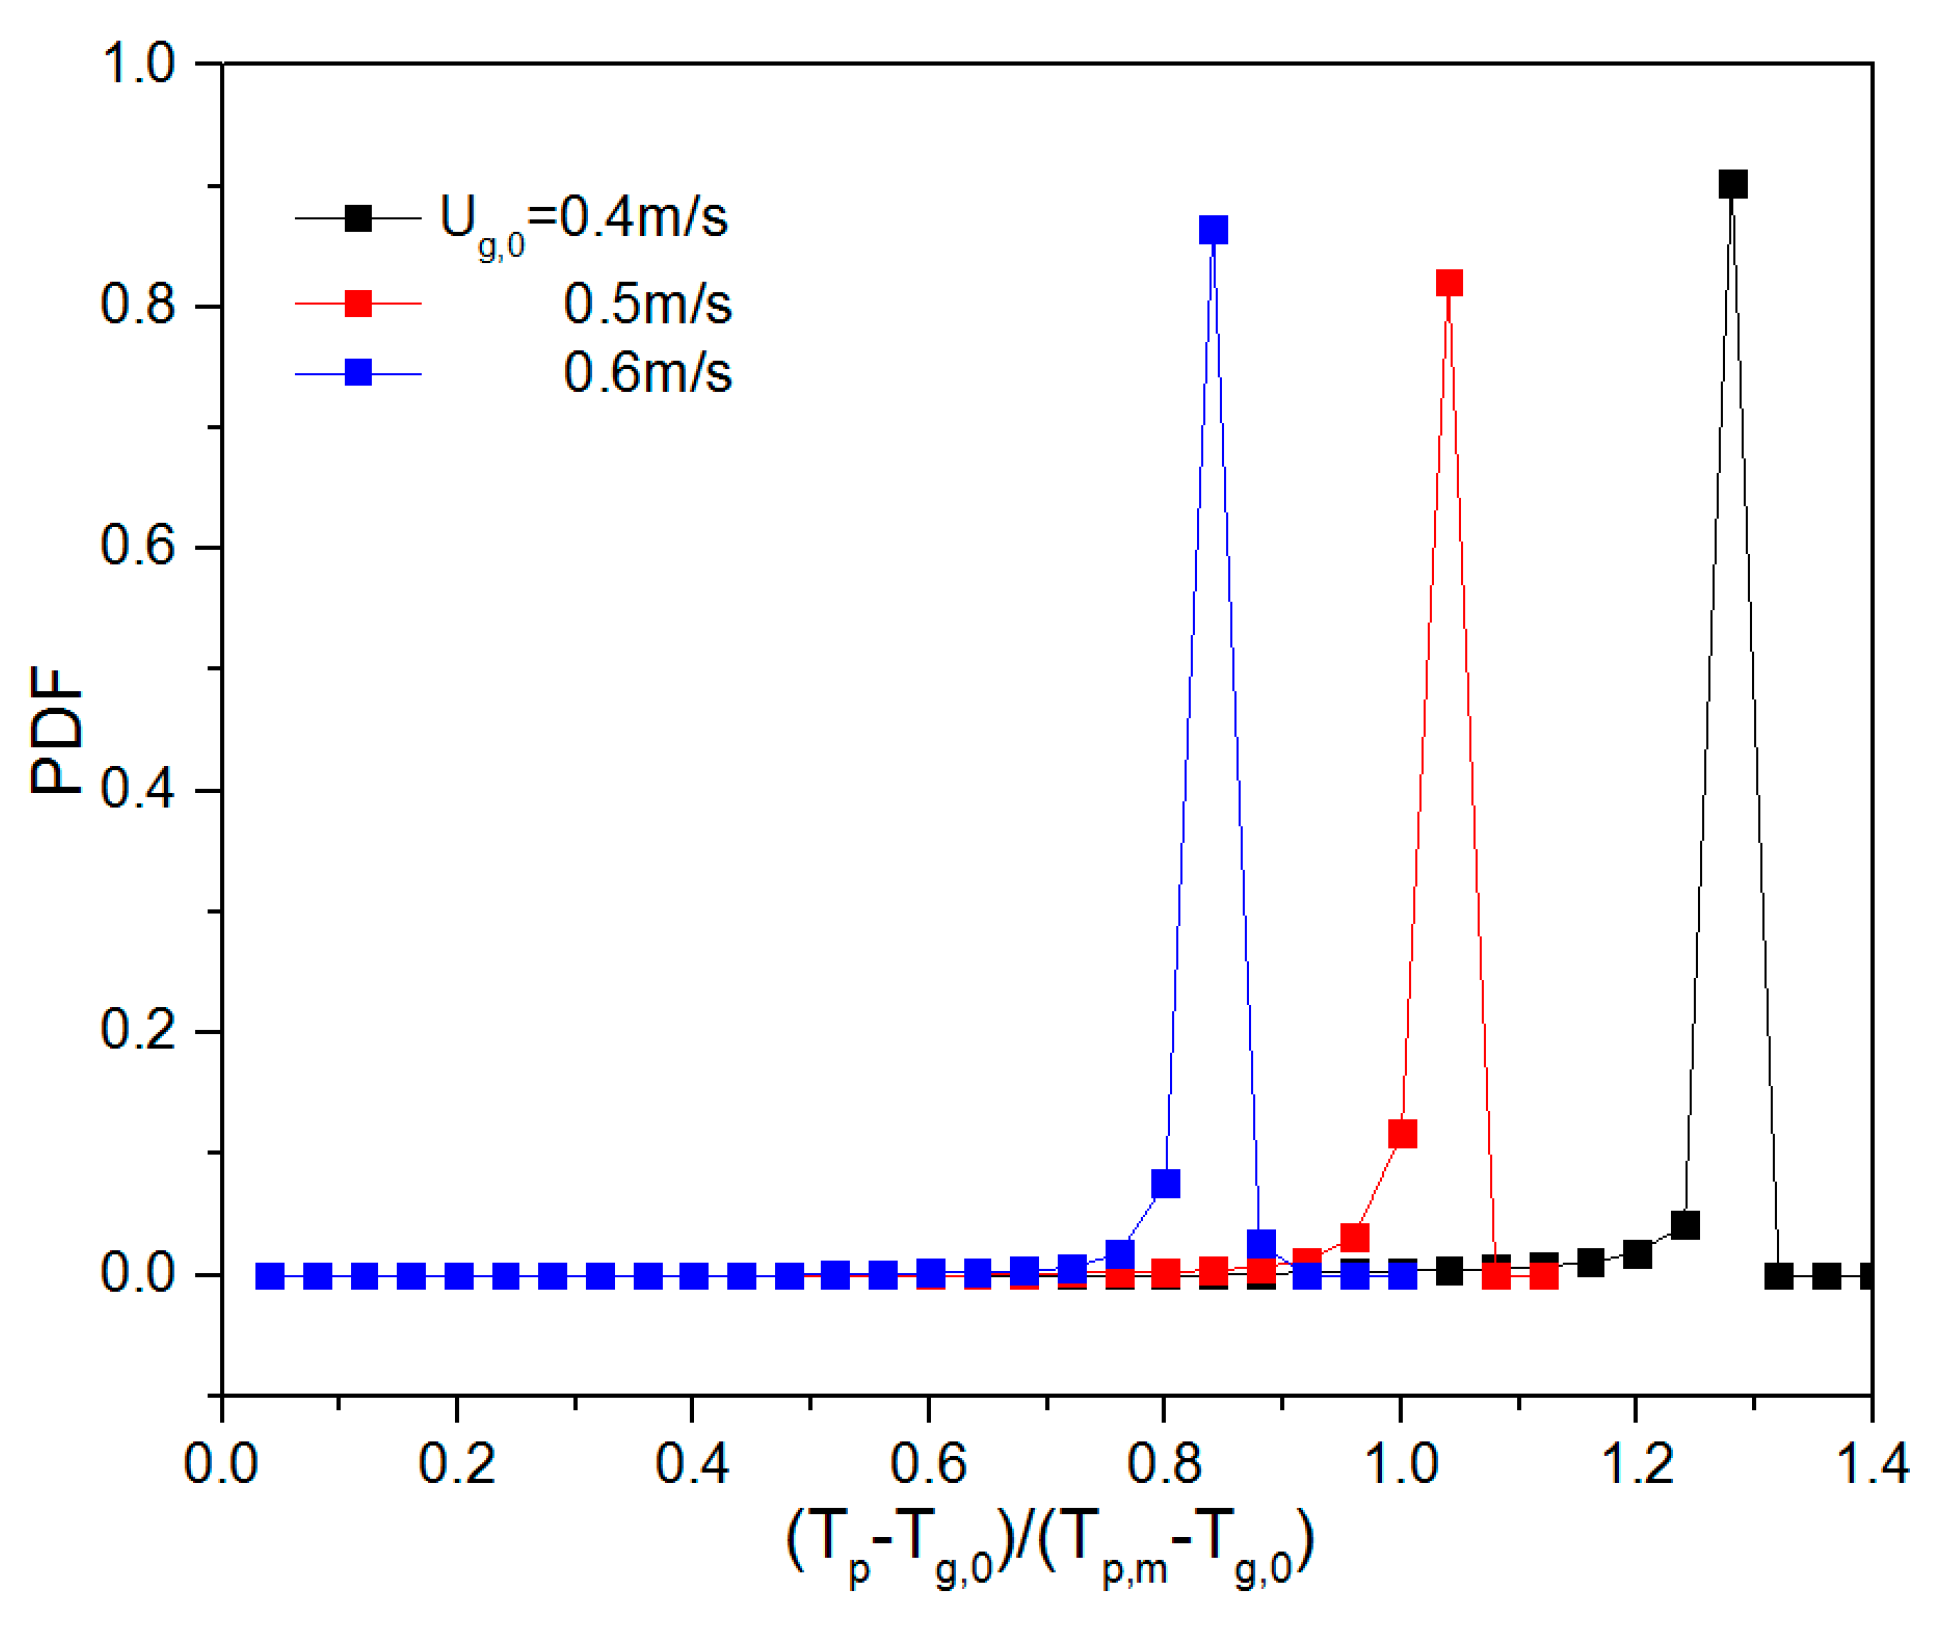
5.3. Effect of the Heat Source Term on Heat Transfer Behavior

In the previous sections, it is assumed that all particles have uniform heat production. Under realistic conditions, however, heat production would depend on the exact amount of catalyst material in each particle, the degree of deactivation and differences in mass transfer limitations. To investigate the effect of differences in heat production, we defined a case with an extreme distribution in heat production properties: 98% “inactive” particles were set to have no heat production, whereas the remaining 2% “active” particles were set to have a heat production 50 times higher than a particle in a bed with uniform heat production. In this way, both the uniform and non-uniform bed will have the same total heat production.
As can be seen from the snapshots in Figure 10, all particles mix well in the bed. Because of the very high heat transfer coefficient, the heat transfer from the active particles to the gas and from the gas to the inactive particles is very efficient.
The mean temperature reaches an equilibrium state after 10 s. The steady-state bed-averaged gas temperature can be derived analytically, assuming ideal mixing of both gas and particles. The thus obtained equilibrium temperatures of the gas phase and the inactive (1) and active (2) particles are given by
T g = T g i n + ( q ˙ 1 X + q ˙ 2 ( 1 X ) ) H B ( 1 ε g ) ρ g C p g u g , z T p 1 = T g i n + ( q ˙ 1 X + q ˙ 2 ( 1 X ) ) H B ( 1 ε g ) ρ g C p g u g , z + q ˙ 1 ( 1 ε g ) h a s
T p 2 = T g i n + ( q ˙ 1 X + q ˙ 2 ( 1 X ) ) H B ( 1 ε g ) ρ g C p g u g , z + q ˙ 2 ( 1 ε g ) h a s
where X is the percentage of “inactive” particles. The terms on the right hand represent the gas inlet temperature, the adiabatic temperature rise and the temperature difference between gas and particles, respectively. Because of the very effective heat transfer, the relatively small temperature difference between “active” and “inactive” particles is an important factor because, in reality, many types of particles with different activities would be present in the bed simultaneously. The equilibrium temperature of the gas and the two types of particles with different heat production under different conditions are listed in Table 5.
From the snapshots of gas and particle temperature in Figure 10, the gas temperature and the distribution of particles with and without the heat source term, respectively, are shown. Beyond the entrance region, the gas temperature shown in Figure 10 is practically homogeneous and approximately equal to the temperature of the inactive particles, as shown in Figure 11. This aligns well with the equilibrium temperatures given in Table 5. Furthermore, Figure 11 shows the active particles distributed through the bed uniformly. As expected from the equilibrium temperatures, there is an obvious temperature difference between inactive and active particles.
Figure 12 shows the probability density function of the dimensionless particle temperatures, which was created during a period of 10–20 s (in a similar way to that described by Li et al. [13]). The equilibrium temperatures of the (in)active particles are included for reference.
By comparing the temperature PDFs in Figure 9 (uniform heating) and the left column of Figure 12 (non-uniform heating), we can see that, in both cases, the temperature distribution is more uniform at lower superficial velocity. In the case of the non-uniform heating, a small extra peak appears associated with the small number of (very) active particles.
To inspect the behavior of the active particles, separate PDFs were obtained for both the inactive and active particles only (see the middle and right column of Figure 12, respectively). With lower superficial velocity and lower H0/W, inlet effects are dominant, leading to long tails towards low temperatures for both particle classes. From the comparison between simulation results and equilibrium temperatures, we observe that there still are differences, and the differences become larger at lower superficial velocity. This is because the assumption of a thermally ideally mixed bed is not valid. This also illustrates the added value of fluidized bed CFD-DEM simulations for the inspection of hot and cold zones in the bed.

6. Conclusions

In this work, CFD-DEM simulations of a non-isothermal gas-fluidized bed were presented. A heat source was incorporated in the particle phase thermal energy equation to mimic the heat liberation due to chemical conversion.
The influence of the gas superficial velocity and bed aspect ratio on the hydrodynamics and thermal behavior of a pseudo-2D fluidized bed were analyzed. With increasing superficial velocity and initial bed height, the overall mean bed voidage increases more or less linearly. The standard deviation of particle temperature provides quantitative information on the particle temperature distribution. At higher aspect ratio and with increasing ug,0, the particles become better-mixed, reducing the standard deviation. Furthermore, the time-averaged particle velocity profiles strongly depend on ug,0 and H0/W. Enhanced particle circulation with increasing superficial velocity is observed, whereas more particles are transported upwards in the central region for increasing initial bed heights. The fluidized bed is more isothermal when the superficial gas velocity and aspect ratio increase. The diversity of particles with and without heat production also has an apparent effect on heat transfer behavior. Because of the very good heat transfer characteristics, the heat transfer from very active particles via the gas phase to the non-active particles is very effective. The gas and particle temperatures predicted by CFDEM simulations agree reasonably well with the equilibrium temperatures.

Author Contributions

L.M.: Investigation, Software, Writing—original draft. K.A.B.: Supervision, Writing—review & editing. J.A.M.K.: Conceptualization, Supervision, Writing—review & editing. N.G.D.: Conceptualization, Methodology, Supervision, Writing—review & editing. All authors have read and agreed to the published version of the manuscript.

Funding

This research was funded by the Netherlands Center for Multiscale Catalytic Energy Conversion (MCEC), an NWO Gravitation program funded by the Ministry of Education, Culture and Science of the government of the Netherlands.

Conflicts of Interest

The authors declare no conflict of interest.

Notation

CpHeat capacity, J·kg−1·K−1
dpParticle diameter, m
gGravitational acceleration constant, m·s−2
hEffective interfacial heat transfer coefficient, W·m−2·K−1
kFluid thermal conductivity, W·m−1·K−1
NpParticle number, -
NupParticle Nusselt number, -
PrPrandtl number, -
QSource term for the interphase heat transfer exchange, W·m−3
qHeat production, W
RepParticle Reynolds number, -
tTime, s
TTemperature, K
Greek symbols
ΔξWidth of grid cell, m
ΔψDepth of grid cell, m
ΔζHeight of grid cell, m
εVolume fraction, -
ρDensity, kg·m−3
µDynamic viscosity, kg·m−1·s−1
σStandard deviation of particle temperature, K
Subscripts
pParticle phase
gGas phase

References

  1. Kunii, D.; Levenspiel, O. Fluidization engineering. In Butterworth-Heinemann Series in Chemical Engineering; Butterworth-Heinemann Limited: Oxford, UK, 1991. [Google Scholar]
  2. Basu, P.; Nag, P. An investigation into heat transfer in circulating fluidized beds. Int. J. Heat Mass Transf. 1987, 30, 2399–2409. [Google Scholar] [CrossRef]
  3. Zhou, Z.; Yu, A.; Zulli, P. Particle scale study of heat transfer in packed and bubbling fluidized beds. AIChE J. 2009, 55, 868–884. [Google Scholar] [CrossRef]
  4. Zhou, Z.; Yu, A.; Zulli, P. A new computational method for studying heat transfer in fluid bed reactors. Powder Technol. 2010, 197, 102–110. [Google Scholar] [CrossRef]
  5. Borodulya, V.A.; Ganzha, V.L.; Teplitskii, Y.S.; Epanov, Y.G. Heat transfer in fluidized beds. J. Eng. Phys. 1985, 49, 1197–1202. [Google Scholar] [CrossRef]
  6. Valenzuela, J.; Glicksman, L. An experimental study of solids mixing in a freely bubbling two-dimensional fluidized bed. Powder Technol. 1984, 38, 63–72. [Google Scholar] [CrossRef]
  7. Limtrakul, S.; Boonsrirat, A.; Vatanatham, T. DEM modeling and simulation of a catalytic gas–solid fluidized bed reactor: A spouted bed as a case study. Chem. Eng. Sci. 2004, 59, 5225–5231. [Google Scholar] [CrossRef]
  8. Zhou, H.; Flamant, G.; Gauthier, D. DEM-LES of coal combustion in a bubbling fluidized bed. Part i: Gas-particle turbulent flow structure. Chem. Eng. Sci. 2004, 59, 4193–4203. [Google Scholar] [CrossRef]
  9. Patil, A.V.; Peters, E.; Kolkman, T.; Kuipers, J. Modeling bubble heat transfer in gas–solid fluidized beds using DEM. Chem. Eng. Sci. 2014, 105, 121–131. [Google Scholar] [CrossRef]
  10. Deen, N.G.; Annaland, M.V.S.; Van Der Hoef, M.; Kuipers, J. Review of discrete particle modeling of fluidized beds. Chem. Eng. Sci. 2007, 62, 28–44. [Google Scholar] [CrossRef]
  11. Van Der Hoef, M.A.; Annaland, M.V.S.; Deen, N.G.; Kuipers, J. Numerical Simulation of Dense Gas-Solid Fluidized Beds: A Multiscale Modeling Strategy. Annu. Rev. Fluid Mech. 2008, 40, 47–70. [Google Scholar] [CrossRef]
  12. Hoomans, B.; Kuipers, J.; Briels, W.; Van Swaaij, W. Discrete particle simulation of bubble and slug formation in a two-dimensional gas-fluidised bed: A hard-sphere approach. Chem. Eng. Sci. 1996, 51, 99–118. [Google Scholar] [CrossRef] [Green Version]
  13. Li, Z.; Annaland, M.V.S.; Kuipers, J.; Deen, N.G. Effect of superficial gas velocity on the particle temperature distribution in a fluidized bed with heat production. Chem. Eng. Sci. 2016, 140, 279–290. [Google Scholar] [CrossRef]
  14. Beetstra, R.; Van Der Hoef, M.; Kuipers, J. Numerical study of segregation using a new drag force correlation for polydisperse systems derived from lattice-Boltzmann simulations. Chem. Eng. Sci. 2007, 62, 246–255. [Google Scholar] [CrossRef]
  15. Syamlal, M.; Gidaspow, D. Hydrodynamics of fluidization: Prediction of wall to bed heat transfer coefficients. AIChE J. 1985, 31, 127–135. [Google Scholar] [CrossRef]
  16. Gunn, D.J. Transfer of heat or mass to particles in fixed and fluidized beds. Int. J. Heat Mass Transf. 1978, 21, 467–476. [Google Scholar] [CrossRef]
  17. Annaland, M.V.S.; Deen, N.G.; Kuipers, J. Numerical simulation of gas–liquid–solid flows using a combined front tracking and discrete particle method. Chem. Eng. Sci. 2005, 60, 6188–6198. [Google Scholar] [CrossRef]
  18. Bird, R.; Stewart, W.; Lightfoot, E. Transport Phenomena; John Wiley and Sons: Hoboken, NJ, USA, 2001. [Google Scholar]
Figure 1. Dimensionless axial particle and gas temperature profiles without heat production.
Processes 08 00463 g001
Figure 2. Dimensionless axial particle and gas temperature profiles without heat production.
Processes 08 00463 g002
Figure 3. Schematic overview of the pseudo-2D fluidized bed.
Processes 08 00463 g003
Figure 4. Snapshots of instantaneous voidage patterns for varying aspect ratios: (a) H0/W = 0.5, (b) H0/W = 1, (c) H0/W = 2, and different superficial gas velocities: 0.4, 0.5 and 0.6 m/s (from left to right).
Processes 08 00463 g004
Figure 5. Temporally and spatially averaged bed voidage as a function of superficial velocity and aspect ratio.
Processes 08 00463 g005
Figure 6. Profiles at different heights of time-averaged vertical particle velocity for varying aspect ratios: (a) H0/W = 0.5, (b) H0/W = 1, (c) H0/W = 2. Note that all profiles are shown at z = H0.
Processes 08 00463 g006aProcesses 08 00463 g006b
Figure 7. Snapshots of particle temperature as a function of aspect ratio: (a) H0/W = 0.5, (b) H0/W = 1, (c) H0/W = 2, and different superficial gas velocities: 0.4, 0.5 and 0.6 m/s (from left to right).
Processes 08 00463 g007
Figure 8. Particle temperature standard deviation as a function of ug,0 and H0/W.
Processes 08 00463 g008
Figure 9. Dimensionless particle temperature probability density function (PDF) for varying aspect ratios: 0.5, 1 and 2 (top to bottom) and different gas superficial velocities.
Processes 08 00463 g009aProcesses 08 00463 g009b
Figure 10. Snapshots of gas temperature as a function of aspect ratio: (a) H0/W = 0.5, (b) H0/W = 1, (c) H0/W = 2, and different superficial gas velocities: 0.4, 0.5 and 0.6 m/s (from left to right).
Processes 08 00463 g010
Figure 11. Snapshots of the temperature of two types of particles as a function of aspect ratio: (a) H0/W = 0.5, (b) H0/W = 1, (c) H0/W = 2, and different superficial gas velocities: 0.4, 0.5 and 0.6 m/s (from left to right).
Processes 08 00463 g011
Figure 12. Dimensionless temperature PDF of all particles, inactive particles and active particles for different gas superficial velocities and varying aspect ratios: 0.5, 1 and 2.
Processes 08 00463 g012
Table 1. Particle and gas phase properties in the fixed bed verification.
Property (Unit), SymbolValue
Gas density (kg/m3), ρg1000
Inlet gas temperature (K), Tg,0373
Gas viscosity (Pa s), µg1.0 × 10−3
Gas heat capacity (J/kg/K), Cpg4187
Gas thermal conductivity (W/m/K), kg0.5
Particle diameter (m), dp3.95 × 10−3
Particle density (kg/m3), ρp8400
Initial temperature of gas and particles (K)273
Particle heat capacity (J/kg/K), Cpp385
Table 2. Settings for discrete element method (DEM) simulations of the fixed bed.
SettingValue
Width of the bed (m)0.1
Depth of the bed (m)0.1
Initial particle bed height (m)0.5
Particle number78,125 (25 × 25 × 125)
Δx = Δy = Δz (m)0.004
Time step of particle phase (s)0.0001
Time step of gas phase (s)0.002
Table 3. Settings for DEM simulations of the pseudo-2D fluidized bed.
SettingValue
Width of the bed (m)0.08
Depth of the bed (m)0.01
Initial particle bed height (m)0.04/0.08/0.16
Particle number37,225/74,450/148,900
Δx = Δy = Δz (m)0.0025
Time step of particle phase (s)1.0 × 10⁻⁵
Time step of gas phase (s)2.0 × 10⁻⁴
Table 4. Particle and gas phase properties in the fluidization simulations.
Property (Unit), ValueValue
Gas density (kg/m3), ρg1.49
Inlet gas temperature (K), Tg,0330
Gas viscosity (Pa s), µg1.0 × 10−5
Gas heat capacity (J/kg/K), Cpg1670
Gas thermal conductivity (W/m/K), kg2.09 × 10−2
Particle diameter (m), dp9.95 × 10−4
Particle density (kg/m3), ρp667
Particle heat capacity (J/kg/K), Cpp1670
Normal coefficient of restitution (particle–particle), e0.6
Youngs Modulus5.0 × 105
Poisson ratio0.45
Table 5. Equilibrium temperature of the gas phase (Tg) and the active/inactive particles (Tp1/Tp2).
Non-Uniform CasesUniform Cases
H 0 / W u g , 0 TgTp1Tp2(Tp1-Tp2)/(Tp1-Tg,in)TgTp
0.5/0.4346346367−1.28346346
0.5/0.5343343362−1.5343343
0.5/0.6341341359−1.7341341
1.0/0.4362362383−0.64362363
1.0/0.5356356375−0.75356356
1.0/0.6351351370−0.85351352
2.0/0.4394394415−0.32394395
2.0/0.5381381401−0.37381382
2.0/0.6373373391−0.42373373

