Article

Data-Driven Modelling of the Complex Interaction between Flocculant Properties and Floc Size and Structure

1
Chemical Engineering Department, CIEPQPF, University of Coimbra, 3030-790 Coimbra, Portugal
2
Aqua+Tech Specialities SA, 1237 Geneva, Switzerland
*
Author to whom correspondence should be addressed.
Processes 2020, 8(3), 349; https://doi.org/10.3390/pr8030349
Submission received: 21 January 2020 / Revised: 4 March 2020 / Accepted: 7 March 2020 / Published: 19 March 2020
(This article belongs to the Special Issue Design and Applications of Polymeric Flocculants)

Abstract

:
Polymeric flocculants are widely used due to their ability to efficiently promote flocculation at low dosages. However, fundamental background knowledge about how they act and interact with the substrates is often scarce, or insufficient to infer the best chemical configuration for treating a specific effluent. Inductive, data-driven approaches offer a viable solution, enabling the development of effective solutions for each type of effluent, overcoming the knowledge gap. In this work, we present such an inductive workflow that combines the statistical design of experiments and predictive modelling, and demonstrates its effectiveness in the development of anionic polymeric flocculants for the treatment of a real effluent from the potato crisps manufacturing industry. Based on the results presented, it is possible to conclude that the hydrodynamic diameter, charged fraction and concentration are the parameters with a stronger influence on the characteristics of flocs obtained when using copolymers, while the charged fraction, concentration and hydrophobic content present a stronger influence on the characteristics of flocs obtained using terpolymers containing a hydrophobic monomer.

1. Introduction

Coagulation/flocculation strategies are widely used in effluent treatment due to their capacity to destabilize and aggregate colloids. Flocculation is quite often used in combination with other more advanced techniques. Organic polymeric flocculants are the most frequently used due to their ability to flocculate efficiently at low dosages, producing large aggregates, contrary to what happens when using traditional inorganic coagulants. Polyelectrolytes are water-soluble macromolecules, natural or synthetic, containing ionic charges along the polymer chain. Depending on their charge, they can be classified as anionic (negative charge), cationic (positive charge) or amphoteric (both negative and positive charges). Chemical structure, charge density and molecular weight are considered as the most important features influencing their performance and application. Depending on the type, charge distribution and molecular weight, they can be used for many applications in industry, namely as flocculants in effluent treatment [1].
The separation of particles from suspensions by polymers can be associated to different flocculation mechanisms such as charge neutralization, polymer bridging and electrostatic patch interactions, which depend strongly on the way the adsorption of flocculants on the particle surfaces occurs, which, on the other hand, are related to the chemical affinity between the polymer and the particle surface [2]. Charge neutralization is one of the most important mechanisms when the flocculant and the particle have opposite charge and the flocculant has a low molecular weight. The flocculation process occurs due to a decrease in the electrostatic-driven repulsion forces between colloidal particles, caused by surface charge reduction after polymer adsorption, facilitating the initial aggregation of colloidal and fine suspended materials through Van der Waals forces interactions. Optimal flocculation occurs for polyelectrolyte dosages corresponding to using only the necessary amount to neutralize particle charge [3]. When the polymer concentration used is too high, charge reversal can occur on the particle surface, stabilizing the particles, which will remain well dispersed [4]. Flocs formed by charge neutralization are usually quite open and fragile, leading to slow settling behaviours [5]. Polymer bridging occurs if polyelectrolytes with high molecular weight and low charge density are used. Long polymer chains adsorb on the particle surface, and long loops extend beyond the thickness of the particle electrical double layer [6]. The adsorption of segments within the same polymer chains onto the surface of other particles is therefore possible, and when it occurs, it causes ‘bridging’ between particles [7]. It is well known that polymer bridging usually leads to larger and stronger flocs when compared with the other mechanisms. In this case, polymer chains have to be long enough to extend from one particle to another, to effectively connect the particles, and therefore, a polymer with a high molecular weight is required. Again, if the polymer concentration is too high, the particle surface will be fully covered by the polymer chains, and then no more sites for polymer chains already adsorbed onto one particle will be available to connect to another different particle, thus inhibiting the ‘bridging’ interactions.
In contrast with this, if the polymer bulk concentration and adsorbed surface density are too low, polymer relaxation onto the particle surface may prevent the formation of bridging contacts between particles. Therefore, an optimal amount of polymer is typically needed for successful bridging events, and excessive polymer concentration in the system can result in further stabilization of the colloidal particles [4]. Bridging is reduced when polyelectrolytes have low molecular weight and high charge density. In this case, they adsorb in a very flat conformation on surfaces of opposite charge, allowing the ‘electrostatic patch’ mechanism to occur. Because of the small size of the polymer chain adsorbed on a weak oppositely charged surface, it is impossible for each particle surface to be fully neutralized by the polyelectrolyte. Thus, charged ‘patches’ are formed on the particle surface where uncoated regions can also be found [7]. This causes electrostatic attraction between patches and regions with opposite charges of different particles, resulting in particle attachment and subsequent flocculation. Flocs formed through this mechanism are stronger than flocs formed by simple charge neutralization caused by metal salts [7]. For an efficient electrostatic patch flocculation, the polymer charge density needs to be significantly high; otherwise, if the charge density is too low, the bridging mechanism becomes predominant [8].
Large amounts of effluent with a high organic load are produced by the potato crisps and other fried snacks manufacturing industries during the steps of washing, peeling, slicing and blanching, which require an adequate and effective treatment before discharge. These effluents usually present high levels of fats and oil, solids, COD (Chemical Oxygen Demand) and BOD (Biological Oxygen Demand). Biological treatments are often used, due to the biodegradable nature of the organic content [9,10]. However, the long retention times and large tanks required, as well as the sensitivity of the microorganisms, are important disadvantages of these techniques [11]. On the other hand, the use of highly reactive oxidizing agents in advanced oxidation processes (such as the Fenton reaction, ultra-violet (UV) photolysis, ozonation and electrochemical oxidation) [12], leads to economic and operational weaknesses, making their use problematic. For instance, ozonation is a promising technique since ozone is a powerful oxidizing agent, efficiently used to reduce organic matter [13] with single-step degradation, easy operation, smaller reactor volumes and no sludge formation [14]. However, the high production costs and the relatively low solubility of ozone in water result in a still relatively limited application of ozonation. More recently, considering the environmental compatibility, easy operation and the low amounts of resulting sludge produced, electrocoagulation is another technique which is being applied with success.
Regarding the use of flocculation in the treatment or pre-treatment of this type of effluent, it may be necessary to modify the commonly used polyelectrolytes due to the hydrophobic nature of the organic matter. Thus, the use of terpolymers, by introducing in the polymer chain a certain amount of a hydrophobic monomer, should favour the flocculation process and thus removal of suspended material, eventually with lower amounts of polymer. However, terpolymers are usually more expensive, requiring a more controlled synthesis process, and it is important to compare their performance with that of more common copolymers, which are normally less expensive.
In a previous work [15], the authors presented an evaluation of the flocculation process used in the treatment of effluent from the potato crisps manufacturing industry, using laser diffraction spectroscopy (LDS) as the technique for flocculation monitoring. In the present study, making use of the data obtained through LDS, an extensive multivariate statistical analysis was conducted in order to identify the most critical flocculant parameters influencing the floc size and structure. The most appropriate flocculant for the treatment of a certain wastewater can thus be pre-identified using an advanced, data-driven screening process. Floc properties related to the application of an additive with specific characteristics can be easily assessed, minimizing the use of experimental resources. The data-driven approach consists of a first stage where the statistical design of experiments is conducted and evaluated. Then, upon completion of the experimental trials in a random order, the LDS results are collected and analyzed. This second stage comprises the development of predictive models explaining the variability in the responses (outputs obtained in the experimental trials), which will then be used to assess the importance of the several factors under study in floc size and structure, as well as their interactions. This model will also provide the basis for eventually defining the optimal set of factors leading to the flocculant with the desired properties being able to be defined by the user.

2. Materials and Methods

2.1. Materials

Health-friendly anionic polyelectrolytes, copolymers and terpolymers of acrylamide (AAm) and acrylamido-2-methyl-1-propanesulfonic acid sodium (Na-AMPS)—synthesized by inverse-emulsion polymerization, with different charge densities, and fully described and characterized in a previous manuscript from the authors [15]—were used for the flocculation experiments. In the case of the terpolymers, three different hydrophobic monomers were used: stearyl methacrylate (SMA), ethyl acrylate (EA) and lauryl methacrylate (LMA). Table 1 presents a summary of the composition of the polyelectrolytes used. The flocculant solutions were prepared with distilled water at 0.4% (w/w). In order to guarantee the effectiveness of the flocculants, the diluted solutions were prepared every day.
Charge density was determined by elemental analysis using an element analyser, EA 1108 CHNS-O (Fisons), and 2,5-Bis(5-tert-butyl-benzoxazol-2-yl) thiophene as the standard. C, H and N elemental analyses were performed, and the values for the N element were used in the calculation of the charged fraction. At least three measurements for each sample were performed.
The flocculation tests were performed on an industrial oily effluent from the potato chips manufacturing industry, supplied by the Adventech Group (Portugal).

2.2. Flocculation Process Monitoring

LDS was used to monitor the flocculation process under low stirring conditions. LDS gives information on the evolution with time of the median floc size, d (0.5), and simultaneously, on the floc structure described by the scattering exponent [16], SE, which is indicative of floc compactness. Detailed information regarding this procedure is available elsewhere [15]. The tests were performed in a Malvern Masterziser 2000 (Malvern Instruments, Enigma Business Park, UK). Two hundred millilitres of effluent sample were added to 600 mL of distilled water in the equipment beaker, as was the right amount of hydrochloric acid in order to reach a pH of 6. A pH of 6 was selected for the tests since it was the one that led to higher destabilization of the effluent during the off-line pretesting (a lower charge of the effluent). Flocculants were tested for concentrations from 3.3 mg/L to 13 mg/L, and the right amount of flocculant was added at once to the effluent. During the flocculation process, the suspension vessel was stirred mechanically using the sample unit facilities of the Malvern Mastersizer 2000, at a low stirring speed of 300 rpm (to prevent floc breakage [15]). The size of the flocs was measured every 36 s for a period of 6 min, till the floc size stabilized. The scattering exponent (SE) of the flocs, which provides information about floc structure, was calculated off-line at the end of the flocculation process, once the floc size stabilized (6 min).

2.3. The Statistical Design of Experiments and Multivariate Data Analysis

The statistical design of experiments (DOE) is a systematic approach to define the process conditions at which experiments are to be carried out, in order to extract the maximum information for a given purpose [17,18]. DOE involves the simultaneous consideration of several factors (typically 5–10), which can be quantitative (e.g., temperatures, flows, etc.) or qualitative (type of flocculant, polymer, etc.), and that can be associated with linear, bilinear or non-linear effects on the response. In this work, the type of DOE adopted was a full factorial design. This design allows the estimation of all of the main effects and two-factor interactions (in the present case, the design even allowed for the estimation of a possible quadratic effect of concentration). Therefore, it is a suitable design for screening and modelling purposes, with full resolution to estimate all terms in Equation (1), where yi stands for the response in the ith experimental run, and xi,j represents the ith value of the jth factor or input variable. Furthermore, additional covariates were also included in the model to capture the influence of other potentially relevant variables, which were not systematically manipulated in the DOE framework.
y i = β 0 + j = 1 m β j x i , j + j = 1 m 1 k = j + 1 m β j k x i , j x i , k + ε i
The data collected from the experiments planned under a DOE approach were analysed with resort to modeling frameworks, usually based on Ordinary Least Squares regression. Ordinary least squares (OLS) regression is a method used in the analysis of linear and non-linear relations between a response variable and one or more predictor variables. OLS regression provides estimates for the parameters of a linear regression such as the one presented in Equation (1), which are optimal in the least squares sense [19].
OLS is a suitable methodology when the factors are uncorrelated. However, when they present correlations, OLS estimates become unstable, and the model predictions unreliable. This is known as the collinearity problem of OLS, which can be diagnosed with the support of statistical metrics, such as the Variance Inflation Factor (VIF). When collinearity is a problem, multivariate techniques such as Partial Least Squares (PLS) regression should be applied instead. PLS finds the linear combinations of factors that present maximum covariance with the response, and derives a model linking such linear combinations (or latent variables) and the response. In this way, collinearity is no longer a problem, as correlated variables appear together in the linear combinations, which act as new predictors. The estimated model can be recasted in the format of a conventional regression model, the only difference being that the model parameters are estimated using different estimation principles [20]. The computations were carried out using the software JMP-PRO, version 13.1.0 (SAS Campus Drive, Cary, USA, 2017) [21].
In the present study, five predictor variables were considered, corresponding to different characteristics of the flocculants: the hydrophobic content (design factor), the number of methylene groups in the hydrophobic aliphatic chain (Nr of carbons in hydrophobic chain design factor), the concentration of polymer in the process (design factor), the charged fraction (covariate) and the hydrodynamic diameter of the polymer (Rh) (covariate). Molecular weight was not considered as a predictor, since there is a linear correlation between molecular weight and hydrodynamic diameter for the same type of polymer [22], and thus there is no need to include both in the model (mitigating, in this way, the collinearity problem). The response variables are the scattering exponent (SE) and median floc size (d0.5), both determined after 6 min of flocculation. Different combinations of the design factor levels were considered according to the selected DOE design, and the experimental responses recorded together with the values for the covariate variables. Table 2 summarizes the experimental conditions tested and the results obtained in each one of them. For more information on the characterization of the polyelectrolytes, the interested reader is referred to Lourenco, et al. [22].

3. Results and Discussion

In order to maximize the insights extracted from data analysis, the experimental results were treated from different perspectives. More specifically, the responses (SE, d0.5) were modelled separately, and the type of polymer employed (copolymer or terpolymer) was considered both separately and altogether. The analysis of each situation is reported next, in separate subsections:
  • Case 1: The prediction of the SE for copolymers.
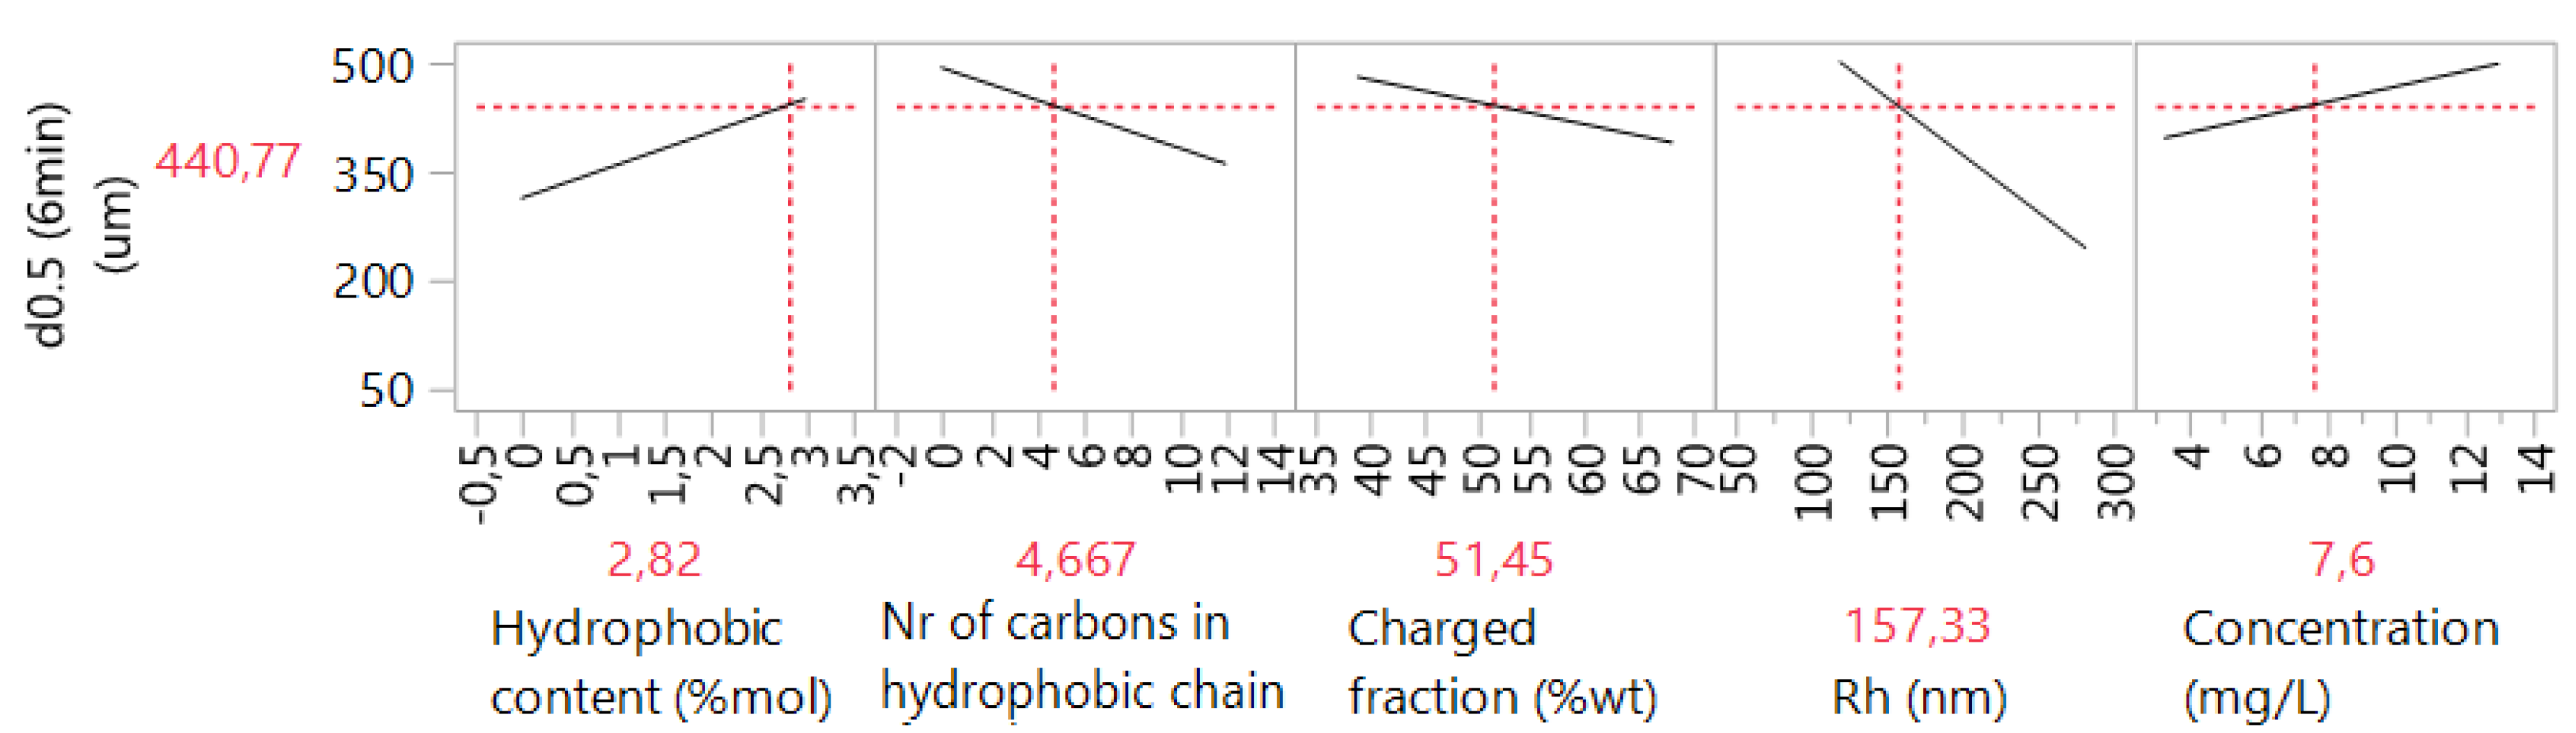
  • Case 2: The prediction of the d0.5 for copolymers.
  • Case 3: The prediction of the SE for terpolymers.
  • Case 4: The prediction of the d0.5 for terpolymers.
  • Case 5: The prediction of the SE for copolymers and terpolymers.
  • Case 6: The prediction of the d0.5 for copolymers and terpolymers.

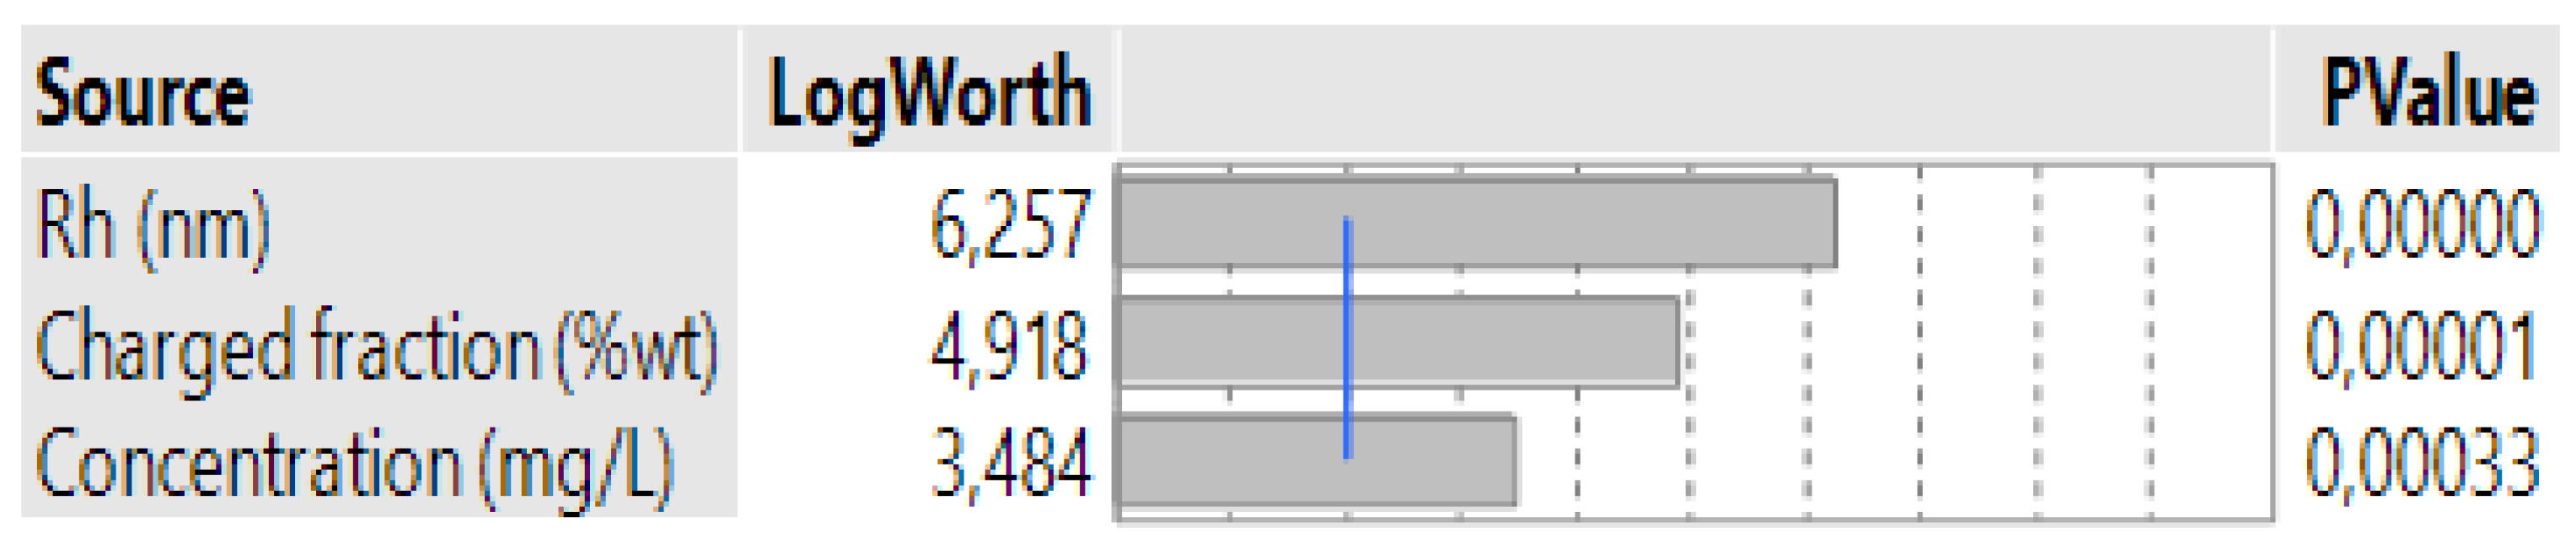
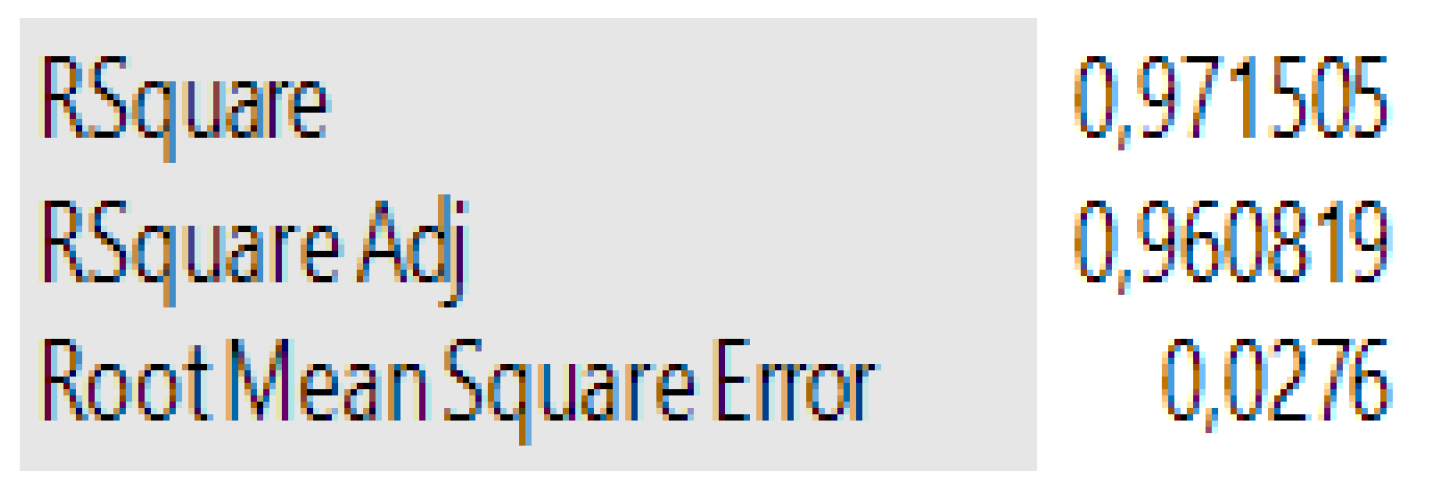
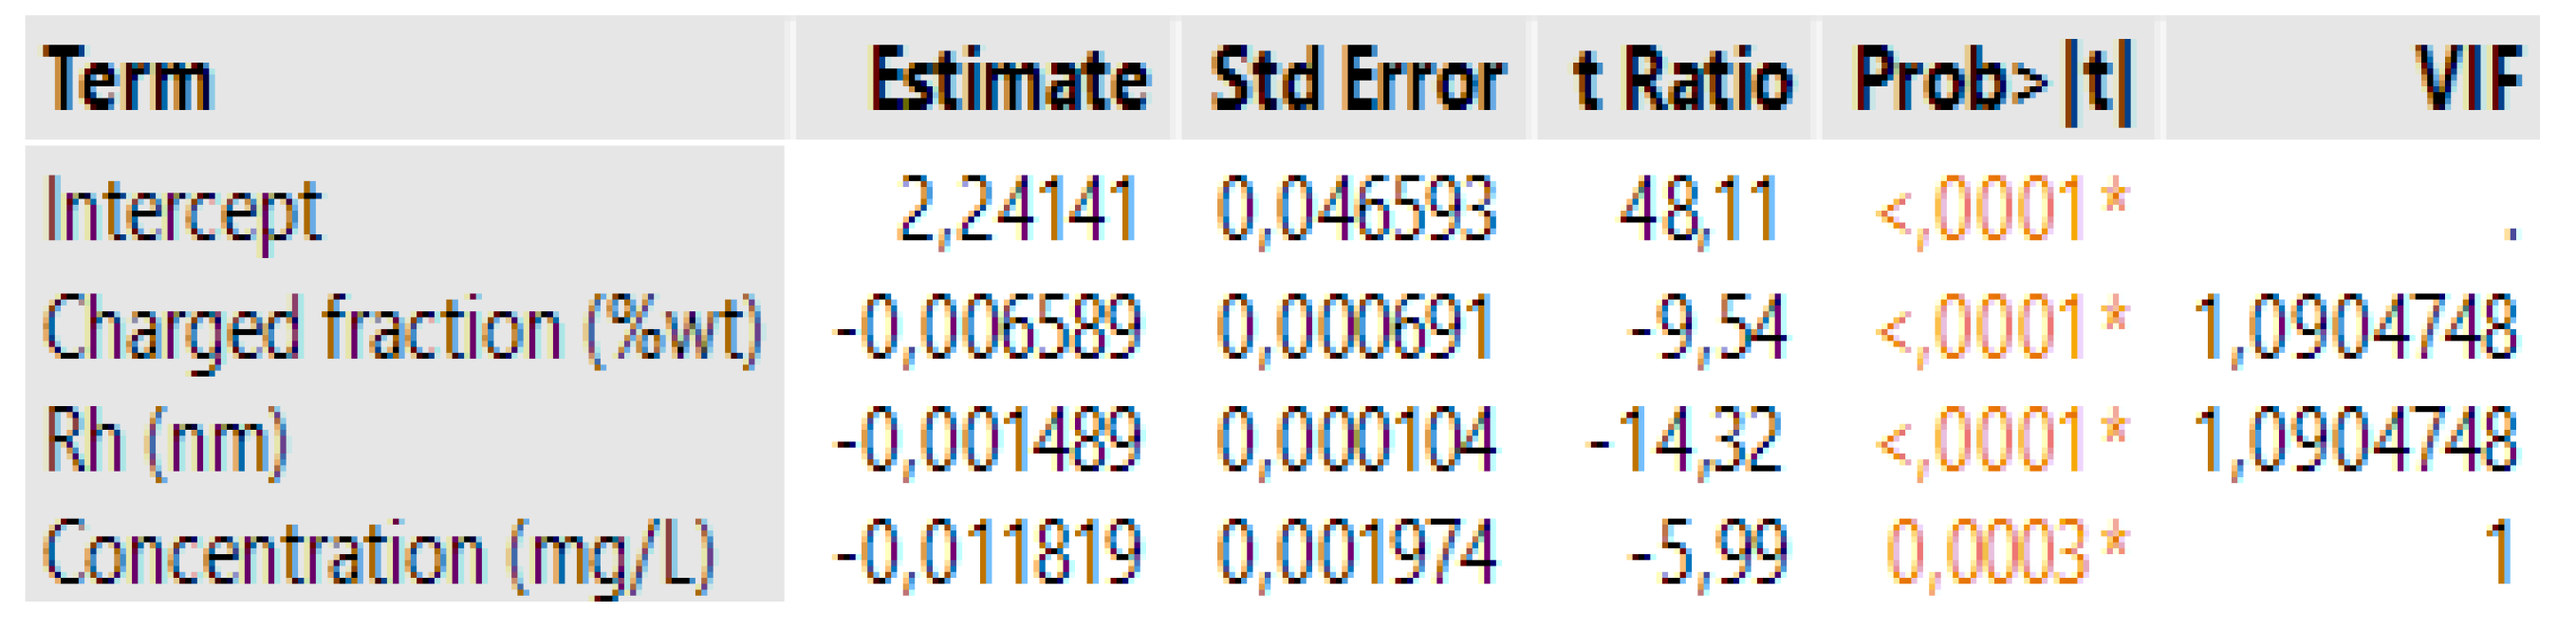
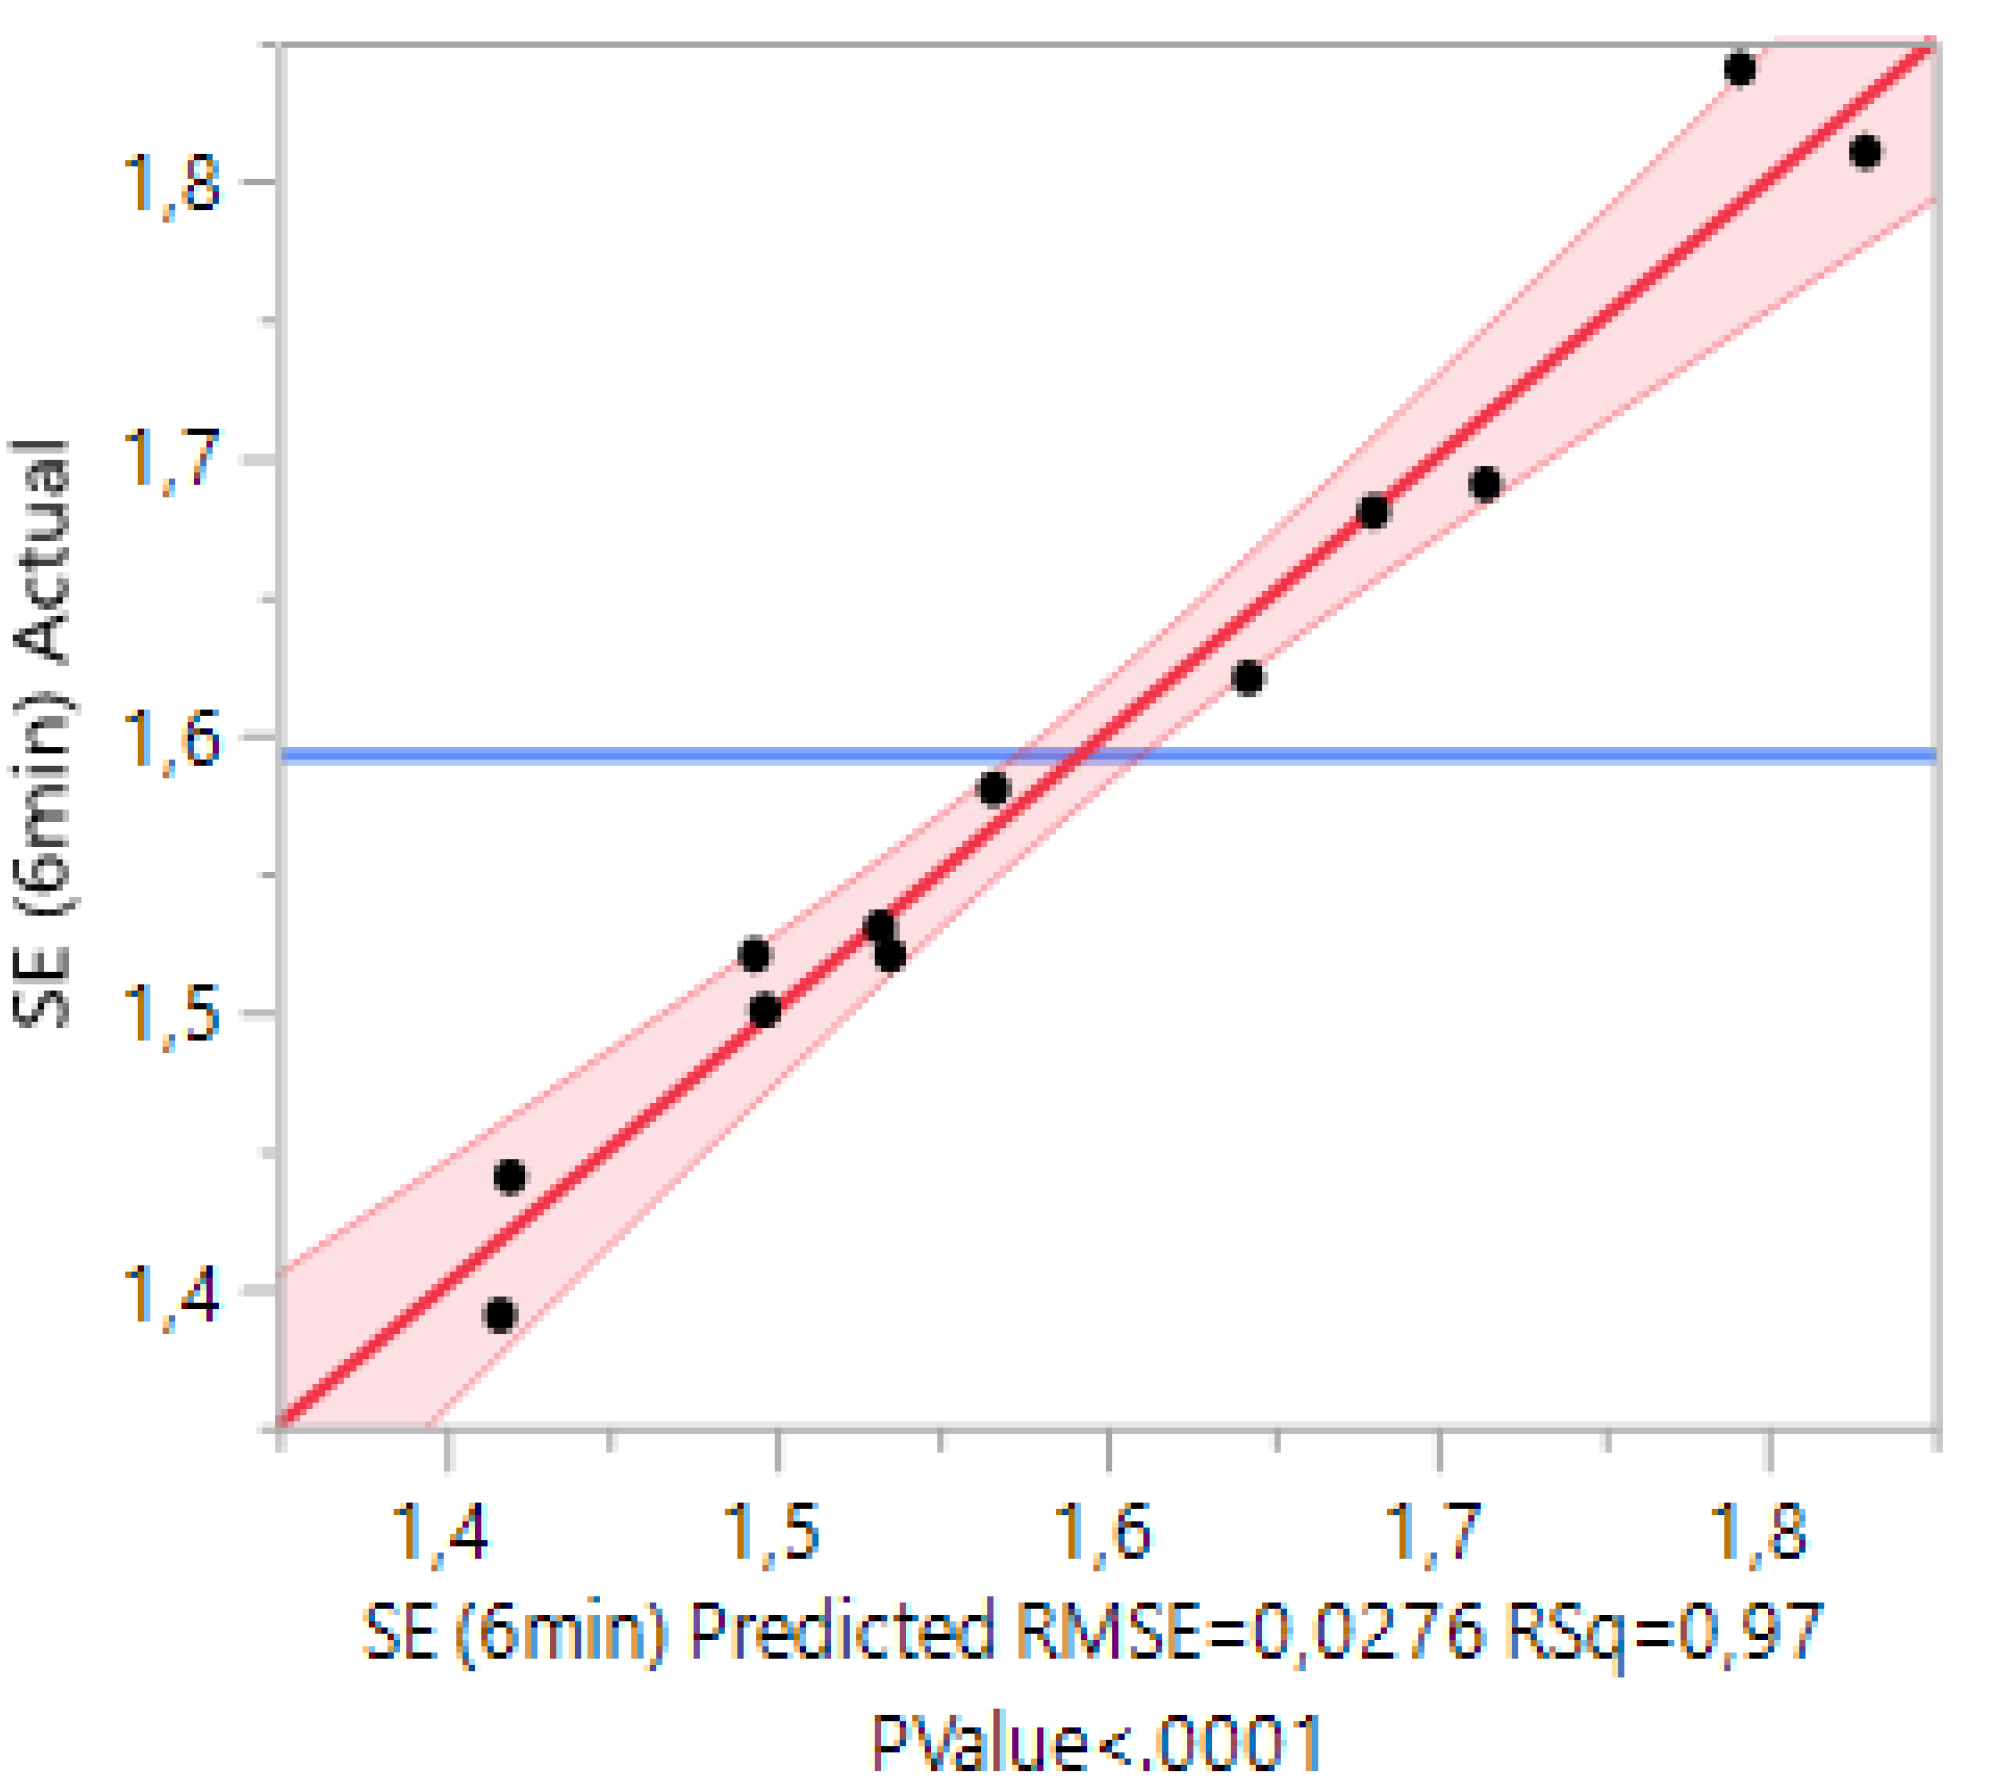
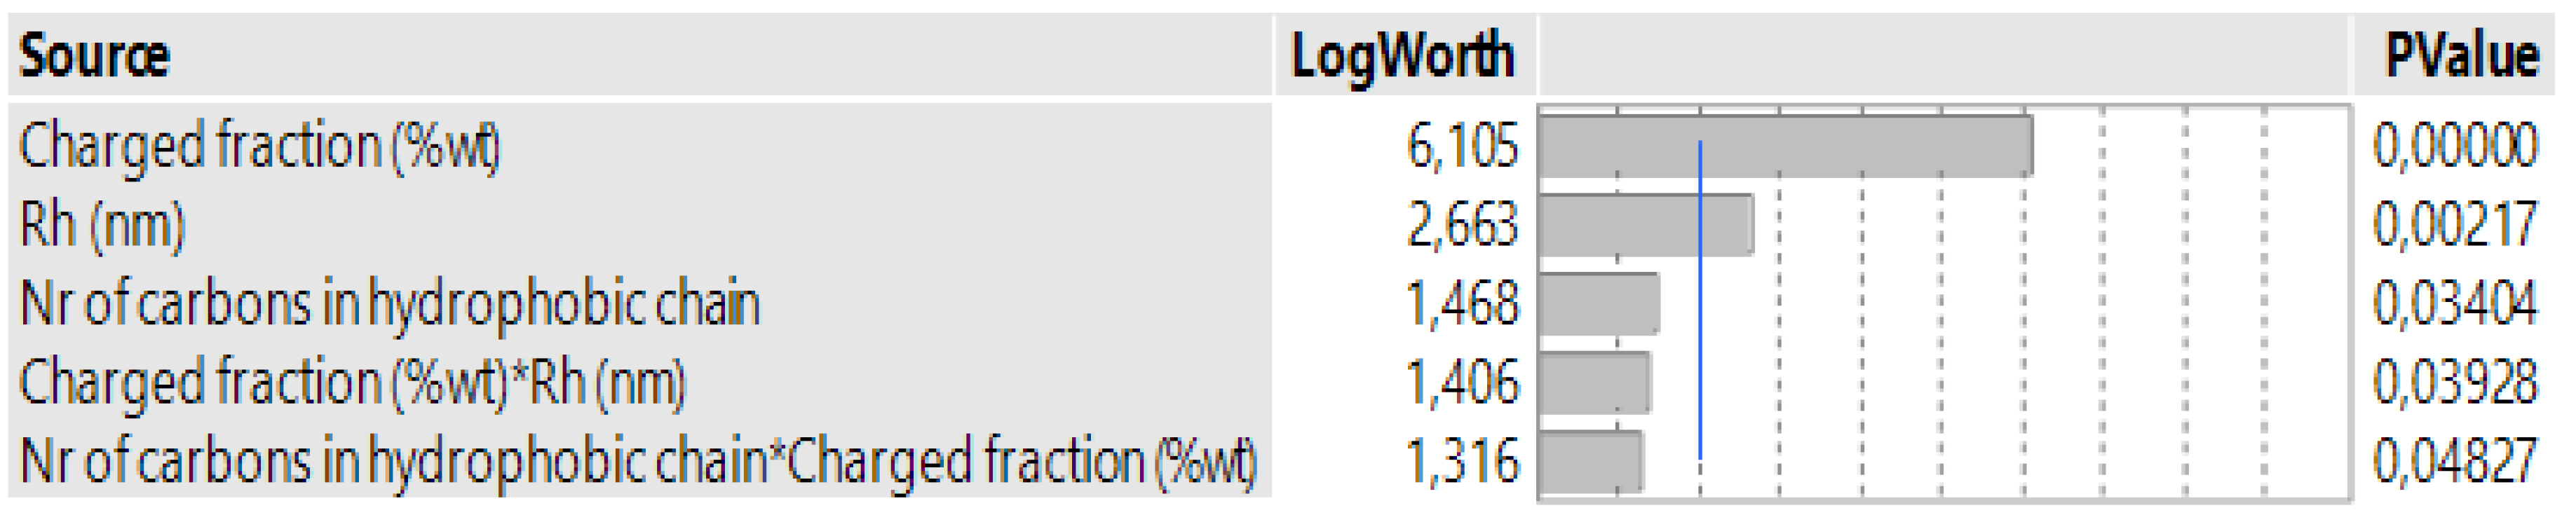
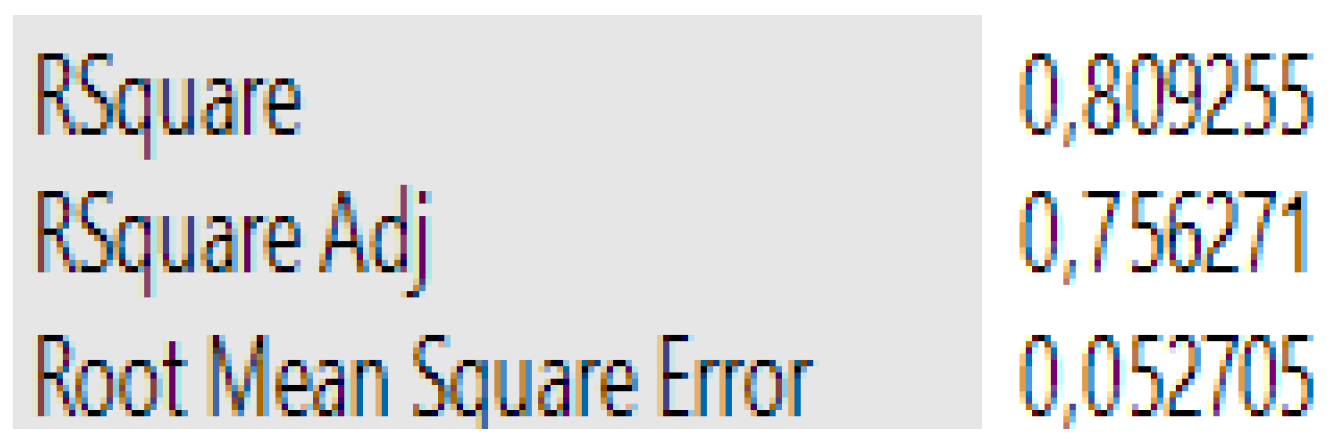
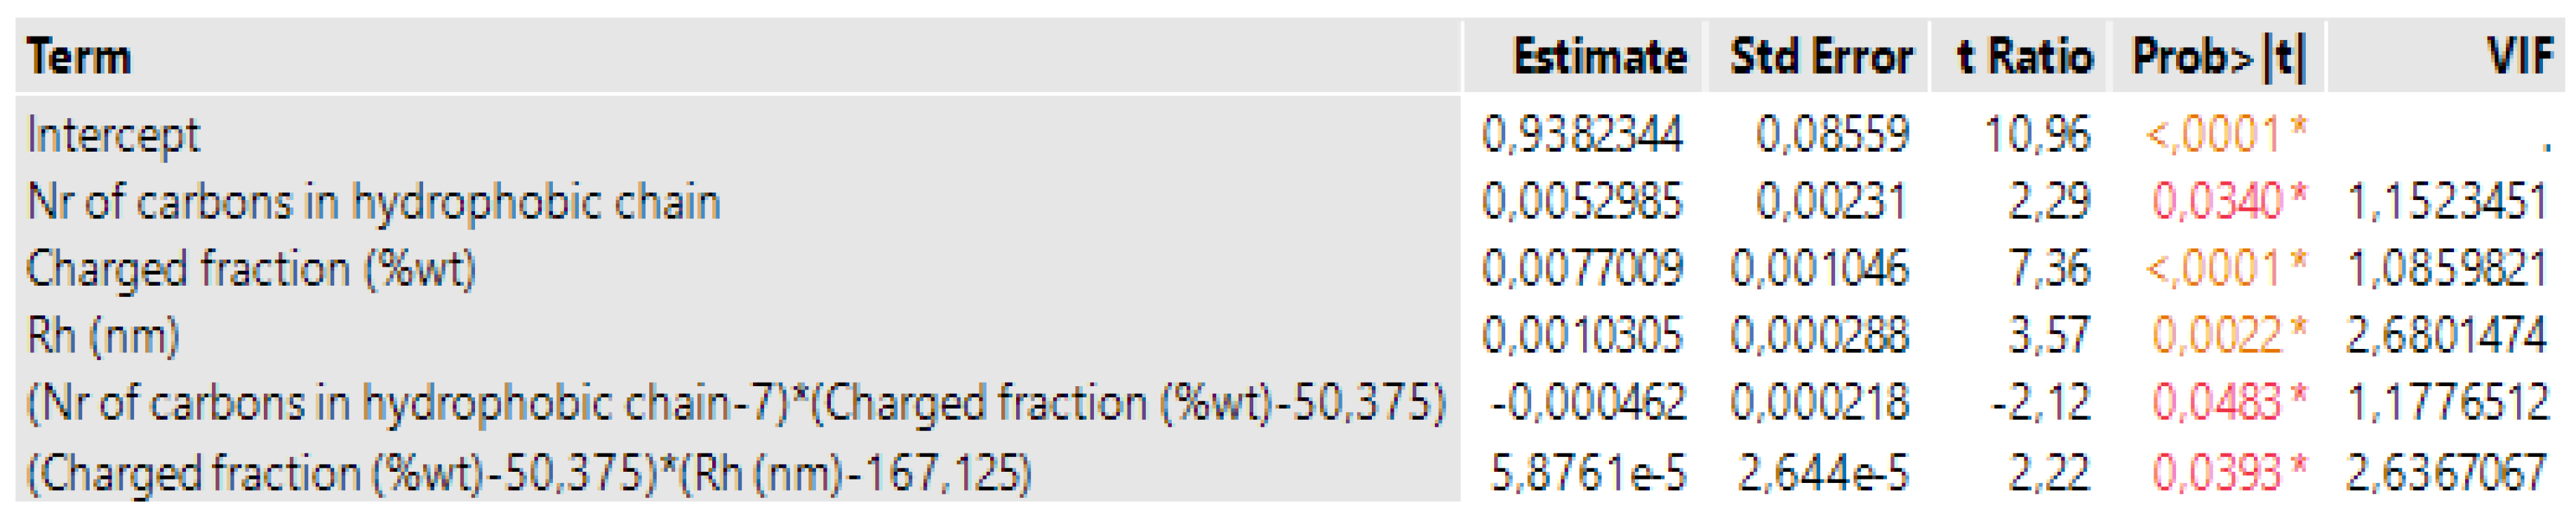
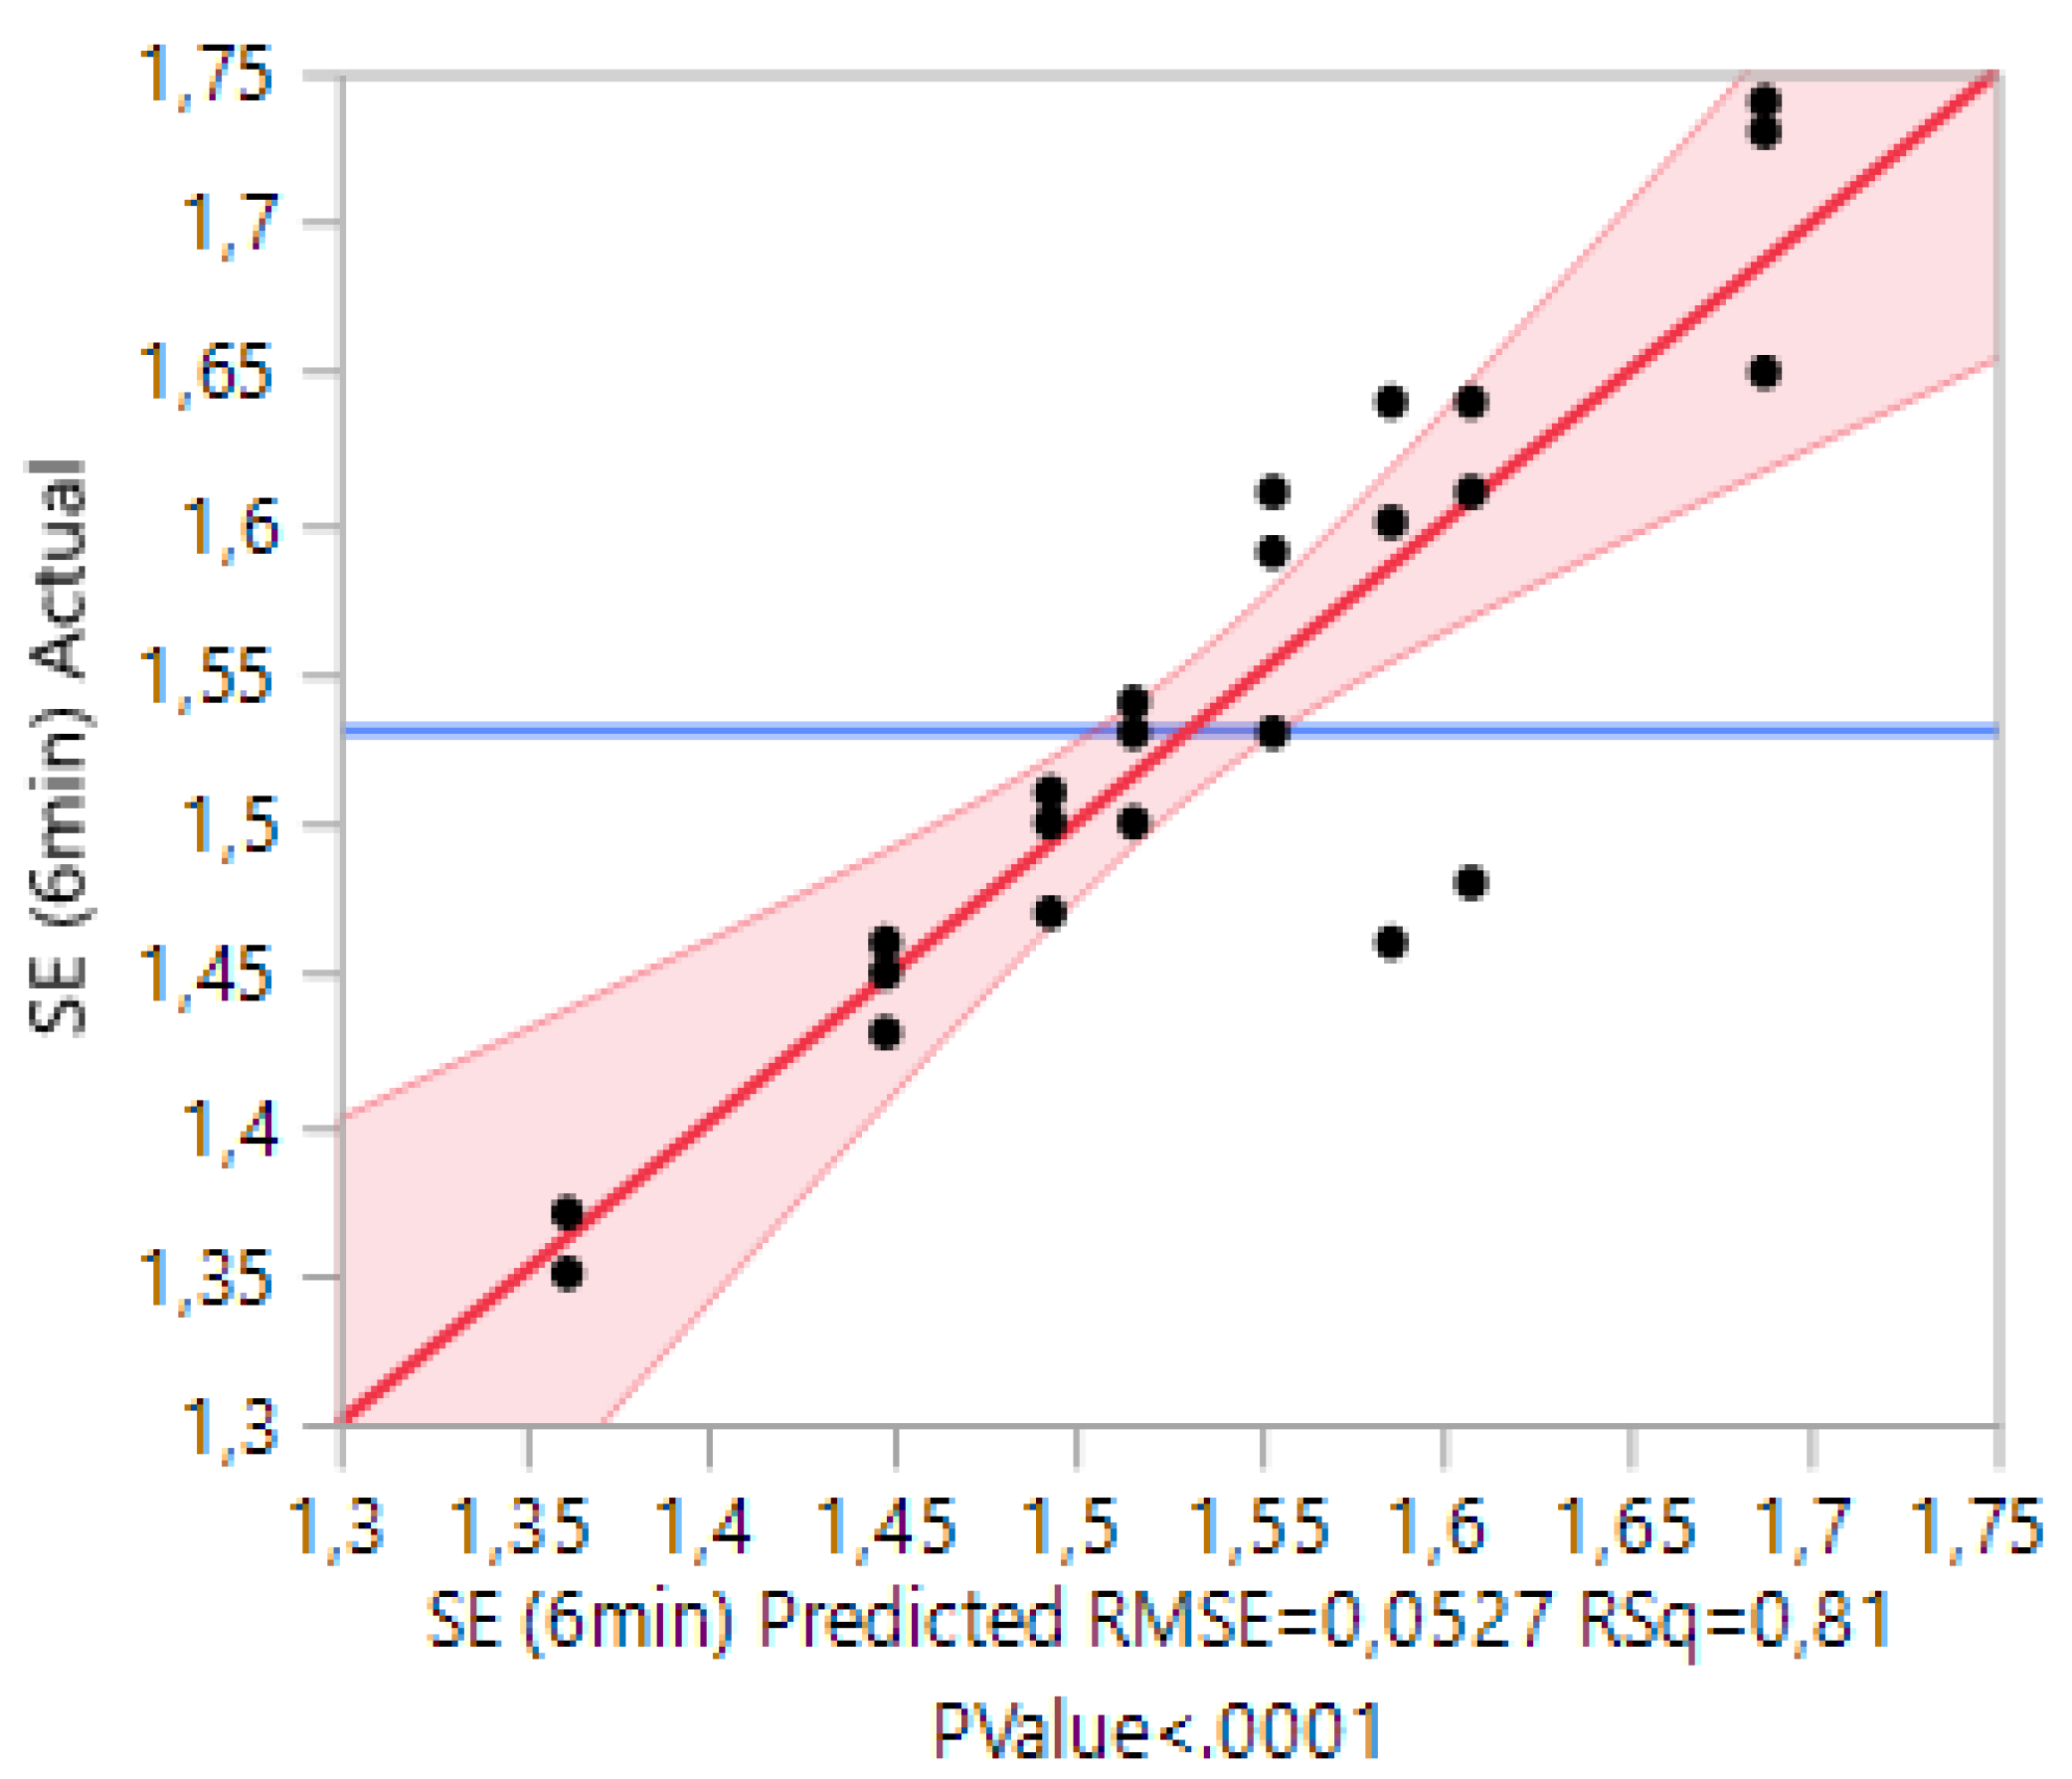
3.1. Case 1: The Prediction of the SE for Copolymers

In the case of copolymers, the predictor set (i.e., the set of experimental factors or input variables) is formed by the design factor concentration, and the covariates hydrodynamic diameter and charged fraction. A model was developed using OLS, resulting in the significant effects presented in Figure 1. The p-value reflects the significance of each effect: the lower the p-value, the more significant the effect is (i.e., the more likely it is to be different from zero). A p-value below 0.01 (the significance level adopted) is considered to be statistically significant. LogWorth is defined as −log10 (p-value). This transformation adjusts p-values to a more appropriate scale. A value of LogWorth exceeding 2 is considered to be significant (it corresponds to a p-value <0.01). The bar graph shows the LogWorth values and a line at 2 for reference of statistical significance. The hydrodynamic diameter is the most important factor in this case, followed by the charged fraction and concentration.
Figure 2 shows the summary of fit report. RSquare estimates the proportion of variation in the dependent variable that is explained by the estimated regression model. An RSquare close to 1 indicates a good fit to the experimental data, whereas an RSquare near 0 indicates that the model is not capable to explain the variation of the response. For this specific case, RSquare is about 0.97, suggesting a good fitting ability. Rsquare Adj is the RSquare adjusted for the number of parameters in the model. Root Mean Square Error estimates the standard deviation of the random error.
The parameter estimates report shows the estimates of the model parameters and the associated significance (Prob>|t|, the p-value associated to each coefficient) (Figure 3). Std Error represents the standard deviation of the estimated coefficients. The VIF (Variance Inflation Factor) checks for the presence of collinearity in the predictors. High VIFs indicate a collinearity issue among the terms in the model. This value should be lower than 5 and never larger than 10. The VIF values obtained in this case indicate no collinearity issues, suggesting that the regression method used is suitable for describing the experimental data.
Figure 4 shows an actual by predicted plot, which plots the observed values against the predicted values of the response. It is possible to verify that all the observations lay within the prediction intervals, confirming the stability and accuracy of the model developed for the SE for the copolymers.

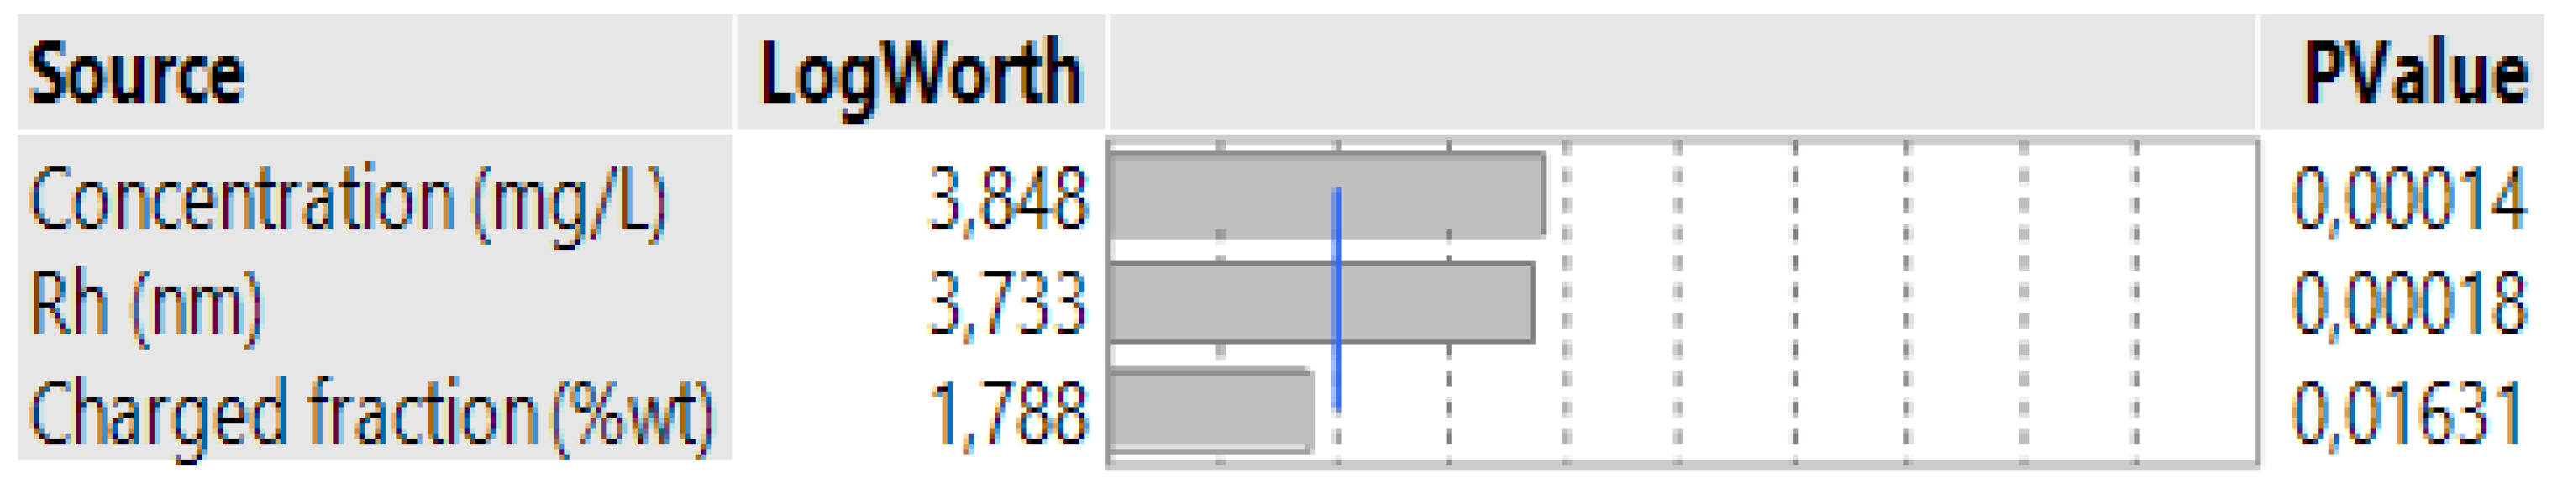
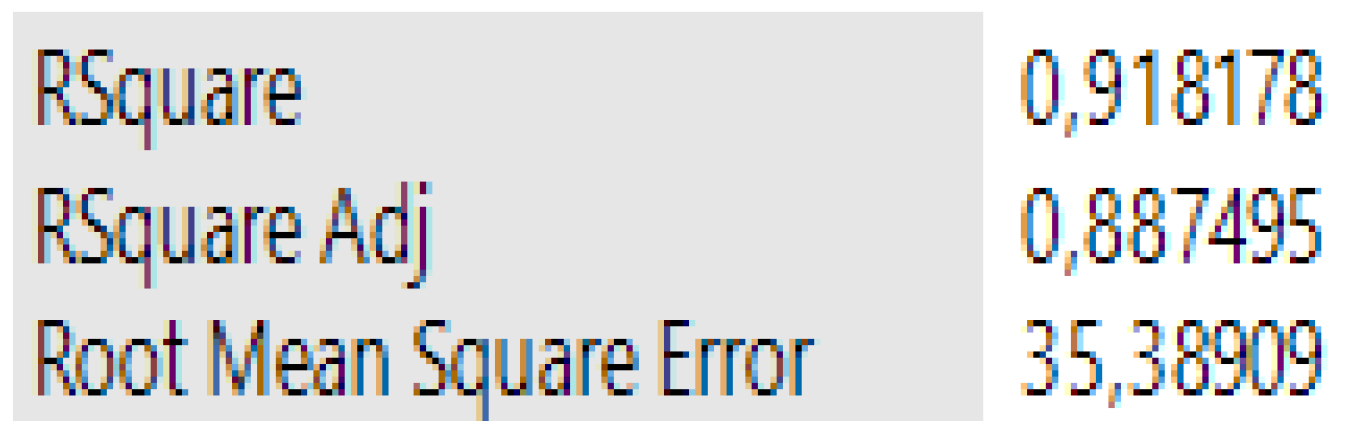
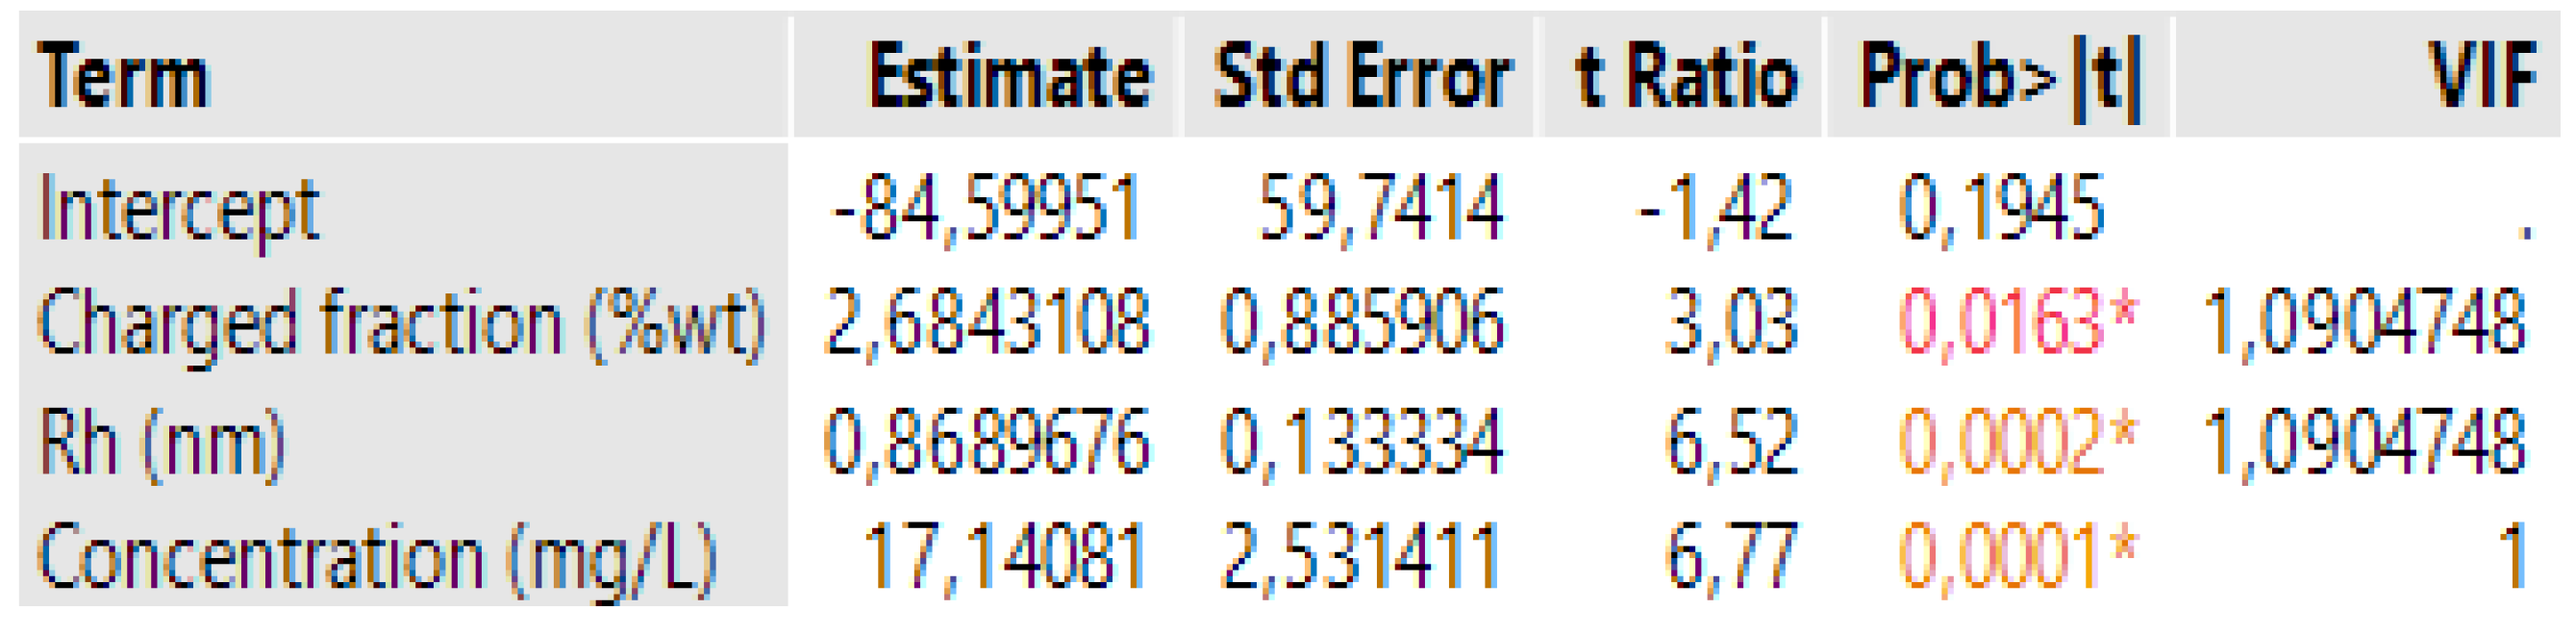
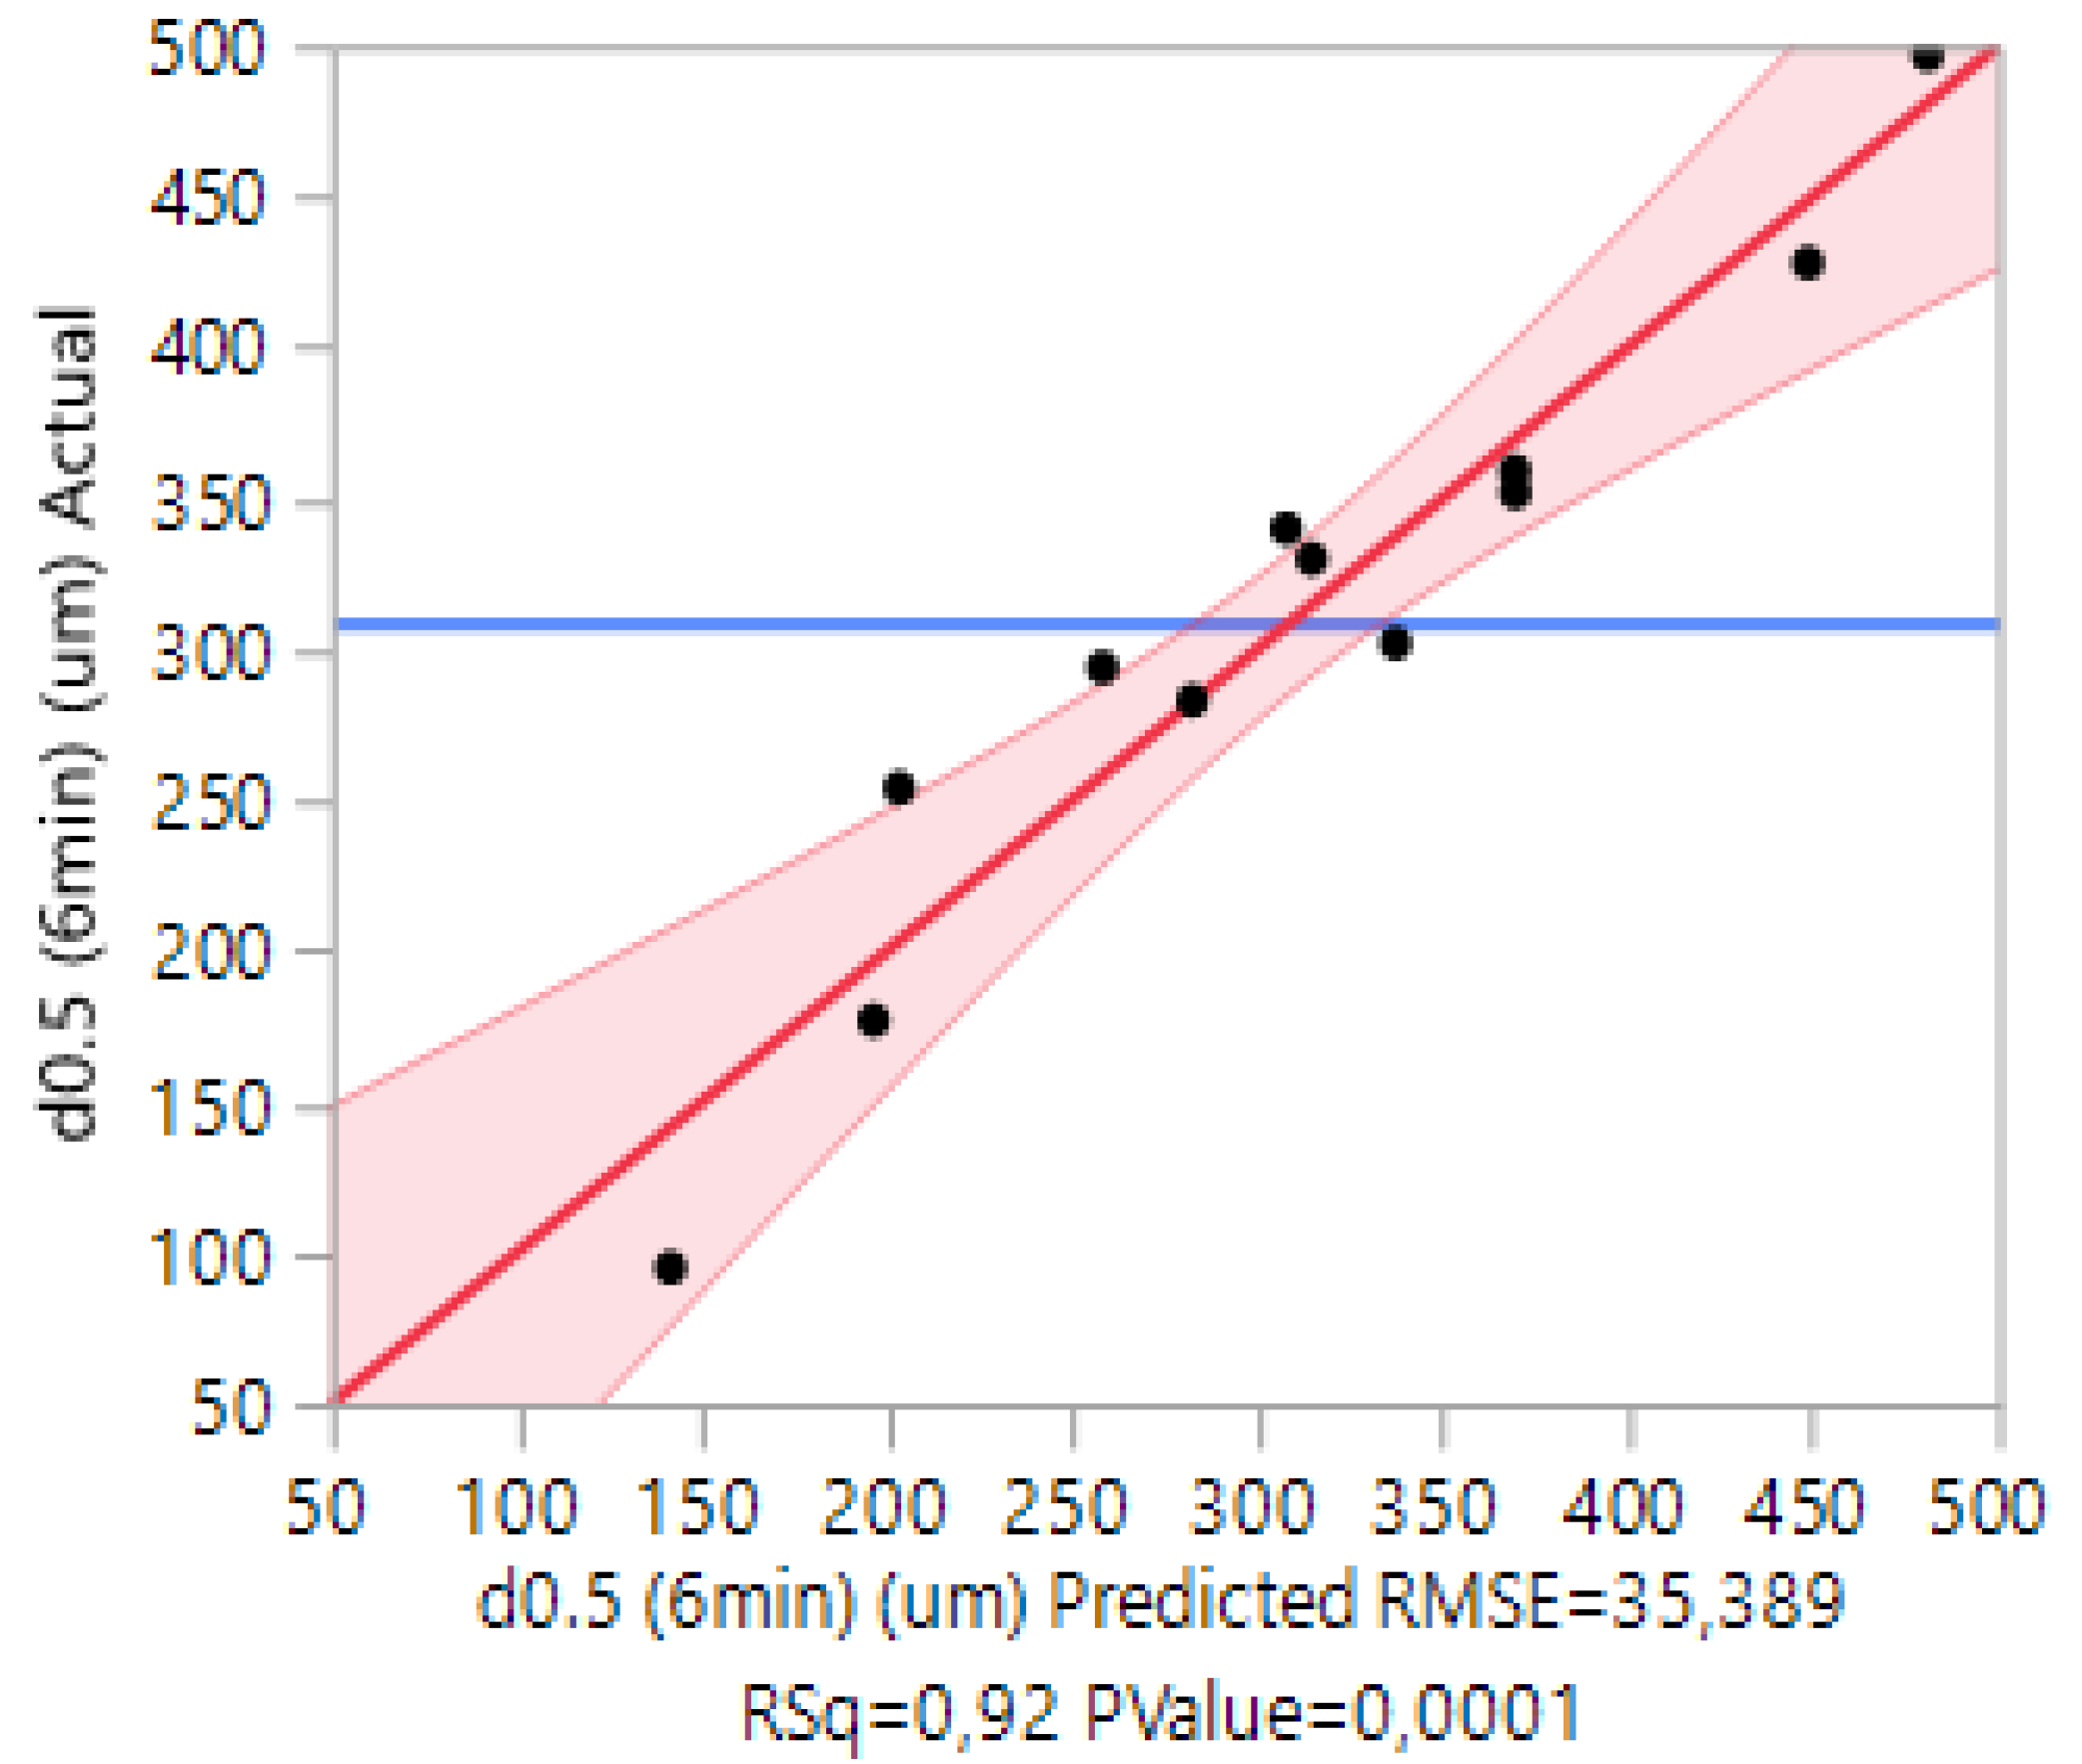
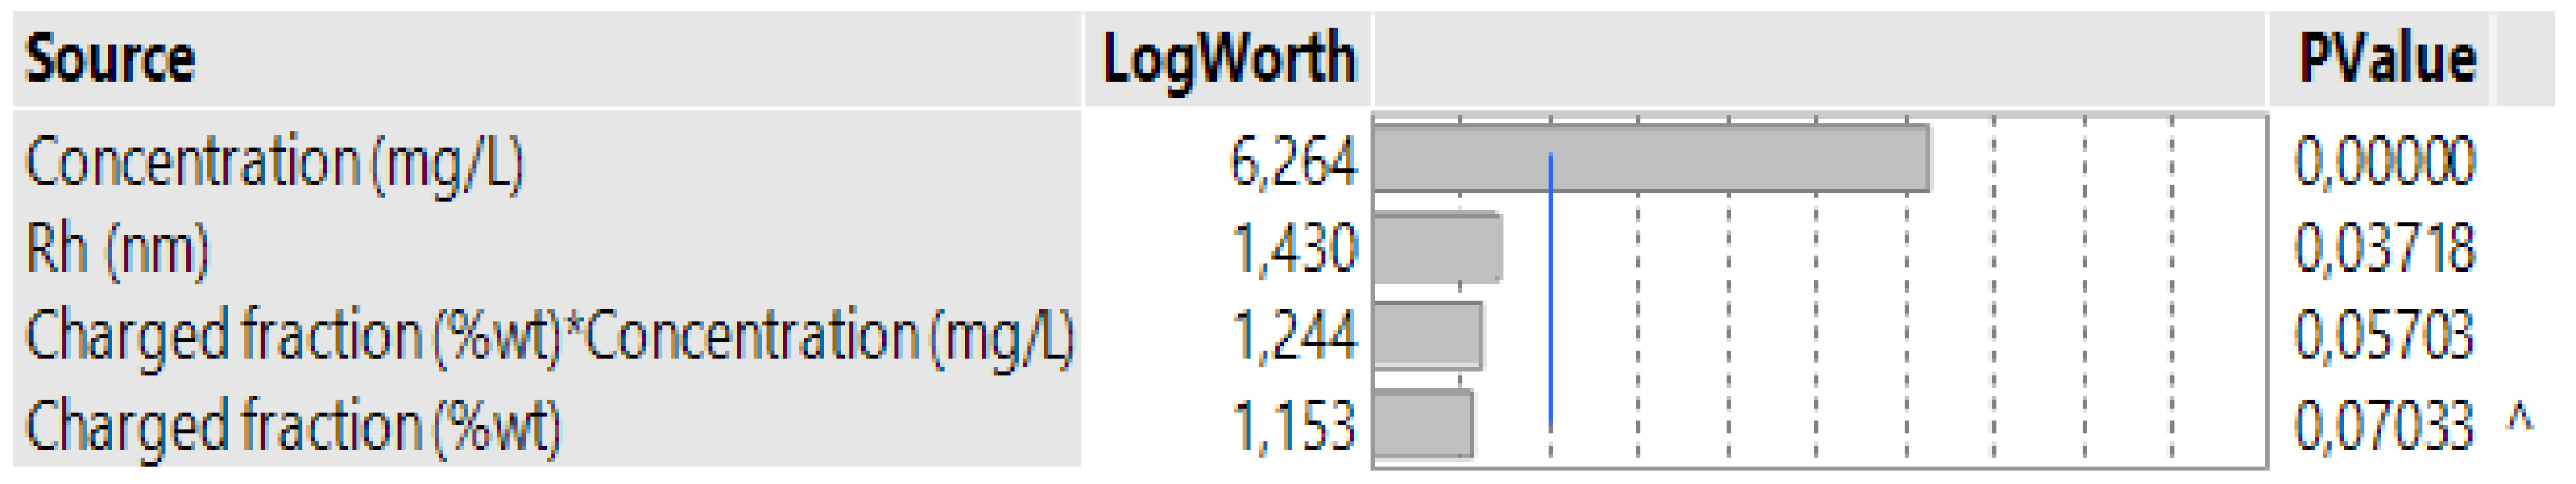
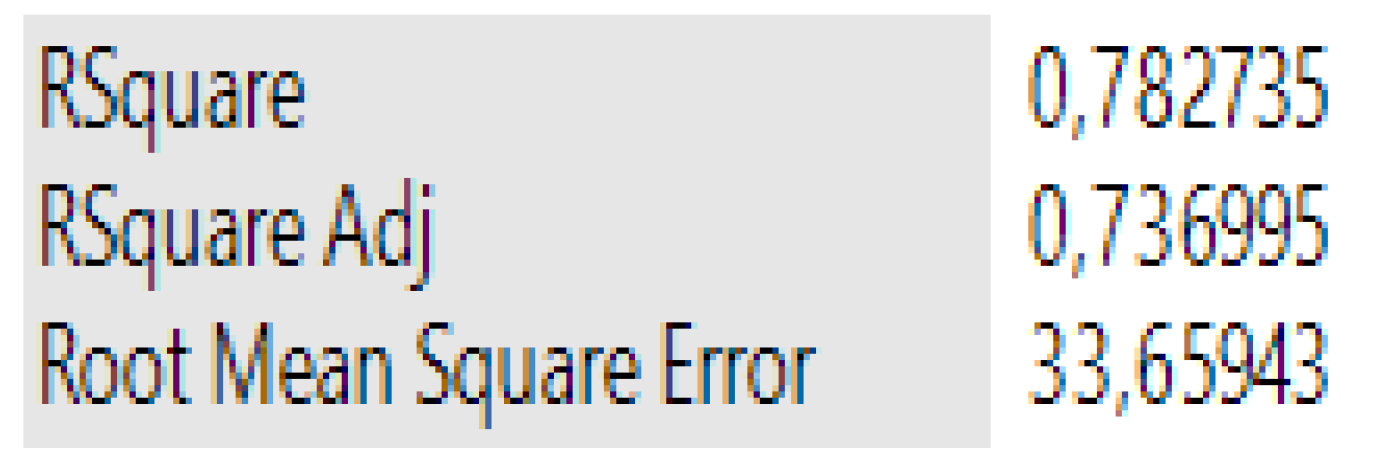
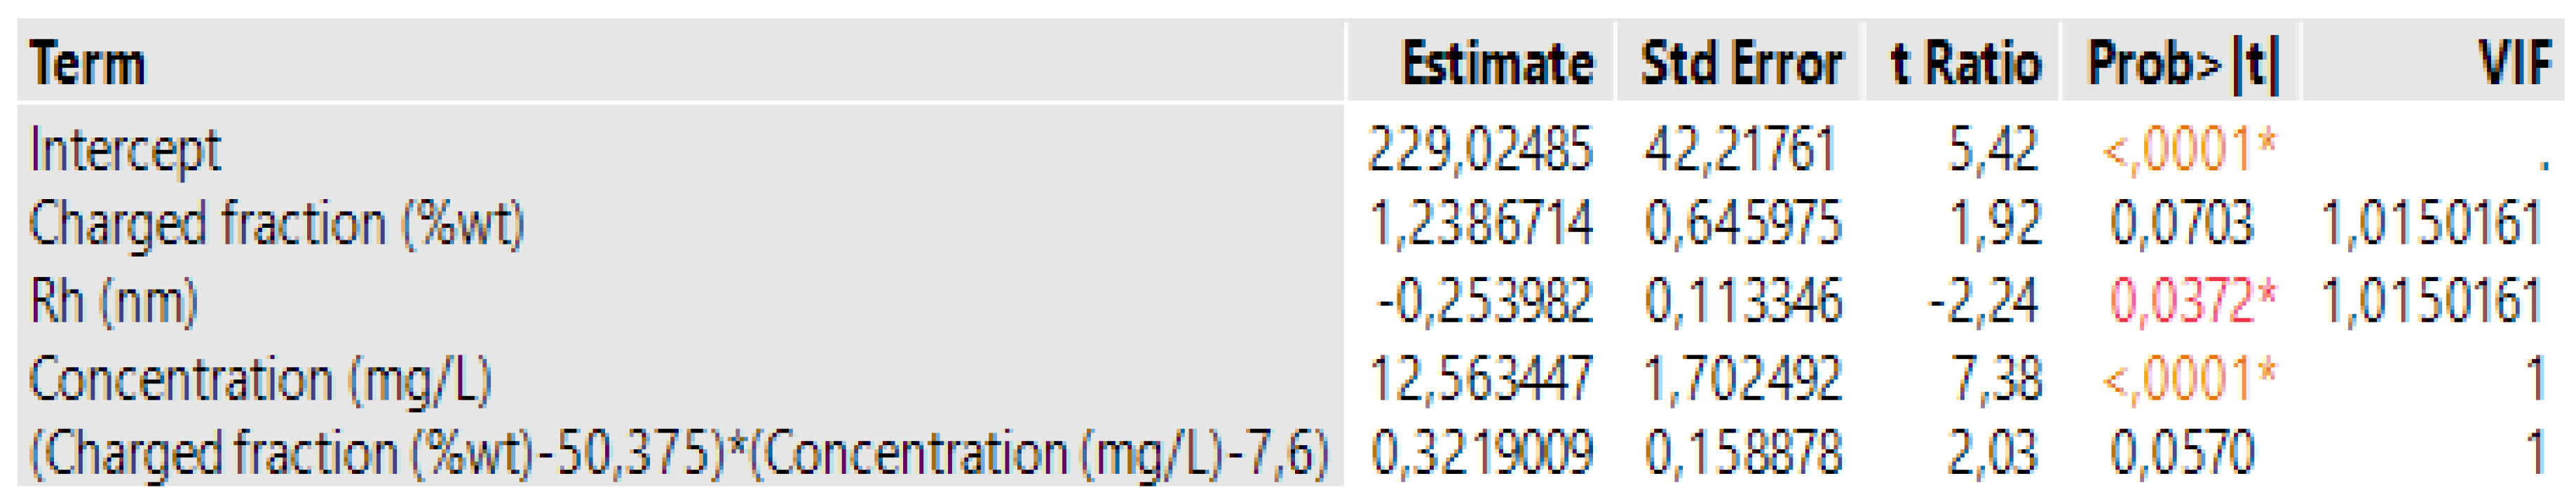
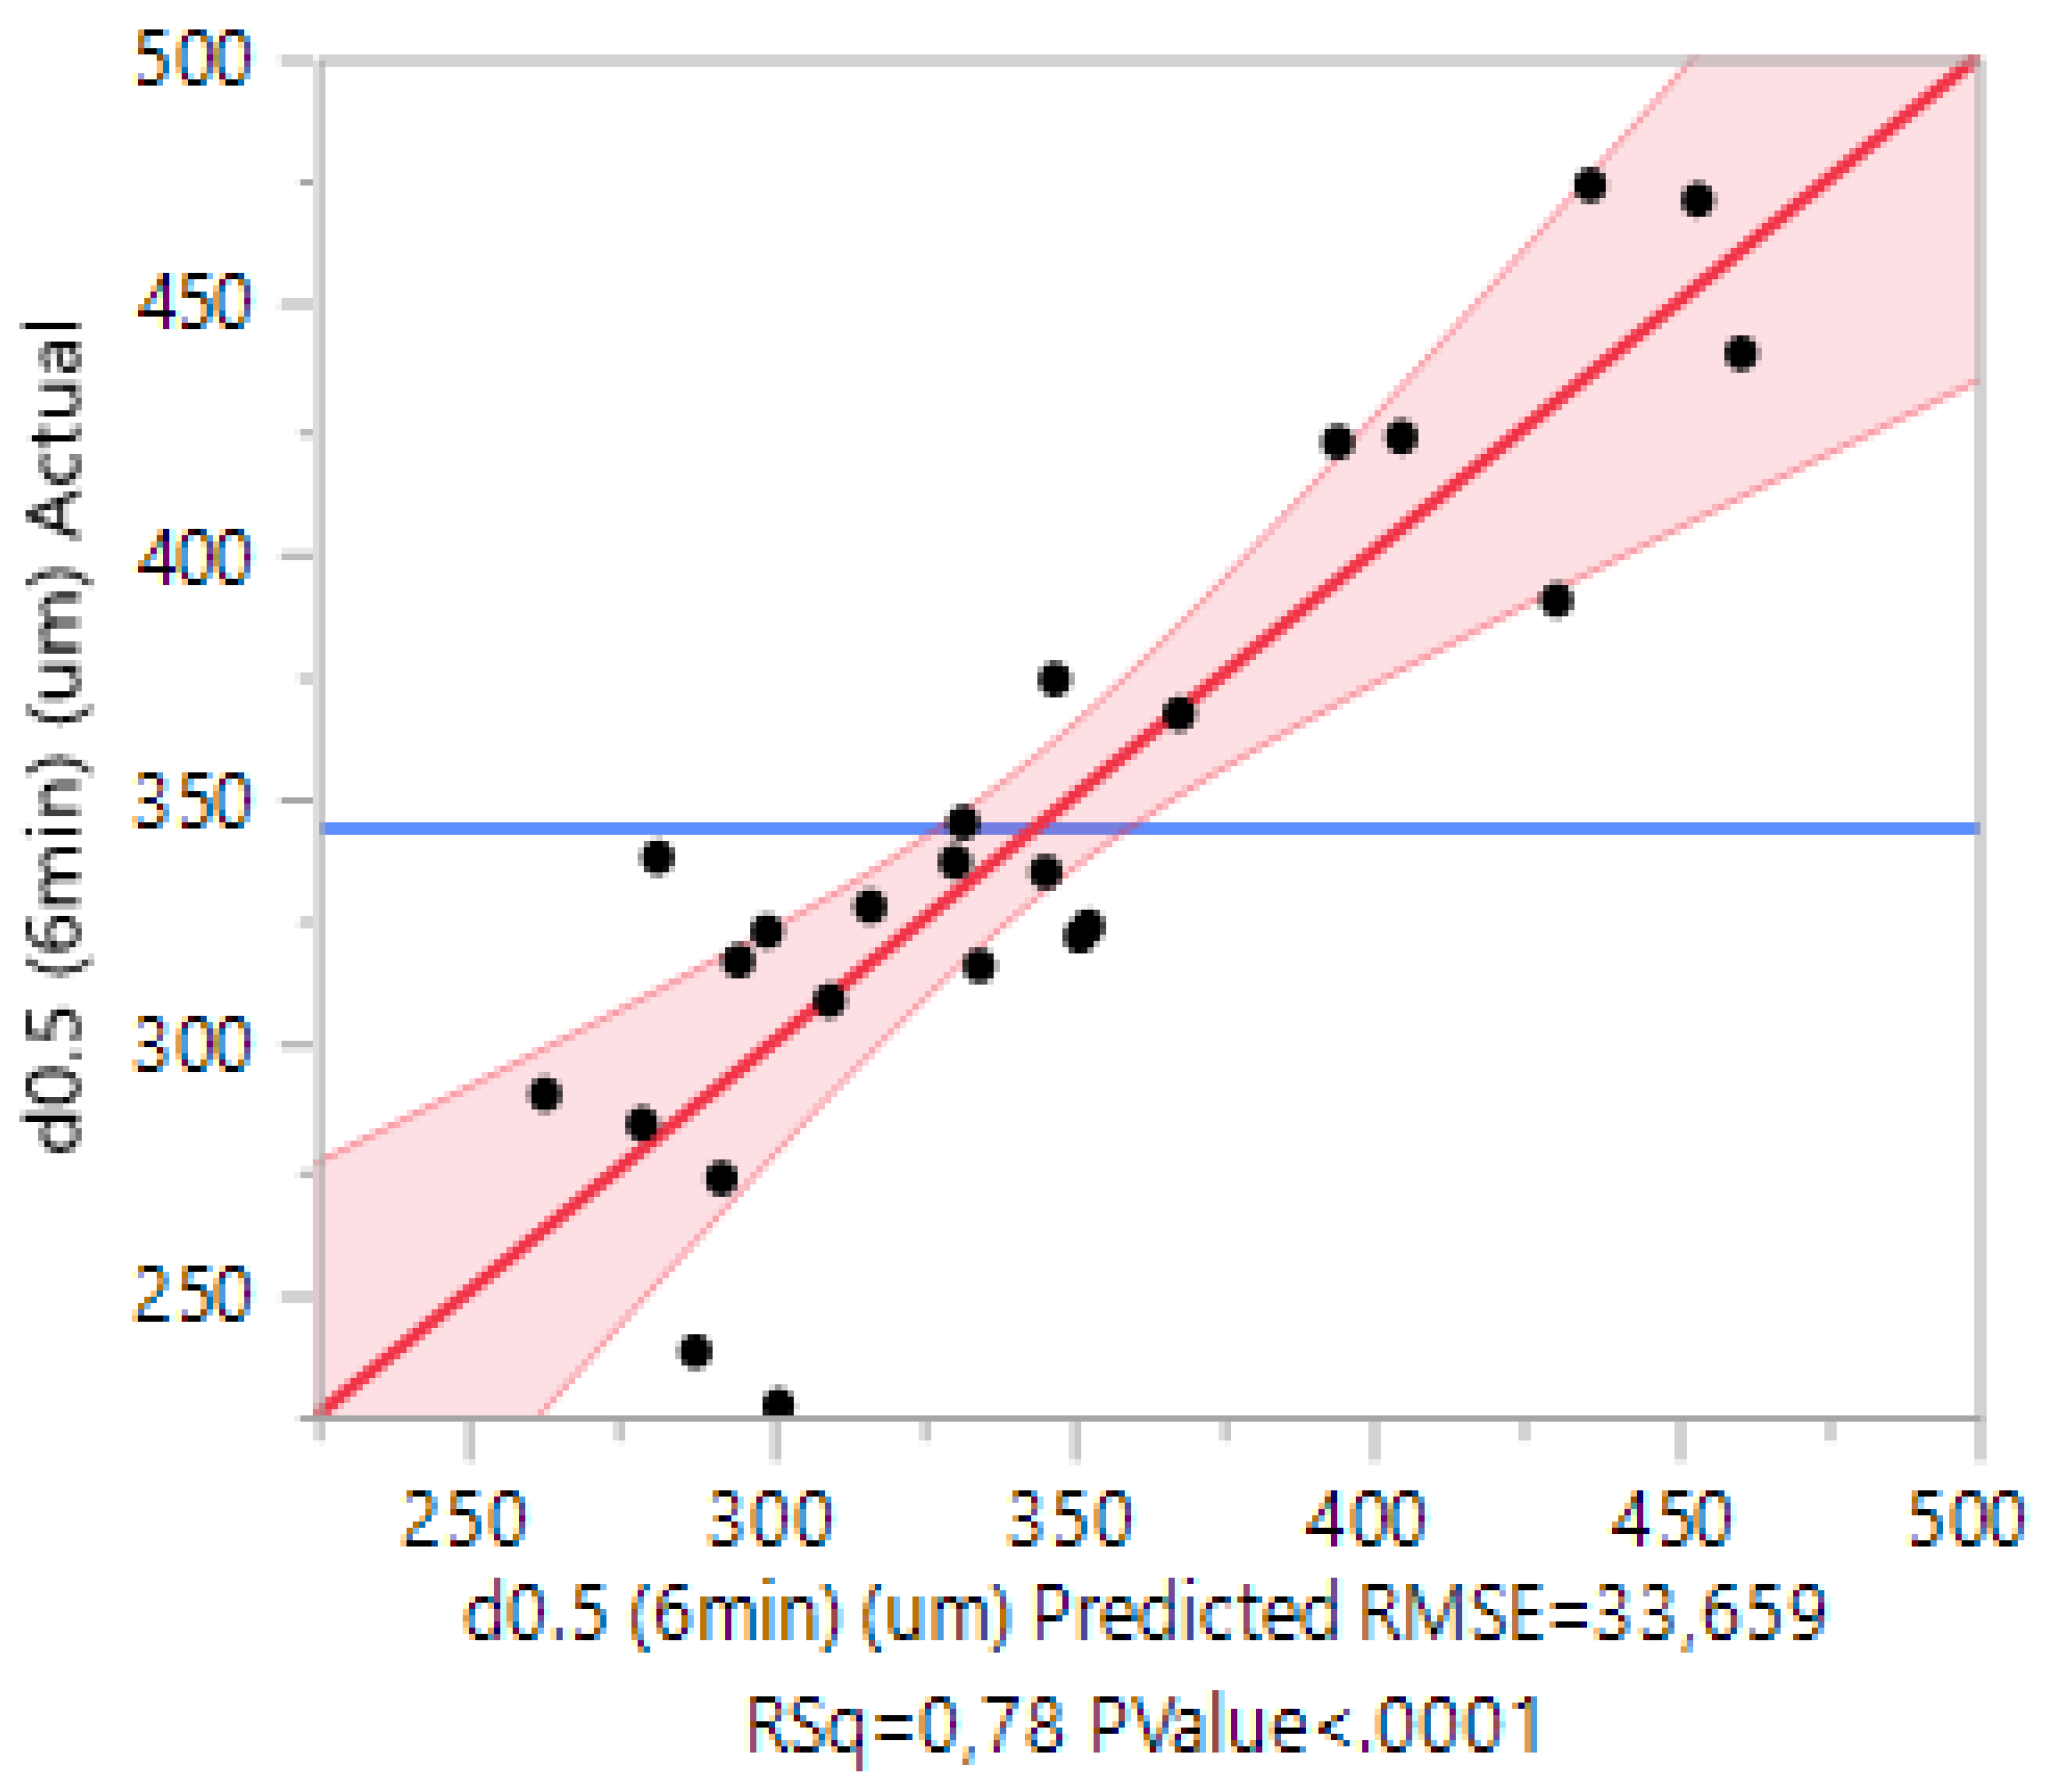
3.2. Case 2: The Prediction of the d0.5 for Copolymers

For this case, considering the effect summary table (Figure 5), the variables with the highest positive contribution to floc size are concentration and hydrodynamic diameter, but the influence of charged fraction, even though smaller, cannot be overlooked.
Figure 6 shows the corresponding summary of fit report for this case. The RSquare achieved is of about 0.92, also indicating a good fitting ability.
The parameter estimates report (Figure 7) shows the VIF values obtained for this case, which are all below 5, indicating no collinearity issues and suggesting that the regression method used is suitable for this model.
Figure 8 plots the actual response against the predicted response for this case. The plot indicates that the model describes the observations quite well. Furthermore, most of the observations are inside, or very close to, the prediction values.

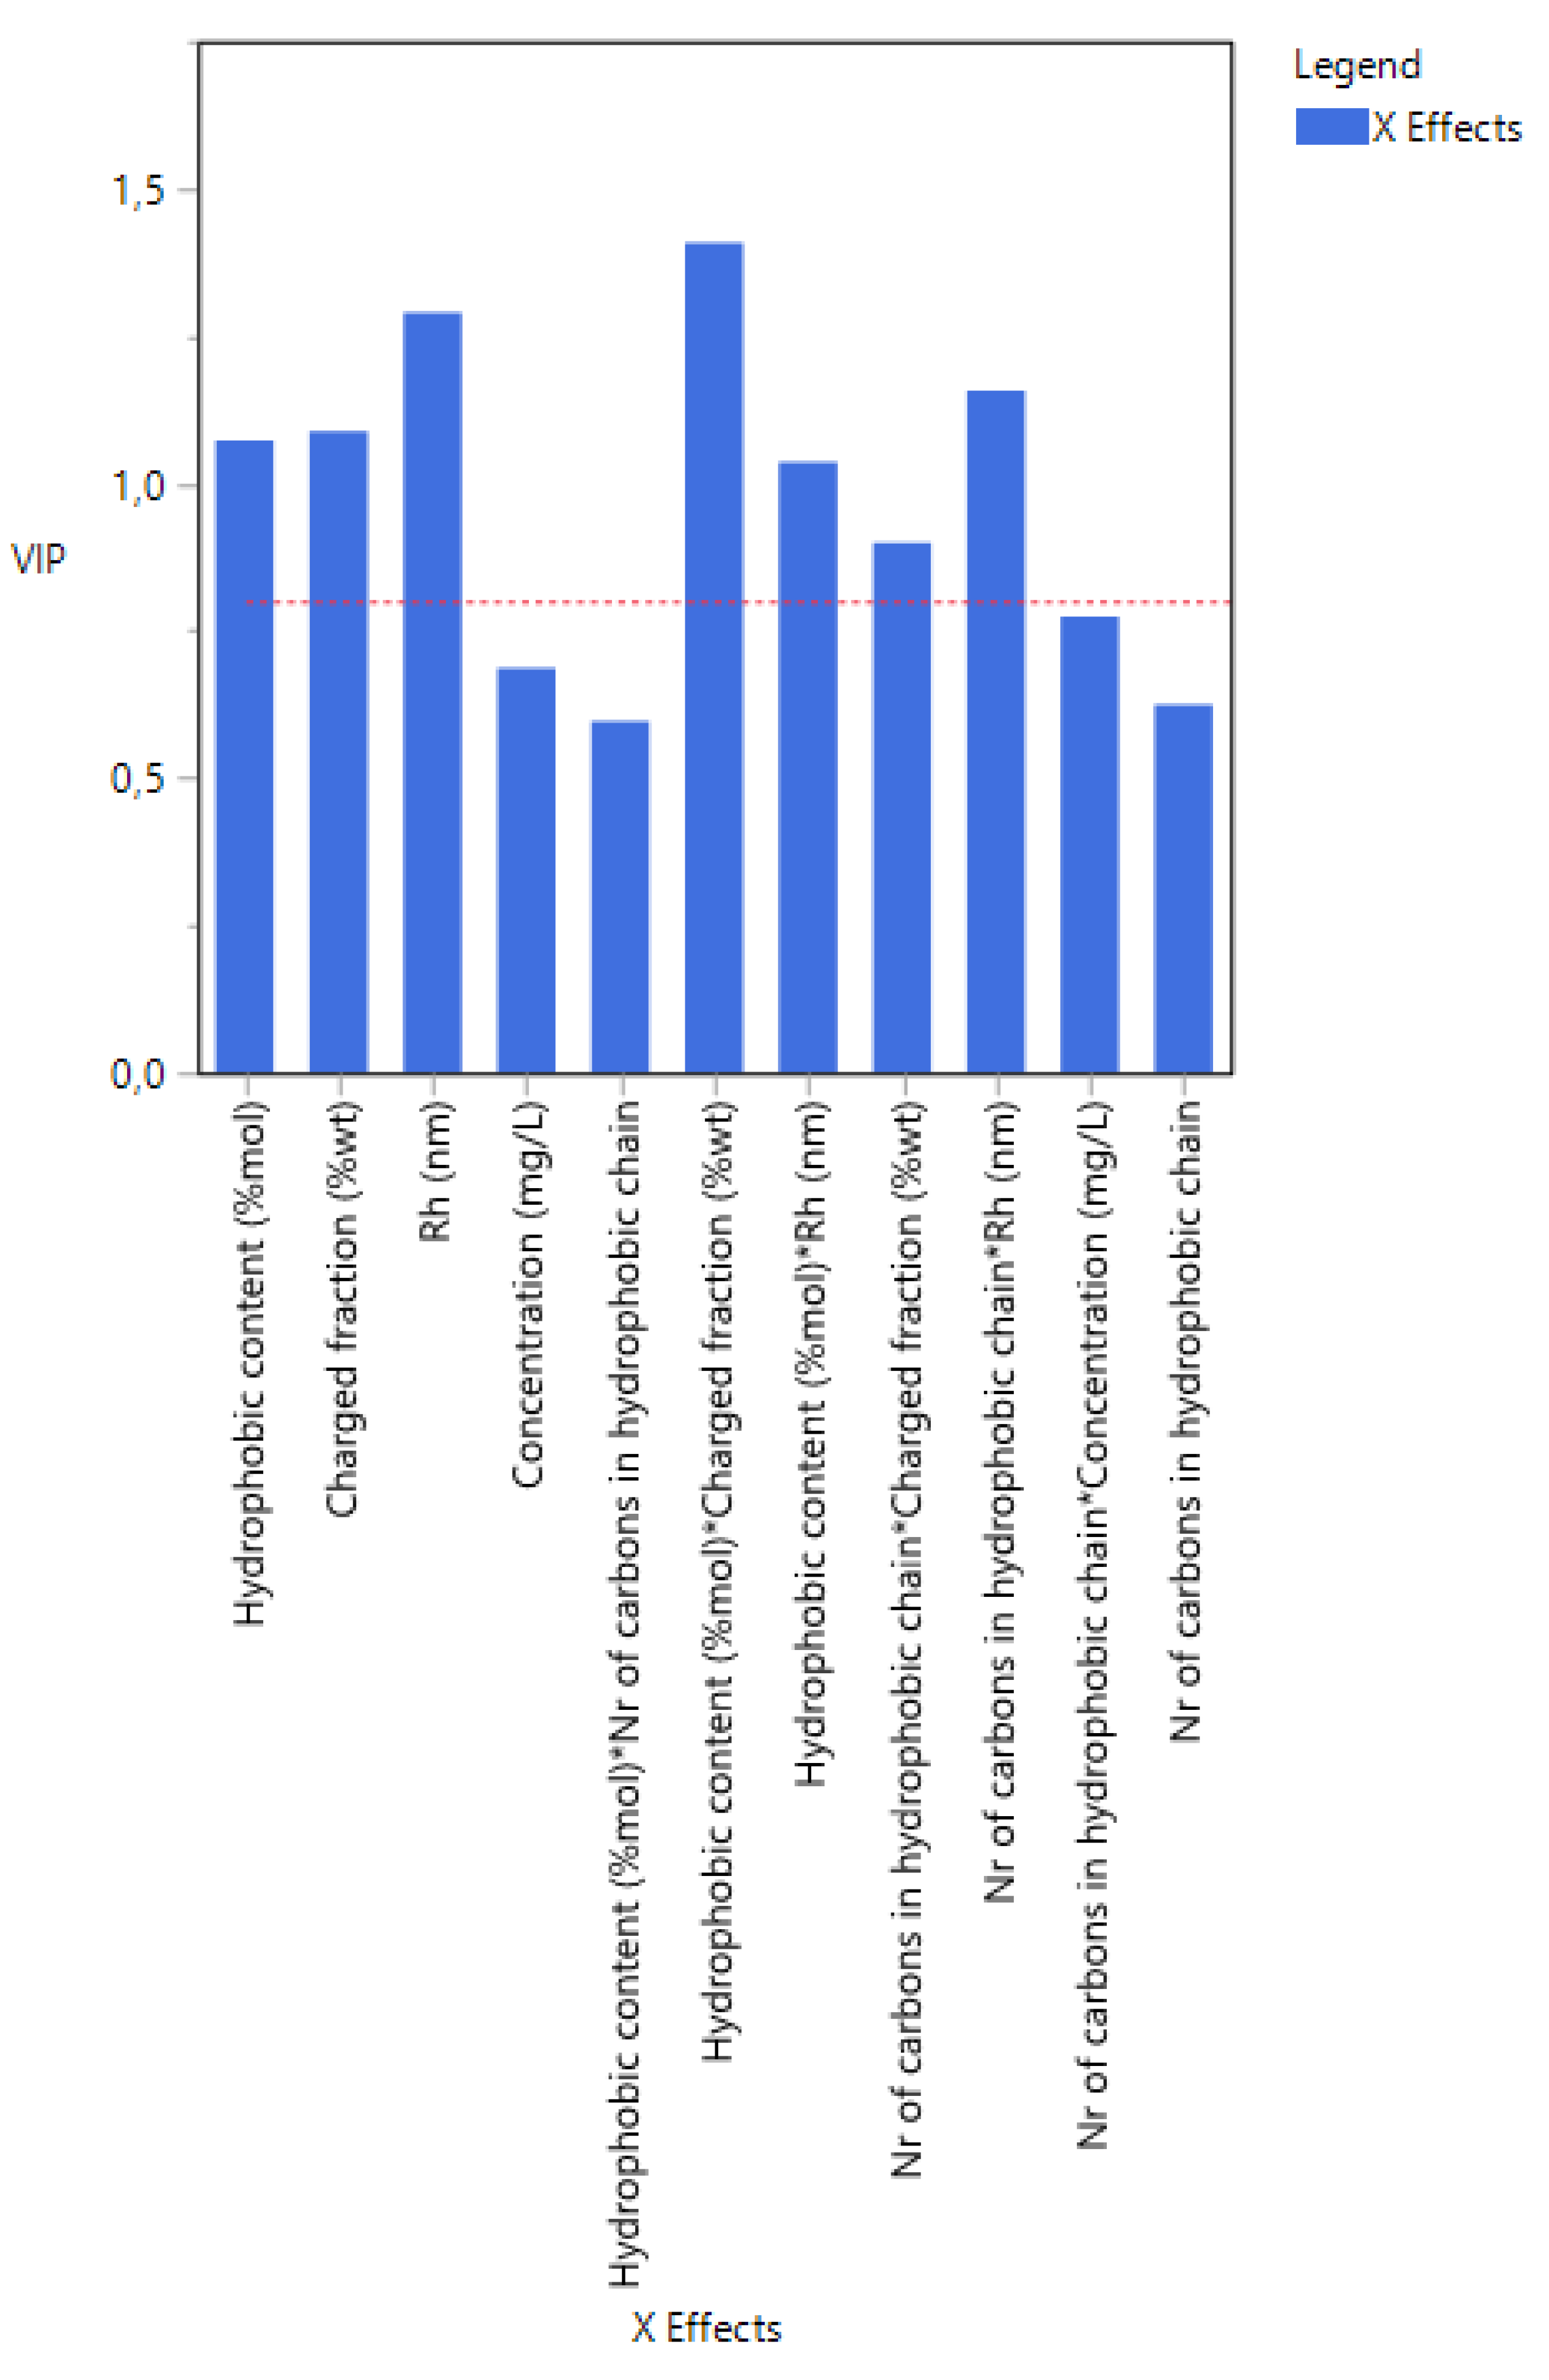
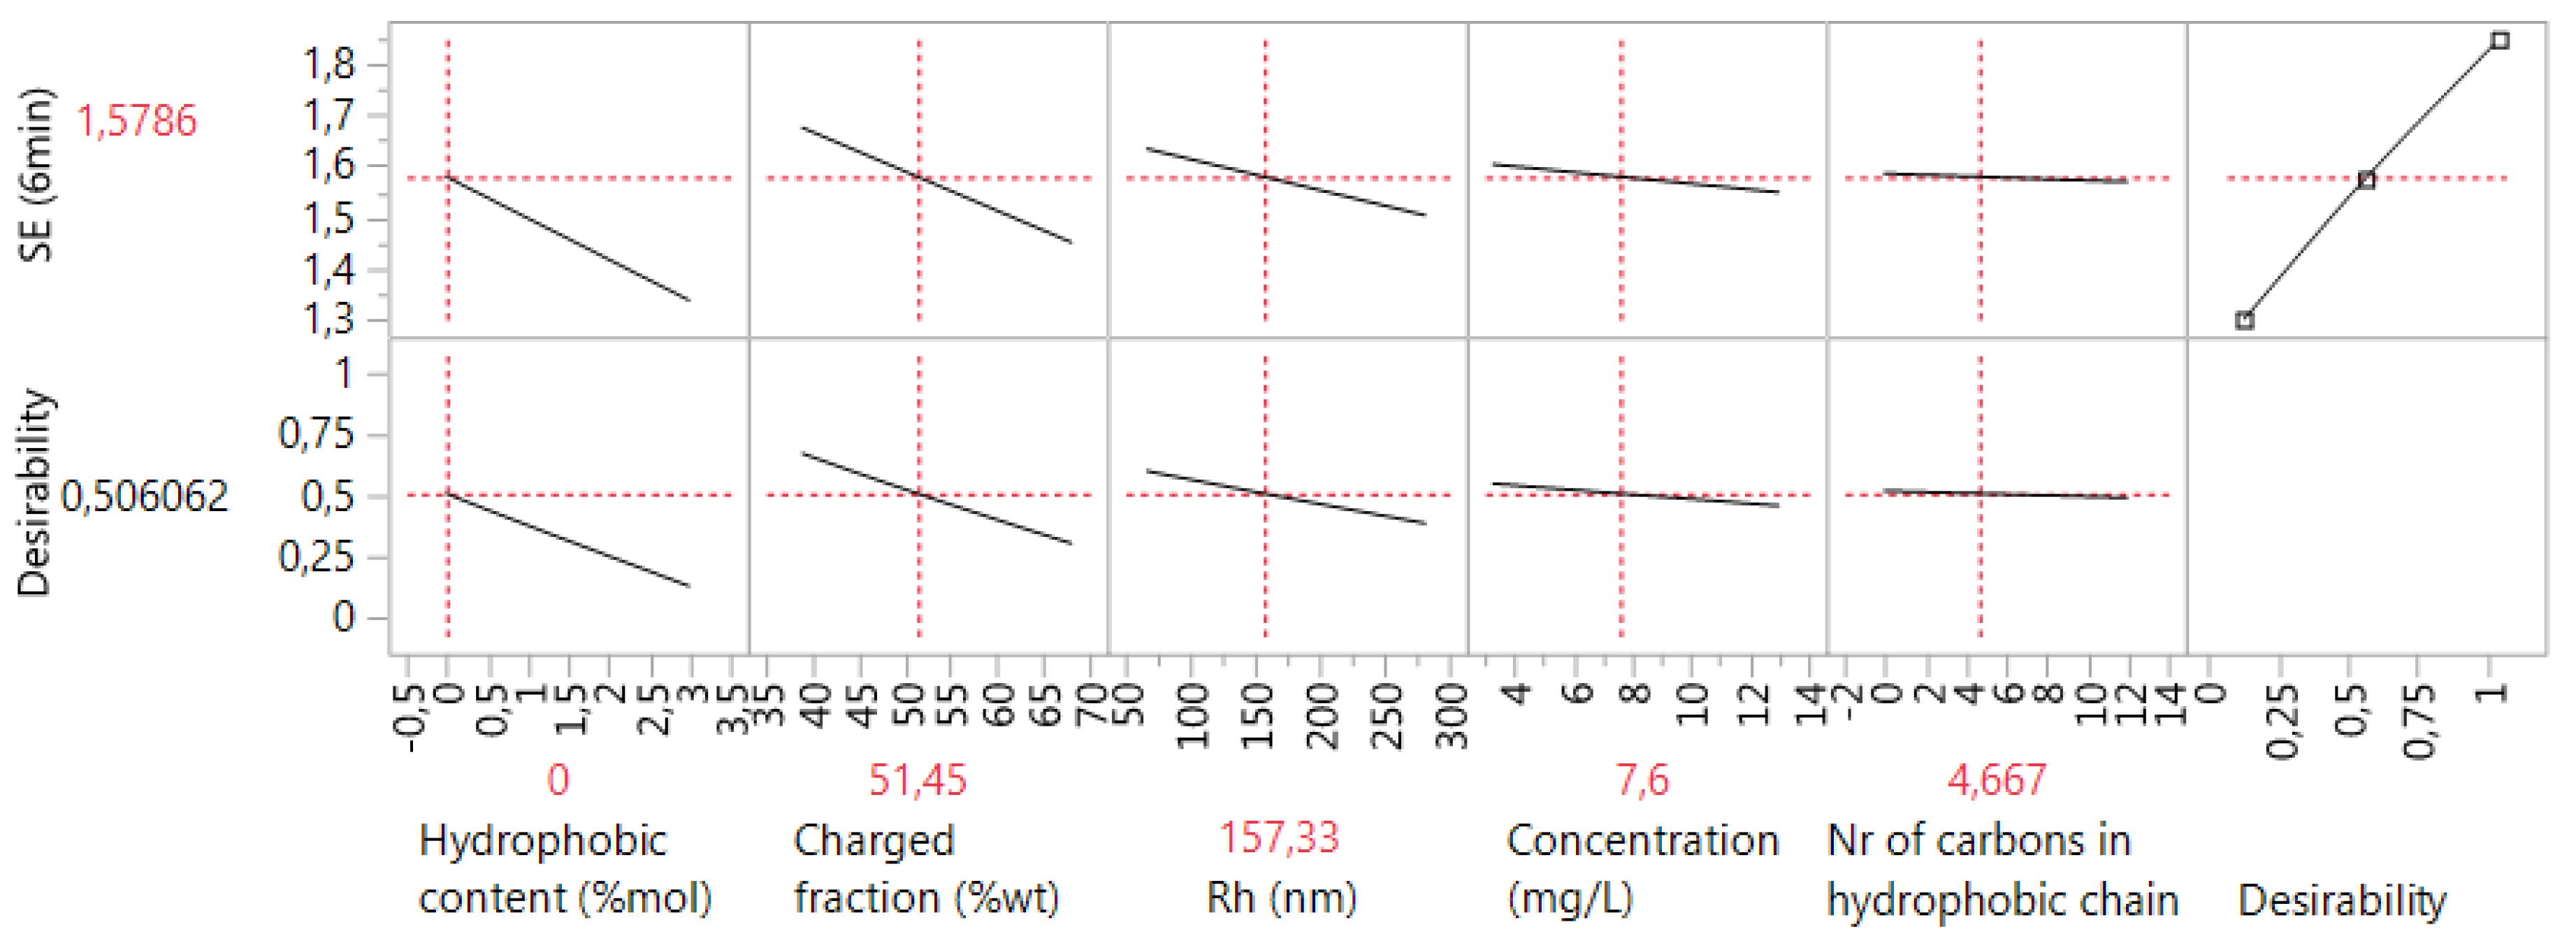
3.3. Case 3: The Prediction of the SE for Terpolymers

In the case of terpolymers, the predictor set is composed by the design factors—the hydrophobic content, number of methylene groups in the hydrophobic monomer and polymer concentration—and by the covariates: the charged fraction and hydrodynamic diameter. For this case, according to the effect summary table (Figure 9), the charged fraction is the factor having the highest contribution to the response, followed by the hydrodynamic diameter, the number of methylene groups in the hydrophobic chain, the interaction between the charged fraction and hydrodynamic diameter, and that between the number of methylene groups in the hydrophobic aliphatic chain and the charged fraction. Still, as in the previous cases, the two main parameters most influencing the response are the charged fraction and hydrodynamic diameter. For this specific case, the charged fraction seems to have even more influence than the hydrodynamic diameter, in contrast with the last two cases (for copolymers), perhaps due to the superior performance of the 50 polymer series, when compared with the 80 series, for the terpolymers tested in this effluent.
The summary of fit report (Figure 10) presents an RSquare of about 0.81, indicating a good fitting ability.
The parameter estimate report is present in Figure 11. The VIF values obtained in this case are also below 5, indicating no collinearity issues and leading to the conclusion that the model is suitable for this case.
Figure 12 plots the actual response against the predicted response. The plot indicates that the model describes, quite well, most of the observations. However, a few of them have larger residuals.

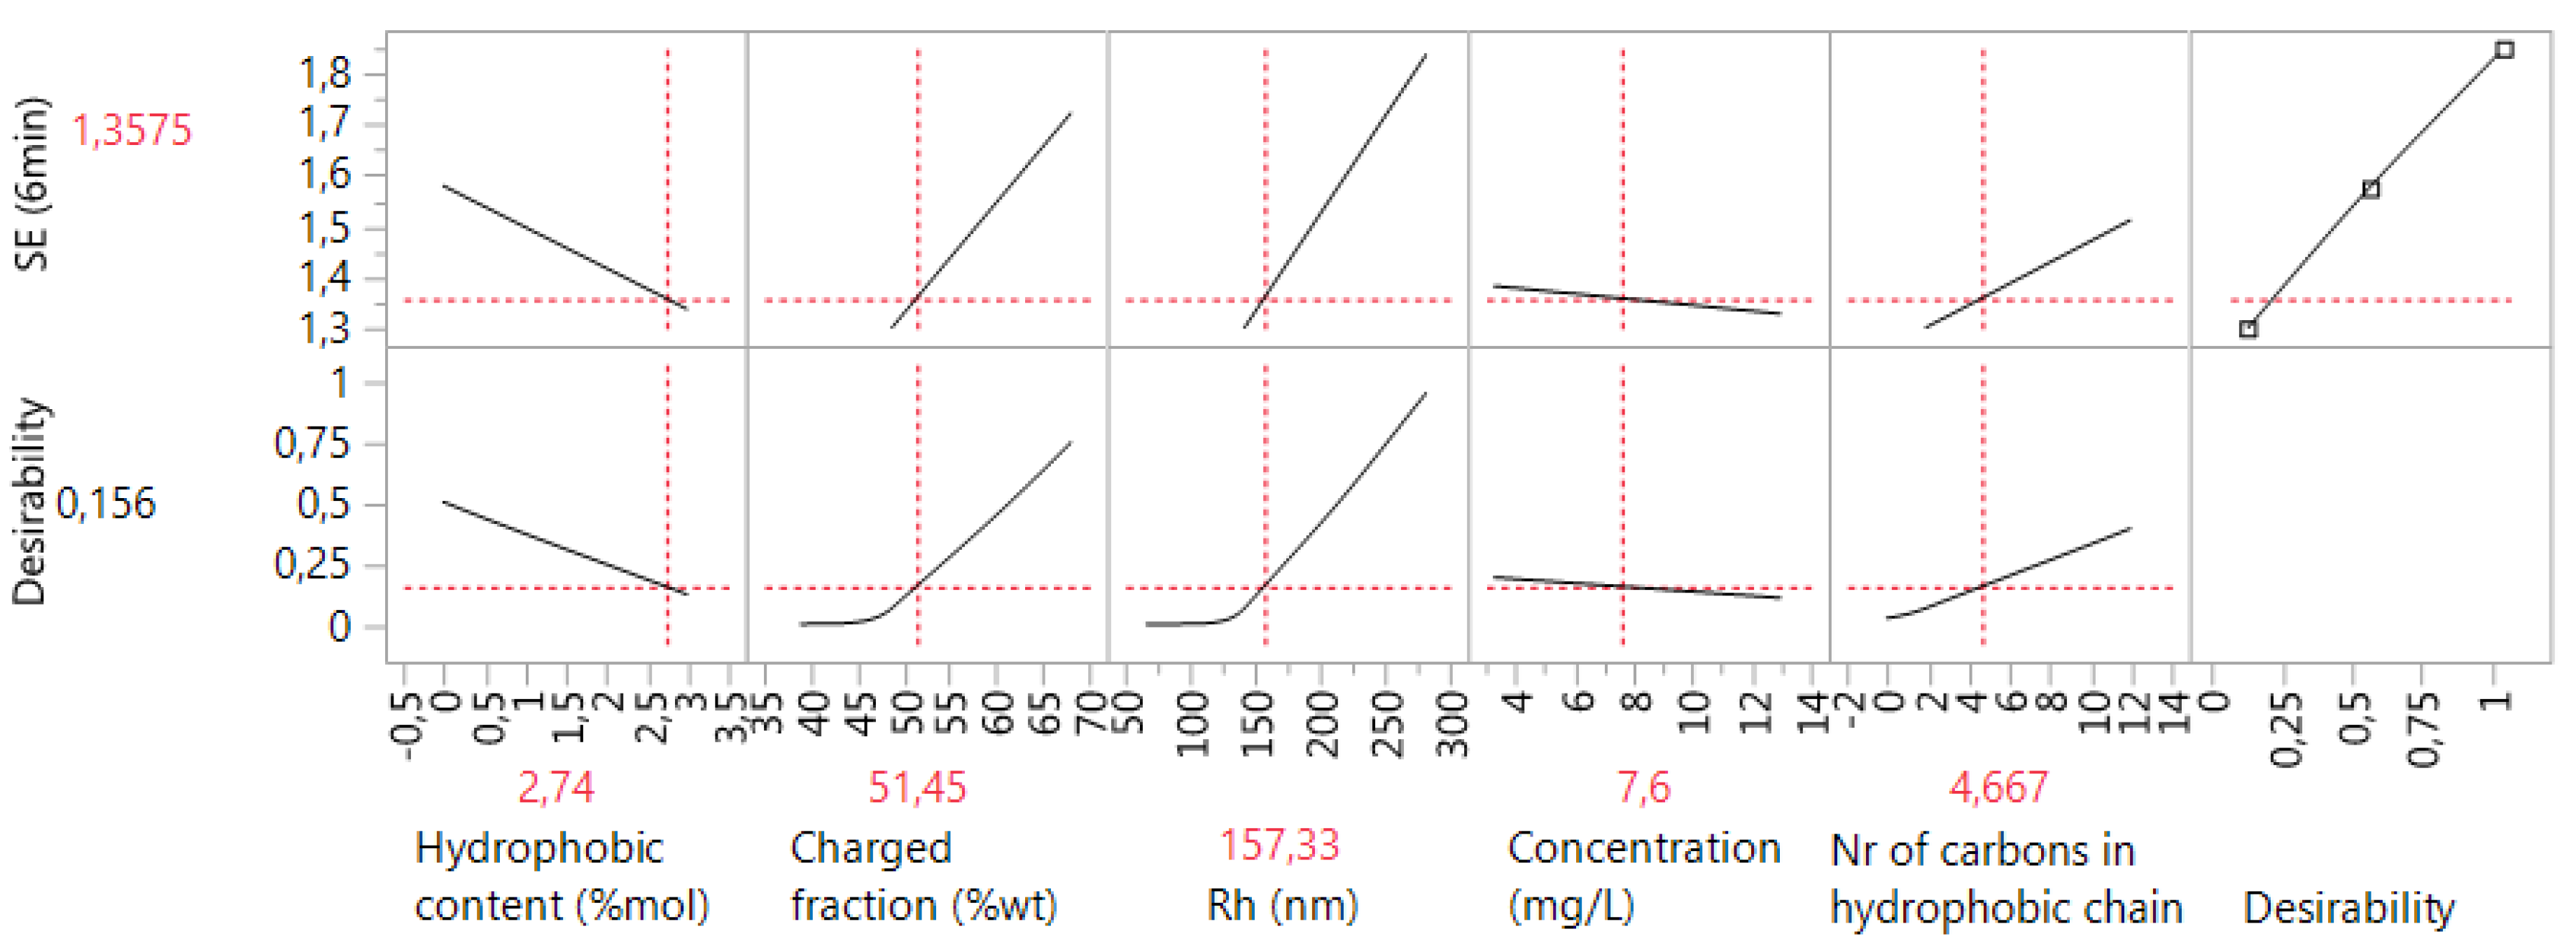
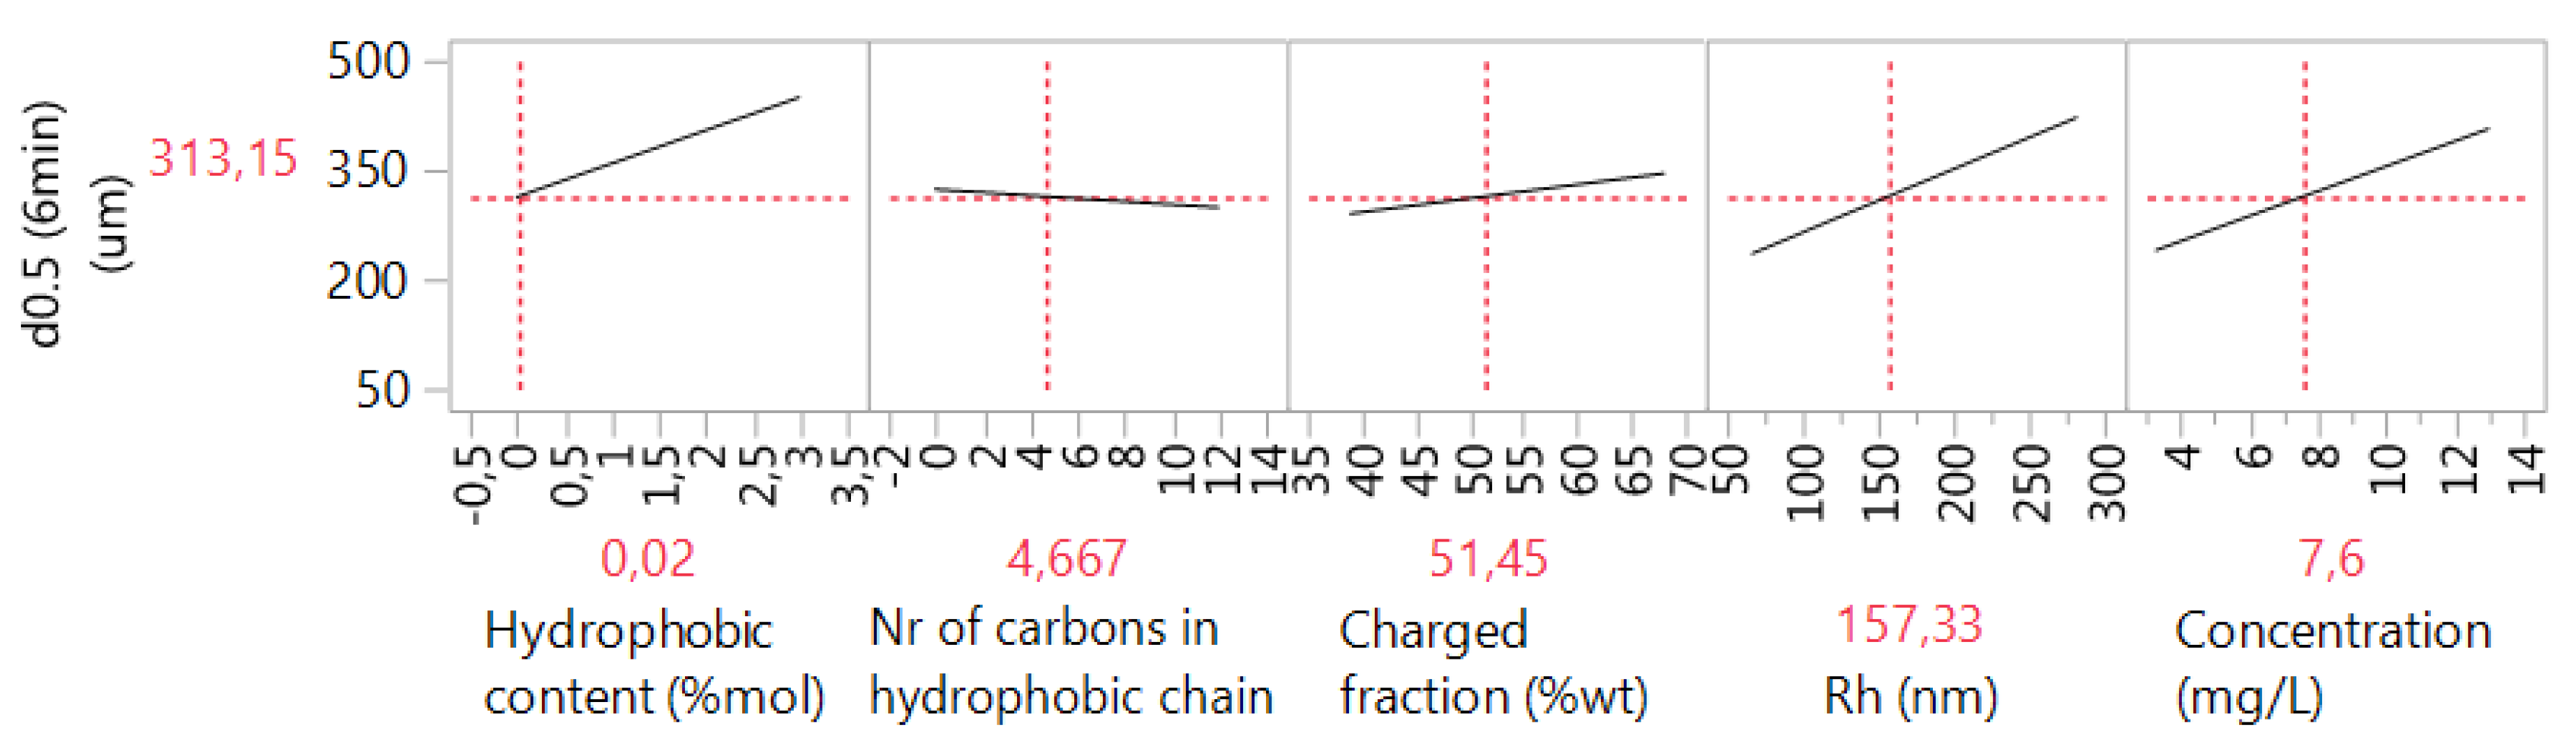
3.4. Case 4: The Prediction of the d0.5 for Terpolymers

Following the same analysis steps for case 4, one obtains the effect summary table presented in Figure 13, where concentration is clearly the most important factor. However the parameters that are the hydrodynamic diameter, charged fraction and interaction between the charged fraction and concentration cannot be neglected.
For this case, in the summary of fit report (Figure 14), RSquare is about 0.78, indicating a significant fitting capability.
The parameter estimates report (Figure 15) shows the VIF values obtained in this case, which are below 5, indicating no collinearity issues and suggesting that the regression method used is suitable for this model.
Figure 16 shows the actual response against the predicted response for this case. The model describes the observations quite well for most of the observations. However, a higher number of points fall out of the prediction interval. It must be stressed that the models considering terpolymers have higher numbers of observations, making it more difficult to derive a single model fitting all the points.

3.5. Case 5: The Prediction of the SE for Copolymers and Terpolymers

We have also investigated the possibility of building a global model to simultaneously fit all of the polymers considered. The last two cases reported here correspond to this analysis. In this case, we have adopted the PLS estimation approach, due to the appearance of collinearity when all of the data are combined. The estimated PLS model explains 90% of the variability in SE (with eight latent variables). The variable importance plot represents the VIP values for each predictor variable in a PLS model (Figure 17), which is a measure of their relevance in the model. If a variable has a small coefficient and a small VIP, then it can be concluded that its importance is reduced. A value of 0.8 is generally considered to be a significant VIP, and a blue line is drawn on the plot at 0.8 to better identify these situations. As mentioned before, seven variables have VIP values above 0.8. In this case, the hydrodynamic diameter, the interaction of the hydrophobic content and charged fraction, and the interaction of the number of methylene groups in the aliphatic chain and the hydrodynamic diameter seem to be the variables that have greater influence in the response, even if the hydrophobic content and charged fraction also have a quite high influence in the model.
The influence of polymer characteristics in the SE values was evaluated using the current regression method (Figure 18). It is possible to verify the presence of a noticeable interaction effect triggered by the hydrophobic content. When there is no hydrophobic content (copolymers only), the SE values decrease with the increase of the hydrodynamic diameter and concentration, since when there is a high amount of polymer and the polymer chains are longer, there is more space between bridged particles, conducting to more open flocs (a lower SE). Understandably, in this case, there is no influence of the number of methylene groups on the response SE.
When the hydrophobic content is at a maximum (terpolymers with 3 mol% of hydrophobic content) (Figure 19), the SE values increase with the increase of the charged fraction, hydrodynamic diameter and number of methylene groups in the hydrophobic chain. Thus, the presence of the hydrophobic monomer has the capability to change the way the SE depends on other predictors, such as the charged fraction and hydrodynamic diameter. The influence of the hydrophobic chain and charged fraction can be attributed to the increased regions in the polymer chain that are able to interact with the oily effluent particles, increasing the compactness of the flocs (higher SE values).

3.6. Case 6: The Prediction of the d0.5 for Copolymers and Terpolymers

A PLS model was also used for handling the collinearity issues in this case (Y-variability of 89% explained with seven latent variables). A variable importance plot for case 6 is present in Figure 20. The concentration and the interaction of the hydrophobic content with the hydrodynamic diameter appear to be the variables with larger influences on floc size, even if the hydrodynamic diameter also has a significant impact on the response. The interaction of the hydrophobic content and the number of carbons, the interaction of the hydrophobic content and concentration, and the interaction of the number of carbons with the charged fraction have the shortest bars, indicating that they are not particularly correlated to floc size.
The influence of polymer characteristics on the median floc size can be observed in the profiles shown in Figure 21. It was observed that when there is no hydrophobic content (copolymers only), the median floc size increases with the increase of the charged fraction, hydrodynamic diameter and concentration, due to a larger number of attachment regions in the polymer chain to adsorb particles, which consequently leads to larger flocs. As expected, there is no influence of the number of methylene groups on the d0.5.
When the hydrophobic content is at its maximum (terpolymers with 3 mol% of hydrophobic content) (Figure 22), the influence of the charged fraction and hydrodynamic diameter is the opposite of what happens when there is no hydrophobic content. Once again, a strong influence of the hydrophobic content on the trends for other predictors was observed. The influence of the number of methylene groups seems to be stronger when the polymer comprises higher hydrophobic content. Thus, larger number of methylene groups led to smaller flocs, suggesting that there is an ideal length of hydrophobic chain that is beneficial to obtaining large flocs and high flocculation efficiency. This interaction effect is quite interesting and offers new possibilities to develop better flocculants in the future.

4. Conclusions

The experimental design and data analysis allowed to infer which polyelectrolyte characteristics are critical for the flocs’ size and structure, and how they affect these properties in a quantitative way. The hydrodynamic diameter, charged fraction and concentration are the parameters with the greatest influence on the size and structure of the flocs obtained with the copolymers studied, while the charged fraction, concentration and hydrophobic content proved to have more influence on the characteristics of the flocs produced using the terpolymers developed. The effect of the hydrophobic content suggests that the presence of hydrophobicity is favourable for the flocculation process of oily effluents; however, there is an optimum hydrophobic content that optimizes the floc size, and above which the effect is no longer beneficial.
Finally, the analysis conducted showed that there is a strong dependence of the responses upon the level of hydrophobic content employed, as the trends regarding the remaining factors can even be inverted by manipulating this factor. This effect is mostly due to the distinct interaction between the effluent oily particles and the hydrophobic chains. These results open new perspectives for developing flocculants with tailor-made characteristics for processing a given effluent of interest.

Author Contributions

The manuscript was written through contributions of all authors: A.L. conducted the simulations; M.S.R. supervised the development of the statistical calculations; J.A. helped in the development of the flocculants; M.G.R. supervised the whole work especially the process of obtaining the flocculation data and flocs characteristics. All authors have read and agreed to the published version of the manuscript.

Funding

This work was supported by the Marie Curie Initial Training Networks (ITN)—European Industrial Doctorate (EID), through Grant agreement FP7-PEOPLE-2013-ITN-604825. The authors would like to thank as well the financial support of the Portuguese Science and Technology Foundation (UIDB/00102/2020).

Acknowledgments

Acknowledgements to Adventech Group (Portugal) are due for supplying the effluent.

Conflicts of Interest

The authors declare no conflict of interest.

References

  1. Jarvis, P.; Parsons, S.A.; Henderson, R.; Nixson, N.; Jefferson, B. The practical application of fractal dimension in water treatment practice–the impact of polymer dosing. Sep. Sci. Technol. 2008, 43, 1785–1797. [Google Scholar] [CrossRef] [Green Version]
  2. Lee, C.S.; Robinson, J.; Chong, M.F. A review on application of flocculants in wastewater treatment. Process Saf. Environ. Prot. 2014, 92, 489–508. [Google Scholar] [CrossRef]
  3. Kleimann, J.; Gehin-Delval, C.; Auweter, H.; Borkovec, M. Super-stoichiometric charge neutralization in particle-polyelectrolyte systems. Langmuir 2005, 21, 3688–3698. [Google Scholar] [CrossRef] [PubMed]
  4. Biggs, S.; Habgood, M.; Jameson, G.J.; Yan, Y. Aggregate structures formed via a bridging flocculation mechanism. Chem. Eng. J. 2000, 80, 13–22. [Google Scholar] [CrossRef]
  5. Ahmad, A.; Wong, S.; Teng, T.; Zuhairi, A. Improvement of alum and PACl coagulation by polyacrylamides (PAMs) for the treatment of pulp and paper mill wastewater. Chem. Eng. J. 2008, 137, 510–517. [Google Scholar] [CrossRef]
  6. Caskey, J.A.; Primus, R.J. The effect of anionic polyacrylamide molecular conformation and configuration on flocculation effectiveness. Environ. Prog. 1986, 5, 98–103. [Google Scholar] [CrossRef]
  7. Blanco, A.; Fuente, E.; Negro, C.; Tijero, J. Flocculation monitoring: Focused beam reflectance measurement as a measurement tool. Can. J. Chem. Eng. 2008, 80, 1–7. [Google Scholar] [CrossRef]
  8. Eriksson, L.; Alm, B.; Stenius, P. Formation and structure of polystyrene latex aggregates obtained by flocculation with cationic polyelectrolytes. Colloids Surfaces A Physicochem. Eng. Asp. 1993, 70, 47–60. [Google Scholar] [CrossRef]
  9. Hadjivassilis, I.; Gajdos, S.; Vanco, D.; Nicolaou, M. Treatment of wastewater from the potato chips and snacks manufacturing industry. Water Sci. Technol. 1997, 36, 329–335. [Google Scholar] [CrossRef]
  10. Haydar, A.H.S.; Hussain, G.; Nadeem, O.; Haider, H.; Bari, A.J. Performance evaluation of anaerobic-aerobic treatment for the wastewater of potato processing industry: A case study of a local chips factory. Pakistan J. Eng. Appl. Sci. 2014, 14, 27–37. [Google Scholar]
  11. Kobya, M.; Hiz, H.; Senturk, E.; Aydiner, C.; Demirbas, E. Treatment of potato chips manufacturing wastewater by electrocoagulation. Desalination 2006, 190, 201–211. [Google Scholar] [CrossRef]
  12. Krzemińska, D.; Neczaj, E.; Borowski, G. Advanced oxidation processes for food industrial wastewater decontamination. J. Ecol. Eng. 2015, 16, 61–71. [Google Scholar] [CrossRef]
  13. Wu, D.; Yang, Z.; Wang, W.; Tian, G.; Xu, S.; Sims, A. Ozonation as an advanced oxidant in treatment of bamboo industry wastewater. Chemosphere 2012, 88, 1108–1113. [Google Scholar] [CrossRef] [PubMed]
  14. Asghar, A.; Raman, A.A.A.; Wan Daud, W.M.A. Advanced oxidation processes for in-situ production of hydrogen peroxide/hydroxyl radical for textile wastewater treatment: A review. J. Clean. Prod. 2015, 87, 826–838. [Google Scholar] [CrossRef] [Green Version]
  15. Lourenço, A.; Arnold, J.; Cayre, O.J.; Rasteiro, M.G. Flocculation Treatment of an Industrial Effluent: Performance Assessment by Laser Diffraction Spectroscopy. Ind. Eng. Chem. Res. 2018, 57, 2628–2637. [Google Scholar] [CrossRef]
  16. Liao, J.Y.H.; Selomulya, C.; Bushell, G.; Bickert, G.; Amal, R. On Different Approaches to Estimate the Mass Fractal Dimension of Coal Aggregates. Part. Part. Syst. Charact. 2005, 22, 299–309. [Google Scholar] [CrossRef]
  17. Montgomery, D.C. Design and Analysis of Experiments, 8th ed.; John Wiley & Sons: Hoboken, NY, USA, 2012. [Google Scholar]
  18. Box, G.E.P.; Hunter, J.S.; Hunter, W.G. Statistics for Experimenters: Design, Innovation, and Discovery, 2nd ed.; Wiley: Hoboken, NJ, USA, 2005. [Google Scholar]
  19. Hamilton, J. Time Series Analysis; Princeton University Press: Princeton, NJ, USA, 1994. [Google Scholar]
  20. Wold, S.; Sjöström, M.; Eriksson, L. PLS-regression: A basic tool of chemometrics. Chemom. Intell. Lab. Syst. 2001, 58, 109–130. [Google Scholar] [CrossRef]
  21. Warne, M.A.; Lenz, E.M.; Osborn, D.; Weeks, J.M.; Nicholson, J.K. Comparative biochemistry and short-term starvation effects on the earthworms Eisenia veneta and Lumbricus terrestris studied by 1H NMR spectroscopy and pattern recognition. Soil Biol. Biochem. 2001, 33, 1171–1180. [Google Scholar] [CrossRef]
  22. Lourenço, A.; Arnold, J.; Gamelas, J.A.F.; Cayre, O.J.; Rasteiro, M.G. Anionic Polyelectrolytes Synthesized in an Aromatic-Free-Oils Process for Application as Flocculants in Dairy-Industry-Effluent Treatment. Ind. Eng. Chem. Res. 2018, 57, 16884–16896. [Google Scholar] [CrossRef]
Figure 1. An effect summary table for case 1.
Processes 08 00349 g001
Figure 2. A summary of fit report for case 1.
Processes 08 00349 g002
Figure 3. The parameter estimates report for case 1 (JMP displays an asterisk next to the Prob>|t| values that are less than 0.05).
Processes 08 00349 g003
Figure 4. An actual versus predicted plot for case 1.
Processes 08 00349 g004
Figure 5. An effect summary table for case 2.
Processes 08 00349 g005
Figure 6. A summary of fit report for case 2.
Processes 08 00349 g006
Figure 7. The parameter estimates for case 2.
Processes 08 00349 g007
Figure 8. An actual versus predicted plot for case 2.
Processes 08 00349 g008
Figure 9. An effect summary for case 3.
Processes 08 00349 g009
Figure 10. A summary of fit for case 3.
Processes 08 00349 g010
Figure 11. The parameter estimates for case 3.
Processes 08 00349 g011
Figure 12. An actual versus predicted plot for case 3.
Processes 08 00349 g012
Figure 13. An effect summary for case 4.
Processes 08 00349 g013
Figure 14. A summary of fit for case 4.
Processes 08 00349 g014
Figure 15. The parameter estimates for case 4.
Processes 08 00349 g015
Figure 16. An actual versus predicted plot for case 4.
Processes 08 00349 g016
Figure 17. A variables importance plot for case 5.
Processes 08 00349 g017
Figure 18. A prediction profiler for no hydrophobic content for case 5.
Processes 08 00349 g018
Figure 19. A prediction profiler for maximum hydrophobic content (3 mol%), for case 5.
Processes 08 00349 g019
Figure 20. A variables importance plot for case 6.
Processes 08 00349 g020
Figure 21. A prediction profiler for no hydrophobic content for case 6.
Processes 08 00349 g021
Figure 22. A prediction profiler for maximum hydrophobic content (3 mol%), for case 6.
Processes 08 00349 g022
Table 1. A summary of the anionic polyelectrolytes used [15]. The initial composition at the beginning of polymerization and the organic phase used in the formulation are supplied. Copolymers Poly(AAm-Na-AMPS): 50AC, 80AC, 50AP and 80AP. Terpolymers Poly(AAm-Na-AMPS-EA): 50A1EC, 50A3EC, 80A1EC and 80A3EC. Terpolymers Poly(AAm-Na-AMPS-LMA): 50A1LC, 50A3LC, 80A1LC and 80A3LC. Terpolymers Poly(AAm-Na-AMPS-SMA): 50A1SC, 50A3SC, 80A1SC and 80A3SC.
Polymer CodeAAm Ratio
(wt %)/(mol %)
Na-AMPS Ratio
(wt %)/(mol %)
Hydro-Phobic MonomerRatio (wt %)Ratio (mol %)Organic Phase for Polymerization
50AC50.074.050.026.0---Carnation
80AC20.042.080.058.0---Carnation
50AP50.074.050.026.0---Puresyn4
80AP20.042.080.058.0---Puresyn4
50A1EC49.474.049.425.0EA1.21.0Carnation
50A3EC48.572.048.525.0EA3.03.0Carnation
80A1EC19.742.079.757.0EA0.61.0Carnation
80A3EC19.040.079.057.0EA2.03.0Carnation
50A1LC48.574.048.525.0LMA3.01.0Carnation
50A3LC47.073.047.025.0LMA6.03.0Carnation
80A1LC19.041.079.058.0LMA2.01.0Carnation
80A3LC17.539.077.558.0LMA5.03.0Carnation
50A1SC48.074.048.025.0SMA4.01.0Carnation
50A3SC46.072.046.025.0SMA8.03.0Carnation
80A1SC19.041.079.058.0SMA2.01.0Carnation
80A3SC17.038.077.059.0SMA6.03.0Carnation
Table 2. A summary of the experimental conditions tested according to the experimental design methodology and the flocculation results obtained for the response variables (scattering exponent, SE, and median floc size, d(0.5)).
Polymer CodeHydrophobic Content (mol %)Nr of Carbons in Hydrophobic ChainMeasured Charged Fraction (wt %)Rh (nm)Concentration (mg/L)SEd(0.5)
(µm)
50AC0- 41.567 ± 23.31.8195
50AC0- 41.567 ± 26.51.84177
50AC0- 41.567 ± 2131.69340
80AC0- 62.972 ± 13.31.68254
80AC0- 62.972 ± 16.51.62294
80AC0- 62.972 ± 1131.58352
50AP0- 41.9265 ± 373.31.53330
50AP0- 41.9265 ± 376.51.52359
50AP0- 41.9265 ± 37131.39497
80AP0- 68.1147 ± 43.31.52283
80AP0- 68.1147 ± 46.51.5302
80AP0- 68.1147 ± 4131.44428
50A1EC1239.570 ± 13.31.37328
50A1EC1239.570 ± 16.51.37335
50A1EC1239.570 ± 1131.35423
50A3EC3239.7282 ± 323.31.46290
50A3EC3239.7282 ± 326.51.45273
50A3EC3239.7282 ± 32131.43322
80A1EC1262.2143 ± 103.31.6317
80A1EC1262.2143 ± 106.51.64374
80A1EC1262.2143 ± 10131.46471
80A3EC3261.6206 ± 223.31.73284
80A3EC3261.6206 ± 226.51.74337
80A3EC3261.6206 ± 22131.65474
50A1LC11241129 ± 103.31.51227
50A1LC11241129 ± 106.51.47345
50A1LC11241129 ± 10131.5422
50A3LC31239209 ± 283.31.5338
50A3LC31239209 ± 286.51.54309
50A3LC31239209 ± 28131.53367
80A1LC11257174 ± 283.31.61238
80A1LC11257174 ± 286.51.48316
80A1LC11257174 ± 28131.64390
80A3LC31263124 ± 133.31.59323
80A3LC31263124 ± 136.51.53324
80A3LC31263124 ± 13131.61440

