Article

A Numerical Study on the Effects of Trust in Supplier Development

1
International Graduate School for Dynamics in Logistics, University of Bremen, 28359 Bremen, Germany
2
BIBA—Bremer Institut für Produktion und Logistik GmbH at the University of Bremen, Hochschulring 20, 28359 Bremen, Germany
3
IAV GmbH, Development Center, Rockwell Str. 16, 38518 Gifhorn, Germany
4
Faculty of Production Engineering, University of Bremen, Badgasteiner Str. 1, 28359 Bremen, Germany
*
Author to whom correspondence should be addressed.
Processes 2020, 8(3), 300; https://doi.org/10.3390/pr8030300
Submission received: 5 February 2020 / Revised: 21 February 2020 / Accepted: 3 March 2020 / Published: 5 March 2020
(This article belongs to the Special Issue Industry 4.0 and Sustainable Supply Chain Management)

Abstract

:
Supplier development constitutes one of the current tools to enhance supply chain performance. While most literature in this context focuses on the relationship between manufacturers and suppliers, supplier development also provides an opportunity for distinct manufacturers to collaborate in enhancing a joint supplier. This article proposes a model for the optimization of such joint supplier development programs, which incorporates the effects of trust in the manufacturer-to-manufacturer relationship. This article uses a model-predictive formulation to obtain optimal supplier development investment decisions to consider the strong dynamics of the markets. Thereby, the model is designed to be highly customizable to the needs and requirements of different companies. We analyzed the price development related to Mercedes’ A-Class cars and the cost development in the automotive sector over the last ten years in Germany. According to the obtained result, the proposed model shows a sensible behavior in including trust and its effects in supplier development, even when just applying a set of generalized rules. Moreover, the numeric experiments showed that aiming for a balanced mix of optimizing revenue and trust results in the highest revenue obtained by each partner.

1. Introduction

Today’s original equipment manufacturers (OEMs) consider supplier performance as a significant factor in their competitive advantage. Internally, OEMs can further improve their products by investments; however, at some point, they need suppliers to modify their performance, processes, or components. OEMs often have to rely heavily on their suppliers, even engaging in close cooperation to enhance the suppliers’ competencies. As a result of the high specialization, several manufacturers often involve the same supplier in their supplier development programs. Despite the close cooperation these programs require, OEMs need to continuously revise these programs, e.g., due to quickly changing market dynamics or simply because future investments might not yield the expected results. Previous studies showed that collaboration or even cooperation between multiple manufacturers provides extensive advantages concerning their respective supplier development programs [1,2].
Supplier development consistently requires relationship-specific investments. OEMs may invest in supplier development, a process that is typically safeguarded by formal contracts to minimize partner opportunism. However, formal contracts are not flexible enough to deal with the rapid changes in the market. Therefore, one of the practical approaches that enable OEMs to cope with opportunism is mutual trust [3]. Trust in a partnership reduces several issues originating from opportunism and uncertainty. Studies on trust among supply chain partners have mainly focused on defining effective trust factors. Many researchers tried to investigate the influence of different factors in partnership gains. Some of them determined trust factors by utilizing use-cases [4,5,6,7] and others conducted trust factor studies in general [8,9,10,11]. This paper aims to consider the effect of trust on the gains of supplier development for engaged OEMs who invest in the same supplier. Therefore, it first presents a broad literature review on trust factors in manufacturer–supplier relationships and transfers those which are applicable to the manufacturer–manufacturer setting regarded in this study. In fact, this study takes one step further than the authors of [1,2] by considering the effects of trust in collaborative supplier development investments. The primary objective of this article is to propose a generalized model to quantify trust in manufacturer-to-manufacturer relationships and, furthermore, to integrate trust into the optimization of supplier development programs. This article proposes using the weighted sum over the proposed trust factors as input for a sigmoidal function to achieve the quantification. The integration relies on a fuzzy controller to map the quantified trust values to different collaboration schemes, in order to emulate the effects of increasing or decreasing trust. This setup allows for high adaptability to practitioners’ needs. While this article proposes a generalized method to quantify and integrate trust within the optimization, it also provides two exemplary use-case applications to evaluate the behavior of the proposed model. The first use-case constitutes a simplified use-case without market dynamics to focus on the model’s behavior. The second use-case includes real-world data on market dynamics in the automotive industry, relying on data obtained from Germany’s Federal Office for Statistics.
Therefore, this paper is structured as follows. The current section presents the state of the art for supplier development in Section 1.1 and trust in supply chain collaboration in Section 1.2 as a baseline for the model development. Section 2 presents the baseline optimization model for supplier development and presents the proposed trust-model. Afterward, this article presents the result of different parameterization of these models for the static and the dynamic (automotive) use-cases in Section 3. Finally, the article ends up with a discussion about the proposed models in Section 4.

1.1. Supplier Development
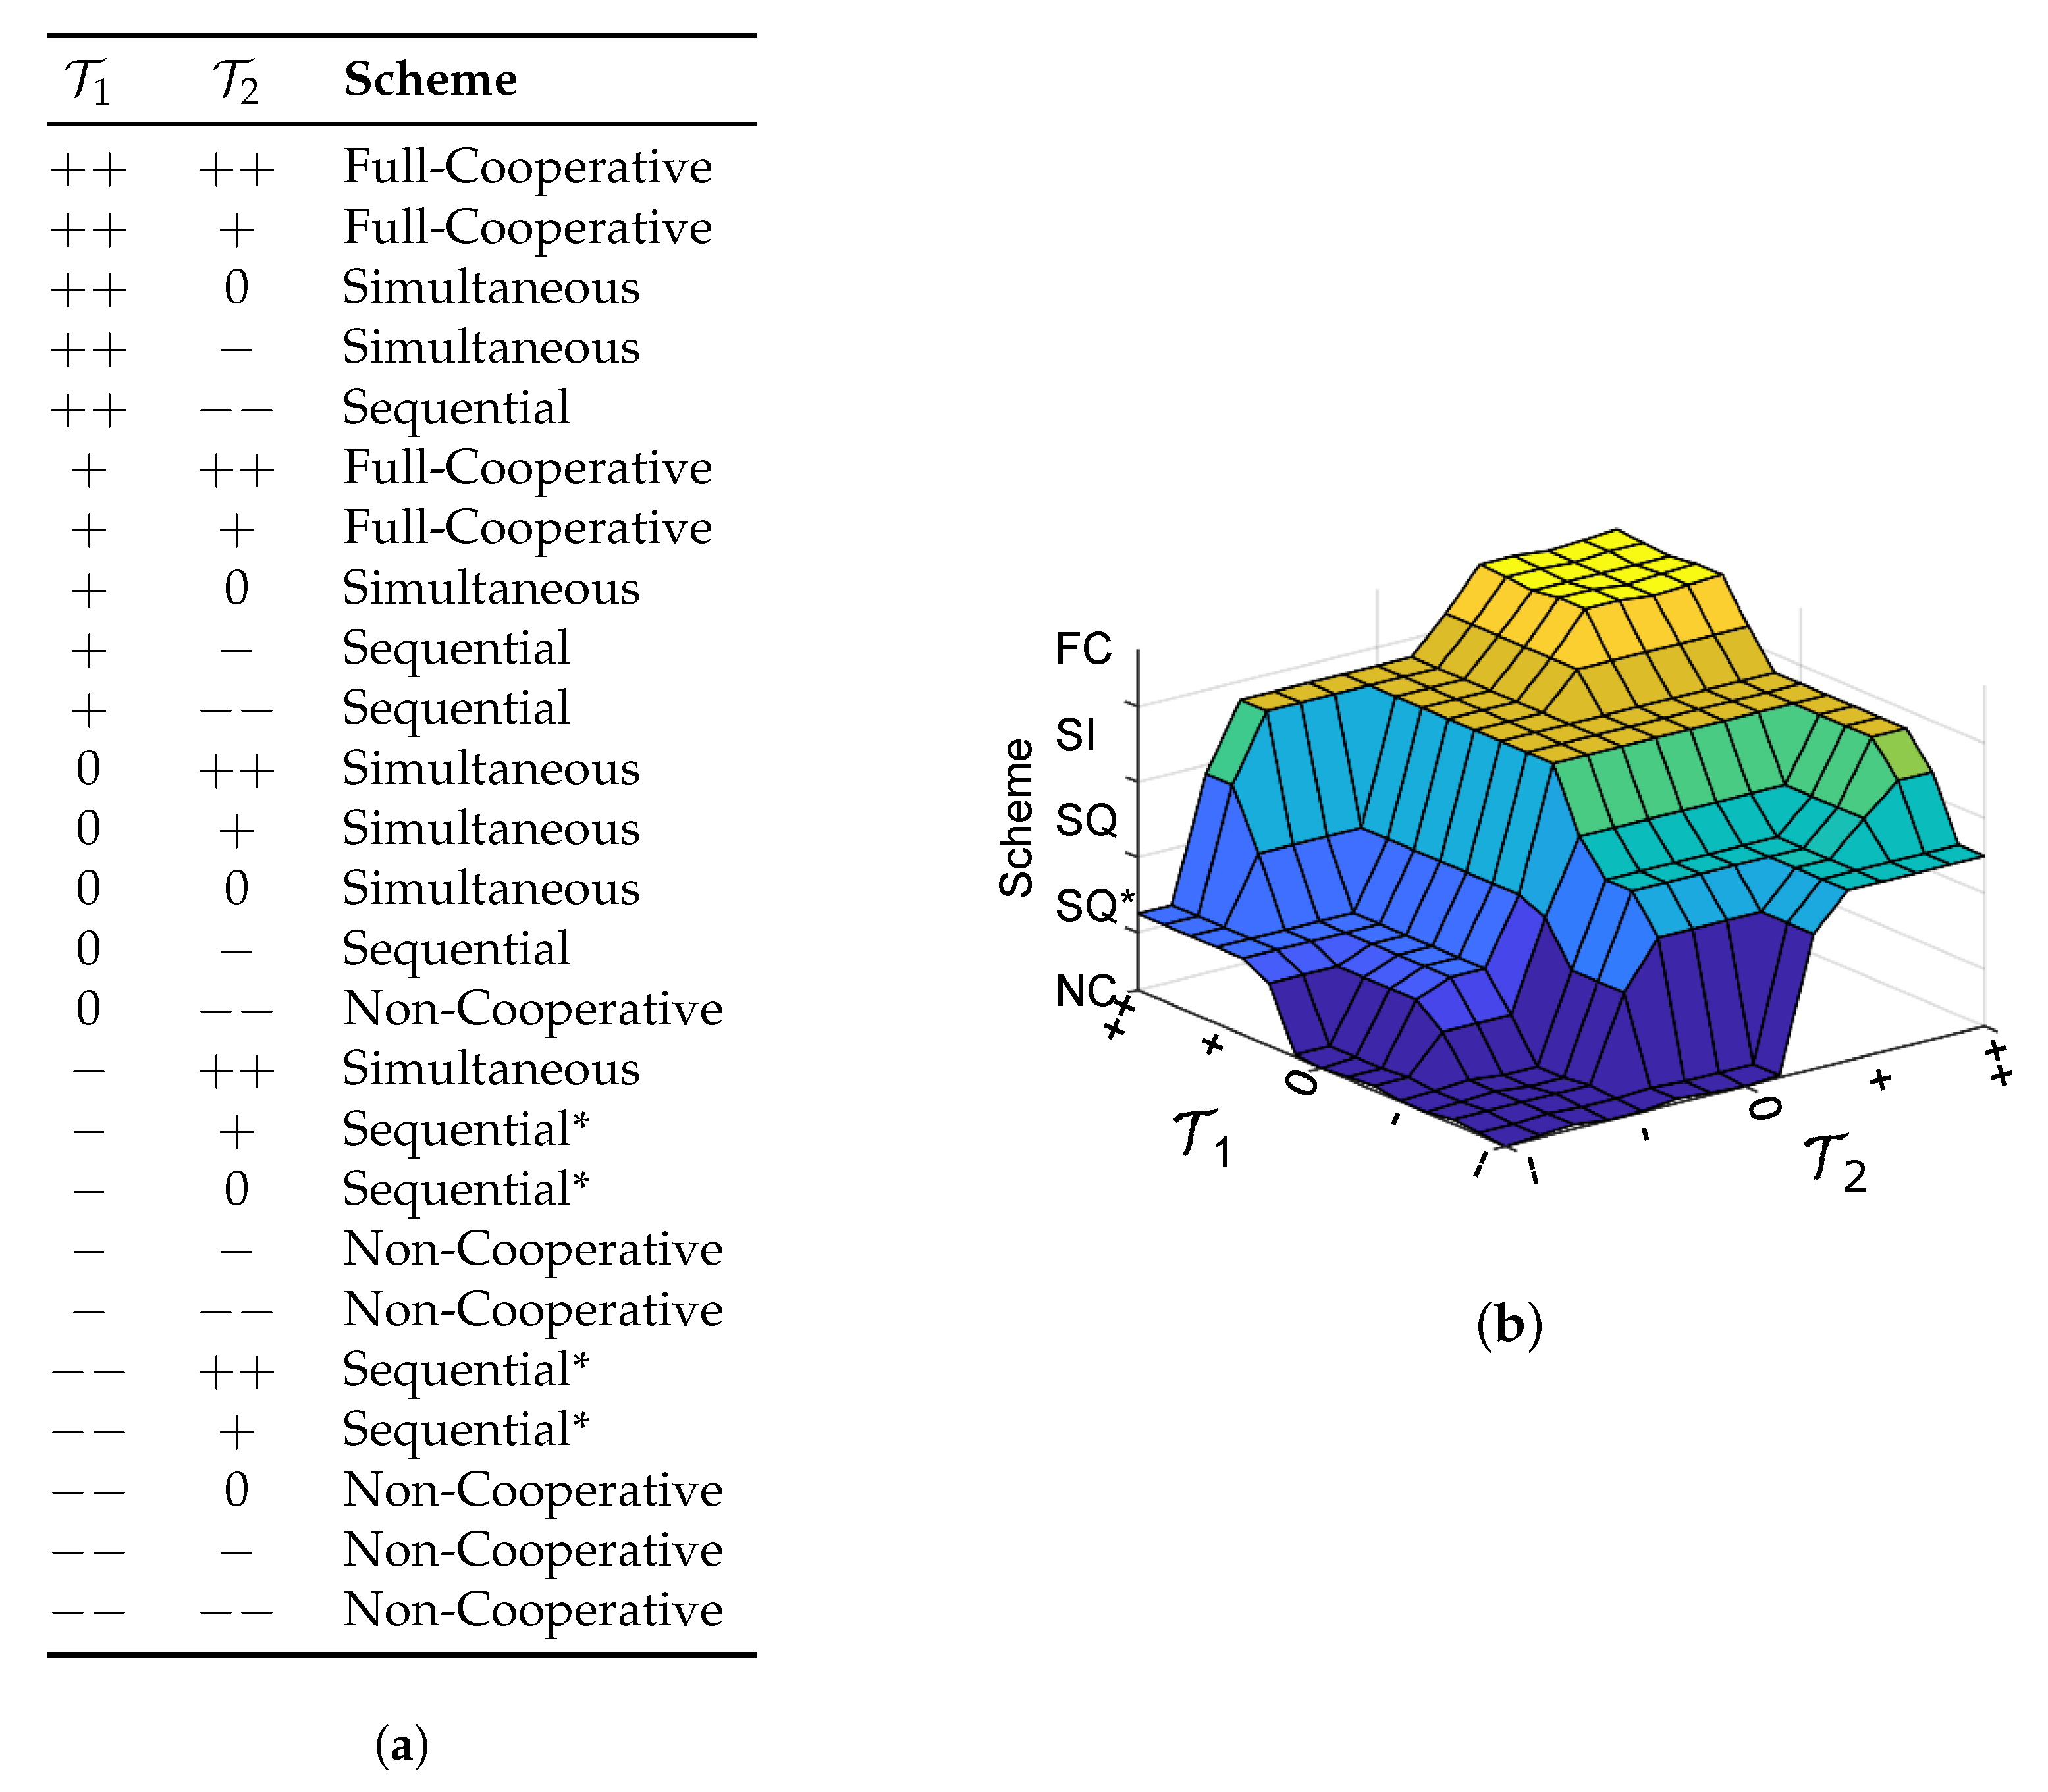
OEMs depend on their suppliers, and the suppliers’ performance has a noticeable effect on different product aspects, such as cost, quality, and on-time delivery [12]. Therefore, OEMs invest in their suppliers to enhance their performance and potentials. These improvements can be a faster response to customer demands and market dynamics, enhancing customer responsiveness, developing quality and reliability of products, manufacturing of new products, reducing costs of production, and, especially, increasing profit margins [12,13,14]. Hence, it is in the mutual interest of OEMs and suppliers to obtain competitive advantages through supplier development.
Within the last years, researchers studied supplier development extensively. As a result, the internal processes of supplier development, concerning the use of specific activities [15], antecedents [16], critical success factors [17,18], and the prevalence of supplier development in practice [19], are well understood. By now, companies in various fields apply techniques for supplier development via performance feedback, capital, on-site support, and personnel training [12,18,20].
Supplier development can provide the base for cooperation among OEMs and suppliers. However, supplier development offers the opportunity of collaboration among several OEMs as well. Many OEMs, specifically those working in the same industry, often order raw materials and components from overlapping sets of suppliers. For example, Whirlpool and General Electric for washing machine motors, Toyota and Pontiac for automobile engines, and Dell and Hewlett-Packard for personal computer PC boards work with the same suppliers [12]. Generally, in this kind of situation, an OEM can select between various types of partnerships, which can be cooperative, non-cooperative, or collaborative [21].
In this study, we consider different relationships between manufacturers in supplier development according to game theory. Game theory has been applied to study multi-manufacturer interactions, particularly those consisting of negotiation and coordination [22]. In previous work, we proposed four different collaboration schemes given as non-cooperative, sequential, simultaneous, and full-cooperative. The following shortly summarizes these schemes (for a full description and a game-theoretic background of these schemes, please refer to [1]):
Non-Cooperative: 
In this scheme, OEMs do not interact with each other, in terms of neither active resource nor information sharing. This scheme assumes that each OEM renders its own decision regarding the supplier development program, optimizing its investments and profits. Despite this focus, each OEM also benefits from the other one’s investments as the supplier increases in efficiency.
Sequential: 
This scheme represents an asymmetrical form of collaboration between two involved OEMs. As in the non-cooperative case, both manufacturers render their own decisions. In contrast, one of the manufacturers provides its plans to the other one. As a result, the scheme shows a unidirectional information flow. When relating to the topic of trust, such a situation can occur in early stages where one OEM begins conveying information to another to start building trust and show goodwill slowly.
Simultaneous: 
This scheme represents a more advanced form of collaboration where both involved OEMs negotiate their activities. Thereby, each OEM renders a decision concerning its investments and profit, and both convey their plans to the other. Using shared information, both parties then optimize their plans and update the other partner.
Full-Cooperative: 
This scheme assumes that OEMs not only share all relevant information but also try to find the “best solution” for both partners using a shared pool of resources and fully sharing the benefits. Such situations might occur in joint ventures or companies closely tied together by corporate groups. Examples for such groups are the Volkswagen Group (Audi, Volkswagen, Porsche, etc.) or General Motors (Cadillac, Chevrolet, etc.). This scheme diverges from the first three, as it implies that OEMs conduct a single optimization that optimizes across both partners.
Previous studies demonstrated that cooperative supplier development programs have the potential to result in higher profits for all involved partners. Nevertheless, such cooperation requires a high degree of trust between partners, especially if they act within the same branch of industry. Consequently, the next subsections discuss the basic concepts and the state of the art related to trust in supply chains.

1.2. Trust in Supply Chain Collaboration

Collaborative relationships come up with opportunism when partners take actions in their self-interest and/or against the others’ benefits. Spekman and Davis declared that, if partners decide to share vital information, they require an assurance that the use of such information is going to be as planned. Additionally, an uninsured collaboration can increase the chance of sharing altered data that obfuscate the visibility and reality from the partner’s side [23]. The modification of data might happen when partners try to avoid releasing their business model by sharing slightly modified information. There are other uncertainties when partners share their supplier development investments collaboratively. These uncertainties comprise equity of applied system, dividing costs and profits, as well as synchronizing distributed activities and decisions [3]. Moreover, in this context, Chopra and Meindl asserted that some partners may have local concentrations and concerns, and employ them in information processing that causes deviation of the requested information. The existence of mutual trust reduces many of these issues, and, therefore, can facilitate and improve initiatives for collaborative investments [24].
In essence, companies are motivated to work collaboratively due to the efficient use of resources and investments. In supplier development, feasible ways to invest collaboratively include providing machinery, tools, and distribution facilities and, in particular, sharing information systems. Accordingly, trust is a relational element essential to preserve collaborative relationships. In supplier development investments, trust, as revealed in behavior, is deeply affected by information sharing, sharing schemes, decision symmetry, and opportunism [3].
We conducted a literature study of trust among supply chain partners to determine trust factors that affect collaboration and information sharing in supplier development. Furthermore, this survey considered other areas such as the supply chain, logistics, manufacturing, and business. Consequently, factors selected from the literature do not only cope with collaborative supplier development. Finally, results from the survey on the background of the research revealed a total of 23 determinants. These determinants are shown in Table 1.
These determinants describe factors, behaviors/actions, criteria, or elements that define trust in the supply chain’s relationships and depend on an area of the trusting partnerships. In this table, we divide trust determinants into dynamic factors and static factors.

1.2.1. Classification of Factors Influencing Trust

Many determinants of trust exist, which relate to trust in supply chain partnerships and in sharing logistics resources. A fundamental categorization needs to be defined to investigate these determinants. Such a categorization supports the decision if a particular determinant of trust considerably affects the partnership and the collaboration or not. Many researchers tried to define different determinants of trust among supply chain partners. Following, we present several classifications of trust factors.
Child [53] offered two different types of trust: knowledge-based trust and identification-based trust. The source of knowledge-based trust is long-term interactions since partners can predict the other’s behavior based on long-term relationships. Identification-based trust occurs based on the emotional connection among partners who concern the other’s desire, needs, and wishes. Ha et al. [28] suggested another classification of trust determinants. They divided trust determinants into two categories: affective trust and trust in competency. Affective trust considers aspects such as openness, benevolence, honesty, understanding, and respect. Trust in competency considers aspects such as ability, knowledge and skills, business judgment, and specialty. Han and Dong [11] divided trust determinants into two categories: predetermined factors and instant factors. Companies can evaluate predetermined factors from the history of the trustor with the previous behaviors of the trustee. These factors are fixed and pre-known so that the trustors can evaluate trustees based on their experiences. According to their research, predetermined trust factors are reputation, the history of transactions, recommendations of the trustee’s peers, the trustor’s emotions, experience, and cognition. Companies can assess instant factors according to the current transaction manner of trustee [56]. Daudi [3,57] reviewed the literature of trust in detail and categorized the influencing trust determinants into behavioral and non-behavioral streams. Behavioral determinants concentrate more on partner’s behaviors and interactions during the collaboration period and whose outcome can predictively be estimated. However, non-behavioral determinants do not depend on the actions of the trustee on the collaboration horizon. He extracted nine of the most effective trust determinants from the literature: commitment, capability, information sharing, communication, asset specificity, joint knowledge creation, incentive alignment, bargaining power, and opportunism. Finally, he applied a systematic literature review (SLR) to find the most critical behavioral trust determinants among the mentioned factors. The result of his research revealed that information sharing, incentive alignment, decision synchronization, and opportunism are the major behavioral trust determinants in logistics resource collaboration.
The presented classifications all differentiate between two types of factors, which we can roughly be grouped into static and dynamic determinants according to the author of [11,56]. While the first class of determinants resembles a-priori knowledge about the partner, the second class refers to determinants that might change quickly during a collaboration.

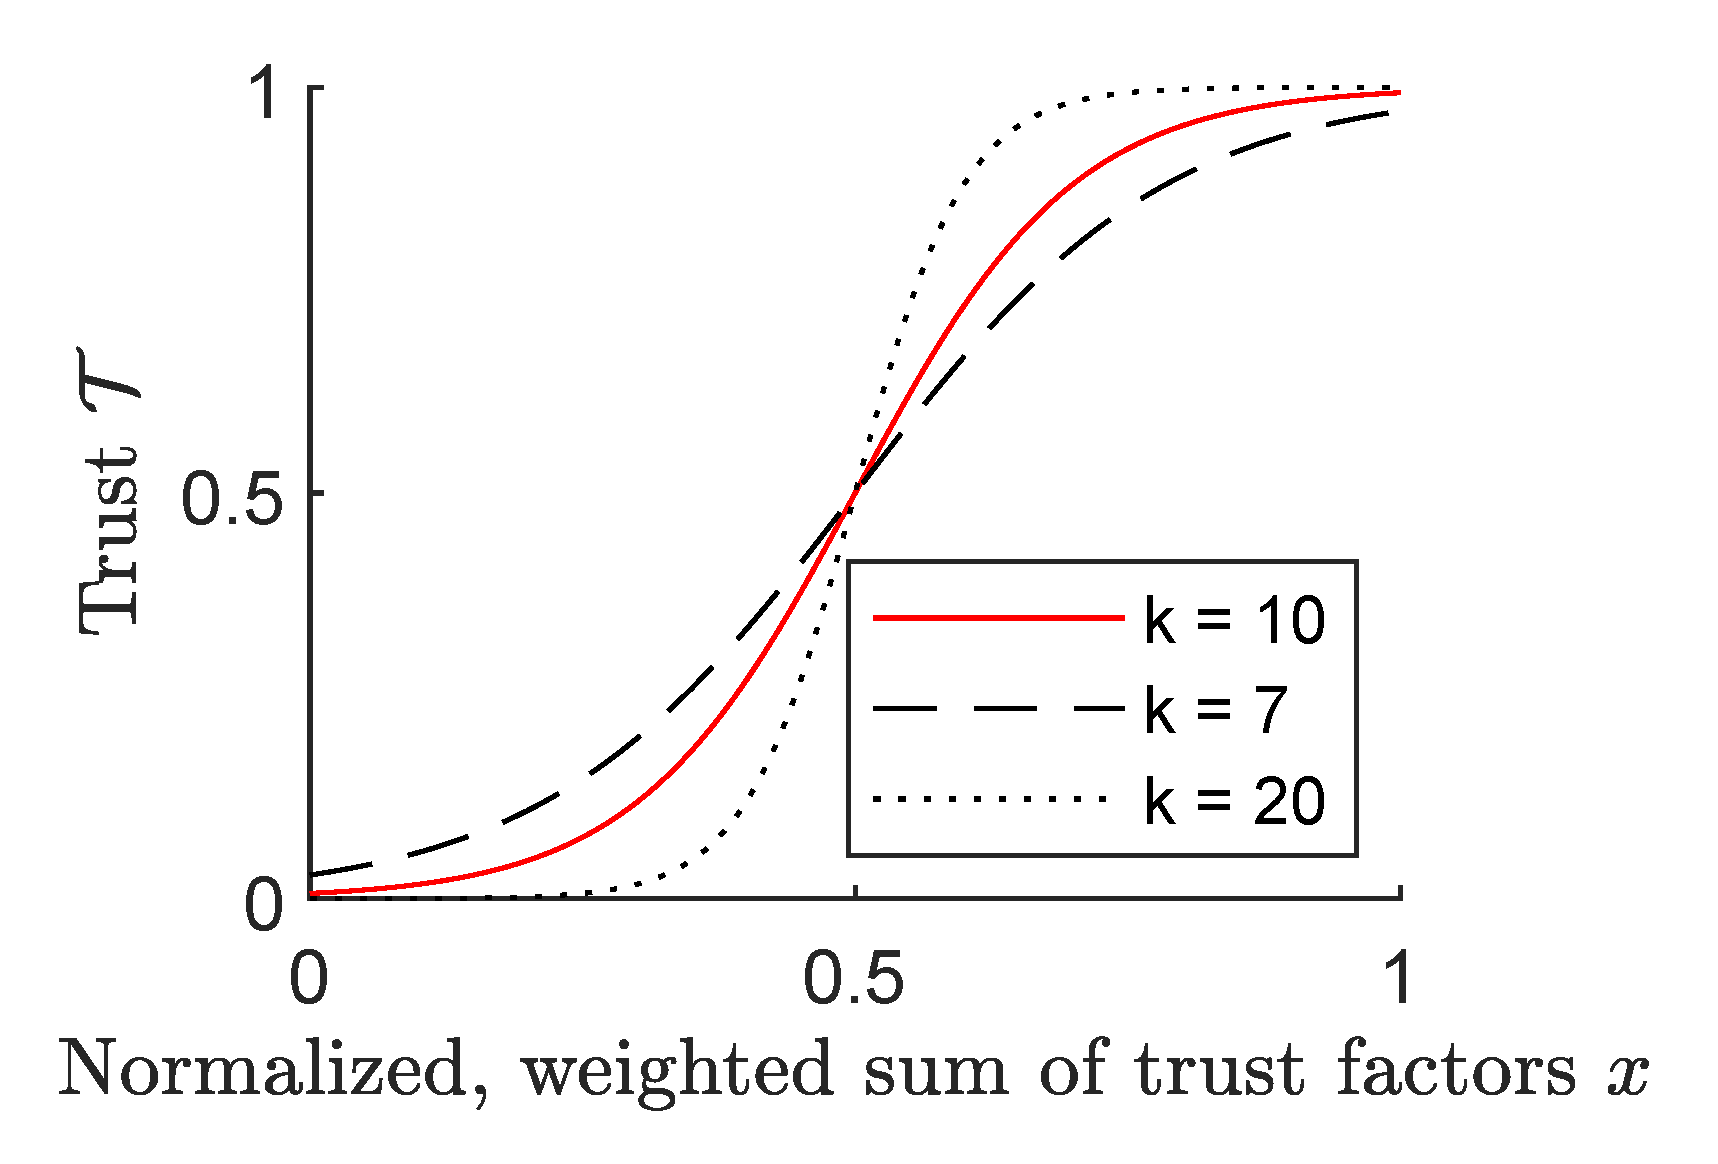
1.2.2. Quantification of Trust

We describe above the items affecting trust from peer-reviewed studies, as given in Table 1. In the following, we provide a summary of research conducted in trust measurement.
Chow and Holden [4] measured trust in the salesperson, considering three factors that concentrated on the risk of trusting, opportunistic behavior, and being careful. They applied confirmatory factor analysis to measure the trust in salesperson and trust in a company with three-point scales. They concluded that trust is a necessary construct used by OEMs to evaluate and adopt suppliers in a business marketing environment. Smith and Barclay [7] applied partial least squares to measure the trust, mutually perceived trustworthiness, and mutual trusting behaviors. They characterized mutually perceived trustworthiness by considering four dimensions, character, role competence, judgment, and motives or intentions. They added judgment as the fourth dimension to Mayer et al.’s [58] research. Finally, they conceptualized mutual trusting behaviors as relationship investment, influence acceptance, communicative openness, control reduction, and forbearance opportunism. Plank et al. [9] utilized exploratory and confirmatory factor analysis to measure the trust within a business to business context. This specific conceptualization contains three correlated elements: salesperson trust, company trust, and product/service trust. They studied trust on a five-point scale, investigating items such as expertise, friendship, and willingness to serve the company. Gassenheimer and Manolis [10] conducted a seven-point scale that included one more dimension than Plank et al. [9], namely reliability. They evaluated the inter-organizational and organizational trust by applying confirmatory factor analysis and Cronbach’s alpha coefficients. To measure the salesperson’s trust, they proposed a seven-item scale, and, to measure organizational trust, they proposed a four-item scale. Möllering [5] offered a separate multi-point scale for the impact of trustworthiness on the organization of inter-firm relations in the United Kingdom’s printing industry. He measured the buyer’s level of agreement or disagreement according to a range of parameters about a supplier, utilizing five-point Likert scales. Six of the parameters aim at the cognitive dimension of trustworthiness and five items at the affective dimension. The result of his study shows that not only cognitive and affective dimensions are reliable independently, but the combination of these two is also a reliable combined scale for overall trustworthiness with Cronbach’s α = 0.8878 . Comer at al. [59] proposed trust specifically within a business-to-business sales context as containing three correlated components: salesperson trust, company trust, and product/service trust. They applied exploratory analysis with considering ten- trust factors, using a three-item scale questionnaire that demonstrates the appropriate reliability and validity for use in future studies incorporating the concept of perceived trust in business-to-business and buyer–seller contexts. Han and Dong [11] considered trust in the supply chain as a psychological perspective. They divided the affective trust factors into two categories. The first category denotes factors that companies can evaluate before a transaction, such as reputation, historical transaction, and peer recommendations from trustees and emotions, experience, and cognition from the trustors. The assessment of these items is pre-known and predictable in a transaction. They called these factors predetermined factors and denoted them as (R). The second category refers to behaviors during transactions. In other words, companies can only evaluate these factors in the current transaction. Han and Dong called these factors instant factors, denoted by ( Δ ). Thus, they proposed Trust ( T ) as a randomly distributed variable with cumulative density function F(t) and probability density function f(t), as shown in Equation (1).
T f ( t R , Δ ) where 0 t 1
The state of the art shows that previous research provides broad insights into the effects and structure of trust in manufacturer/supplier relationships. However, we could not identify research in the context of manufacturer/manufacturer relationships. Previous studies show that manufacturers can achieve considerable benefits from collaborating and, especially, from cooperating within their supplier development programs [1,2]. Nevertheless, these studies did not regard the effects of trust.

1.3. Notation

Table 2 shows the most important parameters and variables used throughout this article. Additional notation might be introduced if necessary in the appropriate subsections.

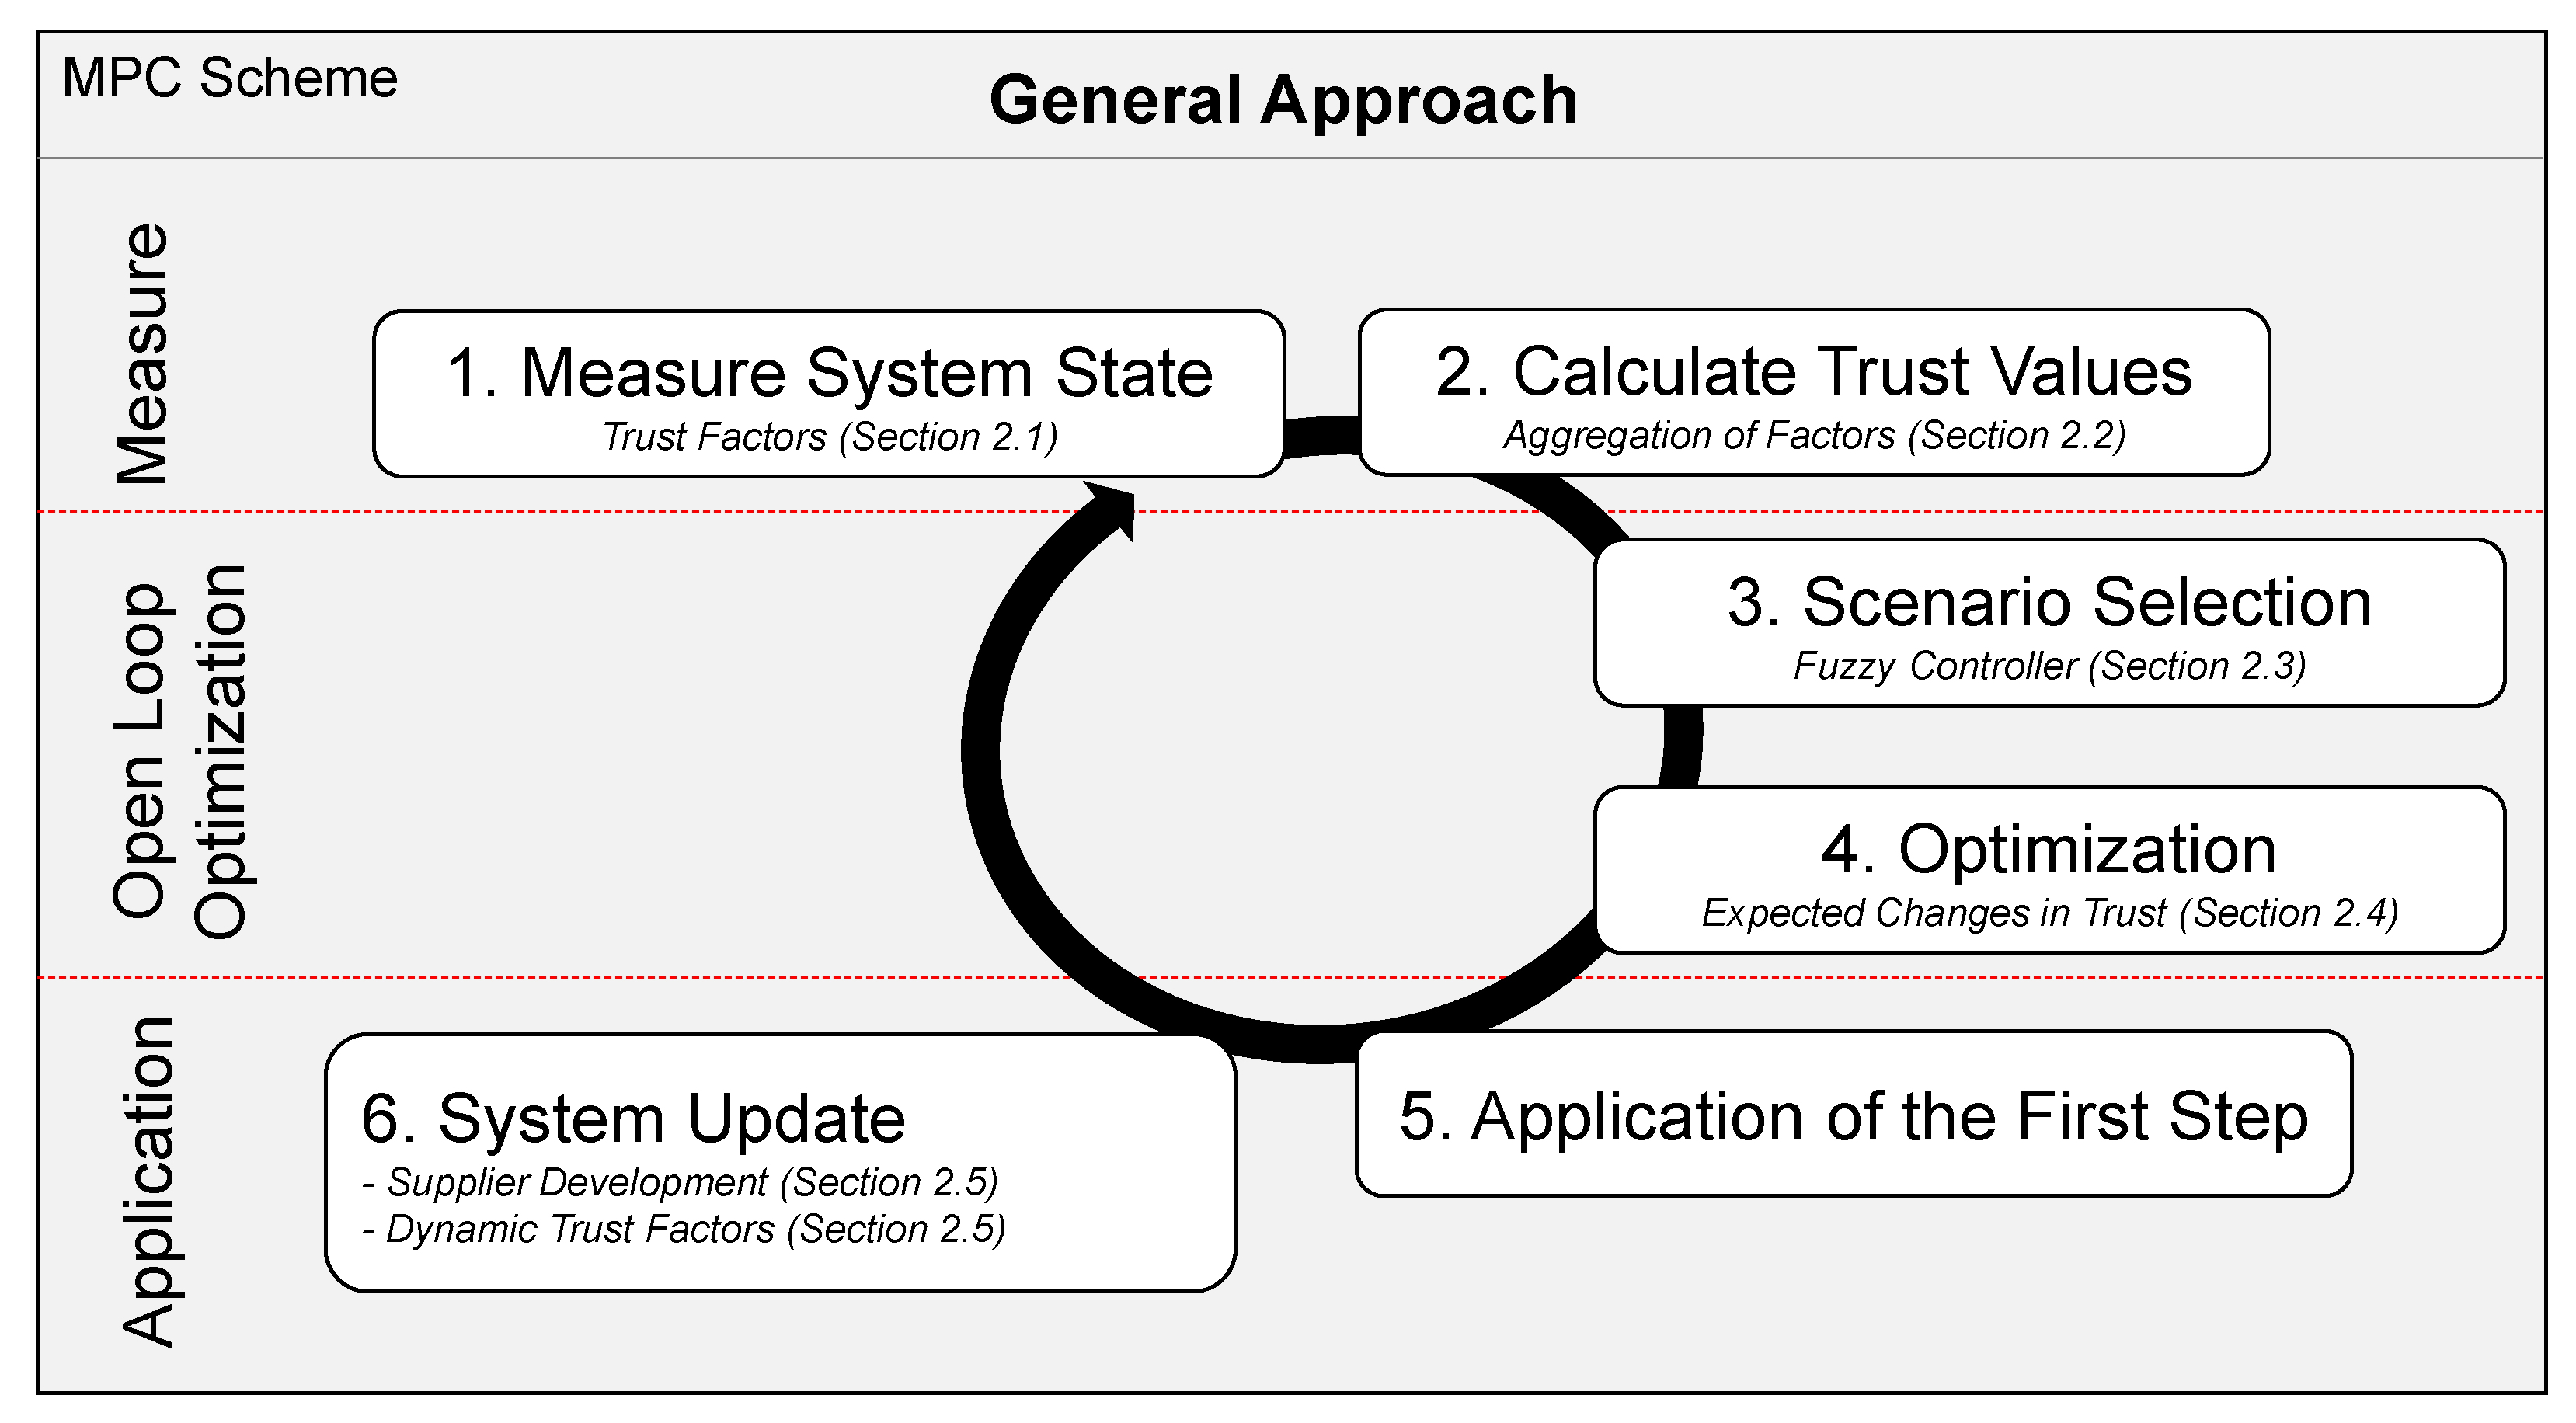
2. Materials and Methods

Figure 1 shows the overall structure of the proposed approach to include the notion of trust in the optimization of supplier development programs. In this study, we adopted the Model Predictive Control (MPC) scheme applied in [1,2]. This scheme enables coping with highly dynamic systems where actors cannot anticipate the full extent of these dynamics, for instance the multi-OEM scenarios regarded in this article. In most cases, each OEM only has access to a specific subset of information that it can use during decision-making. Thus, the (simulated) reality can quickly diverge from the (model-based) predictions undertaken during the optimization. The overall approach distinguishes between two cycles. First, a closed-loop control continuously measures the state of the observed system at discrete sampling instances n i with a sampling step size of T. Second, an open-loop optimization uses predictive system models to find an optimal control sequence. The measurement delivers the current state of the system X n , which describes the current state of the OEM’s supplier development programs, and the current values related to dynamic trust factors. In the second step, the approach calculates a value for the current trust of each manufacturer. The third step uses these values to select and parameterize the corresponding collaboration schemes assumed by the OEM. In the fourth step, the approach performs open-loop optimization. During this optimization, the approach uses so-called system models and the selected collaboration schemes to determine an optimal course of action (control sequence u) for each OEM over an extended prediction horizon denoted as N. In the final two steps, the approach extracts the first action for each OEM and applies it to the simulated real-world system. Afterward, the simulation transitions to the next sampling instance n i + 1 , and the process starts again.
The following subsections describe the main concepts for each step. Thereby, they introduce our proposal for a trust-model in OEM/OEM relationships and also summarize relevant concepts and ideas of the supplier development models already introduced in previous work. Consequently, the main contribution lies in the integration of trust in the optimization scheme. We adapt existing trust-models to an OEM/OEM relationship, and then discuss suitable methods to obtain a singular trust value from these factors. Finally, we map these trust values to specific collaboration schemes, which can be used during the optimization.

2.1. Step 1: Trust Factors and System State

The integration of trust requires an extension of the system’s state. Therefore, we reformulate the state to track the sum of projects for each OEM separately. Moreover, we introduce several parameters to represent static and dynamic trust factors. As a result, we use a vector X m containing the parameters given in Table 3. We thereby assign each parameter to a semantic subset for easier reference: The subset S D X m summarizes the state of the OEMs’ supplier development programs. The subset R X m represents static trust factors, and the subset Δ X m represents dynamic trust factors. The naming of the subsets R and Δ follows the notation introduced by Han and Dong [11]. Finally, the subset O L X m contains parameters, which the open-loop’s prediction model uses to include the effects of increasing or decreasing trust in its decision. According to the classifications in Section 1.2.1, static factors refer to predetermined, affective, or knowledge-based factors. In contrast, dynamic factors tend to change during the supplier development program and therefore refer to current, competency-related, or identification-based factors.
Referring back to the list of trust determinants identified in the literature (Table 1), clearly, several determinants describe the same basic concepts. Consequently, we only included an aggregated set of these determinants as parameters, as given below. In terms of a later implementation, we assume that each parameter describes the represented concept(s) as a numeric value in the range of [0, 1]. Moreover, we assume that all parameters represent the viewpoint of the indexed OEM. For instance, in this study, we only consider two OEMs, OEM1 and OEM2. Thus, the parameter X 1 R e p u t a t i o n denotes the perceived reputation of OEM2 from the viewpoint of OEM1.
Reputation (static) 
This parameter, denoted as X m R e p u t a t i o n , describes the perceived reputation of an OEM’s partner. Therefore, it subsumes the determinants Ability, Capability, Reputation, Emotions, and Cognition from Trustor, as given in Table 1.
History (static) 
This parameter, denoted as X m H i s t o r y , provides a value to rate the general quality of historic transactions one OEMm had with the other partner. This parameter particularly includes past collaborations in supplier development, as well as other interactions between these partners.
Specificity (static) 
This parameter, denoted as X m S p e c i f i c i t y , summarizes the determinants Asset Specificity, Satisfaction with Know-How, and Satisfaction with Specialities. Consequently, it provides a requirement to establish trust in cooperation between competing companies. If, e.g., both OEMs target vastly different market segments (high specificity), both partners will engage in cooperative transactions easier than actively competing companies.
Commitment (static) 
This parameter, denoted as X m C o m m i t m e n t , summarizes the determinants Commitment, Incentive Alignment, and Bargaining Power, given in Table 1, and, therefore, denotes how strongly an OEMm rates the commitment of its partner in a joint supplier development program.
Recent Experience (dynamic) 
This dynamic parameter, denoted as X m E x p e r i e n c e , summarizes the determinants Benevolence, Joint Knowledge Creation, and Experiences. It represents the quality of the current joint supplier development program as OEMm perceives it. This parameter’s value strongly depends on the current revenue and benefits generated by the program.
Information Sharing (dynamic) 
This dynamic parameter, denoted as X m S h a r i n g , summarizes the determinants Information Sharing, Communication, and Openness. Consequently, it highly depends on the current willingness to share information between partners.
Information Mismatch (dynamic) 
This dynamic parameter, denoted as X m M i s m a t c h , summarizes the determinants Honesty, Positive Mutual Understanding, and Information Mismatch. In this article, we interpret this parameter as an indicator of the matching of expectations between OEMs. For example, if OEM1 expects to receive information on OEM2’s supplier development program, but does not receive it, the mismatch would increase.
Opportunism (dynamic) 
This dynamic parameter, denoted as X m O p p o r t u n i s m , describes how opportunistic an OEM classifies its partner’s actions. Previous studies showed that some collaboration schemes facilitate opportunistic behavior, where one OEM would not invest in the joint supplier until the other one ceases investments.
As the open-loop optimization cannot access all information necessary to update the trust factors (cf. Step 5 below for details on the system update), it uses an aggregate value for the expected trust scenario X m E s t T for each OEM. Depending on the currently selected collaboration scheme, this value gets updated before each open-loop optimization with the center of mass in the fuzzy controller respective membership function (cf. Step 3 for information on the controller). For instance, if the algorithm selects the simultaneous scheme, it would assign 0.75 to X m E s t T , given the parameterization described below.
The state additionally gets updated with an estimate of the maximum and minimum revenue achievable by collaborating to allow the optimizer to regard trust as part of the optimization problem. Following previous studies, we assume that full cooperation results in the highest profit, while non-cooperation results in the lowest overall revenue. Consequently, the algorithm performs a single open-loop optimization each for the non-cooperative and the full-cooperative case. It denotes the revenue of each OEM in the state to obtain the values X m M i n R e v and X m M a x R e v .
The parameter X m λ determines the integration of trust into each OEMs open-loop optimization (cf. Step 4). The values can either be fixed to represent general tendencies of each OEM, or the algorithm can dynamically adapt this value during the state update.

2.2. Step 2: Quantification of Trust

After measuring the state in the first step, the algorithm next quantifies trust. As shown in the state of the art, several authors proposed methods and approaches to measure trust. Similar to the naming conventions of subsets, this algorithm applies the method proposed by Han and Dong [11]. According to Equation (1), trust T is given as a function over the parameter subsets R and Δ. However, the proposed function is not introduced precisely. As a consequence, we propose to use logistic function over the normalized, weighted sum of parameters, given in Equation (2). Thereby, k provides the steepness of the sigmoidal shape, x 0 determines the center of the shape, i.e., where the result is 0.5, and α denotes a vector of weights for each parameter in R Δ . The algorithm applies this function for each OEM with index m, to obtain the values T m , i for the current time instance i.
T m , i ( X m , i ) = 1 1 + e k ( x x 0 ) with x = p R Δ ( α p * p ) α
For a realistic use case, this function should be replaced or at least parameterized with the help of experts of the corresponding OEM. Nevertheless, this function provides several advantages in terms of parameterization. Depending on the experts’ input, the algorithm can be parameterized to prefer specific trust factors by modifying the vector alpha. For example, this article assigns lower weights of only 0.25 to all static factors in R, compared to a weight of 1 for all factors in Δ to reduce the bias of the static parameters. This weighting represents that the partners maintain a stronger focus on their current experience than on historic collaborations or the reputation of their current partner. Moreover, by shifting x 0 , it can be represented that a company is less trusting (higher x 0 ) or more trusting (lower x 0 ). In this article, we assume a moderate company by choosing x 0 = 0.5 . Finally, by modifying the steepness k, experts can adapt how quickly trust is built. This can reach from a linear case (low k) to a more or less sudden jump in trust (very high k). In terms of this article, we again assume a moderate case by selecting k = 10 , resulting in the shape given in Figure 2.
Previous researchers mostly applied questionnaires to collect experts’ opinions toward trust in general and in some use cases. They ended up with the weight of trust factors, based on the expert’s ideas. These approaches depend on the historical data and the experiences of experts, which were not necessarily the decision-makers. Current research enables decision-makers to consider different affective trust factors based on their uses cases. For instance, one OEM would choose to consider the current trust factors of a partner rather than the experiences since the partner’s CEO changed, and the new CEO adopted a trust-based relationship with his business partner. Applying the presented model in this research not only enables decision-makers to choose the most relevant trust factors based on their dynamic situation but also enables them to measure trust in terms of dynamic values of trust factors.

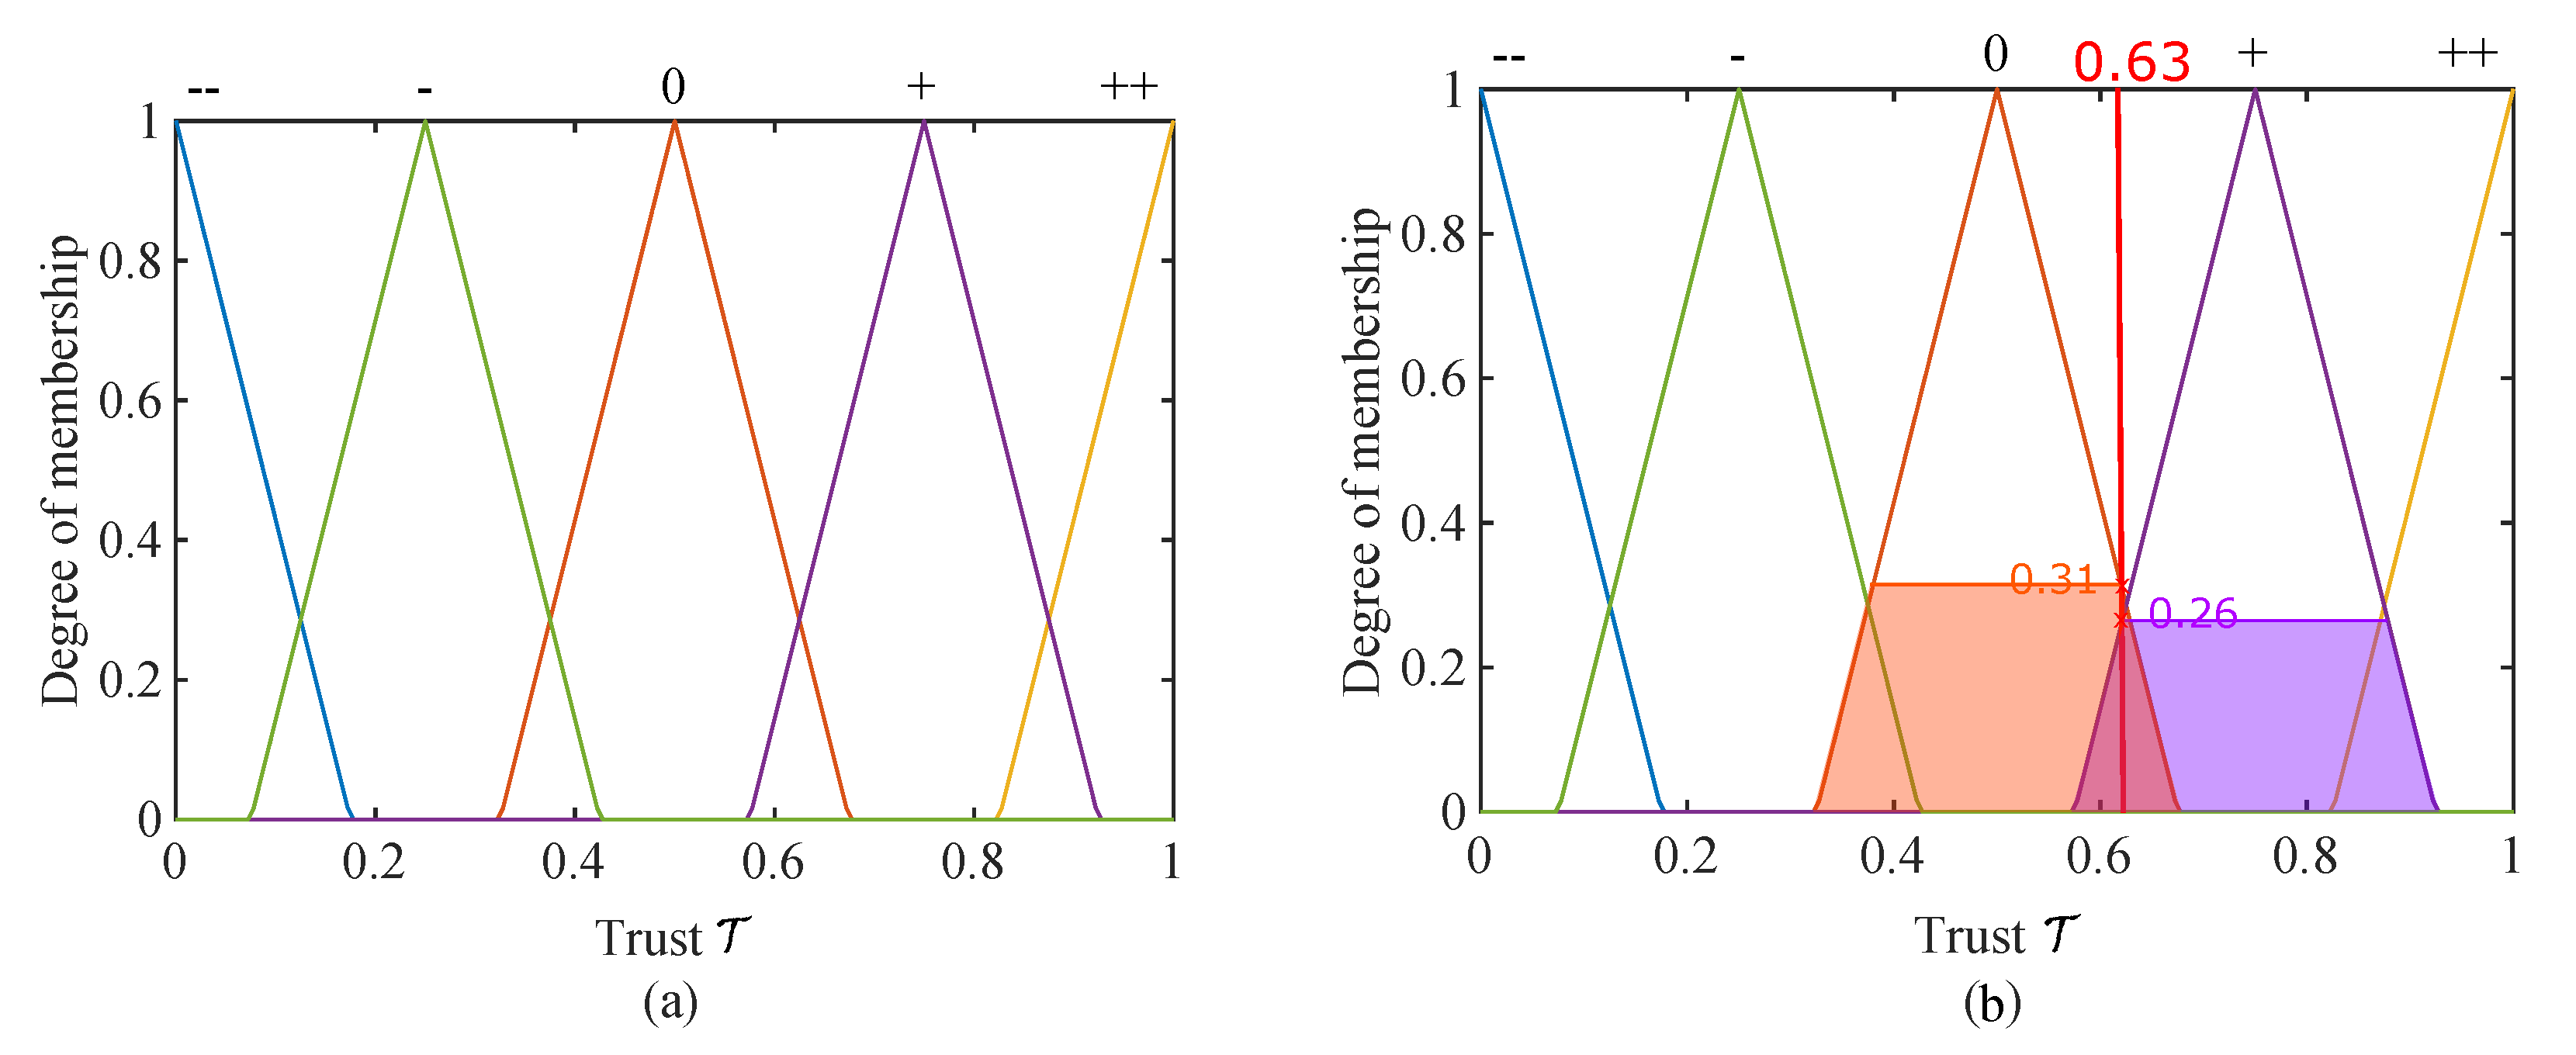
2.3. Step 3: Selection and Parameterization of Collaboration Schemes

In the third step, the algorithm selects the appropriate collaboration scheme for the optimization of the supplier development using the quantified trust values T 1 and T 2 . This article proposes the use of fuzzy logic for this task to achieve a highly versatile and customizable mapping (please refer to, e.g., [60] for a comprehensive description of fuzzy logic). The application of fuzzy logic allows users to reason using so-called literals instead of using fixed thresholds for the mapping. The proposed fuzzy controller obtains the quantified trust values for both OEMs and fuzzyfies them. Therefore, the controller calculates the membership of each input for each literal. At this stage, we propose to use five literals to represent the level of trust: Very Low ( ), Low (−), Medium(0), High (+), and Very High ( + + ). This classification allows for a suitable amount of distinction while still keeping the model relatively small and maintainable. In terms of this article, we apply common triangular membership functions as given in Figure 3a. These functions represent a simplification of normal distributions and, thus, represent a generalized case. Moreover, these triangular functions can easily approximate skewed distributions if required by a particular use-case. Using these membership functions, a measured trust value of 0.63 results in { (0.0); − (0.0); 0 (0.26); + (0.31); + + (0.0)}, as indicated in Figure 3b. This result indicates that the trust value is in-between Medium and High trust level, with a membership value of 0.26 and 0.31, respectively.
As output, we propose to select the collaboration schemes described in Section 1.1 as literals. Thereby, the proposed controller differentiates between two versions of the sequential scheme, i.e., one version where the current OEM provides the data (Sq) and one version, in which its partner provides the information (Sq*). We abbreviate the remaining scenarios as FC (Full-Cooperative), Si (Simultaneous), and NC (Non-Cooperative). As before, we use symmetric triangular membership functions for their generality.
The controller requires rules in the form of logical implications to enable reasoning, e.g., ( T 1 = V e r y H i g h ) ( T 2 = V e r y H i g h ) F C . To achieve these rules, we propose to first set-up a table, relating the different combinations of input literals to output schemes. Figure 4 provides an example of the mapping used in this article. The first two columns list the trust of each involved manufacturer while the third column lists the collaboration scheme we desire the algorithm to apply for this constellation. In a second step, this table can easily be transformed into logical statements, as given in the example above, and be implemented into the fuzzy controller.
As mentioned above, different levels of trust influence the type of collaboration between partners. For higher trust levels, OEMs most likely tend to share their supplier development information and investment with their partners. To obtain the mapping given in Figure 4, we define that Very High and High levels of trust encourage OEMs to make a Full-Cooperative relationship. Accordingly, when the average trust both OEMs have in each other is on a medium level, e.g., T 1 = Very High and T 2 = Medium or even Low, the OEMs would choose to share their supplier development information simultaneously since they still trust in their partners considerably. In cases where a strong asymmetry between the OEMs trust levels exists, this mapping implies that OEMs decide for one of the sequential scenarios. For example, if T 1 = Very High and T 2 =Very Low, the mapping suggests the sequential scenario, in which the first OEM shares its information, but the second one does not.
The proposed fuzzy mapping allows users to set-up rules using common language, which allows for a more accessible application in practice. Moreover, the controller supports a high degree of customization to practitioners’ expectations, circumstances, and requirements. First, they can easily customize the inputs, i.e., what is considered a high, medium, or low level of trust. Second, they can quickly adapt the applied set of rules, e.g., if they decide that some instances should be handled differently. Last, they could modify the weighting of the selected scenarios by adapting the output’s membership functions.

2.4. Step 4: Open-Loop Optimization

In the fourth step, the algorithm applies the open-loop optimization. According to the selected collaboration scheme, the open-loop performs a single (full-cooperative) or two distinct optimizations to obtain a (predictive) optimal control sequence using a set of system models. These models update the predicted state during the optimization for a given prediction horizon N. Each OEM updates the parameter set S D , incorporating its own decision on the number of projects to invest in the current time step as well as the information it receives from its partner (if any). Moreover, it updates its predictive state in terms of trust. As the system models cannot access all information on the partner’s decisions, a simplified model is used to estimate the effects a decision has on the collaboration. Please refer to Step 5 below for a description of how the closed-loop updates the relevant trust factors in Δ and which information it uses. The simplified model uses the parameter set O L , i.e., the estimated level of aggregate trust X m E s t T , the estimations for the trust dependent minimal and maximal revenue to be obtained X m M i n R e v and X m M a x R e v , and finally the OEMs’ tendencies to focus their decisions on revenue or trust X m λ .
The open-loop updates the estimated aggregate level of trust, only focusing on the current OEM’s past decisions during the open-loop simulation. Thereby, the OEM assumes that this level increases if it invests (Equation (3)) or decreases if does not invest in the supplier development (Equation (4)). Moreover, it assumes that this trust level decreases if it tends to often change its decisions during negotiations (Equation (5)). In this equation, the index i t denotes the current iteration of the negotiation. Thereby, the parameters m o d e x p * , m o d o p p * , and m o d m i s * describe user-defined penalties or bonuses assumed by the OEM to represent the strength of the influence of experience, opportunism, and information mismatch during the prediction. Using these parameters. the applied method will be customized based on decision-makers’ ideas and different use-cases. For the experiments presented below, we chose m o d e x p = 0.1 , m o d o p p = 0.05 , and m o d m i s 0.025 . These values represent quite small penalties to changing ones decisions during negotiations and comparably small but still noticeable penalties to acting opportunistic. Using these values, the majority of assumed changes results from the OEM’s investment decisions.
X m , i E s t T = X m , i 1 E s t T + u · m o d e x p * if u > 0
X m , i E s t T = X m , i 1 E s t T m o d e x p * m o d o p p * if u = 0
X m , i E s t T = X m , i 1 E s t T a b s ( u i , i t u i , i t 1 ) * m o d m i s * if the current scheme is simultaneous
As a baseline for the optimization, this model applies the same cost function (Equation (6)) used in previous studies [1,2] and introduced by Proch et al. [61] to optimize the revenue for each OEM:
J m r = ( a m ( t ) c m ( t ) c m s ( t ) · x m ( t ) l ) 2 r 2 4 b m c m S D · u m ( t )
In this equation, t denotes the current time since the start of the supplier development program ( t = i * T ) , a m ( t ) denotes the customers’ willingness-to-pay, c m ( t ) denotes the OEM’s production costs, and c m s ( t ) denotes the supplier production. Furthermore, r describes the supplier’s revenue, c m S D describes the cost for supplier development projects, b m describes the price elasticity, and l describes the suppliers learning rate. Finally, u m ( t ) denotes the number of supplier development projects funded by OEM m at time index t The algorithm also applies this cost function during the estimation of the minimum and maximum revenue during the state measurement (Step 1).
The open-loop additionally evaluates the cost function given in Equation (7) to integrate the effects of trust. This function linearly interpolates between the minimum and maximum expected revenue using the current value of the estimated aggregate trust level.
J m T = X m M i n R e v + ( X m M a x R e v X m M i n R e v ) · X m E s t T
Finally, the open-loop’s optimization combines these two cost functions using the OEM’s tendency to focus either on its revenue or on the possible influence of its decisions on the trust, as given in Equation (8). This equation uses the weighting factor λ to assign a priority to the cost functions J m r and J m T . The higher is λ , the higher is the OEM’s focus on revenue, ignoring the influence of trust; the lower is λ , the stronger is the focus on maintaining a high level of trust over revenue.
J m = λ · J m r + ( 1 λ ) · J m T

2.5. Step 5: Control Extraction and Application

The fifth step finally updates the state model, i.e., the parameter sets S D and Δ , based on the OEMs decisions. As in previous studies, it updates the parameter X m P r o j e c t as X m P r o j e c t s = X m P r o j e c t s + u m . In addition, the algorithm updates the parameters in Δ as their value changes dynamically based on the decisions taken by the OEMs. To implement these changes, we propose a set of general rules which we deduced from the definition of the respective trust factors:
Experience: 
This factor directly relates to the advantages that the OEM gains from collaborating with its partner. Thus, as a general rule of thumb, this factor should increase depending on how much the other partner invests. In contrast, the value should decrease if one OEM invests, but its partner does not.
Information Mismatch: 
This factor depends on the correctness of information obtained by each OEMs’ partner. With the current collaboration schemes, only the simultaneous scheme shows the potential for conveying changing information, as all other schemes assume that the provided information is fixed. The simultaneous scheme thereby assumes a negotiation where each OEM revises its decision using its partner’s current information. To represent the effects of such non-fixed information, we propose to penalize lengthy negotiations, while short negotiations (or the conveyance of fixed information) should be rewarded.
Information Sharing: 
This factor rates the partners’ tendency to share information in general. We propose to implement a rule set that directly ranks the selected collaboration scheme to this factor. Consequently, we can formulate a mapping, which, e.g., assigns a high value to this factor if both partners are collaborating fully and a low value if no collaboration exists.
Opportunism: 
Similar to the factor experience, this factor assesses the other partner’s behavior in terms of its investment strategy. We propose to evaluate a defined number of past time instances for opportunistic behavior. Thereby, we interpret opportunistic behavior as an OEM just relying on the investment of its partner to gain benefits from the supplier development, while not investing on its own.
While these rules are quite basic, they can easily be adapted to practitioners’ needs, e.g., by modifying the degree of influence. Moreover, additional or different rules can easily be added as part of the state update to achieve more realistic simulation. The described rules can easily be formulated and added as part of the state update, as given in the equations below. To keep these equations more general, we propose to use a set of weighting parameters m o d , which denotes the influence of a decision on each trust factor. For the sake of simplicity, we selected all of these parameters as 0.1 to have a slight but noticeable influence. Moreover, the term ( n I t 4 ) with n I t being the number of negotiation iterations performed in the simultaneous scheme or 0 for all other schemes, assumes that four iterations constitute the neutral case. If negotiations take longer, this is penalized; if they finish earlier, a reward is provided. Finally, the parameter o m provides a counter of how many time instances an OEMs partner showed opportunistic behavior.
X m E x p e r i e n c e = X m E x p e r i e n c e + u m ¯ * m o d e x p X m E x p e r i e n c e = X m E x p e r i e n c e m o d e x p if u m > 0 u m ¯ = 0 X m S h a r i n g = X m E s t T if s c h e m e N C , S i , F C X 1 S h a r i n g = 0.25 X 2 S h a r i n g = 0.75 if s c h e m e = S q X 1 S h a r i n g = 0.75 X 2 S h a r i n g = 0.25 if s c h e m e = S q * X m M i s m a t c h = X m M i s m a t c h + ( n I t 4 ) * m o d m i s X m O p p o r t u n i s m = X m O p p o r t u n i s m + m o d o p p ( o m * m o d o p p )

3. Results

This section presents several numerical studies to evaluate the proposed model itself and to highlight some of its characteristics. Since trust itself comprises a quite abstract concept and as the literature does not provide any benchmark datasets, the numerical studies focus on the configuration of the model and discuss the effects of different parameterization regarding expected behaviors.

3.1. Scenario Description

During the evaluation, we applied two different use-case scenarios. Both scenarios have been used in previous versions of the proposed model to ensure compliance with non-trust based versions of it (i.e., in [1,2]). Therefore, we ensured that non-trust based experiments achieved the same results as in earlier versions of the model. Table 4 summarizes the parameterization for both scenarios.
In addition to these parameters, each experiment initialized all trust-related factors in R with 0.5 (medium level) and all dynamic factors Δ with 0 (no recent experiences yet). The first scenario originates from [1,61] and describes a standard use-case, in which no external changes to the parameters occur. The second scenario was originally introduced to incorporate external influences in terms of market dynamics. Therefore, the customers’ willingness-to-pay a m , the production cost of the manufacturer c m , and the production cost of the supplier c m S D follow a time-dependent trend derived from real-world data [2]. To obtain these trends, we analyzed the price development related to Mercedes’ A-Class cars and the cost development in the automotive sector over the last ten years in Germany. We utilized the database of Germany’s Federal Office for Statistics [62] for this use-case. The selected datasets contain monthly values over the last ten years as of 2018. Both scenarios provide a good baseline to evaluate the proposed model in terms of its behavior: As the first use-case does not include external dynamics, the behavior can be analyzed easily. The second scenario includes real-world trends and acts as an example that the model can be applied to such problems as well. We considered longer a project horizon for the automotive use-case since this commodity has a long life-cycle.

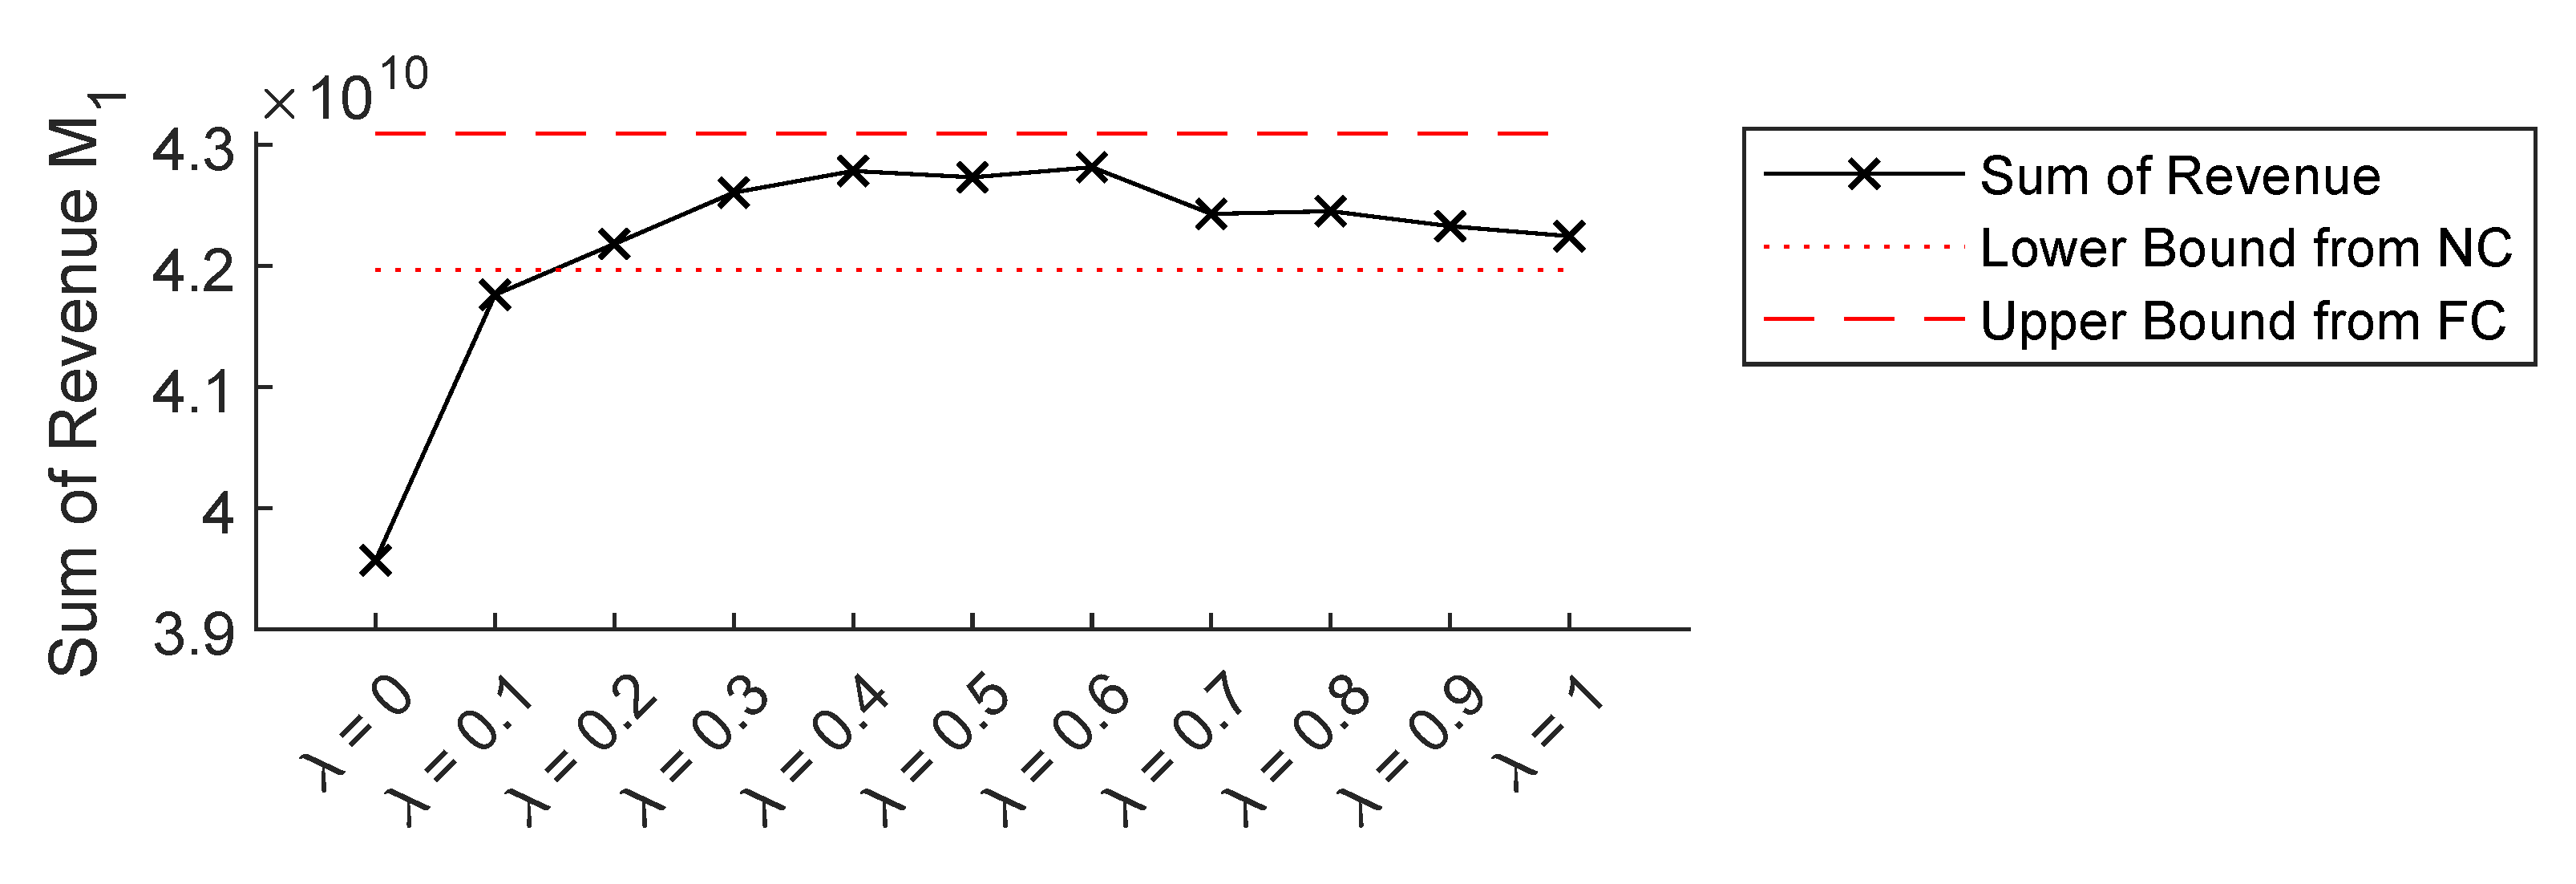
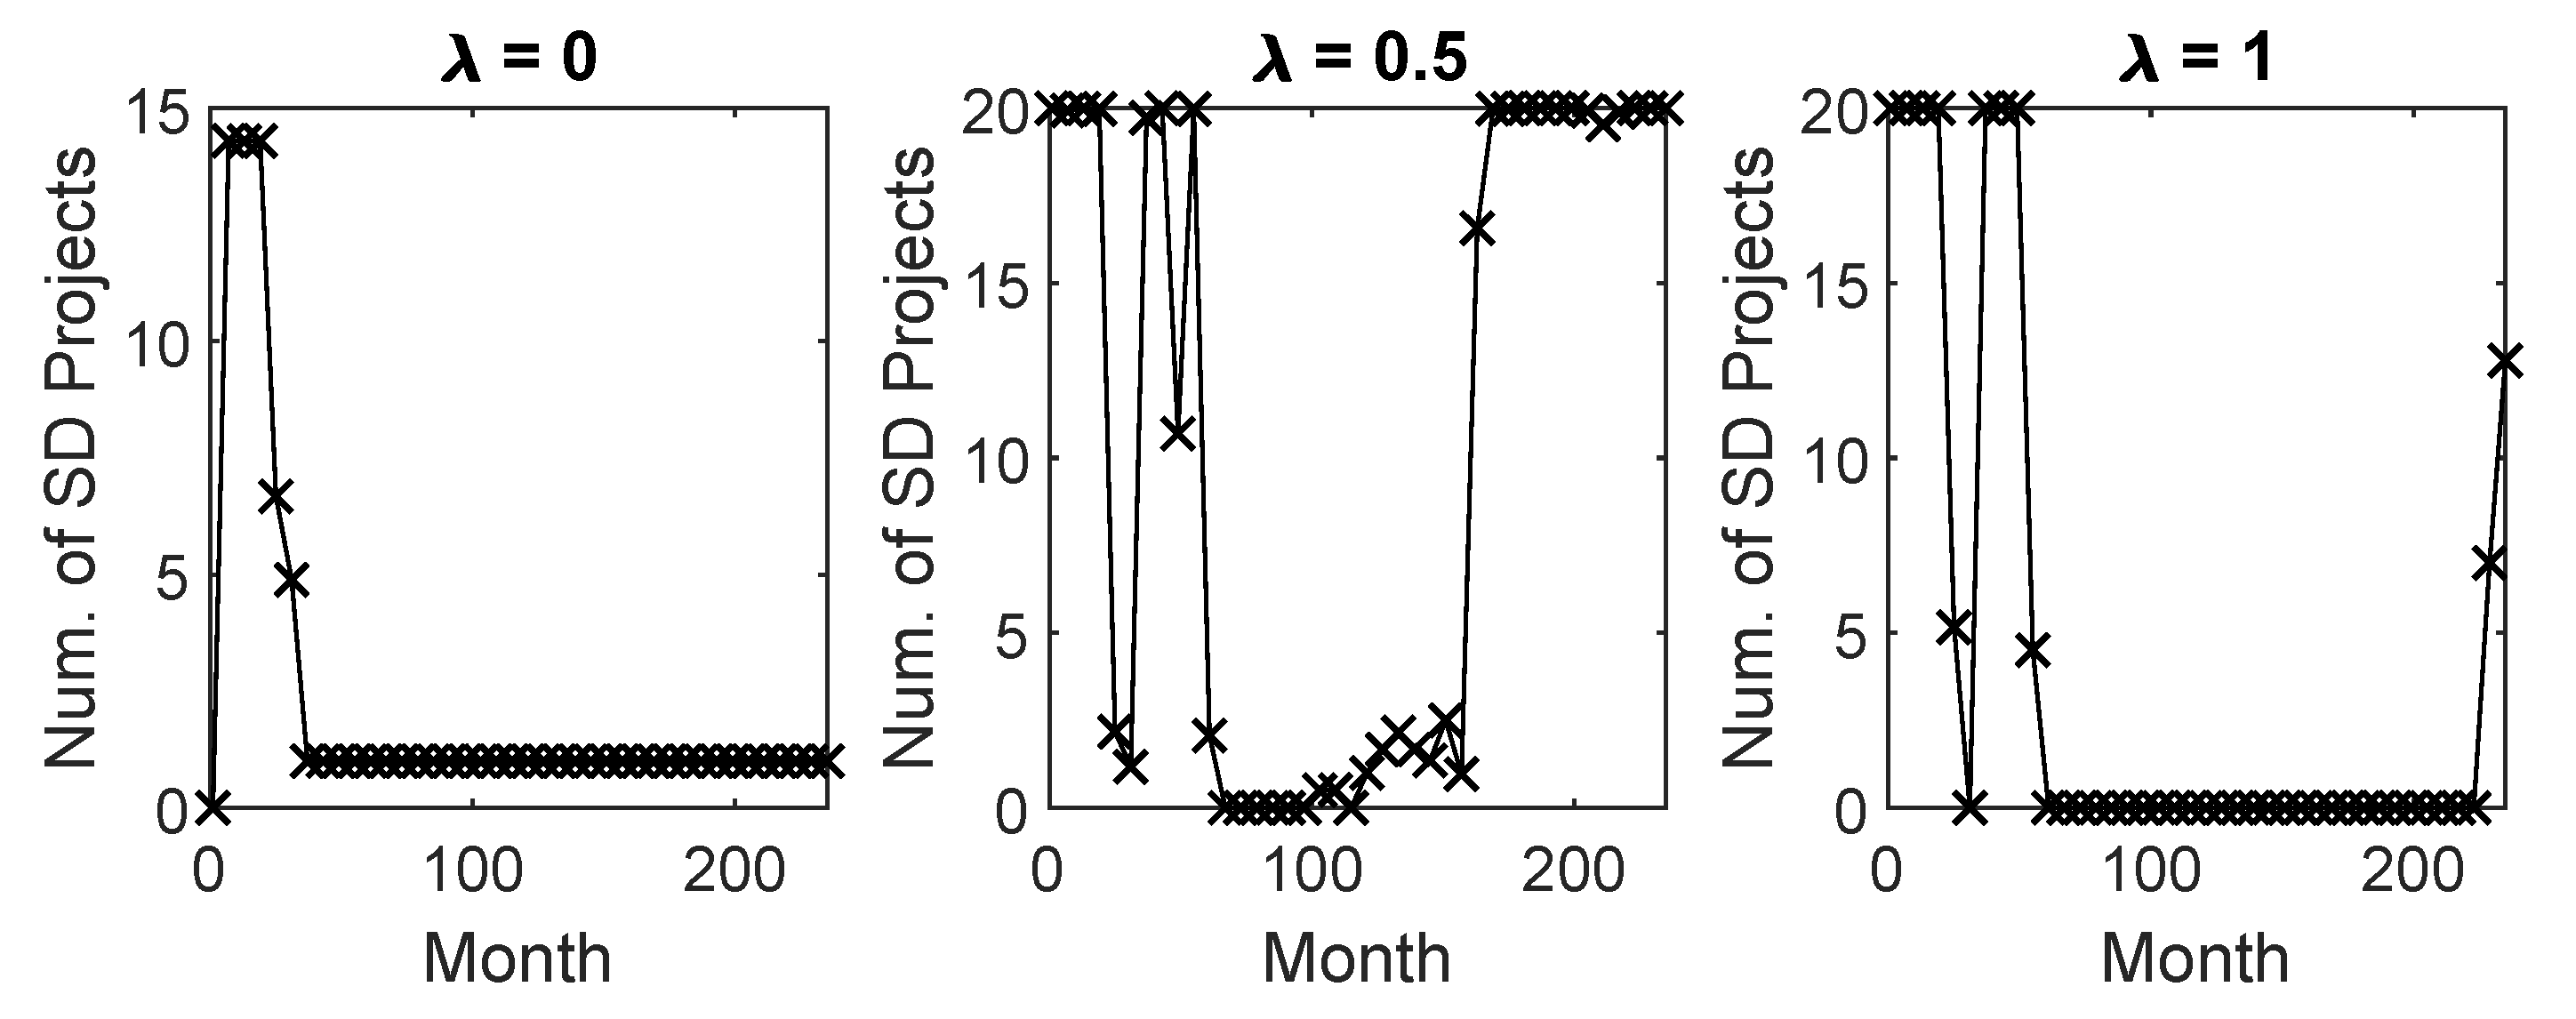
3.2. Evaluation of the Optimization Focus

The parameter X m λ highly influences the optimizer’s approaches. As described, it determines the mix of how strongly the optimizer focuses on maximizing the revenue or trust. Figure 5 displays the sum of revenue over the duration of the supplier development program for the first OEM with different settings of X m λ . The figure only shows the results for the automotive use-case to provide a realistic interpretation of the results. Nevertheless, the other scenario’s results show a similar structure. Moreover, we do not present the results for the second OEM as they show the exact same behavior. The figure shows that very low values for X m λ (high focus on maximizing the trust as given in Equation (8)) result in a strong loss of revenue.
This behavior can be explained by evaluating the terms of the cost function given in Equation (8). The first term evaluates the effects of the decision variable u on the revenue obtained by supplier development. The second term determines if the OEM should choose u so that it either increases or decreases the expected trust level. If X m λ shifts the focus towards either extreme, the other term gets ignored. In the case of a full focus on trust, this shift results in the optimizer ignoring the revenue gained by a sensible supplier development program.
Figure 6 shows the investment strategy of the OEM1 for X m λ = 0 , X m λ = 0.5 and X m λ = 1 . The figure shows that in the extreme case of X m λ = 0 , the OEM only invests in a single project each time instance to prevent its already high trust level from decaying. Comparing the cases of X m λ = 1 and X m λ = 0.5 , the figure shows that the case of only focusing on the revenue from the supplier development program leads to more instances in which the OEM invests in no or only very few projects. Consequently, the remaining numeric studies restrict X m λ to a range of 0.45–1.0 to avoid an excessive loss of revenue. Moreover, experiments only using a single value for X m λ select a balanced mix of both terms as X m λ = 0.5 .

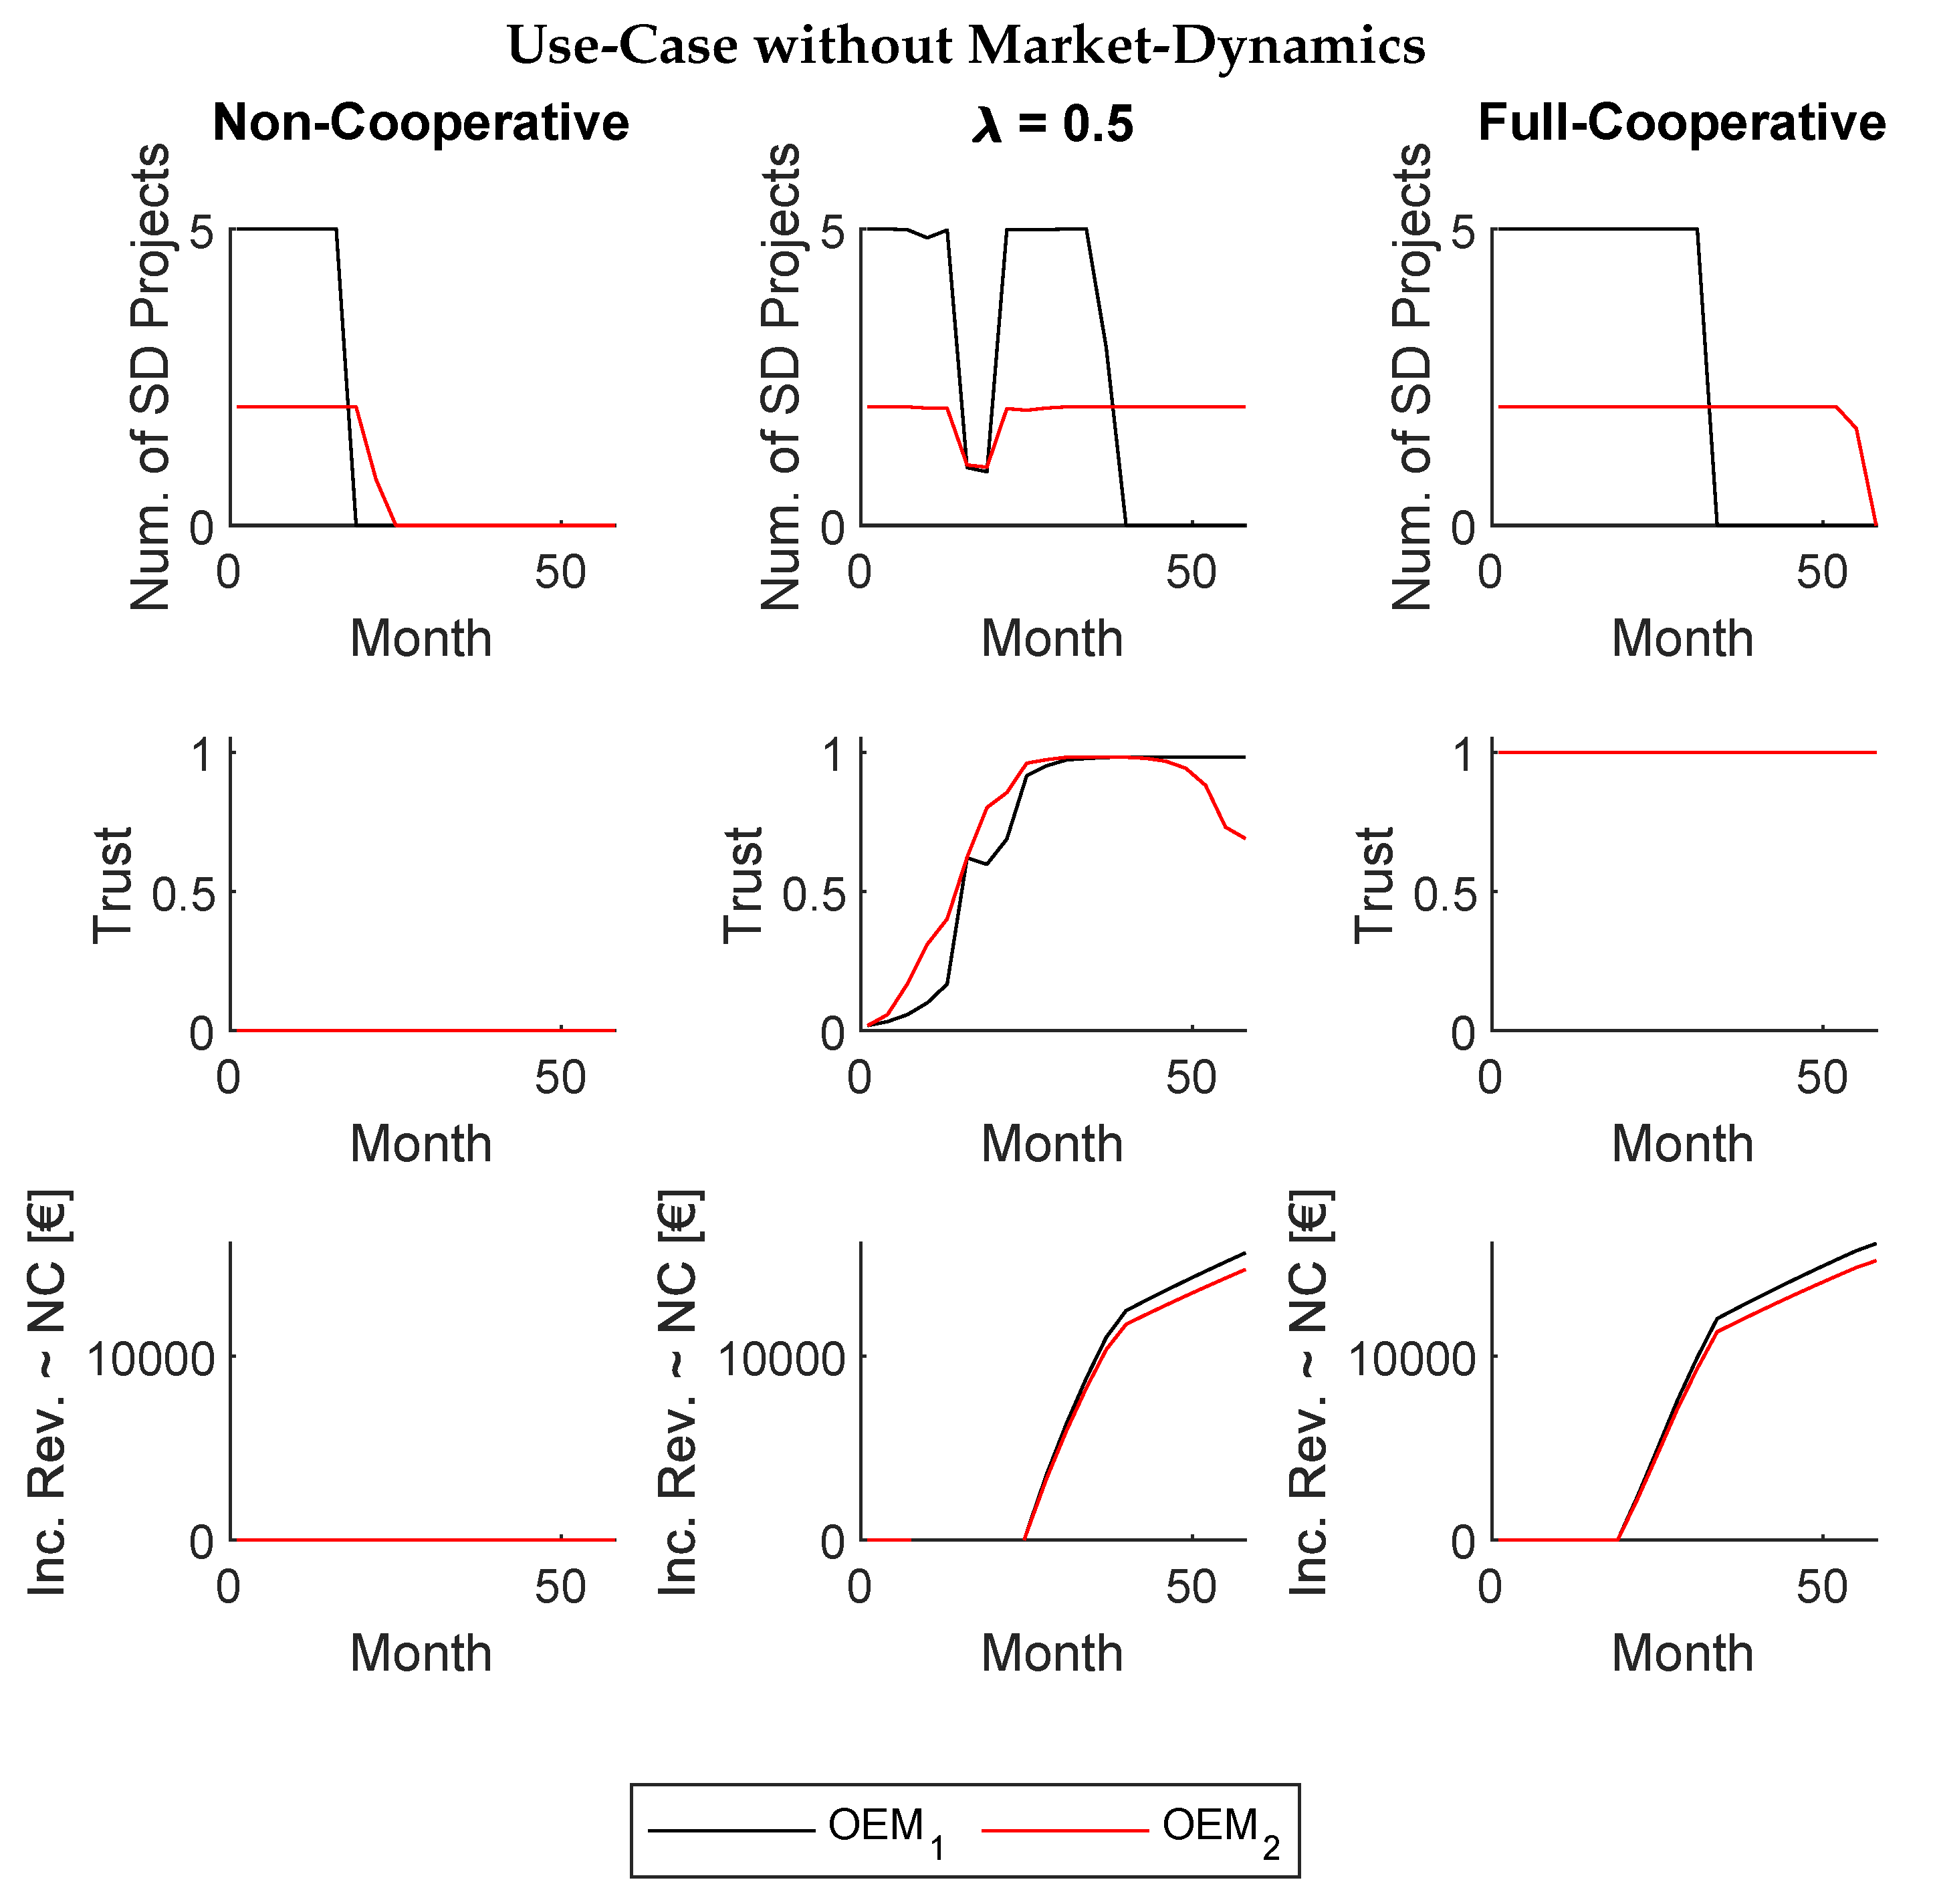
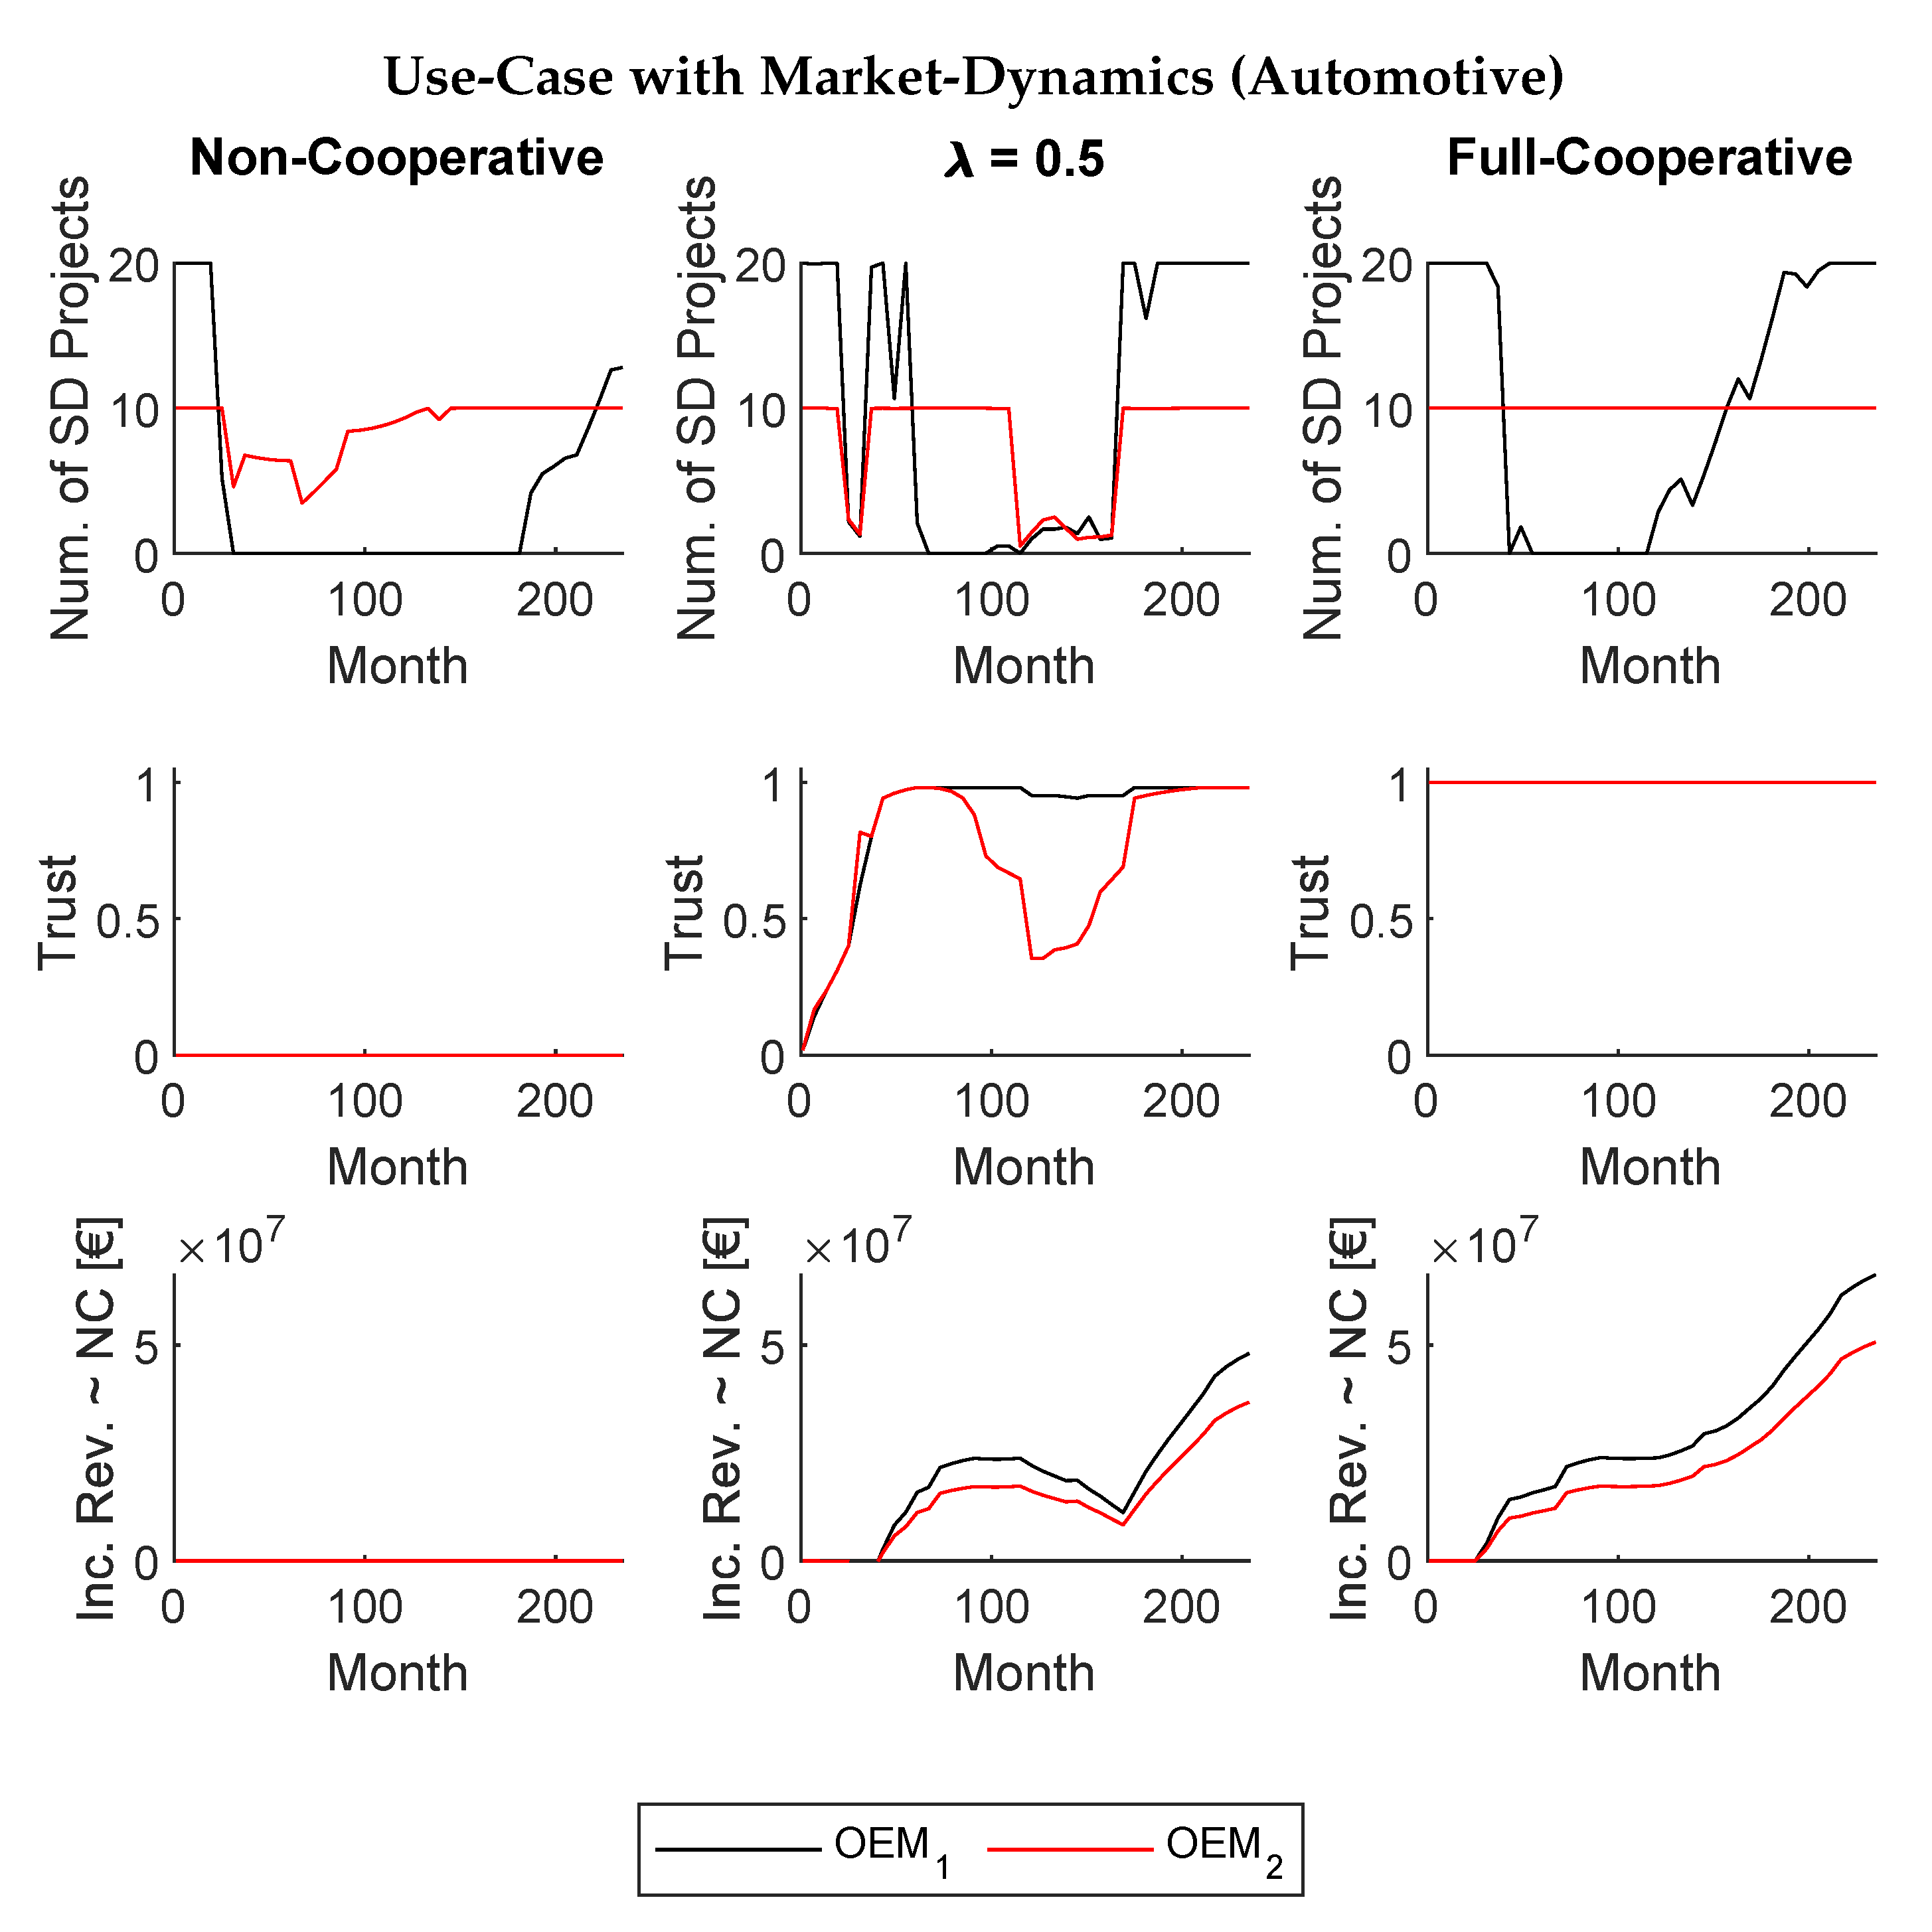
3.3. Comparison of Investment Strategies with and without Regarding Trust

The experiment presented in the previous subsection verified that a strictly non-cooperative setting denotes the lower limit of revenue. In contrast, a strictly full-cooperative setting denotes the upper bound as long the algorithm selects X m λ in a sensible range. This section discusses the behavior of the involved OEMs in terms of their investment strategy to provide more detailed insights into the results of the proposed model, i.e., in terms of the decision variable u, which shows the number of supplier development projects (Num. of SD Projects). Therefore, Figure 7 and Figure 8 show the behavior of each OEM at each time instance, the current trust level, and the increase in revenue compared to the non-cooperative baseline (Inc. Rev. ∼ NC [€]). The figures show the behavior in a strictly non-cooperative use-case, a use-case using the proposed models with X m λ = 0.5 , and a strictly full-cooperative use-case.
We studied the static used case to investigate the effect of trust in OEM partnerships without considering the dynamic effect of the market. The result of this static use case shows that, in a non-cooperative scenario, both OEMs stop investing after a short period since the two OEMs have no trust in each other and aim to maximize their own profits out of supplier development. In the case of X m λ = 0.5 , both OEMs tend to invest in supplier development projects for an extended period. This scenario clearly shows OEMs create trust between themselves over time, and this trust is sensitive to the partner investments, as shown in Figure 7, when OEM1 stops investing the trust level of OEM2 decrease accordingly. Furthermore, the increase in revenue compared to the non-cooperative scenario for the cases of X m λ = 0.5 and full-cooperative shows considerable growth over time.
We used the Mercedes-Benz A-Class as a sample product. To obtain the required time series, we used Mercedes’ annual list prices for new A-Classes in Germany since its introduction until now. The results of the effect of trust in a dynamic market for automotive use cases are shown in Figure 8. As can be seen in the non-cooperative scenario, OEM2 tends to invest more steadily and for a longer period than OEM1. In the case of X m λ = 0.5 , when OEM1 decreases the number of supplier development projects, OEM2s level of trust drops accordingly, this shows a similar behavior with the static use case. In addition, when OEM1 increases the number of investment projects, later on, the trust level of OEM2 improves. Moreover, the increase in revenue compared to the non-cooperative scheme is vastly higher for X m λ = 0.5 and the full-cooperative scenario. As expected, the scenario using trust shows a slight decrease in the revenue’s increase due to the lack of trust compared to the full cooperative scenario, peaking at around 180 months into the project. In general, this use-case shows that the proposed models represent the expected influence of trust quite well even under external market dynamics.

3.4. Dynamic Adaptation of the Optimization Focus

The previous subsection shows good results in terms of revenue and behavior if the proposed model chooses the collaboration scheme based on trust. Nevertheless, these results rely on a predetermined selection of the parameter X m λ , assuming a balanced focus on maximizing revenue and trust. This experiment evaluated two settings in which the algorithm also dynamically adapts this parameter based on the current trust of each partner. The first setting assumes that high trust induces a high focus on maintaining or increasing trust, while low trust implies that OEMs focus on their own revenue, as given in Equation (9). The second settings assume the opposite: low trust induces a high focus on building trust between partners, while a high level of trust leads a strong focus on each OEM’s own revenue, as given in Equation (10).
λ ( T ) = 0.45 + ( 1 0.45 ) · ( 1 T m )
λ ( T ) = 0.45 + ( 1 0.45 ) · T m
The algorithm updates the values for X m λ in each closed-loop iteration to react to the newly measured level of trust for each OEM. Thereby, both equations use the range determined in Section 3.2, i.e., [0.45; 1]. Figure 9 shows the difference in the sum of revenues in relation to the non-cooperative baseline. The x-axis depicts the different modes as non-cooperative, fixed-lambda, full cooperative, and for the automatic modes given as λ ( T ) for Equation (9) and λ ( T ) for Equation (10).
The figure shows that, in the use-case without market dynamics, both settings perform more or less equally well and only a little worse compared to the fixed setting. In the automotive use-case, the first setting performs well and results in higher revenues, even than the fixed-lambda scenario. In contrast, using the second setting λ ( T ) results in less revenue.

4. Conclusions

In the literature, trust is considered one of the main drivers in supply chain collaboration. This article proposes an MPC-based approach for the optimization of supplier development programs, focusing on the relationship between two different OEMs who invest in the same supplier. As trust remains a hard-to-model, abstract concept, the proposed approach breaks it down into eight relatively tangible factors derived from the literature. Furthermore, it aggregates these factors using a highly customizable function to allow users a proper adaptation to the actual use-case. Using the obtained value for trust, the model chooses a suitable collaboration scheme to optimize the transactions. For this task, the approach applies a fuzzy controller, which again is designed to be highly customizable to fit practitioners’ needs.
Based on the results, the proposed approach shows good behavior in terms of representing the effects of trust on the investment behavior of the optimized OEMs, even though this article only proposes some basic assumptions on how the OEMs’ decisions influence their mutual trust. As noted above, practitioners can easily adapt and extend these assumptions. In general, a suitable design of these rules can only be obtained by analyzing the needs, assumptions, and viewpoints of the involved companies, e.g., by conducting interviews or applying suitable quantification techniques. Nevertheless, even the base assumptions presented here show a reasonable development of trust and, accordingly, a suitable selection of collocation schemes. Moreover, the results show that the OEMs’ tendency to either build the trust or focus on the optimizing of their receptive revenue highly influences the overall outcome. Assuming a balanced tendency for the optimizer achieves the highest level of revenue, both for the individual OEMs and also globally in both use cases.
Future work will focus on obtaining more concrete base assumptions. Therefore, we will investigate the literature for more information on how certain actions influence trust. Moreover, additional collaboration schemes might be developed to allow for a broader and more realistic range of interactions the approach can pick from.

Author Contributions

Conceptualization, H.D.; methodology, H.D. and J.P.; software, H.D. and D.R.; validation, H.D.; formal analysis, H.D.; investigation, H.D. and D.R.; data curation, H.D.; writing—original draft preparation, H.D. and D.R.; writing—review and editing, J.P., K.-D.T., and M.F.; visualization, H.D.; supervision, J.P. and K.-D.T.; project administration, H.D.; and funding acquisition, H.D. All authors have read and agreed to the published version of the manuscript.

Funding

This research was supported by the Friedrich-Neumann-Stiftung für die Freiheit under grant No. ST8224/P612. The APC was funded by the Staats und Universitätsbilothek Bremen.

Conflicts of Interest

The authors declare no conflict of interest. The funders had no role in the design of the study; in the collection, analyses, or interpretation of data; in the writing of the manuscript, or in the decision to publish the results.

References

  1. Dastyar, H.; Pannek, J. Numeric Evaluation of Game-Theoretic Collaboration Modes in Supplier Development. Appl. Sci. 2019, 9, 4331. [Google Scholar] [CrossRef] [Green Version]
  2. Dastyar, H.; Rippel, D.; Freitag, M. Optimization of Supplier Development under Market Dynamics. Math. Probl. Eng. 2020. In Print. [Google Scholar] [CrossRef]
  3. Daudi, M. Trust in Sharing Resources in Logistics Collaboration. Ph.D. Thesis, Universität Bremen, Bremen, Germany, 2018. [Google Scholar]
  4. Chow, S.; Holden, R. Toward an understanding of loyalty: The moderating role of trust. J. Manag. Issues 1997, 9, 275–298. [Google Scholar]
  5. Möllering, G. Perceived trustworthiness and inter-firm governance: Empirical evidence from the UK printing industry. Camb. J. Econ. 2002, 26, 139–160. [Google Scholar] [CrossRef]
  6. Bolton, G.E.; Katok, E.; Ockenfels, A. How Effective Are Electronic Reputation Mechanisms? An Experimental Investigation. Manag. Sci. 2004, 50, 1587–1602. [Google Scholar] [CrossRef] [Green Version]
  7. Smith, J.B.; Barclay, D.W. The effects of organizational differences and trust on the effectiveness of selling partner relationships. J. Mark. 1997, 61, 3–21. [Google Scholar] [CrossRef]
  8. Doney, P.; Cannon, J. An examination of the nature of trust in buyer-seller relationship. J. Mark. 1997, 61, 35–51. [Google Scholar]
  9. Plank, R.E.; Reid, D.A.; Pullins, E.B. Perceived trust in business-to-business sales: A new measure. J. Pers. Sell. Sales Manag. 1999, 19, 61–71. [Google Scholar]
  10. Gassenheimer, J.B.; Manolis, C. The influence of product customization and supplier selection on future intentions: The mediating effects of salesperson and organizational trust. J. Manag. Issues 2001, 3, 418–435. [Google Scholar]
  11. Han, G.; Dong, M. Trust-embedded coordination in supply chain information sharing. Int. J. Prod. Res. 2015, 53, 5624–5639. [Google Scholar] [CrossRef]
  12. Talluri, S.; Narasimhan, R.; Chung, W. Manufacturer cooperation in supplier development under risk. Eur. J. Oper. Res. 2010, 207, 165–173. [Google Scholar] [CrossRef]
  13. Govindan, K.; Kannan, D.; Haq, A.N. Analyzing supplier development criteria for an automobile industry. Ind. Manag. Data Syst. 2010, 110, 43–62. [Google Scholar] [CrossRef]
  14. Bai, C.; Sarkis, J. Green supplier development: Analytical evaluation using rough set theory. J. Clean. Prod. 2010, 18, 1200–1210. [Google Scholar] [CrossRef]
  15. Wagner, S. A firm’s responses to dficient suppliers and competitive advantage. J. Bus. Res. 2006, 59, 686–695. [Google Scholar] [CrossRef]
  16. Krause, D.R. The antecedents of buying firms’ efforts to improve suppliers. J. Oper. Manag. 1999, 17, 205–224. [Google Scholar] [CrossRef]
  17. Li, H.; Wang, Y.; Yin, R.; Kull, T.J.; Choi, T.Y. Target pricing: Demand-side versus supply-side approaches. Int. J. Prod. Econ. 2012, 136, 172–184. [Google Scholar] [CrossRef]
  18. Wagner, S. Supplier development and the relationship life-cycle. Int. J. Prod. Econ. 2011, 129, 277–283. [Google Scholar] [CrossRef]
  19. Sánchez-Rodríguez, C.; Hemsworth, D.; Martínez-Lorente, A.R. The effect of supplier development initiatives on purchasing performance: A structural model. Supply Chain Manag. Int. J. 2005, 10, 289–301. [Google Scholar] [CrossRef]
  20. Krause, D.R.; Handfield, R.B.; Tyler, B.B. The relationships between supplier development, commitment, social capital accumulation and performance improvement. J. Oper. Manag. 2006, 25, 528–545. [Google Scholar] [CrossRef]
  21. Bai, C.; Sarkis, J. Supplier development investment strategies: A game theoretic evaluation. Ann. Oper. Res. 2014, 240, 583–615. [Google Scholar] [CrossRef]
  22. Parsons, S.; Wooldridge, M. Game Theory and Decision Theoryin Multi-Agent Systems. Auton. Agents Multi-Agent Syst. 2002, 5, 243–254. [Google Scholar] [CrossRef]
  23. Spekman, R.E.; Davis, E.W. The Extended Enterprise: Gaining Competitive Advantage Through Collaborative Supply Chains; Prentice Hall PTR: Upper Saddle River, NJ, USA, 2003. [Google Scholar]
  24. Chopra, S.; Meindl, P. Supply Chain Management: Strategy, Planning, and Operation (4th Global); Prentice Hall PTR: Upper Saddle River, NJ, USA; Pearson: Upper Saddle River, NJ, USA, 2010. [Google Scholar]
  25. Cummings, L.; Bromiley, P. The Organizational Trust Inventory (OTI): Development and Validation. In Trust in Organizations: Frontiers of Theory and Research; Kramer, R., Tyler, T., Eds.; SAGE Publications, Inc.: Thousand Oaks, CA, USA, 1996; pp. 302–330. [Google Scholar] [CrossRef]
  26. Schoorman, F.D.; Mayer, R.C.; Davis, J.H. An Integtative Model of Organizational Trust: Past, Present, and Future. Acad. Manag. Rev. 2007, 32, 344–354. [Google Scholar] [CrossRef] [Green Version]
  27. Msanjila, S.S.; Afsarmanesh, H. Trust analysis and assessment in virtual organization breeding environments. Int. J. Prod. Res. 2008, 46, 1253–1295. [Google Scholar] [CrossRef]
  28. Ha, B.; Park, Y.; Cho, S. Suppliers’ affective trust and trust in competency in buyers. Int. J. Oper. Prod. Manag. 2011, 31, 56–77. [Google Scholar] [CrossRef]
  29. McAllister, D.J. Affect- and Cognition-based Trust as Foundations for Interpersonal Cooperation in Organizations. Acad. Manag. J. 1995, 38, 24–59. [Google Scholar]
  30. Tzafrir, S.; Dolan, S.L. Trust Me: A Scale for Measuring Manager-Employee Trust. Manag. Res. J. Iberoam. Acad. Manag. 2004, 2, 115–132. [Google Scholar] [CrossRef]
  31. Morgan, R.M.; Hunt, S.D. The Commitment-Trust Theory of Relationship Marketing. J. Mark. 1994, 58, 20. [Google Scholar] [CrossRef]
  32. Smith, G. How to achieve organizational trust within an accounting department. Manag. Audit. J. 2005, 20, 520–523. [Google Scholar] [CrossRef]
  33. Moberg, C.R.; Speh, T.W. Evaluating the Relationship between Queationable Practices and the Strength of Supply Chain Relationships. J. Bus. Logist. 2003, 24, 1–19. [Google Scholar] [CrossRef]
  34. Rinehart, L.M.; Eckert, J.A.; Handfield, R.B.; Page, T.J. An assessment of supplier-customer relationships. J. Bus. Logist. 2004, 25, 25–62. [Google Scholar] [CrossRef]
  35. Park, M.; Park, S.; Mele, F. Modeling of Purchase and Sales Contracts in Supply Chain Optimization. Ind. Eng. Chem. Res. 2006, 45, 5013–5026. [Google Scholar] [CrossRef] [Green Version]
  36. Laeequddin, M.; Sahay, B.S.; Sahay, V.; Waheed, K.A. Measuring trust in supply chain partners’ relationships. Meas. Bus. Excell. 2010, 14, 53–69. [Google Scholar] [CrossRef]
  37. Skandrani, H.; Triki, A.; Baratli, B. Trust in supply chains, meanings, determinants and demonstrations. Qual. Mark. Res. Int. J. 2011, 14, 391–409. [Google Scholar] [CrossRef]
  38. Tejpal, G.; Garg, R.K.; Sachdeva, A. Trust among supply chain partners: A review. Meas. Bus. Excell. 2013, 17, 51–71. [Google Scholar] [CrossRef]
  39. Hudnurkar, M.; Jakhar, S.; Rathod, U. Factors Affecting Collaboration in Supply Chain: A Literature Review. Procedia-Soc. Behav. Sci. 2014, 133, 189–202. [Google Scholar] [CrossRef] [Green Version]
  40. Ouzrout, Y.; Chaze, L.; Lavastre, O.; Dominguez, C.; Akhter, S.H. Simulation of Trust in Supply Chains. In Supply Chain Performance; John Wiley & Sons, Inc.: Hoboken, NJ, USA, 2013; pp. 267–315. [Google Scholar] [CrossRef]
  41. Wang, X.; Kopfer, H. Increasing Efficiency of Freight Carriers through Collaborative Transport Planning: Chances and Challenges. In Dynamics and Sustainability in International Logistics and Supply Chain Management; Ivanov, D., Kopfer, H., Haasis, H.D., Schönberger, J., Eds.; Cuvillier: Gottingen, Germany, 2011; pp. 41–50. [Google Scholar]
  42. Jeng, D.J.; Mortel, C.H.A. Impact of trust, asset specificity, and environmental uncertainty on manufacturing collaborative processes. In Proceedings of the 40th International Conference on Computers Indutrial Engineering, Awaji, Japan, 25–28 July 2010; pp. 1–7. [Google Scholar] [CrossRef]
  43. Kwon, I.G.; Suh, T. Trust, commitment and relationships in supply chain management: A path analysis. Supply Chain Manag. Int. J. 2005, 10, 26–33. [Google Scholar] [CrossRef]
  44. Jones, S.L.; Fawcett, S.E.; Wallin, C.; Fawcett, A.M.; Brewer, B.L. Can small firms gain relational advantage? Exploring strategic choice and trustworthiness signals in supply chain relationships. Int. J. Prod. Res. 2014, 52, 5451–5466. [Google Scholar] [CrossRef]
  45. Wu, I.L.; Chuang, C.H.; Hsu, C.H. Information sharing and collaborative behaviors in enabling supply chain performance: A social exchange perspective. Int. J. Prod. Econ. 2014, 148, 122–132. [Google Scholar] [CrossRef]
  46. Cao, M.; Zhang, Q. Supply chain collaboration: Impact on collaborative advantage and firm performance. J. Oper. Manag. 2010, 29, 163–180. [Google Scholar] [CrossRef]
  47. Cruijssen, F. Horizontal Cooperation in Transport and Logistics. Ph.D. Thesis, Universiteit van Tilburg, Warandelaan, The Netherlands, 2006. [Google Scholar]
  48. Xu, X. Collaboration Mechanism in Horizontal Logistics Collaboration. Ph.D. Thesis, L’École Nationale Supérieure des Mines de Paris, Paris, France, 2013. [Google Scholar]
  49. Chen, J.V.; Yen, D.C.; Rajkumar, T.M.; Tomochko, T.M. The antecedent factors on trust and commitment in supply chain relationships. Comput. Stand. Interfaces 2011, 33, 262–270. [Google Scholar] [CrossRef]
  50. Yin, M.; Zhao, S. Information sharing as antecedent of dynamic trust and cooperation intention in supply chain: Evidence from China. In Proceedings of the 2008 International Conference on Management Science and Engineering 15th Annual Conference Proceedings, Long Beach, CA, USA, 10–12 September 2008; pp. 298–305. [Google Scholar] [CrossRef]
  51. Su, Q.; Song, Y.; Li, Z.; Dang, J. The impact of supply chain relationship quality on cooperative strategy. J. Purch. Supply Manag. 2008, 14, 263–272. [Google Scholar] [CrossRef]
  52. Min, S.; Mentzer, J.T. Developing and measuring supply chain management concepts. J. Bus. Logist. 2004, 25, 63–99. [Google Scholar] [CrossRef]
  53. Child, J. Trust—The fundamental bond in global collaboration. Organ. Dyn. 2001, 29, 274–288. [Google Scholar] [CrossRef]
  54. Lewicki, R.L.; Bunker, B.B. Developing and Maintaining Trust in Work Relationships. In Trust in Organizations: Frontiers of Theory and Research; Kramer, R., Tyler, T., Eds.; SAGE Publications, Inc.: Thousand Oaks, CA, USA, 1996; pp. 114–139. [Google Scholar] [CrossRef]
  55. Whitener, E.M.; Brodt, S.E.; Korsgaard, M.A.; Werner, J.M. Managers as Initiators of Trust: An Exchange Relationship Framework for Understanding Managerial Trustworthy Behavior. Acad. Manag. Rev. 1998, 23, 513. [Google Scholar] [CrossRef] [Green Version]
  56. Rousseau, D.M.; Sitkin, S.B.; Burt, R.S.; Camerer, C.F. Not So Different After All: A Cross-discipline View of Trust. Acad. Manag. Rev. 1998, 23, 393–404. [Google Scholar] [CrossRef]
  57. Daudi, M.; Hauge, J.B.; Thoben, K.D. Behavioral factors influencing partner trust in logistics collaboration: A review. Logist. Res. 2016, 9, 19. [Google Scholar] [CrossRef] [Green Version]
  58. Mayer, R.C.; Davis, J.H.; Schoorman, F.D. An integrative model of organizational trust. Acad. Manag. Rev. 1995, 32, 709–734. [Google Scholar] [CrossRef]
  59. Comer, J.M.; Plank, R.E.; Reid, D.A.; Pullins, E. Methods in Sales Research: Perceived Trust in Business-to-Business Sales: A New Measure. J. Pers. Sell. Sales Manag. 2013, 19, 61–71. [Google Scholar]
  60. De Silva, C.W. Intelligent Control - Fuzzy Logic Applications; CRC Press: Boca Raton, FL, USA, 2018. [Google Scholar]
  61. Proch, M.; Worthmann, K.; Schlüchtermann, J. A negotiation-based algorithm to coordinate supplier development in decentralized supply chains. Eur. J. Oper. Res. 2017, 256, 412–429. [Google Scholar] [CrossRef] [Green Version]
  62. Statistisches Bundesamt Deutschland. DE STATIS. GENESIS-Online Datenbank. Available online: https://www-genesis.destatis.de/genesis/online (accessed on 5 March 2020).
Figure 1. General structure of the optimization model (numbered 1–6) and the integrated steps of the trust model.
Processes 08 00300 g001
Figure 2. Function to quantify trust using the normalized sum over the trust factors in the current system state using different values for k.
Processes 08 00300 g002
Figure 3. Membership functions for the inputs T (a) and the output scenario (b).
Processes 08 00300 g003
Figure 4. Mapping of T m to collaboration schemes (a) and resulting surface for the fuzzy controller (b).
Processes 08 00300 g004
Figure 5. Sum of revenue for different values of X 1 λ .
Processes 08 00300 g005
Figure 6. Number of projects M1 invested in supplier development for different settings of X 1 λ .
Processes 08 00300 g006
Figure 7. Result of trust effects in non-dynamic market use-case.
Processes 08 00300 g007
Figure 8. Result of trust effects in dynamic market (automotive) use-case.
Processes 08 00300 g008
Figure 9. Sum of revenue for both OEMs in both use-cases normalized to the non-cooperative scheme.
Processes 08 00300 g009
Table 1. Literature review on factors influencing trust in manufacturer/supplier relationships.
Trust Factors
Dynamic FactorsStatic Factors
Benevolence [6,25,26,27,28]Ability [28,29,30]
Honesty [8,28,31,32,33,34,35]Capability [3,36,37,38]
Opportunism [3,38,39,40,41]Asset specificity [3,42,43]
Commitment [3,36,37,40,44,45]Incentive alignment [3,41,46,47,48]
Information sharing [3,37,43,45,49,50]Bargaining power [43,44,47,48]
Communication [3,46,51]Satisfaction with know-how/specialties [8,34,35]
Joint knowledge creation [3,46]Unique knowledge/skills in business [8,33,35,52,53]
Openness [8,33,34,35]Reputation [35]
Positive mutual understanding [8,33,35,54]Historical transaction [35]
Respect [8,35,52,55]Emotions [35]
Information mismatch [37,43,45,49,50]Experiences [35]
Cognition from trustor [35]
Table 2. Parameters and variables used in this article.
Indices with i , n , m N +
iIndex used for time instances
nIndex used for sampling instances
mIndex of OEM
Parameter sets used in the optimization (please refer to Table 3 for an in-depth description)
S D Contains parameters relating to the supplier development
RContains static trust factors
Δ Contains dynamic trust factors
O L Contains parameters used by the open-loop’s prediction modes to estimate trust and its effects
General parameters
TSampling step size for the MPC algorithm given in months with T N +
PNumber of periods regarded in the MPC’s open-loop optimization with P N +
NPrediction horizon of the MPC’s open-loop optimization given as N = P * T
X n State Vector X = S D R Δ O L
T m Trust that OEMm places in its partner. with T R + ; 0 T m 1
Parameters used for state updates (all in R + )
m o d e x p Increase or decrease of the factor experience during the closed-loop state update
m o d o p p Increase or decrease of the factor opportunism during the closed-loop state update
m o d m i s Increase or decrease of the factor information mismatch during the closed-loop state update
m o d e x p * Increase or decrease of the trust level during the open-loop state update due to experience
m o d o p p * Increase or decrease of the trust level during the open-loop state update due to opportunism
m o d m i s * Increase or decrease of the trust level during the open-loop state update due to information mismatch
Parameters used in the cost function
a m Customer’s willingness-to-pay for the product of OEMm with a m R +
c m S D Cost for supplier development projects of OEMm with c m S D R +
c m OEMm’s production cost with c m R +
c m s Supplier’s production cost related to the product of OEMm with c m s R +
b m Price elasticity chosen by OEMm with b m R +
rSupplier’s revenue for OEMm’s product with r R +
lSupplier’s learning rate with l R
Decision variables
u m Optimal control sequence of length P obtained by the open-loop simulation for OEMm
Table 3. Parameters contained in the state vector X.
VariableSubsetDescription
X m P r o j e c t S D Sum of supply development projects conducted by OEM with index m
X m R e p u t a t i o n RReputation of the other OEM as perceived by OEM with index m
X m H i s t o r y RTransaction history of the other OEM as perceived by OEM with index m
X m S p e c i f i c i t y RAsset specificity of the other OEM as perceived by OEM with index m
X m C o m m i t m e n t RCommitment of the other OEM as perceived by OEM with index m
X m E x p e r i e n c e Δ Short-term experience with the other OEM as perceived by OEM m
X m M i s m a t c h Δ Information mismatch with the other OEM as perceived by OEM m
X m S h a r i n g Δ Tendency to share information by the other OEM as perceived by OEM m
X m O p p o r t u n i s m Δ Opportunism of the other OEM as perceived by OEM m
X m E s t T O L Expected trust scenario for OEMs used in the open-loop’s prediction models
X m M i n R e v O L Expected minimal revenue obtained by not collaborating for OEMs used in the open-loop’s prediction models
X m M a x R e v O L Expected maximum revenue obtained by fully collaborating for OEMs used in the open-loop’s prediction models
X m λ O L Weighting factor between maximizing revenue or trust in the open-loop’s prediction models
Table 4. Scenarios used in the evaluation.
No Market DynamicsAutomotive
ParameterOEM1OEM2OEM1OEM2
Sampling Step Size3 month6 month
Prediction Horizon15*3 = 45 month9*6 = 54 month
Program Duration20*3 = 60 month40*6 = 240 month
a20020010,00010,000
c S D 750065003,000,0002,000,000
b0.010.010.010.01
c m 657045005400
c s 10011040503240
r1015450360
l−0.1−0.1−0.1−0.1
p m a x 522010

